Article

Modeling Threat Evolution in Smart Grid Near-Field Networks

State Grid Jiangsu Electric Power Co., Ltd., Research Institute, Nanjing 211103, China
*
Author to whom correspondence should be addressed.
Electronics 2025, 14(13), 2739; https://doi.org/10.3390/electronics14132739
Submission received: 15 May 2025 / Revised: 29 June 2025 / Accepted: 4 July 2025 / Published: 7 July 2025
(This article belongs to the Topic Power System Protection)

Abstract

In recent years, near-field networks have become a vital part of smart grids, raising growing concerns about their security. Studying threat evolution mechanisms is key to building proactive defense systems, while early identification of threats enhances prediction and precision. Unlike traditional networks, threat sources in power near-field networks are highly dynamic, influenced by physical environments, workflows, and device states. Existing models, designed for general network architectures, struggle to address the deep cyber-physical integration, device heterogeneity, and dynamic services of smart grids, especially regarding physical-layer impacts, cross-system interactions, and proprietary protocols. To overcome these limitations, this paper proposes a threat evolution framework tailored to smart grid near-field networks. A novel semi-physical simulation method is introduced, combining traditional Control Flow Graphs (CFGs) for open components with real-device interaction to capture closed-source logic and private protocols. This enables integrated cyber-physical modeling of threat evolution. Experiments in realistic simulation scenarios validate the framework’s accuracy in mapping threat propagation, evolution patterns, and impact, supporting comprehensive threat analysis and simulation.

1. Introduction

The security of near-field networks holds significant importance. As the foundational layer for device-level interactions, the reliability of near-field communication networks directly impacts the accuracy of critical parameter measurements, the real-time responsiveness of control actions, and the fault tolerance of the overall power system. Once exploited, threat sources within near-field networks may lead to device malfunctions, power outages, or even large-scale cascading failures [1]. Existing studies have shown that attackers can exploit cyber-physical coupling vulnerabilities in edge devices such as Data Concentrator Units (DCUs) and Feeder Terminal Units (FTUs) to launch penetration attacks [2,3]. These attacks can induce equipment-level anomalies such as voltage flicker and frequency instability, and, through the cascading effects of secondary communication protocols, trigger system-level failures including protection misoperations and voltage collapse [4], ultimately degrading the reliability of regional power distribution networks [5]. Prior work has thoroughly revealed the risks posed by such distributed energy infiltration attacks.
In addition to network-level threat modeling, a growing body of research has focused on resilient control strategies at the system level to counter cyber–physical attacks. For instance, resilient model predictive control (MPC) approaches have been developed to defend against false data injection (FDI) and deception attacks in critical infrastructures. These include resilient predictive control schemes for cyber–physical systems [6], self-triggered MPC for discrete-time nonlinear systems under attack, and adaptive input reconstruction-based MPC methods. While these works provide strong defenses at the control logic and actuator levels, they generally rely on predefined threat models and do not address the evolving nature of multi-stage threats. Our proposed work complements these efforts by focusing on dynamic threat propagation modeling at the communication and logic-flow levels, enabling earlier detection and more informed control-level responses.
The security of Smart Grids (SGs) relies heavily on the robustness of core components, including edge devices, terminal units, and local communication protocols. These components form the foundation of near-field networks, supporting key functions such as real-time data exchange, monitoring, and control. However, their distributed and interconnected nature introduces diverse and complex security threats. Threat modeling in smart grid near-field networks is challenged by three core complexities: (1) Heterogeneous devices and protocol environments [7]: Devices such as smart meters, distributed energy controllers, and intelligent switches from various vendors utilize a wide range of communication protocols (e.g., HPLC, ZigBee). Their closed-source firmware and proprietary logic hinder the ability of traditional Control Flow Graphs (CFGs) to comprehensively model inter-device interactions. (2) Cyber-physical coupling constraints [8]: The interplay between physical system parameters (e.g., voltage fluctuation thresholds, switching sequences) and information security introduces complex cross-domain risks. For example, attackers may tamper with data to trigger misoperation of relay protection, potentially leading to system instability—an impact difficult to capture with conventional information security models. (3) Dynamism and uncertainty: Real-time variations in operational processes (e.g., load transfer, backup power switching) and device states (e.g., charging/discharging modes of energy storage systems) make threat propagation paths highly unpredictable. For instance, a photovoltaic inverter may reduce its encryption strength during nighttime backup mode, exposing it to man-in-the-middle attacks [9].
Existing threat modeling approaches mainly rely on pure software simulation or real-world testing, both of which have significant limitations. Software-based simulations often fail to accurately replicate the dynamic behavior of physical devices, especially under abnormal conditions [10,11]. On the other hand, conducting threat tests directly in live power grid environments poses unacceptable risks of system-wide failures [12]. Consequently, neither approach is suitable for comprehensive threat evolution research in smart grid near-field networks.
To address the aforementioned challenges, this paper proposes the first threat evolution framework tailored to near-field networks in smart grids. The concept of threat evolution reveals both the topological propagation paths and the progression patterns of threats. The core innovation of the framework lies in a novel Control Flow Graph (CFG) construction method based on semi-physical simulation. By integrating real physical devices with virtual simulation environments, this approach enables controlled emulation of near-field network operations and business processes, achieving high-fidelity modeling and analysis of physical-layer behavior, device interactions, and data flow trajectories. This paper not only introduces the theoretical foundation of the framework but also validates its effectiveness through practical deployment and experimental evaluation. The key contributions are as follows:
  • A semi-physical simulation-based CFG construction method is proposed. By combining traditional CFG modeling with physical simulation, the method addresses challenges related to heterogeneous devices, closed-source firmware, and proprietary protocols, providing a precise representation of threat paths in complex scenarios such as smart grids.
  • A CFG-based threat evolution modeling approach is developed. It uncovers the topological propagation paths and evolution patterns of threats, and it enables quantitative analysis and prediction of propagation trends and critical nodes.
  • Experimental validation is conducted to demonstrate the effectiveness of the proposed CFG construction and threat modeling approach. The results show that the method accurately captures threat propagation paths, offering a practical analytical tool for security defense in smart grid near-field networks.
The remainder of this paper is organized as follows. Section 2 reviews the related work on near-field networks, control flow graph modeling, and threat modeling in smart grid systems. Section 3 presents the proposed framework, including the overall architecture, semi-physical CFG construction, and threat evolution modeling based on the BA and SIR models. Section 4 details the experimental setup, simulation scenarios, and evaluation results. Section 5 concludes this paper and outlines future directions.

2. Related Work

2.1. Near Field Network

The near-field network in smart grids refers to the access communication network that connects end-user business terminals with edge aggregation nodes [13]. It is typically categorized into several types, including distribution services, marketing services, transmission and transformation services, and infrastructure security or other related services [14]. Primarily serving as the local access layer for business terminals, these networks are currently planned, constructed, and maintained independently by various departments according to their specific operational needs. A wide range of communication technologies are employed, such as Power Line Carrier (PLC), Long Range Radio (LoRa), Wireless Fidelity (WiFi), low-power wireless communication, Near Field Communication (NFC), and Radio Frequency Identification (RFID) [15]. In this context, the “edge” refers to edge computing nodes located near terminal devices or data sources, providing localized intelligent decision-making and services. The “terminal” represents the core component of state perception and control execution in the architecture of the power Internet of Things (IoT). These terminal units, equipped with micro-sensing and chip-level technologies, are responsible for monitoring, collecting, and perceiving fundamental data related to power distribution equipment, environmental conditions, operational status, and electrical parameters. Furthermore, terminals serve as the final actuators for protection and control operations within the power grid, ensuring secure and stable system performance. As such, they form both the foundation of the power IoT and the critical execution layer for maintaining its secure operation.
The primary security risks in smart grid near-field networks span multiple dimensions and are summarized as follows: (1) Network-layer vulnerabilities: including distributed denial-of-service (DDoS) attacks and insecure communication protocols [16,17]; (2) Device-layer threats: such as system and component-level security flaws, hardware vulnerabilities, and the presence of malicious backdoors [18]; (3) Application-layer issues: including software code vulnerabilities, risks associated with unencrypted data transmission, insufficient protection of private data, lack of security auditing, and insecure application programming interfaces (APIs) [1,19,20,21]. These risks are highly interdependent, forming a complex and interconnected threat landscape that poses multifaceted challenges to the security of near-field networks.
Previous studies on near-field networks (NFNs) in smart grids have mainly focused on communication architectures, protocol standardization, and performance optimization [7,13]. While these efforts have laid the groundwork for reliable NFN deployment, they typically lack formal modeling of dynamic threat propagation or multi-layer interactions. For example, many works treat NFNs as static topologies or simplify device behavior into abstract models, which limits their ability to capture evolving cyber–physical threats. Moreover, the heterogeneity of terminal devices and the prevalence of proprietary protocols in NFNs present significant challenges to traditional simulation-based or analytical models. These limitations highlight the need for a modeling framework that can dynamically represent both control flow logic and device-specific behavior across layers, motivating our proposed semi-physical CFG-based threat evolution method.

2.2. Control Flow Graph

Control Flow Graphs (CFGs) [22] are formal models extensively applied in program analysis and optimization. Each CFG comprises nodes representing basic blocks—sequences of instructions without internal branches—and edges denoting control flow transitions such as conditional branches, loops, or function calls. Beyond traditional uses in static analysis, compiler design, and system simulation [23,24], CFGs have recently found applications in power systems, including modeling the data acquisition behavior of edge devices, optimizing protocol parsing paths, and supporting fault diagnosis via execution path comparison.
In the field of software security, CFGs offer distinct advantages for representing program logic and identifying abnormal behavior. Prior work has utilized structural and semantic characteristics of CFGs to improve the accuracy and efficiency of vulnerability detection [25,26]. Techniques such as semi-parsing have been introduced to construct tailored CFGs for legacy systems, enabling efficient logic extraction for critical business processes. However, these approaches are generally limited to open-source environments and are ill-suited for closed-source protocols and the cyber-physical interdependencies prevalent in smart grid systems [27]. In IoT security, CFG-based models have been applied to malware detection by capturing control flow features and integrating them with machine learning methods [28]. Nevertheless, these models often assume homogeneous and relatively simple device environments, lacking the flexibility to handle the complexity and heterogeneity of smart grid deployments [29].
Despite growing adoption, existing CFG-based methods face considerable limitations in addressing the unique challenges of smart grid near-field networks. Accurate modeling of physical-layer device behavior remains difficult due to the diversity of hardware architectures, the intractable space of possible state transitions, and the complex, often opaque, interaction mechanisms between physical components. In addition, current CFGs struggle to represent the collaborative and dynamic nature of threat evolution, where inter-device dependencies, environmental influences, and temporal factors play significant roles. Moreover, smart grid threats frequently propagate across physical, network, and application layers, yet traditional CFGs lack the ability to trace such cross-layer flows due to inconsistent abstraction models, data transformations, and hidden control paths. These challenges underscore the need for enhanced CFG modeling frameworks capable of capturing physical–logical mappings, dynamic interactions, and multi-layered propagation mechanisms inherent in cyber-physical power systems.

3. Methods

This section proposes a threat source evolution analysis framework tailored for near-field networks, which overcomes the limitations of traditional control flow graphs (CFGs) in behavior modeling through semi-physical simulation techniques. The framework establishes a dynamic and interactive analytical system across three dimensions: structure, behavior, and state. At the structural modeling level, a semi-physical CFG construction method is introduced, which integrates physical and protocol emulation to achieve high-fidelity reconstruction of hardware behaviors and communication logic. At the behavior and state evolution levels, the framework incorporates complex network theory and propagation dynamics models. By integrating CFG topological evolution (based on the Barabási–Albert model), threat propagation paths (via the Susceptible–Infectious–Recovered model), and dynamic reconfiguration mechanisms, it enables quantitative analysis of threat diffusion pathways and identification of critical nodes.

3.1. Overall Framework

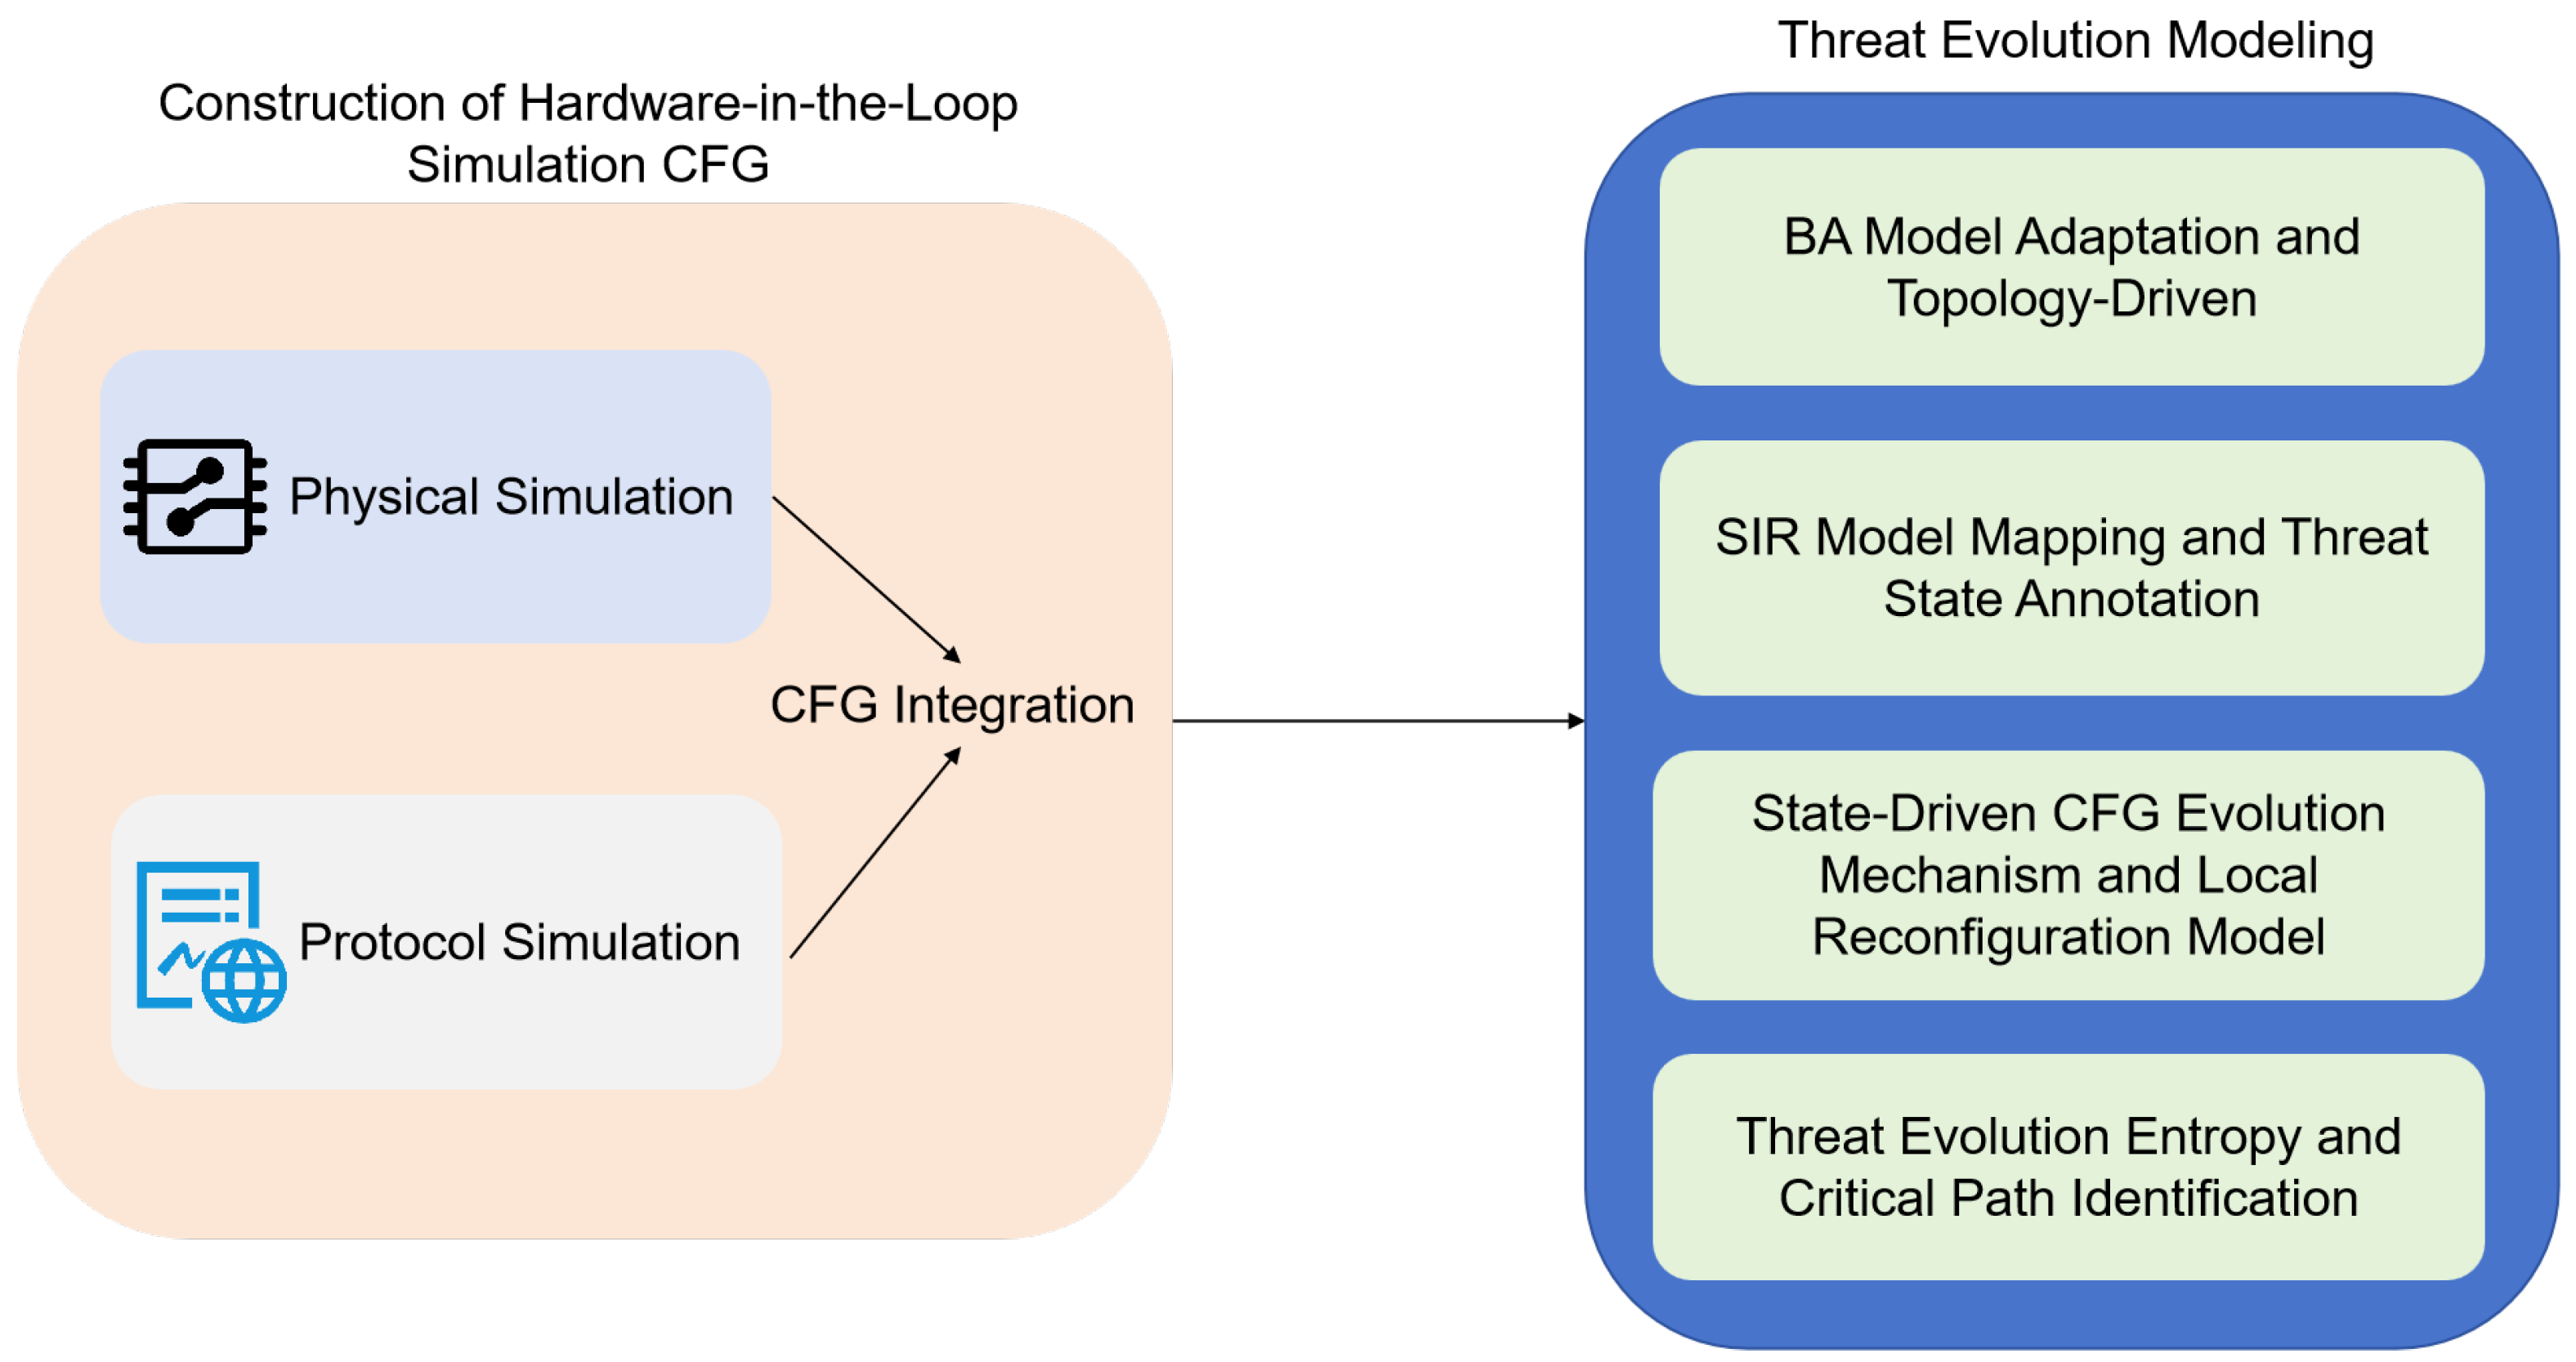
This study aims to develop a control flow graph (CFG) construction and threat evolution modeling system for near-field networks in smart grids, based on semi-physical simulation. The system comprises four core modules: physical simulation, protocol simulation, control flow integration, and threat evolution modeling. These modules collectively form a three-dimensional analysis framework that incorporates structural, behavioral, and state-related dimensions, as shown in Figure 1.
First, the physical simulation module captures the input–output characteristics of critical devices by modeling their operational behaviors, thereby ensuring the authenticity of device behavior within the simulation environment. The protocol simulation module focuses on the analysis and emulation of communication protocols between devices, with particular attention to complex proprietary protocols, to faithfully reproduce communication dynamics. The control flow integration module fuses the control flow information obtained from both physical and protocol simulations to construct a unified CFG, which comprehensively reflects the system’s operational logic and data flow. Finally, the threat evolution modeling module leverages the unified CFG and applies complex network theory and propagation models to simulate the diffusion paths and evolution processes of threats within the system.
The framework is designed to address the inherent complexity and dynamic nature of smart grid near-field networks. Its modular architecture ensures the independence of each component while enabling seamless integration across the system. Furthermore, the framework supports flexible scalability, allowing for reconfiguration of individual modules to accommodate simulation and analysis tasks of varying scale and complexity. Through this design, this study establishes a high-fidelity and extensible semi-physical simulation and threat evolution modeling system, providing a robust technical foundation for security analysis and defense strategy development in smart grid near-field networks.

3.2. Semi-Physical Simulation CFG

We propose a semi-physical simulation-based method for constructing control flow graphs (CFGs) of networked systems, which achieves precise modeling of threat evolution mechanisms through the organic integration of software simulation and hardware testing. The core innovations of this approach are as follows. First, by integrating real physical devices with virtual components in a controllable environment, the method ensures the authenticity of critical behavioral features while effectively avoiding potential security risks to actual systems. Second, the system allows for flexible adjustment of the ratio between physical devices and virtual components according to research needs, enabling cost-effective experimentation without compromising performance. Third, the semi-physical simulation environment supports rapid scenario reconfiguration and repeated testing, and it allows for progressive scaling in terms of system size and complexity. Finally, the approach enables the deployment of monitoring nodes across multiple system layers, facilitating the acquisition of multidimensional experimental data and overcoming the limitations of conventional monitoring techniques in pure hardware settings. These technical advantages make the semi-physical simulation approach particularly well-suited for CFG construction in smart grid near-field networks, providing a reliable technical foundation for the development of threat evolution models.

3.2.1. Physical Emulation

In the context of physical simulation studies for complex systems, we propose three categories of physical device simulation methods, each tailored to specific device characteristics such as openness, protocol transparency, and hardware dependency. First, for open-source devices that provide full access to device code or protocol stacks and support custom modification and integration, we adopt solutions based on well-established technologies. These include source code integration, Docker-based containerized deployment, and adaptation through hardware abstraction layers (HAL). Second, for devices with complex logic that are difficult to simulate, such as those relying on proprietary hardware components like RF chips, cryptographic modules, or high-precision ADC sampling units with intricate behaviors, we employ a direct physical interfacing approach. This method ensures accurate emulation of hardware-specific functionalities that cannot be effectively replicated in a purely virtual environment. Third, for the majority of non-simulatable units or devices with relatively simple logic, which represent a significant portion of near-field networks and pose a key challenge in physical simulation, we adopt a reverse engineering-based modeling approach. This involves analyzing device input–output behavior through techniques such as fuzz testing and behavioral inference to construct accurate simulation models. Detailed implementation of this approach is presented in the following.
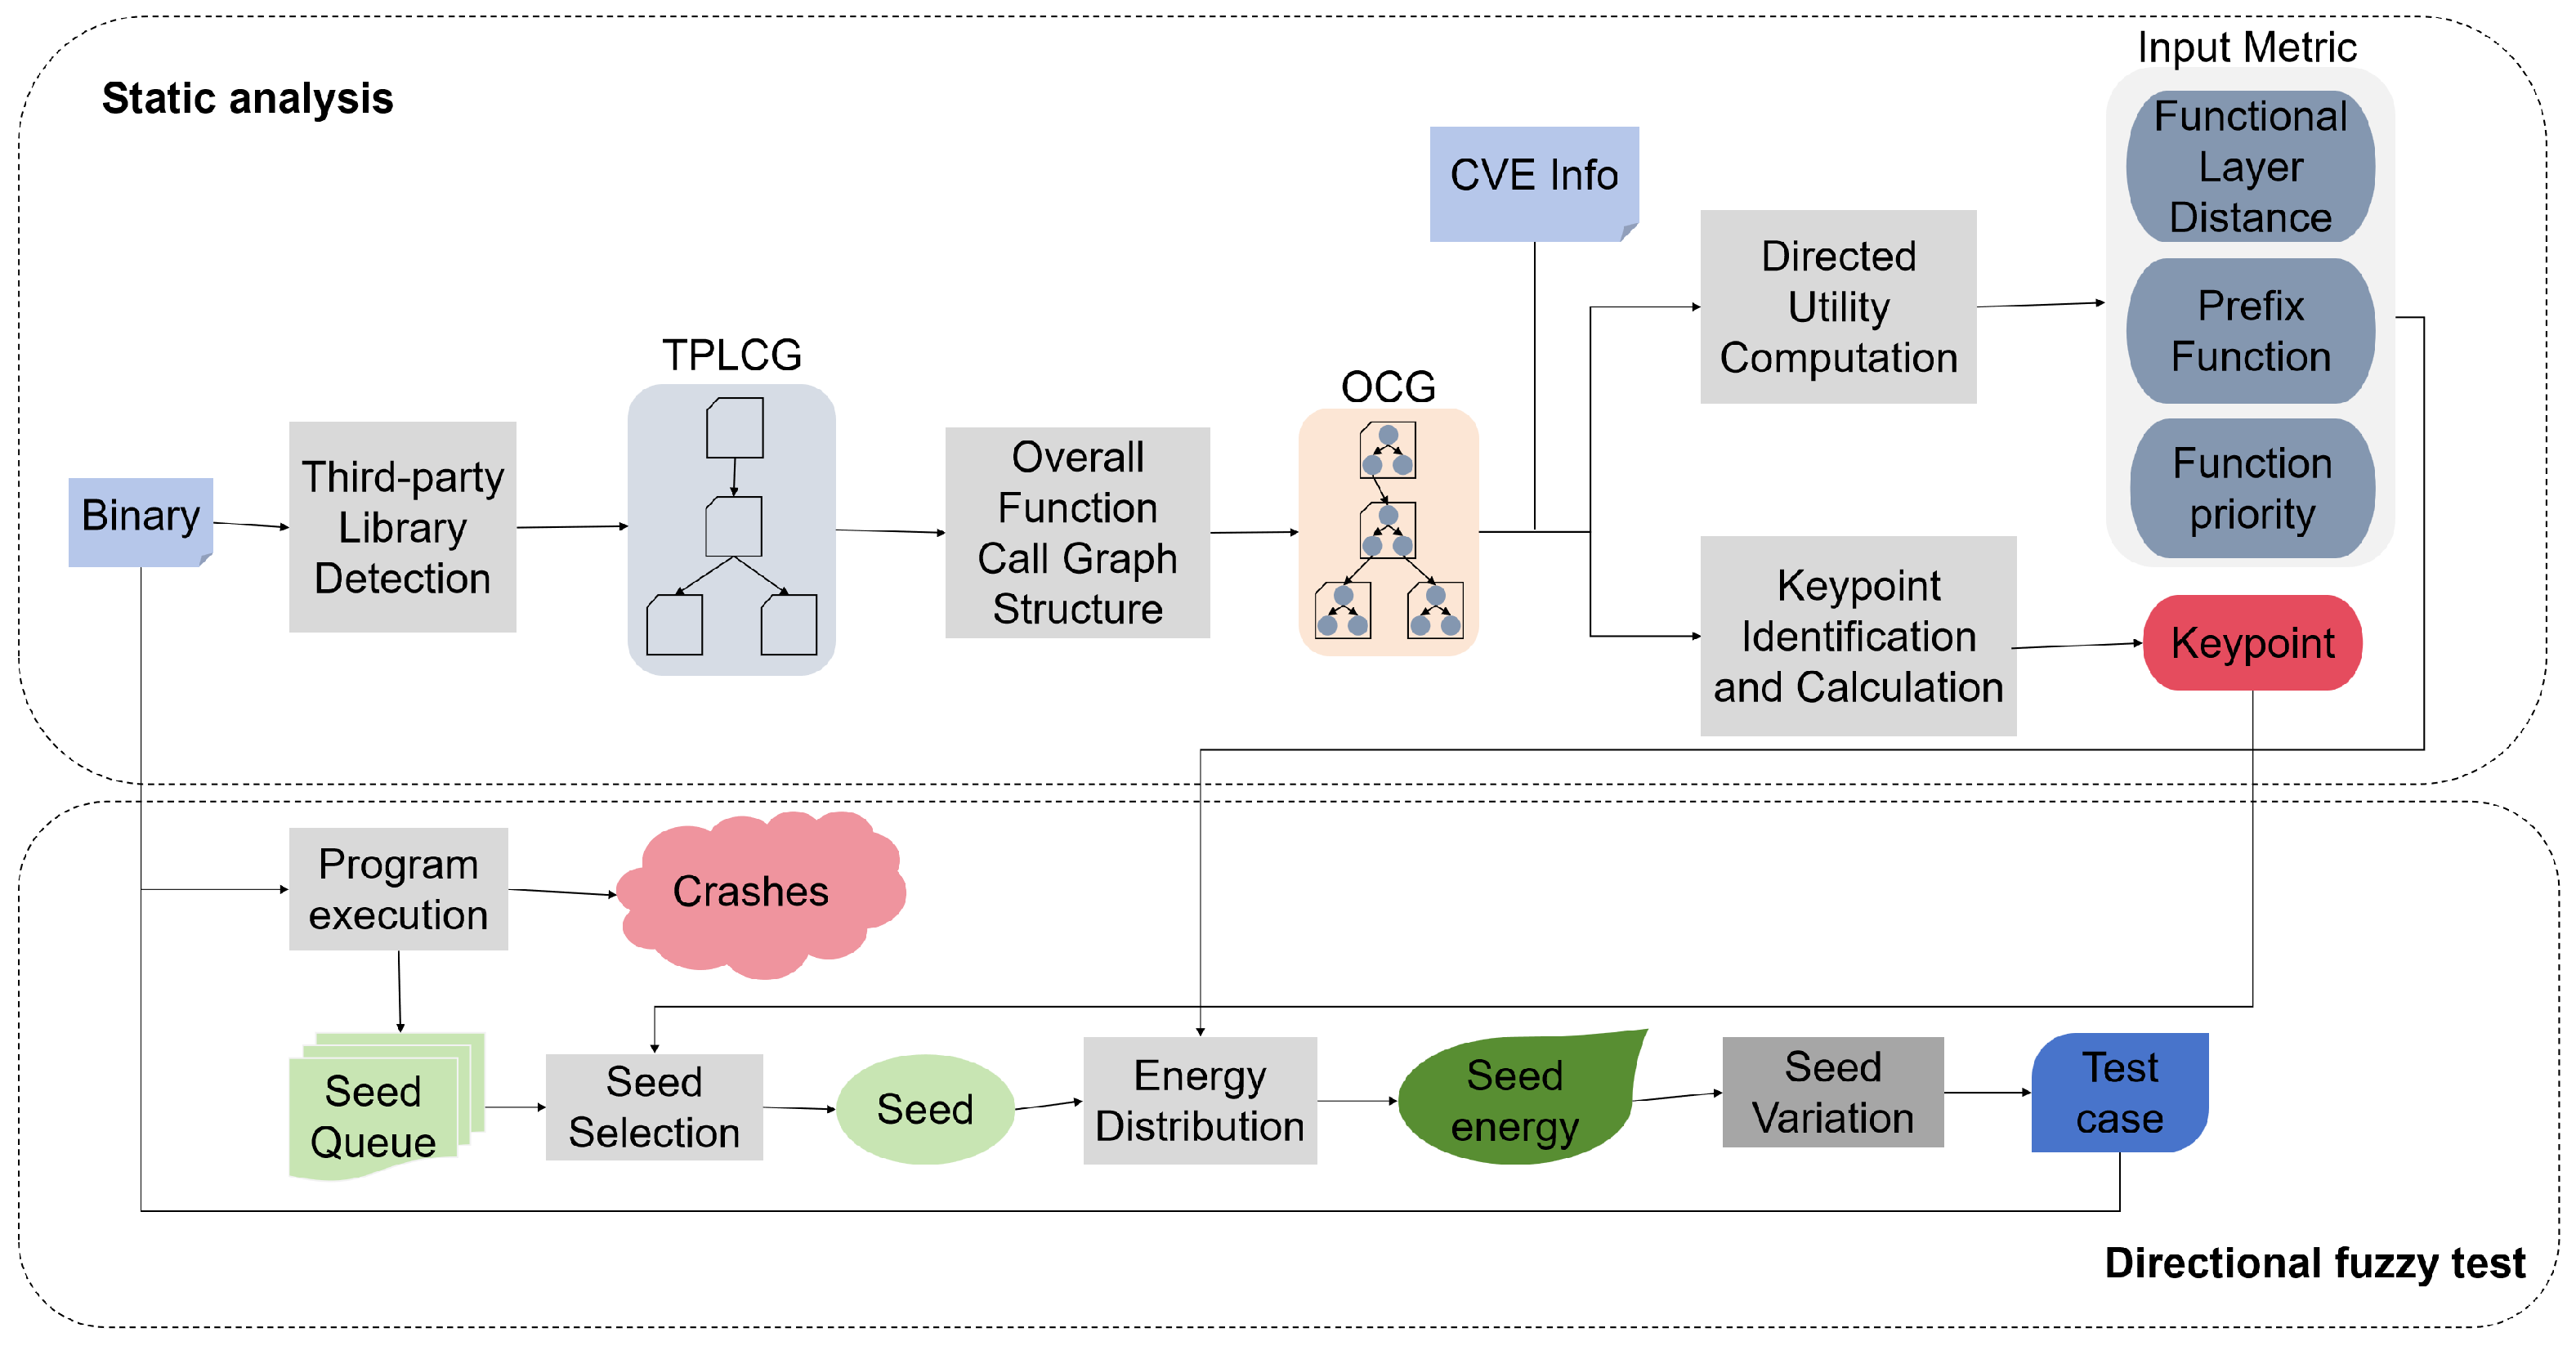
In the implementation of physical simulation, particularly for emulating the control logic of concentrator firmware, this study captures key function calls in real time. For example, the RS-485 packet parsing function ‘parse_485_data()’ and the HPLC command issuance function ‘send_hplc_command()’ are monitored, and their outputs are recorded. These outputs are then processed using custom Python 3.8.20 scripts to perform fuzz testing on RS-485 packets. The process consists of two main phases: static analysis and guided fuzz testing. During the static analysis phase, a third-party library dependency graph is first constructed using third-party library detection techniques. Subsequently, for the binary program and each of its direct or indirect third-party dependencies, individual function call graphs are analyzed. Critical functions within each third-party library are identified, and a complete function call graph of the overall binary program is then constructed. Based on this unified graph, potential vulnerable functions are identified, and seed selection is guided by a key-point recognition mechanism. Key points are defined as boundary functions of library components or functions that lie on paths reaching vulnerable target functions. The priority of fuzzing seeds is evaluated based on the number of key points contained in their execution paths and the proximity of these key points to the target vulnerable functions. Higher priority is assigned to seeds that pass through more key points and whose key points are closer to the target functions. Furthermore, a directed utility analysis is performed in parallel with key-point recognition, generating three key indicators to guide energy allocation for fuzzing seeds: (1) Function-level distance: the average distance from each function on the execution path to the target vulnerable function. (2) Predecessor function count: the total number of functions in the path that can reach the target function. (3) Function priority: determined by the shortest distance to the target vulnerable function within the path; shorter distances imply higher priority. Given any seed, the execution path of s, the energy distribution calculation is as follows:
p ( s ) = ( 1 W ¯ s ) · T ¯ s · E ¯ s
During the fuzz testing phase, this study optimizes seed input selection strategies based on key point information obtained from the static analysis stage. The energy allocation algorithm is further refined by applying normalization to three critical metrics: function layer distance ( W ¯ s ), number of predecessor functions ( T ¯ s ), and function priority ( E ¯ s ). This optimization improves the efficiency of path exploration in fuzzing, accelerates the triggering of supply chain-related vulnerabilities in the program, and enhances the generation efficiency of proof-of-concept (PoC) test cases, as illustrated in Figure 2.
Following this, the firmware’s state space is systematically explored using disassembly and cross-reference analysis techniques in combination with the Angr symbolic execution framework. Based on the outcomes of this analysis, the complete initialization process of the target device is successfully reconstructed. A high-fidelity device emulation model is then developed accordingly.
To address the potential combinatorial explosion of physical and control state spaces during reverse modeling, we adopt a multi-layered strategy. First, we apply constraint-guided symbolic execution, where input constraints derived from protocol specifications and known firmware registers are used to prune infeasible execution paths during path exploration. Second, we implement hierarchical abstraction by clustering CFG nodes based on protocol roles (e.g., handshake routines, authentication, data transmission) and constructing higher-level state transitions. Third, we employ region-based instrumentation by selectively monitoring address ranges and control logic blocks relevant to known threat vectors, significantly reducing the analysis scope. These techniques enable scalable modeling without compromising semantic fidelity, especially when dealing with large binaries or closed-source control logic.

3.2.2. Protocol Emulation

At the current stage, simulation techniques for devices utilizing publicly available and standardized protocols have become relatively mature. However, when dealing with devices that rely on complex proprietary protocols, the workload associated with protocol reverse engineering increases significantly, and simulating composite protocols remains a major technical challenge. This section focuses on the study of a unified approach to the simulation of composite protocols in such devices.
We propose two process identification methods that enable precise tracking of the execution paths of protocol service programs under test by implementing accurate process recognition within the instrumentation tool QEMU. This approach overcomes the technical bottlenecks caused by variations in daemon or subprocess mechanisms across different devices during protocol service implementation. Through a unified interface design, it achieves standardized identification of heterogeneous protocol software processes, thereby facilitating execution path monitoring. QEMU is configured to run in system emulation mode, supporting full binary execution of embedded firmware images. To enable fine-grained control flow tracing within QEMU, we modified its TCG (Tiny Code Generator) backend to support custom instruction-level callbacks. Specifically, we inserted lightweight hooks that monitor the Program Counter (PC) and Stack Pointer (SP) during runtime to identify process context switches and stack frame boundaries. For address-triggered registration, we implemented a dynamic memory access monitor that registers code regions based on predefined address ranges extracted from firmware analysis or binary disassembly. When execution enters these monitored regions, a registration event is triggered, and the corresponding function label or behavior is recorded. All logs are timestamped and stored in an event trace buffer for subsequent CFG reconstruction. This mechanism ensures accurate isolation and tracking of protocol-specific execution paths across different device emulations.
Our research highlights that greybox fuzz testing relies heavily on the ability to obtain execution traces of the target protocol service, which serve as crucial feedback for evaluating test case effectiveness. To accommodate diverse firmware protocol programs, the instrumentation tool must accurately capture the execution path ( T r a c e S ) of the relevant services (S) within the firmware. This requires a careful balance: avoiding excessive coverage that introduces noise from unrelated components, while also ensuring that critical information from the target service and its dependent libraries is not omitted due to overly narrow monitoring.
To address this, we propose a path recording adaptation technique tailored for proprietary protocol programs across different devices. Deeply integrated into the instrumentation tool, this technique provides a standardized user interface to enable differentiated recording of key execution paths across various programs. Specifically, the protocol interface testing adaptation mechanism must fulfill the following core function: accurately identify the target protocol service process within the firmware environment, and comprehensively record the execution path of its critical test logic in the form of a basic block address sequence.
To address the challenge of process identification, we propose a path recording adaptation technique that incorporates two distinct identification modes. The first mode is designed for resident protocol service programs whose process identifiers ( P I D s ) remain constant. It employs a hybrid identification approach based on the program counter ( P C ) and stack pointer ( S P ). Specifically, users provide the instrumentation tool with the PC value ( R p c ) and SP value ( R s p ) of the target process at a particular execution point. By continuously monitoring these two registers at runtime, the tool can accurately recognize the target process—when the observed register values match the user-specified values, the process is deemed to be the intended one. The second mode is tailored for subprocess-based protocol service programs, where the P I D changes dynamically. In this case, we introduce an identification method that combines the PC value with code signature matching. Since such subprocesses often make it difficult to obtain register information via conventional debugging methods, users are required to provide both the PC value ( R p c ) at a specific location and the binary instruction value ( C o d e R p c ) at that address. Similar to the first mode, the instrumentation tool monitors the PC register and reads the corresponding code at the specified location. When both the register value and code pattern match the user-provided inputs, the process is identified as the critical one to be traced.
For execution path recording, the proposed method implements an address-triggered recording mechanism. Users simply specify a start address ( A d d r s t a r t ) and an end address ( A d d r e n d ) for trace logging. Once the execution flow of the target process reaches the designated start address, the instrumentation tool automatically initiates the recording process, capturing a complete execution trace until the end address is reached.
In summary, the proposed protocol interface testing adaptation technique exposes a unified interface to users, namely ( R p c , R s p / C o d e R p c ) for process identification and ( A d d r s t a r t , A d d r e n d ) for execution trace recording. This enables the precise acquisition of execution traces for protocol service programs. Table 1 presents the protocol service programs, process identification methods, as well as the start and end address codes of recorded trajectories in binary files for different protocols in edge gateways, routers, and FTU devices.

3.2.3. CFG Integration

The construction of the semi-physical simulation control flow graph (CFG) is based on cross-domain information fusion and dynamic synchronization techniques, achieving the organic integration of the physical simulation model and protocol simulation traces. As shown in Figure 3, the system integrates devices such as concentrators, smart fusion terminals, electric meters, WAPI routers, Lora gateways, and flood sensors, and, in conjunction with multi-protocol interaction logic, constructs a unified control flow model.
Specifically, the system begins by decomposing the functionality and communication protocols of each device. The concentrator aggregates data using HPLC/RS-485 protocols. The smart fusion terminal performs protocol translation between LoRa/WAPI and HPLC/RS-485, while sensors upload data via the LoRa protocol. Based on this structure, a coordinated multi-device workflow is established, encompassing data transmission paths from the concentrator to the terminal and then to WAPI/LoRa devices, as well as direct RS-485 communication links to electric meters. The system introduces dedicated protocol conversion nodes, enabling the terminal to convert LoRa data into HPLC format and RS-485 data into WAPI format. For typical application scenarios, such as the sensor data reporting process (sensor → gateway → terminal → concentrator → alarm), the system embeds several key mechanisms. These include a real-time constraint mechanism (100 ms heartbeat detection), a multi-protocol concurrent processing mechanism (using a task scheduling and polling strategy to handle electric meter data while simultaneously processing control commands in real time), and a fault recovery mechanism (automatically retrying Lora communication up to three times upon timeout, and triggering an alarm upon repeated failure).
Through this design, the system constructs a comprehensive control flow model that spans hardware interaction, protocol translation, and real-time control. This model provides a robust technical foundation for the reliable operation of the semi-physical simulation system.

3.3. Threat Evolution Modeling Based on CFG

To gain deeper insights into the dynamic evolution of threats within the near-field network of the smart grid, this paper proposes a threat evolution modeling approach based on Control Flow Graphs (CFGs), integrating complex network modeling theory and graph structural evolution mechanisms. This method not only effectively reveals the topological paths and evolutionary patterns of threat propagation but also enables quantitative analysis and prediction of propagation trends and critical nodes. Specifically, we draw upon the Barabási–Albert (BA) scale-free network model, the Susceptible–Infectious–Recovered (SIR) epidemic model, and heterogeneous graph evolution mechanisms to jointly model the node generation, edge evolution, and state transition processes within the CFG-based graph.

3.3.1. BA Model Adaptation and Topology-Driven Mechanism

The Barabási–Albert (BA) model [30] is a classical framework characterizing the phenomenon of preferential attachment in complex systems. Its core principle posits that new nodes are more likely to connect to existing nodes with higher degrees, thereby forming a scale-free network structure where a few critical nodes dominate the majority of the traffic. We observe a similar pattern in the Control Flow Graph (CFG) structure of near-field networks in smart grids: certain key control logic modules—such as main control units, scheduling algorithms, or protocol parsers—undertake a substantial portion of data processing and control transfer tasks, exhibiting high in-degree or out-degree characteristics in the CFG.
Accordingly, we model the CFG as a heterogeneous, directed, scale-free graph and incorporate the BA mechanism to simulate the preferential propagation tendency of threats along logical control flows. During the dynamic construction of the CFG, each newly detected control flow path, triggered by events such as protocol state transitions or exceptional input branches, is treated as a new node added to the graph. The probability of connecting this new node to existing nodes is computed based on two factors: the behavioral activity and control influence of the target nodes. This process captures the preferential selection of attack paths within the CFG. The connection probability is defined as follows:
Π ( k i ) = k i α j k j α
Here, k i denotes the current control flow degree of node i, and α is a power-law parameter that regulates the strength of preferential attachment. By tuning α , we can control whether the attacker exhibits a stronger preference for targeting high-influence control nodes or adopts a more dispersed strategy by attacking multiple paths. To determine α , we generated a series of synthetic networks and selected the value ( α 2.6 ) that best matched the degree distribution observed in our NFN emulation topology using least-squares fitting on the log–log plot of node degrees.

3.3.2. SIR Model Mapping and Threat State Annotation Mechanism

To characterize the state evolution of threat propagation within the CFG, we draw inspiration from the Susceptible–Infectious–Recovered (SIR) model [31] commonly used in epidemiological studies. In this model, system nodes are categorized into three states: Susceptible (S), Infectious (I), and Recovered (R). The connections between nodes, along with the associated transmission probabilities, determine the likelihood of an infection spreading from one node to another. For devices that utilize direct communication methods and are thus challenging to model explicitly, this study adopts an abstraction approach by representing them as nodes. Their transmission likelihood and direction are inferred based on historical propagation pattern data. In the context of CFG-based threat evolution modeling, each control logic node is assigned one of the following states:
S (Susceptible):
a normal node not yet affected by threats;
I (Infectious):
a node currently influenced by anomalous logic paths;
R (Removed or Isolated):
a node that has been shielded, isolated, or mitigated by security mechanisms.
The threat propagation process is thus modeled as a state transition from I to S nodes along the control flow graph. The transmission probability β is formulated as the following function:
β i j ( t ) = f CFG i j , Δ p i j , θ t
Here, CFG i j denotes the existence of a control flow path from node i to node j; Δ p i j represents the coupling degree between physical characteristics (such as voltage/current fluctuations) and network behaviors (such as variations in packet traffic) along the path; and θ t is a temporally correlated propagation amplification factor, accounting for factors such as increased system vulnerability during low-load nighttime periods. Through iterative evolution, we construct a time-aware sequence of state propagation graphs, capturing the threat’s diffusion path, velocity, and intensity as it gradually spreads from the initial infection node to various layers of the system. This sequence ultimately serves as the foundation for threat situational forecasting and resource allocation optimization. For β , we conducted parameter sweeps in the range [0.01, 0.5], measuring the resulting infection spread rates in the simulated environment. The optimal β value was selected based on maximizing alignment with observed propagation patterns in the fuzzing-triggered vulnerability scenarios.
In this formulation, Δ p i j represents the cyber-physical coupling coefficient between physical-layer deviations and their impact on logical propagation behavior. To quantify this, we define:
Δ p i j = Δ V i j V r e f · Δ R i j R b a s e l i n e
where Δ V i j denotes the observed voltage fluctuation (e.g., from 220 V ± ε ) correlated with the data path between nodes i and j, and Δ R i j represents the increase in packet retransmission rate or response delay under such fluctuation. V r e f is the nominal system voltage (e.g., 220 V), and R b a s e l i n e is the normal retransmission rate without physical disturbance. This product captures how physical degradation affects data integrity or timing, allowing Δ p i j to serve as a normalized multiplier in the threat propagation function. These values are empirically measured during our semi-physical simulation using controlled perturbation injection.

3.3.3. State-Driven CFG Evolution Mechanism and Local Reconfiguration Model

In addition to topological and state-based propagation modeling, threat evolution in smart grids is also reflected in structural changes within the Control Flow Graph (CFG) itself. To address the asymmetric reconfiguration of the CFG during an attack, such as jump chain insertion or conditional branch hijacking, we introduce a state-driven CFG structural evolution mechanism. This mechanism defines the following three types of structural evolution operations based on the CFG’s foundational structure:
Node Insertion:
the attacker injects new logic flows (e.g., backdoor routines) into existing CFG paths;
Edge Substitution:
control flow redirection alters the jump target, rendering original edges obsolete while activating new paths;
Path Splitting:
a branch condition is broadened, resulting in multiple new execution paths from a single node.
By performing evolutionary operation recognition on the sequence of CFGs and employing graph isomorphism detection and graph edit distance computation, we identify structural changes induced by attacks. These changes are then mapped to micro-level events in the broader context of threat evolution.

3.3.4. Threat Evolution Entropy and Critical Path Identification

To quantitatively characterize the uncertainty inherent in threat evolution within the system, we further propose a metric termed threat evolution entropy. Inspired by the concept of information entropy, this metric is designed to measure the diversity of propagation path selection and the potential for risk diffusion within the CFG:
H threat ( t ) = i = 1 N p i t log p i t
Here, p i ( t ) represents the propagation probability of the i-th path at time t. A higher evolution entropy indicates that the system is in a phase of high propagation uncertainty, reflecting a more complex security posture. Building upon the evolution entropy, we further integrate path frequency statistics and risk assessment models to identify critical propagation paths and high-risk nodes, thereby providing decision support for security response actions. Equation (4) adopts the classic Shannon entropy formulation, but it is applied here in a time-varying context to quantify the uncertainty of multi-path threat propagation and is therefore termed threat evolution entropy in this paper. The term p i ( t ) denotes the probability that the threat at time t propagates through the i-th path in the Control Flow Graph (CFG). These probabilities are derived from the propagation likelihoods β i j in Equation (3), normalized such that i p i t at each time step. In practice, we track the distribution of active propagation edges and compute p i ( t ) based on their relative transition weights. A higher entropy value reflects a more uncertain or widely dispersed threat pattern, while lower entropy indicates concentrated, predictable propagation.
While the threat evolution entropy provides a quantitative view of propagation uncertainty, its application in practical scenarios requires defined thresholds for decision-making. Based on empirical observation in our simulation environment, entropy values below 1.0 typically indicate deterministic propagation patterns and can be categorized as low-risk. Values in the range of 1.0 to 2.5 suggest moderate unpredictability in the threat path, indicating medium-risk areas requiring active monitoring. Entropy values exceeding 2.5 reflect high uncertainty in propagation, often corresponding to topologies with redundant or highly dynamic node interconnections, and are classified as high-risk, suggesting a need for preemptive intervention (e.g., protocol isolation or dynamic defense updates). These thresholds may vary with network size and configuration and can be further refined through domain-specific calibration in real-world deployments.
In summary, the CFG-based threat evolution modeling approach proposed in this study leverages the Barabási–Albert (BA) model to capture preferential attachment in control flow path formation, and it employs the SIR model to describe the transitions of propagation states. Additionally, structural changes in the control flow graph induced by attacks are precisely modeled through a state-driven mechanism and graph evolution operations. Combined with quantitative metrics such as threat evolution entropy, this approach establishes a comprehensive threat modeling framework that integrates structure, behavior, and state in a three-dimensional, dynamically coupled manner. This methodology not only enhances the granularity and responsiveness of threat modeling in near-field smart grid networks but also lays a solid foundation for the optimized deployment of subsequent defense strategies.

4. Experiments

4.1. Experiment Setup

In this experiment, a fully virtualized simulation of an electricity information collection system was constructed using virtualization technologies. The system comprises three core components: the electricity data collection master station running on a Windows_x64 platform, a data concentrator based on Debian 12 (Linux kernel 6.12.21), and smart meters also operating on Debian 12 (Linux kernel 6.12.21). Data exchange between the master station and the concentrator is conducted via the GB/T 376.1 protocol [32], while communication between the concentrator and the smart meters follows the DL/T 645-2007 protocol [33]. Together, these components establish a complete end-to-end protocol chain from the master station to terminal devices, enabling comprehensive simulation of electricity data acquisition, transmission, and processing. The simulation environment is supported by QEMU 9.2.0.

4.2. Comparison Experiment

4.2.1. Physical Emulation

This section experimentally verifies the effectiveness of the proposed method. As shown in Figure 4, we conducted hardware-in-the-loop simulations involving the data concentrator and smart meters. The left side of the figure displays the physical hardware devices, while the right side presents the corresponding communication packet data generated through simulation.
This section evaluates the key performance metrics of the hardware-in-the-loop simulation through experimental analysis. As shown in Table 2, we systematically collected experimental data on aspects such as data integrity, abnormal data handling speed, overload alarm triggering time, and data collection failure rate. The results demonstrate that the proposed hardware-in-the-loop simulation scheme maintains a high degree of consistency with real physical devices across all evaluated metrics, with no significant performance degradation observed. These findings further validate the effectiveness of our approach.

4.2.2. Protocol Emulation

This section experimentally validates the effectiveness of the proposed protocol emulation approach. Focusing on three representative communication protocols—DL/T 645-2007 [33], TELNET, and GB/T 376.1 [32]—we conducted a comparative analysis of protocol message characteristics before and after emulation, as summarized in Table 3. The experimental results demonstrate that the proposed emulation method not only faithfully preserves the original communication features of each protocol but, in some cases, even extends their functionality beyond that of the pre-emulation implementations.
We further conducted comparative experiments to evaluate the performance of different protocols before and after emulation. As shown in Table 4, the performance metrics, including throughput, latency, packet loss rate, bandwidth utilization, and concurrency capability, remain highly consistent before and after emulation. Notably, certain performance indicators exhibit slight improvements after emulation. These results provide strong evidence supporting the effectiveness and reliability of our proposed protocol emulation method. The observed performance improvements in post-simulation scenarios can be attributed to two main factors. First, during the simulation process, redundant layers in protocol stacks, such as preambles and vendor-specific encapsulations, were streamlined, leading to reduced packet size and transmission overhead. Second, the virtualization environment (QEMU-based) utilizes optimized virtual networking interfaces and low-latency memory access, which enhances communication throughput and reduces latency compared to real hardware interactions.

4.2.3. Threat Detection

This section presents comparative experiments on threat detection performance across different experimental environments, including full physical deployment, pure virtual simulation, and the proposed semi-physical simulation CFG. The results are summarized in Table 5. Experimental data show that the proposed semi-physical simulation CFG method achieves the highest threat detection rate at 92% while maintaining the lowest false positive rate at 7.02 % and the highest detection accuracy at 89.01%. In terms of detection timeliness, although there is a slight delay compared to the full physical environment, the construction cost is significantly reduced. Overall, the experimental results demonstrate the excellent practical value of the proposed semi-physical simulation CFG threat evolution model.
Although the proposed framework achieves high detection accuracy and low false positive rates within the semi-physical simulation environment, it is important to note that the data used in our experiments is generated from controlled emulated scenarios rather than from actual power grid incidents. This may limit the generalizability of our results when applied to real-world networks with more unpredictable behaviors and noise. Due to safety regulations and access restrictions, conducting experiments on live smart grid infrastructure remains challenging. In future work, we plan to collaborate with industrial partners to validate the robustness and transferability of the proposed approach under real-world attack conditions.

5. Conclusions

We propose a semi-physical simulation-based control flow graph (CFG) construction and threat evolution modeling framework for near-field networks in smart grids. By adopting a structure–behavior–state three-dimensional linkage analysis approach, the framework addresses the limitations of traditional static CFGs in dynamic threat analysis. It introduces an innovative integration of physical simulation and protocol emulation technologies, leveraging reverse engineering and fuzzing-based methods for device behavior modeling, along with a unified protocol process identification and execution trace recording technique. This enables high-fidelity reconstruction of both hardware behavior and communication logic. For threat evolution modeling, the framework combines the BA scale-free network model with the SIR propagation model, forming a joint modeling system that incorporates topology evolution, state propagation, and dynamic reconfiguration mechanisms. A novel metric, threat evolution entropy, is introduced to quantify the uncertainty in propagation paths.
Experimental results demonstrate that the proposed method effectively captures the diffusion paths and evolutionary patterns of threats within near-field smart grid networks. It provides a solid theoretical foundation and technical support for identifying critical nodes and optimizing protection strategies. Beyond enhancing the dynamism and accuracy of smart grid security analysis, the modular design and semi-physical simulation approach offer a transferable methodological framework applicable to the security of other critical information infrastructures.
Despite the promising results, we acknowledge several limitations of the current framework. Notably, the semi-physical simulation environment, while effective for protocol behavior and control flow modeling, cannot fully capture the influence of complex external factors such as electromagnetic interference, extreme weather conditions, or physical component degradation over time. These limitations may affect the accuracy of threat propagation modeling under real-world stress scenarios. In future work, we aim to integrate hardware-in-the-loop environmental stress testing platforms and co-simulation with digital twin models of physical devices to better reflect such conditions. Moreover, the proposed semi-physical CFG simulation method can be extended to support real-time adaptive threat response in live smart grid environments. This would involve deploying the framework alongside edge computing nodes or microcontrollers in field devices, where control flow data can be continuously captured and updated. We will also investigate how AI can assist the analysis of the evolution mechanisms [34,35]. This part of the analysis will provide a new vision for research in this domain.

Author Contributions

Conceptualization, Z.G.; methodology, W.H.; software, J.G.; validation, Z.G., J.G., C.Z. and J.C.; formal analysis, C.Z. and J.C.; investigation, J.G., C.Z. and J.C.; resources, W.H.; data curation, C.Z. and J.C.; writing—original draft preparation, Z.G.; writing—review and editing, Z.G. and W.H.; visualization, J.G.; supervision, Z.G.; project administration, Z.G.; funding acquisition, Z.G. All authors have read and agreed to the published version of the manuscript.

Funding

This research was funded by the State Grid Corporation of China (SGCC), Management Science and Technology Project: Research on key technologies for vulnerability mining and security assessment of power near-field networks and edge devices. Project number: 5700-202418245A-1-1-ZN.

Data Availability Statement

The data supporting the findings of this study are proprietary and belong to the company involved in this research. Due to confidentiality agreements and corporate privacy policies, these data are not publicly available. Requests for access to the data may be considered on a case-by-case basis and subject to approval by the data owner.

Acknowledgments

We would like to express our gratitude to the State Grid Corporation of China (SGCC) for financial support. We also appreciate the valuable feedback from the editors and reviewers.

Conflicts of Interest

Authors were employed by the company State Grid Jiangsu Electric Power Co., Ltd. The authors declare that the research was conducted in the absence of any commercial or financial relationships that could be construed as a potential conflict of interest.

References

  1. Gunduz, M.Z.; Das, R. Cyber-security on smart grid: Threats and potential solutions. Comput. Netw. 2020, 169, 107094. [Google Scholar] [CrossRef]
  2. Zhang, J.; Pan, L.; Han, Q.L.; Chen, C.; Wen, S.; Xiang, Y. Deep learning based attack detection for cyber-physical system cybersecurity: A survey. IEEE/CAA J. Autom. Sin. 2021, 9, 377–391. [Google Scholar] [CrossRef]
  3. Feng, X.; Zhu, X.; Han, Q.L.; Zhou, W.; Wen, S.; Xiang, Y. Detecting vulnerability on IoT device firmware: A survey. IEEE/CAA J. Autom. Sin. 2022, 10, 25–41. [Google Scholar] [CrossRef]
  4. Soltan, S.; Mittal, P.; Poor, H.V. BlackIoT:IoT botnet of high wattage devices can disrupt the power grid. In Proceedings of the 27th USENIX Security Symposium (USENIX Security 18), Baltimore, MD, USA, 15–17 August 2018; pp. 15–32. [Google Scholar]
  5. Shekari, T.; Cardenas, A.A.; Beyah, R. MaDIoT 2.0: Modern High-Wattage IoT botnet attacks and defenses. In Proceedings of the 31st USENIX Security Symposium (USENIX Security 22), Boston, MA, USA, 10–12 August 2022; pp. 3539–3556. [Google Scholar]
  6. Teixeira, A.; Shames, I.; Sandberg, H.; Johansson, K.H. A secure control framework for resource-limited adversaries. Automatica 2015, 51, 135–148. [Google Scholar] [CrossRef]
  7. Wang, W.; Lu, Z. Cyber security in the smart grid: Survey and challenges. Comput. Netw. 2013, 57, 1344–1371. [Google Scholar] [CrossRef]
  8. Liu, Y.; Ning, P.; Reiter, M.K. False data injection attacks against state estimation in electric power grids. ACM Trans. Inf. Syst. Secur. (TISSEC) 2011, 14, 1–33. [Google Scholar] [CrossRef]
  9. Tertytchny, G.; Karbouj, H.; Hadjidemetriou, L.; Charalambous, C.; Michael, M.K.; Sazos, M.; Maniatakos, M. Demonstration of man in the middle attack on a commercial photovoltaic inverter providing ancillary services. In Proceedings of the 2020 IEEE CyberPELS (CyberPELS), Miami, FL, USA, 13 October 2020; pp. 1–7. [Google Scholar]
  10. Krotofil, M.; Gollmann, D. Industrial control systems security: What is happening? In Proceedings of the 2013 11th IEEE International Conference on Industrial Informatics (INDIN), Bochum, Germany, 29–31 July 2013; pp. 670–675. [Google Scholar]
  11. Sheng, C.; Zhou, W.; Ma, W.; Zhu, X.; Wen, S.; Xiang, Y. Network Traffic Fingerprinting for IIoT Device Identification: A Survey. IEEE Trans. Ind. Inform. 2025, 21, 3541–3554. [Google Scholar] [CrossRef]
  12. Bader, L.; Serror, M.; Lamberts, O.; Sen, Ö.; van der Velde, D.; Hacker, I.; Filter, J.; Padilla, E.; Henze, M. Comprehensively analyzing the impact of cyberattacks on power grids. In Proceedings of the 2023 IEEE 8th European Symposium on Security and Privacy (EuroS&P), Delft, The Netherlands, 3–7 July 2023; pp. 1065–1081. [Google Scholar]
  13. Minh, Q.N.; Nguyen, V.H.; Quy, V.K.; Ngoc, L.A.; Chehri, A.; Jeon, G. Edge computing for IoT-enabled smart grid: The future of energy. Energies 2022, 15, 6140. [Google Scholar] [CrossRef]
  14. Gungor, V.C.; Sahin, D.; Kocak, T.; Ergut, S.; Buccella, C.; Cecati, C.; Hancke, G.P. Smart grid technologies: Communication technologies and standards. IEEE Trans. Ind. Inform. 2011, 7, 529–539. [Google Scholar] [CrossRef]
  15. Kabalci, Y. A survey on smart metering and smart grid communication. Renew. Sustain. Energy Rev. 2016, 57, 302–318. [Google Scholar] [CrossRef]
  16. Hasan, M.K.; Habib, A.A.; Islam, S.; Safie, N.; Abdullah, S.N.H.S.; Pandey, B. DDoS: Distributed denial of service attack in communication standard vulnerabilities in smart grid applications and cyber security with recent developments. Energy Rep. 2023, 9, 1318–1326. [Google Scholar] [CrossRef]
  17. Yan, Y.; Qian, Y.; Sharif, H.; Tipper, D. A survey on cyber security for smart grid communications. IEEE Commun. Surv. Tutor. 2012, 14, 998–1010. [Google Scholar] [CrossRef]
  18. Sideris, A.; Tsiktsiris, D.; Ziouzios, D.; Dasygenis, M. Smart grid hardware security. In IoT for Smart Grids: Design Challenges and Paradigms; Springer: Cham, Switzerland, 2018; pp. 85–113. [Google Scholar]
  19. Tufail, S.; Parvez, I.; Batool, S.; Sarwat, A. A survey on cybersecurity challenges, detection, and mitigation techniques for the smart grid. Energies 2021, 14, 5894. [Google Scholar] [CrossRef]
  20. Alomari, M.A.; Al-Andoli, M.N.; Ghaleb, M.; Thabit, R.; Alkawsi, G.; Alsayaydeh, J.A.J.; Gaid, A.S. Security of Smart Grid: Cybersecurity Issues, Potential Cyberattacks, Major Incidents, and Future Directions. Energies 2025, 18, 141. [Google Scholar] [CrossRef]
  21. Inayat, U.; Zia, M.F.; Mahmood, S.; Berghout, T.; Benbouzid, M. Cybersecurity enhancement of smart grid: Attacks, methods, and prospects. Electronics 2022, 11, 3854. [Google Scholar] [CrossRef]
  22. Allen, F.E. Control flow analysis. ACM Sigplan Not. 1970, 5, 1–19. [Google Scholar] [CrossRef]
  23. Ye, T.; Wu, L.; Ma, T.; Zhang, X.; Du, Y.; Liu, P.; Ji, S.; Wang, W. CP-BCS: Binary code summarization guided by control flow graph and pseudo code. arXiv 2023, arXiv:2310.16853. [Google Scholar]
  24. Rimsa, A.; Nelson Amaral, J.; Pereira, F.M. Practical dynamic reconstruction of control flow graphs. Softw. Pract. Exp. 2021, 51, 353–384. [Google Scholar] [CrossRef]
  25. Ma, Y.F.; Li, M. The flowing nature matters: Feature learning from the control flow graph of source code for bug localization. Mach. Learn. 2022, 111, 853–870. [Google Scholar] [CrossRef]
  26. Zhu, X.; Wen, S.; Camtepe, S.; Xiang, Y. Fuzzing: A Survey for Roadmap. ACM Comput. Surv. 2022, 54, 230. [Google Scholar] [CrossRef]
  27. Deknop, C.; Fabry, J.; Mens, K.; Zaytsev, V. Generating Customised Control Flow Graphs for Legacy Languages with Semi-Parsing. In Proceedings of the 2022 IEEE International Conference on Software Maintenance and Evolution (ICSME), Limassol, Cyprus, 3–7 October 2022; pp. 523–532. [Google Scholar]
  28. Chen, X.; Li, C.; Wang, D.; Wen, S.; Zhang, J.; Nepal, S.; Xiang, Y.; Ren, K. Android HIV: A study of repackaging malware for evading machine-learning detection. IEEE Trans. Inf. Forensics Secur. 2019, 15, 987–1001. [Google Scholar] [CrossRef]
  29. Bobrovnikova, K.; Lysenko, S.; Savenko, B.; Gaj, P.; Savenko, O. Technique for IoT malware detection based on control flow graph analysis. Radioelectron. Comput. Syst. 2022, 1, 141–153. [Google Scholar] [CrossRef]
  30. Barabási, A.L.; Albert, R. Emergence of scaling in random networks. Science 1999, 286, 509–512. [Google Scholar] [CrossRef] [PubMed]
  31. Kermack, W.O.; McKendrick, A.G. A contribution to the mathematical theory of epidemics. Proc. R. Soc. Lond. Ser. A Math. Phys. Eng. Sci. 1927, 115, 700–721. [Google Scholar]
  32. GB/T 376.1-2020; Communication Protocol for Electric Energy Metering Equipment—Part 1: Data Exchange Protocol. Standardization Administration of China: Beijing, China, 2020.
  33. DL/T 645-2007; Multi-Function Watt-Hour Meter Communication Protocol. National Energy Administration of China: Beijing, China, 2007.
  34. Zhu, X.; Zhou, W.; Han, Q.L.; Ma, W.; Wen, S.; Xiang, Y. When Software Security Meets Large Language Models: A Survey. IEEE/CAA J. Autom. Sin. 2025, 12, 317–334. [Google Scholar] [CrossRef]
  35. Zhou, W.; Zhu, X.; Han, Q.L.; Li, L.; Chen, X.; Wen, S.; Xiang, Y. The Security of Using Large Language Models—A Survey with Emphasis on ChatGPT. IEEE/CAA J. Autom. Sin. 2025, 12, 1–26. [Google Scholar] [CrossRef]
Figure 1. Overview of our framework. The framework first constructs a semi-physical simulation-based control flow graph (CFG), which then serves as the foundation for threat evolution modeling.
Electronics 14 02739 g001
Figure 2. Workflow of physical emulation. It comprises two main components: static analysis and directional fuzz testing.
Electronics 14 02739 g002
Figure 3. Example of Control Flow Graph (CFG) integration.
Electronics 14 02739 g003
Figure 4. Effect diagrams of physical emulation for different devices.
Electronics 14 02739 g004
Table 1. Protocol service programs and process identification methods.
DeviceProtocolService ProgramProcess IdentificationKey Binary File
Edge GatewaySNMPsnmpdPC + Stack Top/packages/mnt/junos-libs-compat32/
usr/lib32/libnet-snmp.so.1
Edge GatewayHTTPhttpdPC + Stack Top/packages/mnt/junos-runtime-srx/usr/sbin/httpd
RouterSNMPsnmpdPC + Stack Top/netscaler/snmpd
RouterTELNETinetdPC + Stack Top/usr/sbin/inetd
FTUMMSiec_104PC + Stack Top/usr/sbin/inetd
FTUMMSsciecPC + Stack Top/usr/local/extapps/SCIEC104/bin/SCIEC104
Table 2. Performance comparison of physical emulation.
MetricSmart MeterConcentratorNote
Data integrity100%100%Immune to load variations
Anomaly processing speedAvg. 30 msAvg. 30 msNetwork congestion excluded
Overload alarm trigger1 s1 sImmune to load variations
Data acquisition timelinessHighHighNo transmission distance effect
Table 3. Protocol emulation performance comparison.
ProtocolDL/T 645-2007 [33]TELNETGB/T 376.1 [32]
Pre-emulationData format with prefix 0xFEConsistent87% feature implementation rate (vendor-dependent)
Post-emulationPrefix omitted via TCP transportConsistent100% standard feature implementation
Table 4. Performance comparison before and after simulation for different protocols.
ProtocolDL645-2007 [33]GB/T 376.1 [32]
Metrics Pre-Simulation Post-Simulation Pre-Simulation Post-Simulation
Throughput1.2 kbps1.19 kbps50 Mbps49 Mbps
Latency200 ms150 ms22 ms15 ms
Packet Loss Rate0.1%0%2%0%
Bandwidth Utilization85%96%75%93%
Concurrency Support10 Devices13 Devices100 Devices100 Devices
Table 5. Performance comparison of threat detection in different experimental environments.
EnvironmentDetection Rate (%)False Alarm Rate (%)Precision (%)Detection Time (ms/Request)
Full Hardware90.009.0888.0012
Pure Simulation70.0121.0868.01102
Semi-Physical CFG92.007.0289.0135
Disclaimer/Publisher’s Note: The statements, opinions and data contained in all publications are solely those of the individual author(s) and contributor(s) and not of MDPI and/or the editor(s). MDPI and/or the editor(s) disclaim responsibility for any injury to people or property resulting from any ideas, methods, instructions or products referred to in the content.

