Article

An Advanced Indoor Localization Method Based on xLSTM and Residual Multimodal Fusion of UWB/IMU Data

Digital Intelligence Industry College, Inner Mongolia University of Science and Technology, Baotou 014018, China
*
Author to whom correspondence should be addressed.
Electronics 2025, 14(13), 2730; https://doi.org/10.3390/electronics14132730
Submission received: 4 June 2025 / Revised: 1 July 2025 / Accepted: 3 July 2025 / Published: 7 July 2025

Abstract

To address the limitations of single-modality UWB/IMU systems in complex indoor environments, this study proposes a multimodal fusion localization method based on xLSTM. After extracting features from UWB and IMU data, the xLSTM network enables deep temporal feature learning. A three-stage residual fusion module is introduced to enhance cross-modal complementarity, while a multi-head attention mechanism dynamically adjusts the sensor weights. The end-to-end trained network effectively constructs nonlinear multimodal mappings for two-dimensional position estimation under both static and dynamic non-line-of-sight (NLOS) conditions with human-induced interference. Experimental results demonstrate that the localization errors reach 0.181 m under static NLOS and 0.187 m under dynamic NLOS, substantially outperforming traditional filtering-based approaches. The proposed deep fusion framework significantly improves localization reliability under occlusion and offers an innovative solution for high-precision indoor positioning.

1. Introduction

Indoor localization techniques are becoming increasingly important for applications such as smart navigation, unmanned aerial vehicle (UAV) control, and mobile robot tracking. However, the Global Positioning System (GPS) often fails to operate reliably in indoor environments [1], where factors such as structural complexity, limited signal propagation, insufficient infrastructure deployment, and uncorrected errors can severely degrade positioning accuracy—especially under non-line-of-sight (NLOS) conditions. To address these challenges, various alternative indoor localization methods have been proposed, including WiFi [2,3], Bluetooth [4,5], visible light communication (VLC) [6,7], ultra-wideband (UWB) [8,9], and pedestrian dead reckoning (PDR) based on inertial navigation [10,11].
Among these technologies, ultra-wideband (UWB) has received widespread attention due to its high accuracy, strong stability, and robust anti-interference capability. However, UWB’s ranging performance significantly degrades under non-line-of-sight (NLOS) conditions, resulting in large positioning errors. Meanwhile, inertial measurement units (IMUs), commonly used in pedestrian dead reckoning (PDR) systems, offer advantages such as a compact size, a lightweight design, and immunity to external signal interference. They can maintain relatively stable positioning over short periods. Nevertheless, long-term use leads to cumulative errors [12,13,14], with heading angle data being particularly susceptible to magnetic field disturbances and attitude fluctuations, causing drift or sudden deviations [15], which adversely affect positioning accuracy. Furthermore, most existing fusion methods [16,17] are based on filtering algorithms that, despite their strong noise suppression and drift correction capabilities, suffer from two main limitations. First, they heavily depend on strict assumptions about system models and noise distributions, limiting their adaptability to the uncertainty and dynamics of real-world environments. Second, filtering approaches require numerical integration of IMU data to estimate displacement, which is vulnerable to initial biases and acceleration drifts that may destabilize the system.
To comprehensively enhance the performance of UWB–IMU fusion systems, researchers have conducted in-depth investigations focusing on data fusion algorithms. Commonly used approaches include the Kalman Filter (KF), Extended Kalman Filter (EKF), Complementary Kalman Filter (CKF), and Unscented Kalman Filter (UKF) [18,19,20,21]. These methods effectively mitigate inconsistencies among multi-sensor data by integrating state prediction with observation updates. In practical applications, to address the challenges of localization in complex indoor environments, researchers have continuously refined traditional filtering frameworks and proposed various fusion strategies to resolve typical issues encountered in UWB–IMU integration.
Experimental results demonstrate that these enhanced fusion methods perform effectively in complex indoor environments involving both line-of-sight (LOS) and non-line-of-sight (NLOS) conditions, with performance under NLOS scenarios being particularly critical. To address errors caused by NLOS conditions, ref. [22] proposed a two-stage detection algorithm that identifies LOS/NLOS states based on signal features and dynamically adjusts the ranging strategy, maintaining high accuracy even when LOS anchors are limited. For dynamic occlusions, ref. [23] developed a human body shadowing model for UWB ranging errors, which was integrated into a particle filter alongside smartphone gyroscope data. This approach reduced the 2D localization error by 41.91% compared to trilateration. Building on this, ref. [24] distinguished between spatial and human occlusions using LOS/NLOS mapping, spatial priors, and IMU data. Their method applies visibility checks and error correction models within a particle filter, enabling robust positioning under complex occlusions. To handle time-varying, non-Gaussian NLOS errors, ref. [25] proposed an adaptive strategy that updates measurement noise covariance in real time based on residuals within an EKF. This method improved localization accuracy by 46.15% over traditional tightly coupled systems and introduced a feedback mechanism for UWB preprocessing, forming a closed-loop optimization framework. Additionally, ref. [26] combined Least Squares (LS) and Adaptive Kalman Filtering (AKF) for tightly coupled fusion of UWB and IMU-based PDR, effectively mitigating UWB errors and IMU drift, thereby enhancing real-time performance in dynamic indoor environments.
Despite the performance improvements achieved by the aforementioned filtering and compensation strategies, the overall system effectiveness in complex environments remains highly dependent on the proper tuning of parameters. For example, ref. [27] conducted a systematic evaluation of optimal parameter settings for UWB–IMU sensor fusion under non-line-of-sight (NLOS) conditions. Their study demonstrated that applying high-pass filtering prior to Extended Kalman Filter (EKF) and Unscented Kalman Filter (UKF) processing not only enhances system robustness but also provides valuable guidance for parameter optimization. However, traditional filtering methods inherently struggle to model highly nonlinear environments with severe interference, which has driven increasing interest in neural network-based fusion approaches. Compared to conventional filters, neural networks exhibit superior nonlinear modeling capabilities and adaptability, enabling more effective handling of complex phenomena such as multipath propagation and dynamic occlusions. For instance, ref. [28] proposed a deep Long Short-Term Memory (LSTM)-based UWB localization method that leverages extracted ranging features to significantly enhance temporal modeling and improve positioning accuracy. In [29], a neural network architecture was developed to correct direction-induced ranging errors without relying on signal strength or channel response parameters, reducing the 3D ranging root mean square error (RMSE) by nine centimeters. Furthermore, ref. [30] integrated UWB, IMU, and time-of-flight (TOF) data with an OptiTrack motion capture system through an artificial neural network (ANN)-based fusion framework, achieving correlation coefficients exceeding 99% in both the X and Y coordinates, effectively mitigating drift errors and maintaining high-precision localization. In summary, neural network-based fusion methods offer significant advantages in accuracy and robustness against environmental variability and signal interference. Nonetheless, their increased computational complexity and real-time processing demands pose ongoing challenges for practical deployment, necessitating further optimization.
Taking all these considerations into account, this paper proposes a neural network-based indoor localization method that fuses ultra-wideband (UWB) and inertial measurement unit (IMU) data. Leveraging the strong feature extraction and nonlinear modeling capabilities of neural networks, the method effectively integrates the global spatial position information provided by UWB with dynamic motion features extracted from the IMU, such as acceleration and heading angle, achieving efficient and robust multimodal sensor fusion for indoor positioning. Compared to existing approaches, it effectively mitigates non-line-of-sight (NLOS) effects and sensor drift, reduces reliance on precise system models and noise assumptions, and maintains high localization accuracy even with relatively simple hardware configurations. Moreover, to better assess the model’s performance, experiments are conducted in complex indoor environments featuring typical NLOS characteristics, including static obstacles and dynamic occlusions caused by human movement. With deep learning’s ability to model complex nonlinear relationships and process multimodal data, neural network-based fusion methods have become a powerful approach to improving localization accuracy while reducing dependence on traditional modeling assumptions.
The main contributions of this work are summarized as follows:
(1)
We propose a neural network-based end-to-end learning strategy to replace traditional filtering methods. Specifically, the xLSTM model is employed to extract time-series features from multimodal sensor data, capturing both short-term and long-term dependencies in temporal dynamics, thereby enhancing fusion modeling capability.
(2)
A residual fusion module and an enhanced attention mechanism are introduced to achieve effective feature-level fusion of UWB ranging data, acceleration signals, and heading angles. This approach compensates for the limitations of single-sensor systems in terms of accuracy and stability.
(3)
Comprehensive experimental evaluations are conducted in complex real-world indoor environments, including scenarios with static and dynamic obstacles. The proposed method is compared with traditional and neural network-based fusion approaches in terms of localization accuracy and system robustness.
The remainder of this paper is organized as follows: Section 2 reviews the technical approaches and related research in indoor localization, and provides a detailed description of the proposed multi-sensor fusion-based localization system. Section 3 presents the experimental implementation and results, followed by an evaluation of the performance and stability of the proposed method. Finally, Section 4 concludes the paper and discusses future research directions.

2. Materials and Methods

2.1. UWB Ranging Principle

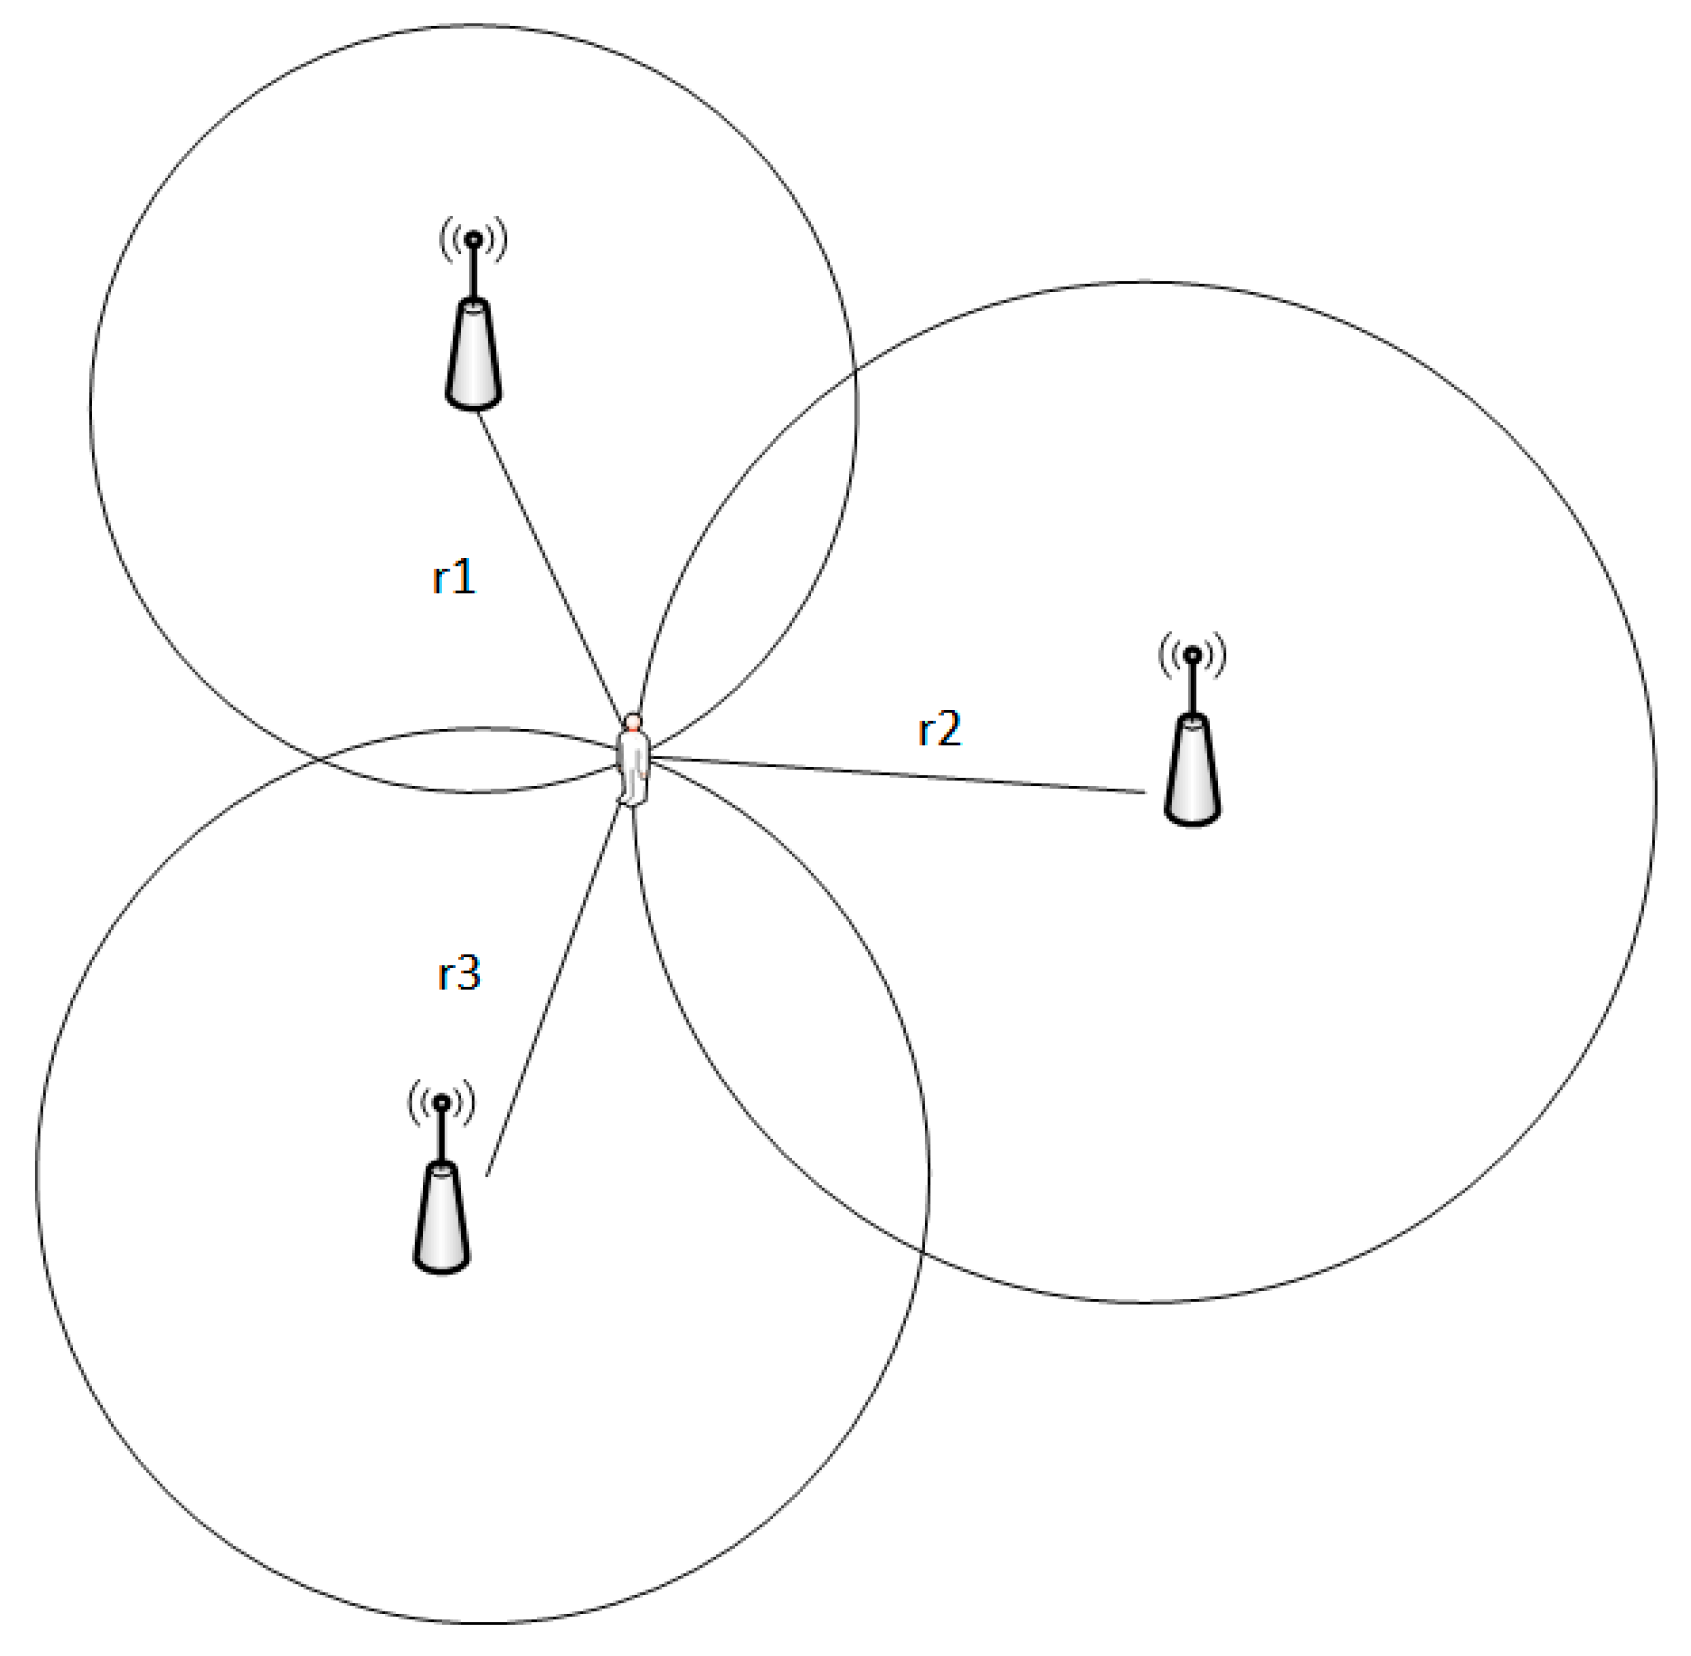
In this experiment, a time-of-arrival (TOA)-based localization method is employed to estimate the point-to-point distance between the tag and the base station by measuring the time of flight of the wireless signal through the air. The localization principle is illustrated in Figure 1.
As shown in Figure 1, the localization principle is based on the time-of-arrival (TOA) method. The tag transmits a wireless signal, which is received by multiple base stations at different times due to varying distances. The circles in the figure represent the range measurements from each base station to the tag, and their intersection corresponds to the estimated tag position. Based on the figure, Equation (1) can be formulated as follows:
{ ( x 1 x ) 2 + ( y 1 y ) 2 = r 1 2 ( x 2 x ) 2 + ( y 2 y ) 2 = r 2 2 ( x 3 x ) 2 + ( y 3 y ) 2 = r 3 2
Here, ( x i , y i ) denotes the coordinates of the i -th base station, ( x , y ) represents the coordinates of the unknown tag position, and r i is the measured distance between the tag and the i base station. Expanding the quadratic terms in Equation (1) yields
x i 2 + y i 2 + x 2 + y 2 2 x i x 2 y i y = r i 2
To simplify the expressions, it is assumed that K i = x i 2 + y i 2 and R = x 2 + y 2 , and then Equation (2) can be rewritten as
r i 2 K i = 2 x i x 2 y i y + R
For i = 1, 2, 3, Equation (3) leads to the following matrix form:
[ r 1 2 K 1 r 2 2 K 2 r 3 2 k 3 ] = [ 2 x 1 2 y 1 1 2 x 2 2 y 2 1 2 x 3 2 y 3 1 ] [ x y R ]
From the system of equations in Equation (4), the coordinates (x, y) can be found.
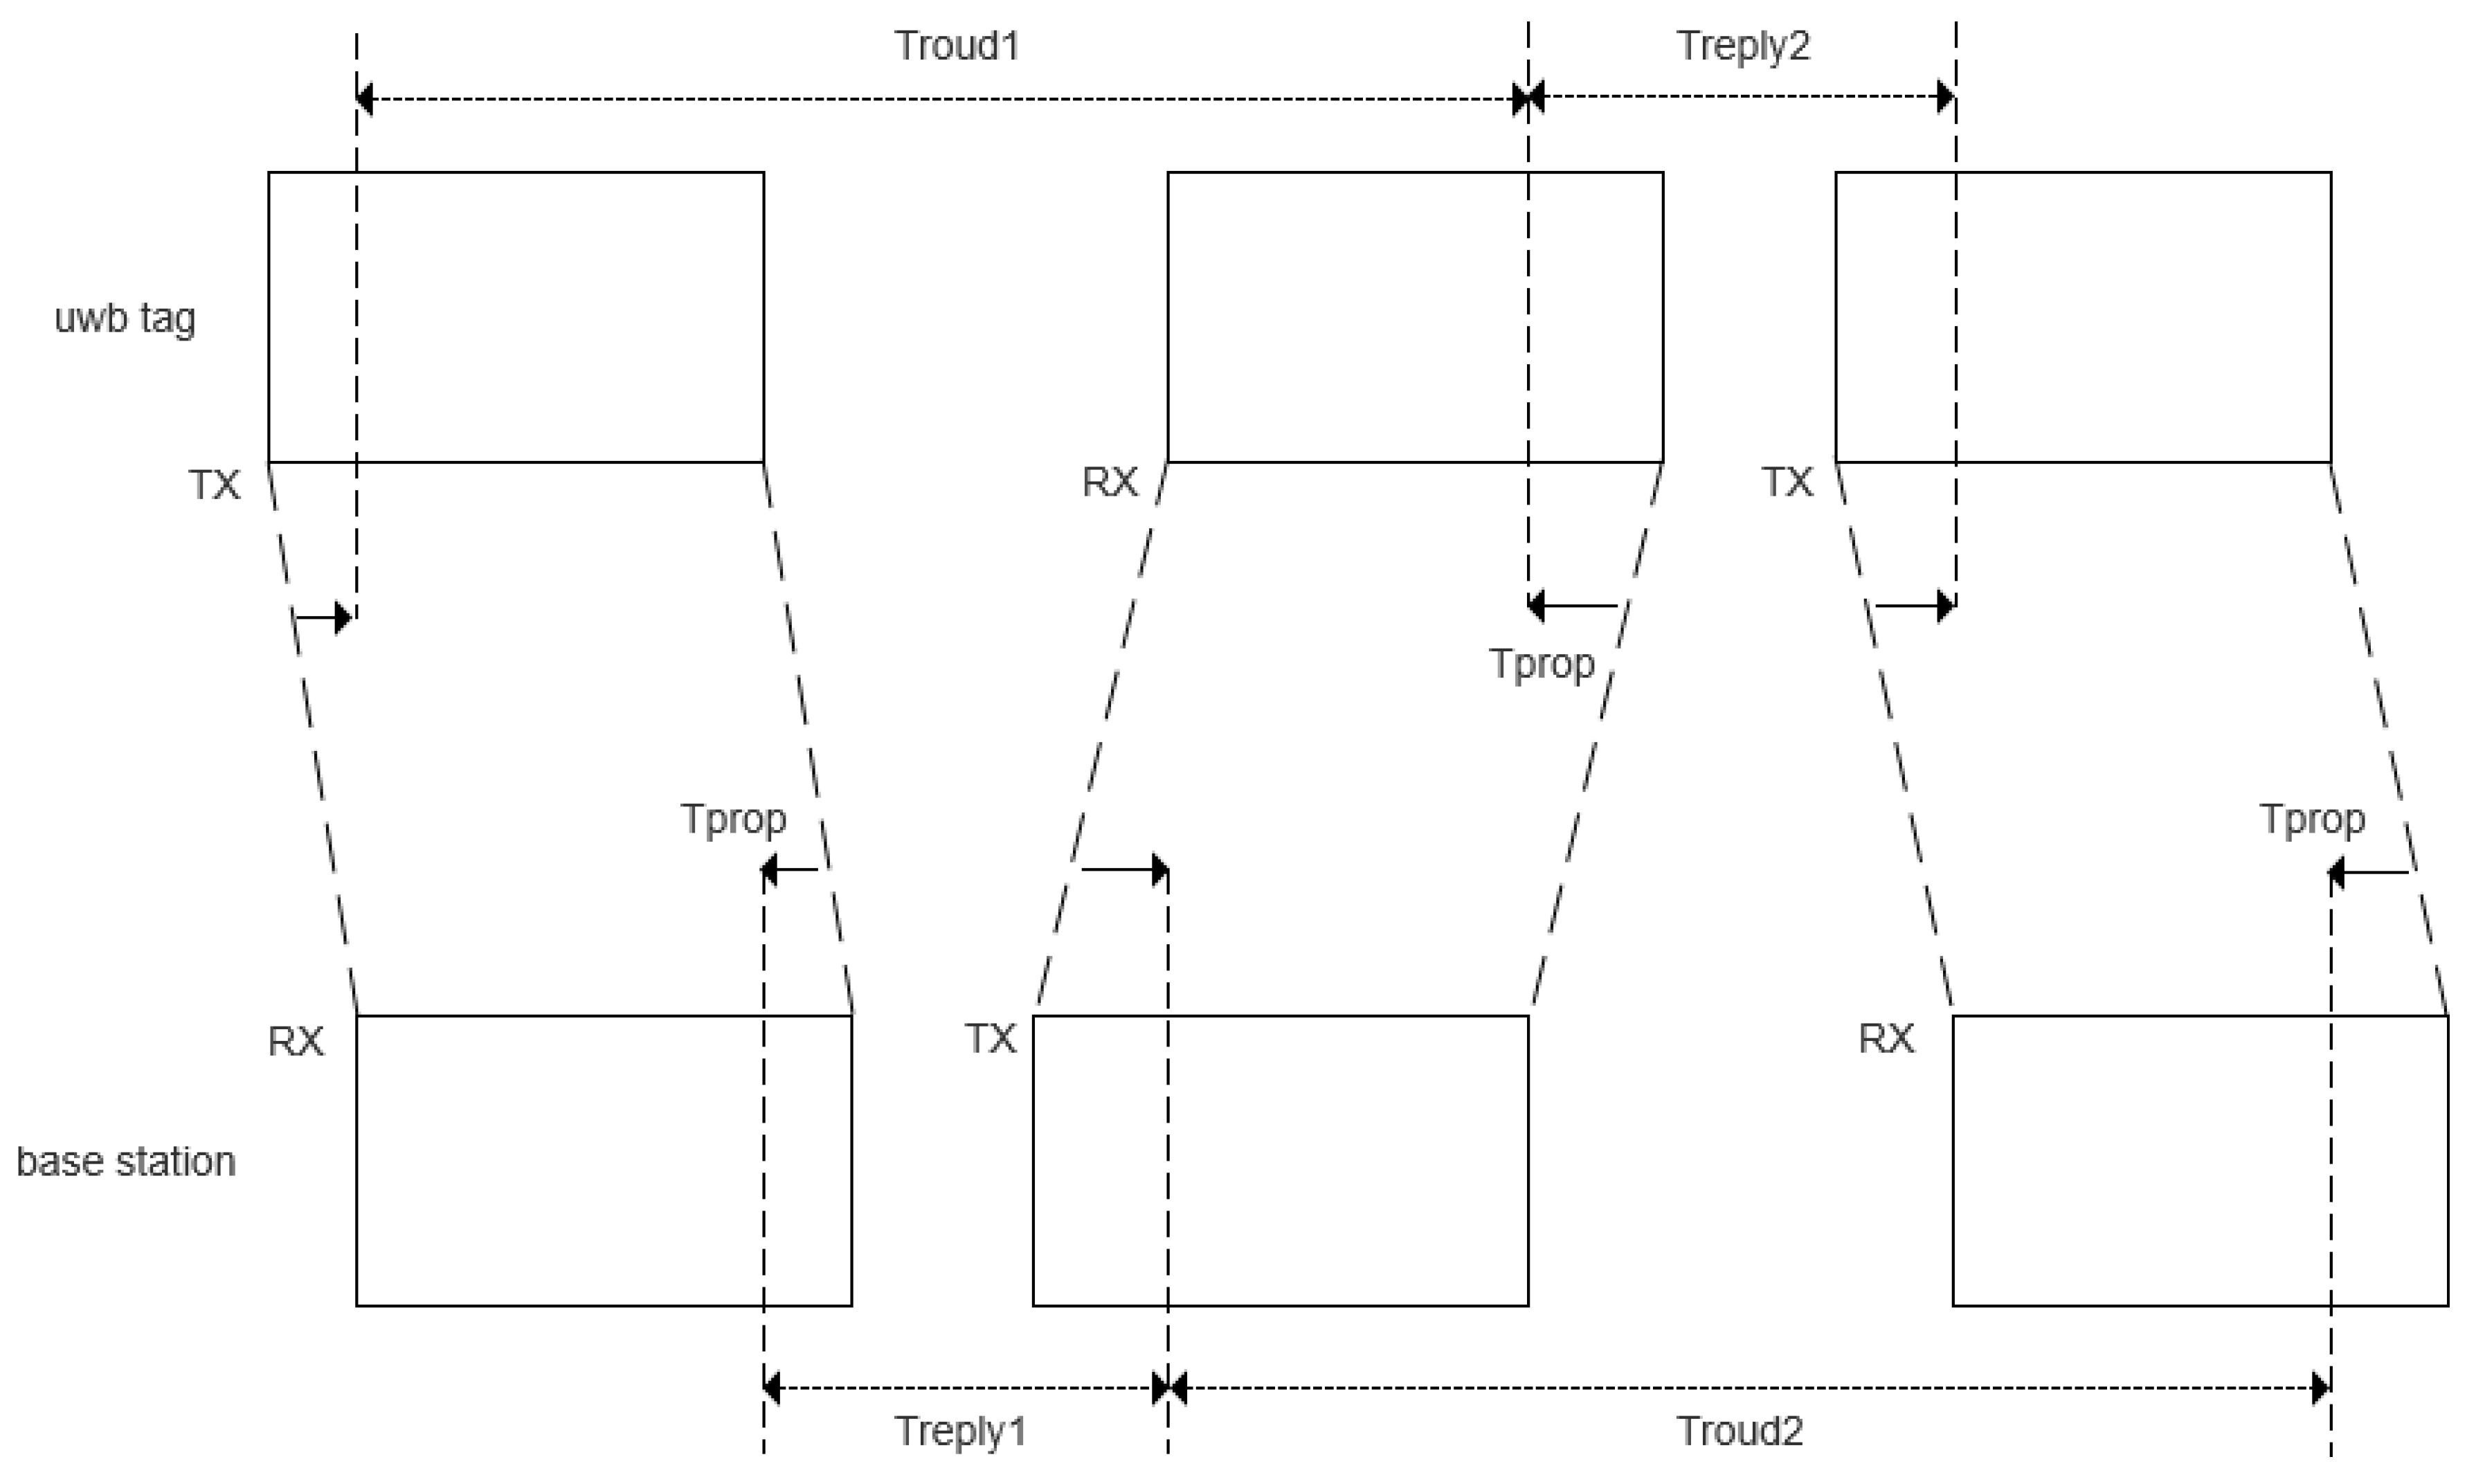
This scheme only needs the timestamps of each time point in the ranging process, and then the signal transmission time TOF can be calculated based on the difference of the timestamps, but due to the influence of the base station and tag clock independence, the result of directly calculating TOF will lead to a large ranging error, so the SDS-TWR algorithm is used to solve the distance based on TOA; the principle is shown in Figure 2.
The bilateral bidirectional ranging flight time is as follows:
  • Step 1: The tag sends an rng message to the base station and records this timestamp t r n g , t x based on the base station registry obtained during the search phase, and opens the reception.
  • Step 2: The base station in the listening state receives an rng message from a tag, records this timestamp t r n g , r x , and then replies to the tag with an res message timestamped t r e s , t x and opens reception.
  • Step 3: The tag receives the res message and records the timestamp t r e s , r x , fills the packet with t r n g , t x , t r e s , r x and t f i n , t x to send the finish message, and then enters the next ranging cycle.
  • Step 4: The base station receives the fin message to record the timestamp t f i n , r x and performs unpacking to obtain the timestamp of each point to calculate the distance.
As can be seen in Figure 2,
T r o u n d 1 = T r e p l y 1 + 2 T p r o p
  T r o u n d 2 = T r e p l y 2 + 2 T p r o p
can be obtained from Equations (5) and (6).
T r o u n d 1 × T r o u n d 2 T r e p l y 1 × T r e p l y 2 = 4 T p r o p 2 + 2 T p o r p × T r e p l y 1 + 2 T p r o p × T r e p l y 2
T r o u n d 1 + T r o u n d 2 + T r e p l y 1 + T r e p l y 2 = 4 T p r o p + 2 T r e p l y 1 + 2 T r e p l y 2
The flight time can be introduced from Equations (7) and (8).
T p r o p = T r o u n d 1 × T r o u n d 2 T r e p l y 1 × T r e p l y 2 T r o u n d 1 + T r o u n d 2 + T r e p l y 1 + T r e p l y 2

2.2. Proposed Methodology

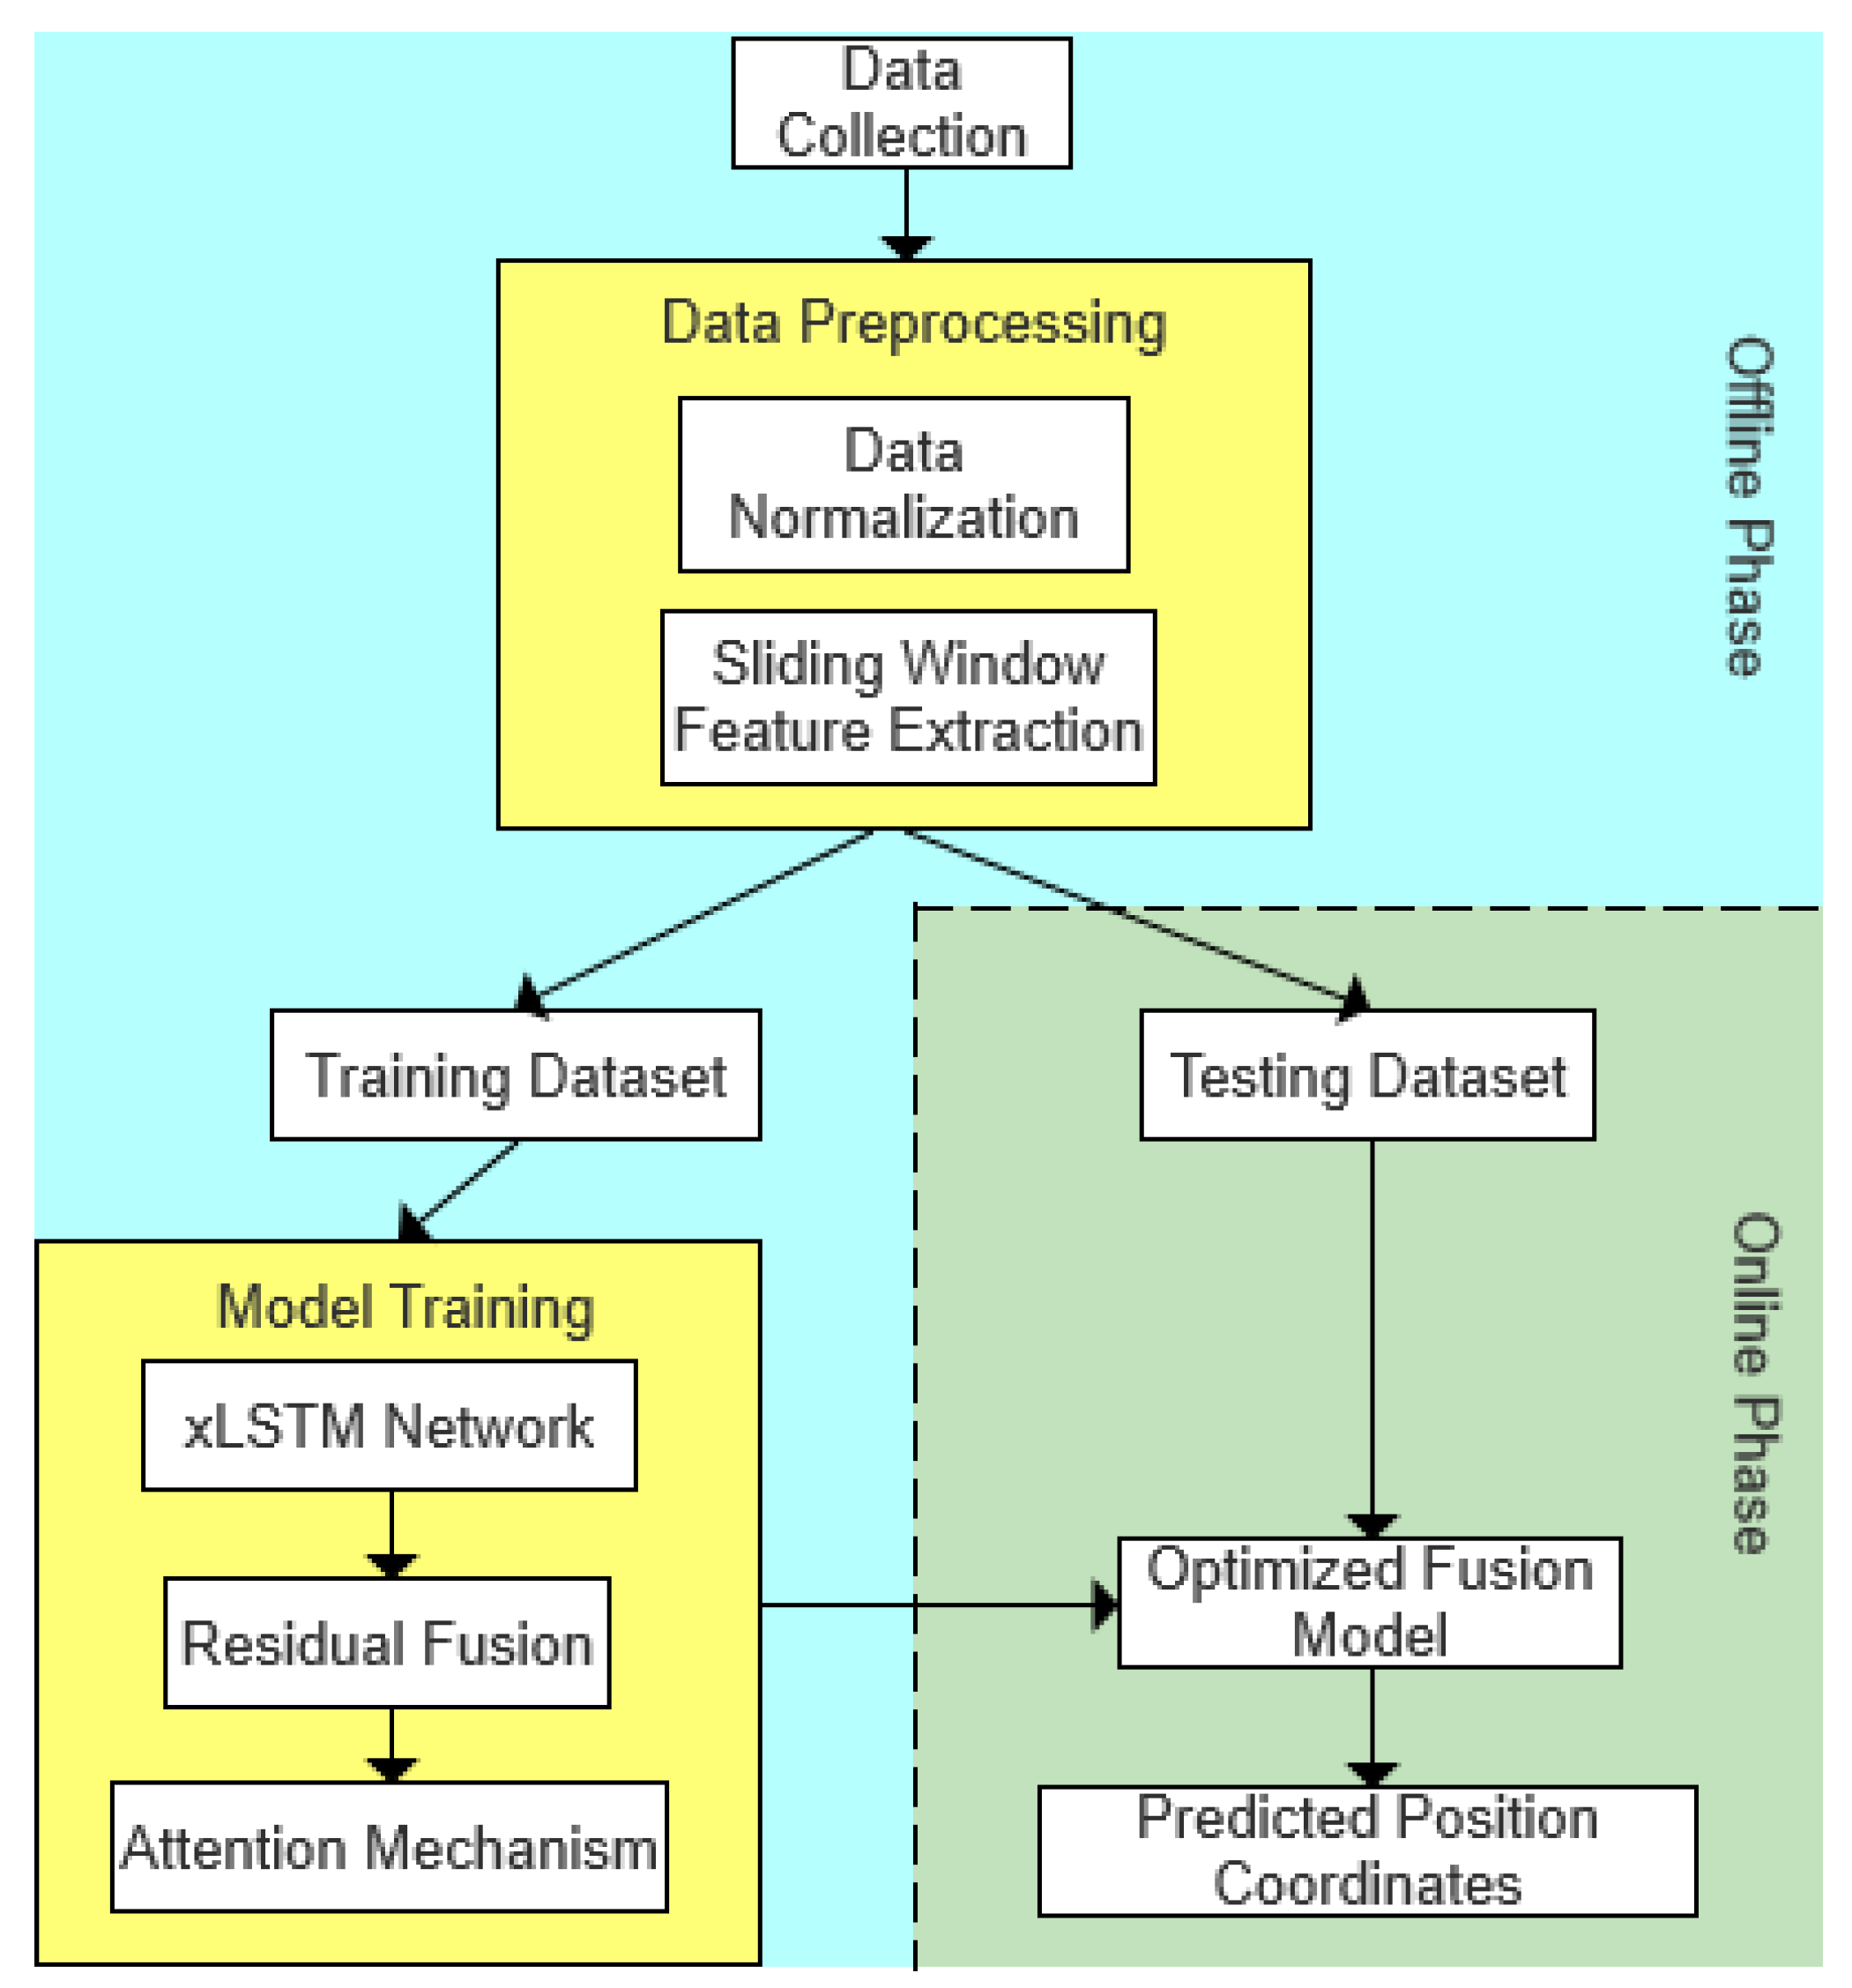
This paper proposes a multimodal-data-fusion-based positioning system that leverages the complementary strengths of UWB ranging, acceleration, and heading angle signals. The overall model architecture, illustrated in Figure 3, consists of an offline training phase and an online prediction phase. During the offline phase, statistical features—including the maximum, minimum, 25th percentile, and 50th percentile—are extracted from sliding windows applied to UWB, IMU acceleration, and heading angle data, following the approach described in [31]. The sliding window is set to 10 samples with a 50% overlap, and the data sampling rate is 16.67 Hz. These extracted features are then input into the xLSTM network for deep temporal feature learning. Subsequently, a residual fusion module and an attention-based fusion mechanism are incorporated to further enhance the feature representation, ultimately producing a robust model for accurate localization. In the online phase, the trained model is deployed to perform real-time localization predictions on streaming sensor data.
Meanwhile, the pseudocode illustrating the modification of the deep learning architecture is presented in Algorithm 1. The overall process is introduced here, while the detailed implementation of each module will be elaborated in the subsequent sections of this chapter.
Algorithm 1 Pseudocode of proposed multimodal positioning architecture.
Input: UWB data U, Acc data A, Angle data G, Target coordinates Y
Output: Predicted coordinates Y ^
1:Procedure MultiModal Localization Training
2: repeat
3:  Forward Propagation
4 :           U f     x L S T M g l o b a l (U)   Extract global feature extraction
5 :           A f     x L S T M l o c a l (A)     Extract local feature extraction
6 :           G f     x L S T M l o c a l (G)     Extract local feature extraction
7 :           U A     Concatenate   A f   and   G f   for   joint   local   feature   U A
8 :           U A r e s     Apply   residual   block   to   U A for enhanced local feature fusion
9 :           G l o b a l _ L o c a l f ← Apply cross-modality fusion:
10 :       Combine   U f   ( global )   with   U A r e s (local) via residual module
11 :         A t t e n t i o n f     Apply   Enhanced   Semantic   Attention   Module   to   G l o b a l _ L o c a l f
12 :         K A N o u t     Pass   A t t e n t i o n f through KANLinear layer for coordinate prediction
13:     Backward Propagation
14:     Loss ← Compute L( Y ^ ,Y) using MSELoss
15:     Conduct backward pass to compute gradients
16:     Update weights and biases using Adam optimizer
17:     Until training loss converges
18:     return Y ^
The system first collects ranging data from multiple UWB anchors using an efficient time-of-flight (ToF) method and applies a sliding window technique for temporal preprocessing. Simultaneously, acceleration and heading angle data are acquired from IMU sensors. Due to significant differences in dynamic characteristics and temporal dependencies among these three modalities, conventional LSTM networks often fail to effectively capture their distinct temporal patterns, resulting in suboptimal fusion performance. To address this limitation, a three-branch xLSTM network is designed to independently model the temporal sequences of UWB, acceleration, and heading angle data. This architecture preserves the unique dynamic information of each modality while simultaneously capturing both short-term and long-term dependencies, thereby enhancing the representational capacity for heterogeneous multimodal time-series data.
During multimodal feature fusion, simple concatenation or shallow fusion techniques fail to fully leverage the complementary information across modalities and are susceptible to noise interference. To overcome these limitations, a three-stage hierarchical residual fusion module composed of one-dimensional residual blocks (ResidualBlock1D) is proposed. This module progressively strengthens cross-modal interactions through its hierarchical structure and incorporates learnable modality transformation weights. These weights dynamically adjust the contribution of each modality based on its reliability and contextual relevance, thereby improving the quality and robustness of the fused features.
The fused features are further refined using an Enhanced Semantic Attention Module, which dynamically balances global spatial information from the UWB modality and local motion cues from the IMU modalities via multi-head cross-attention and self-attention mechanisms. This strategy not only harmonizes global and local spatial contexts but also enhances the discriminative capacity of the features, significantly improving the model’s localization accuracy and robustness in dynamic and occluded environments.
Finally, the enhanced multimodal features are mapped to the localization output through a Kernel-based Activation Network (KAN). The KAN is a novel neural activation mechanism first systematically introduced in [32]. Unlike traditional activation functions such as ReLU or GELU, the KAN replaces fixed-form activations with learnable kernel functions (e.g., B-spline interpolation), enabling flexible modeling of complex nonlinear relationships. This approach allows the network to better capture intricate dependencies within multimodal data, ultimately improving localization accuracy and generalization performance.
In summary, the proposed xLSTM module, hierarchical residual fusion structure, and enhanced semantic attention mechanism specifically address the challenges posed by heterogeneous multimodal time-series data. They respectively resolve issues related to temporal disparities across modalities, cross-modal information integration, and semantic feature enhancement, culminating in an efficient and robust framework for indoor localization feature extraction and fusion.

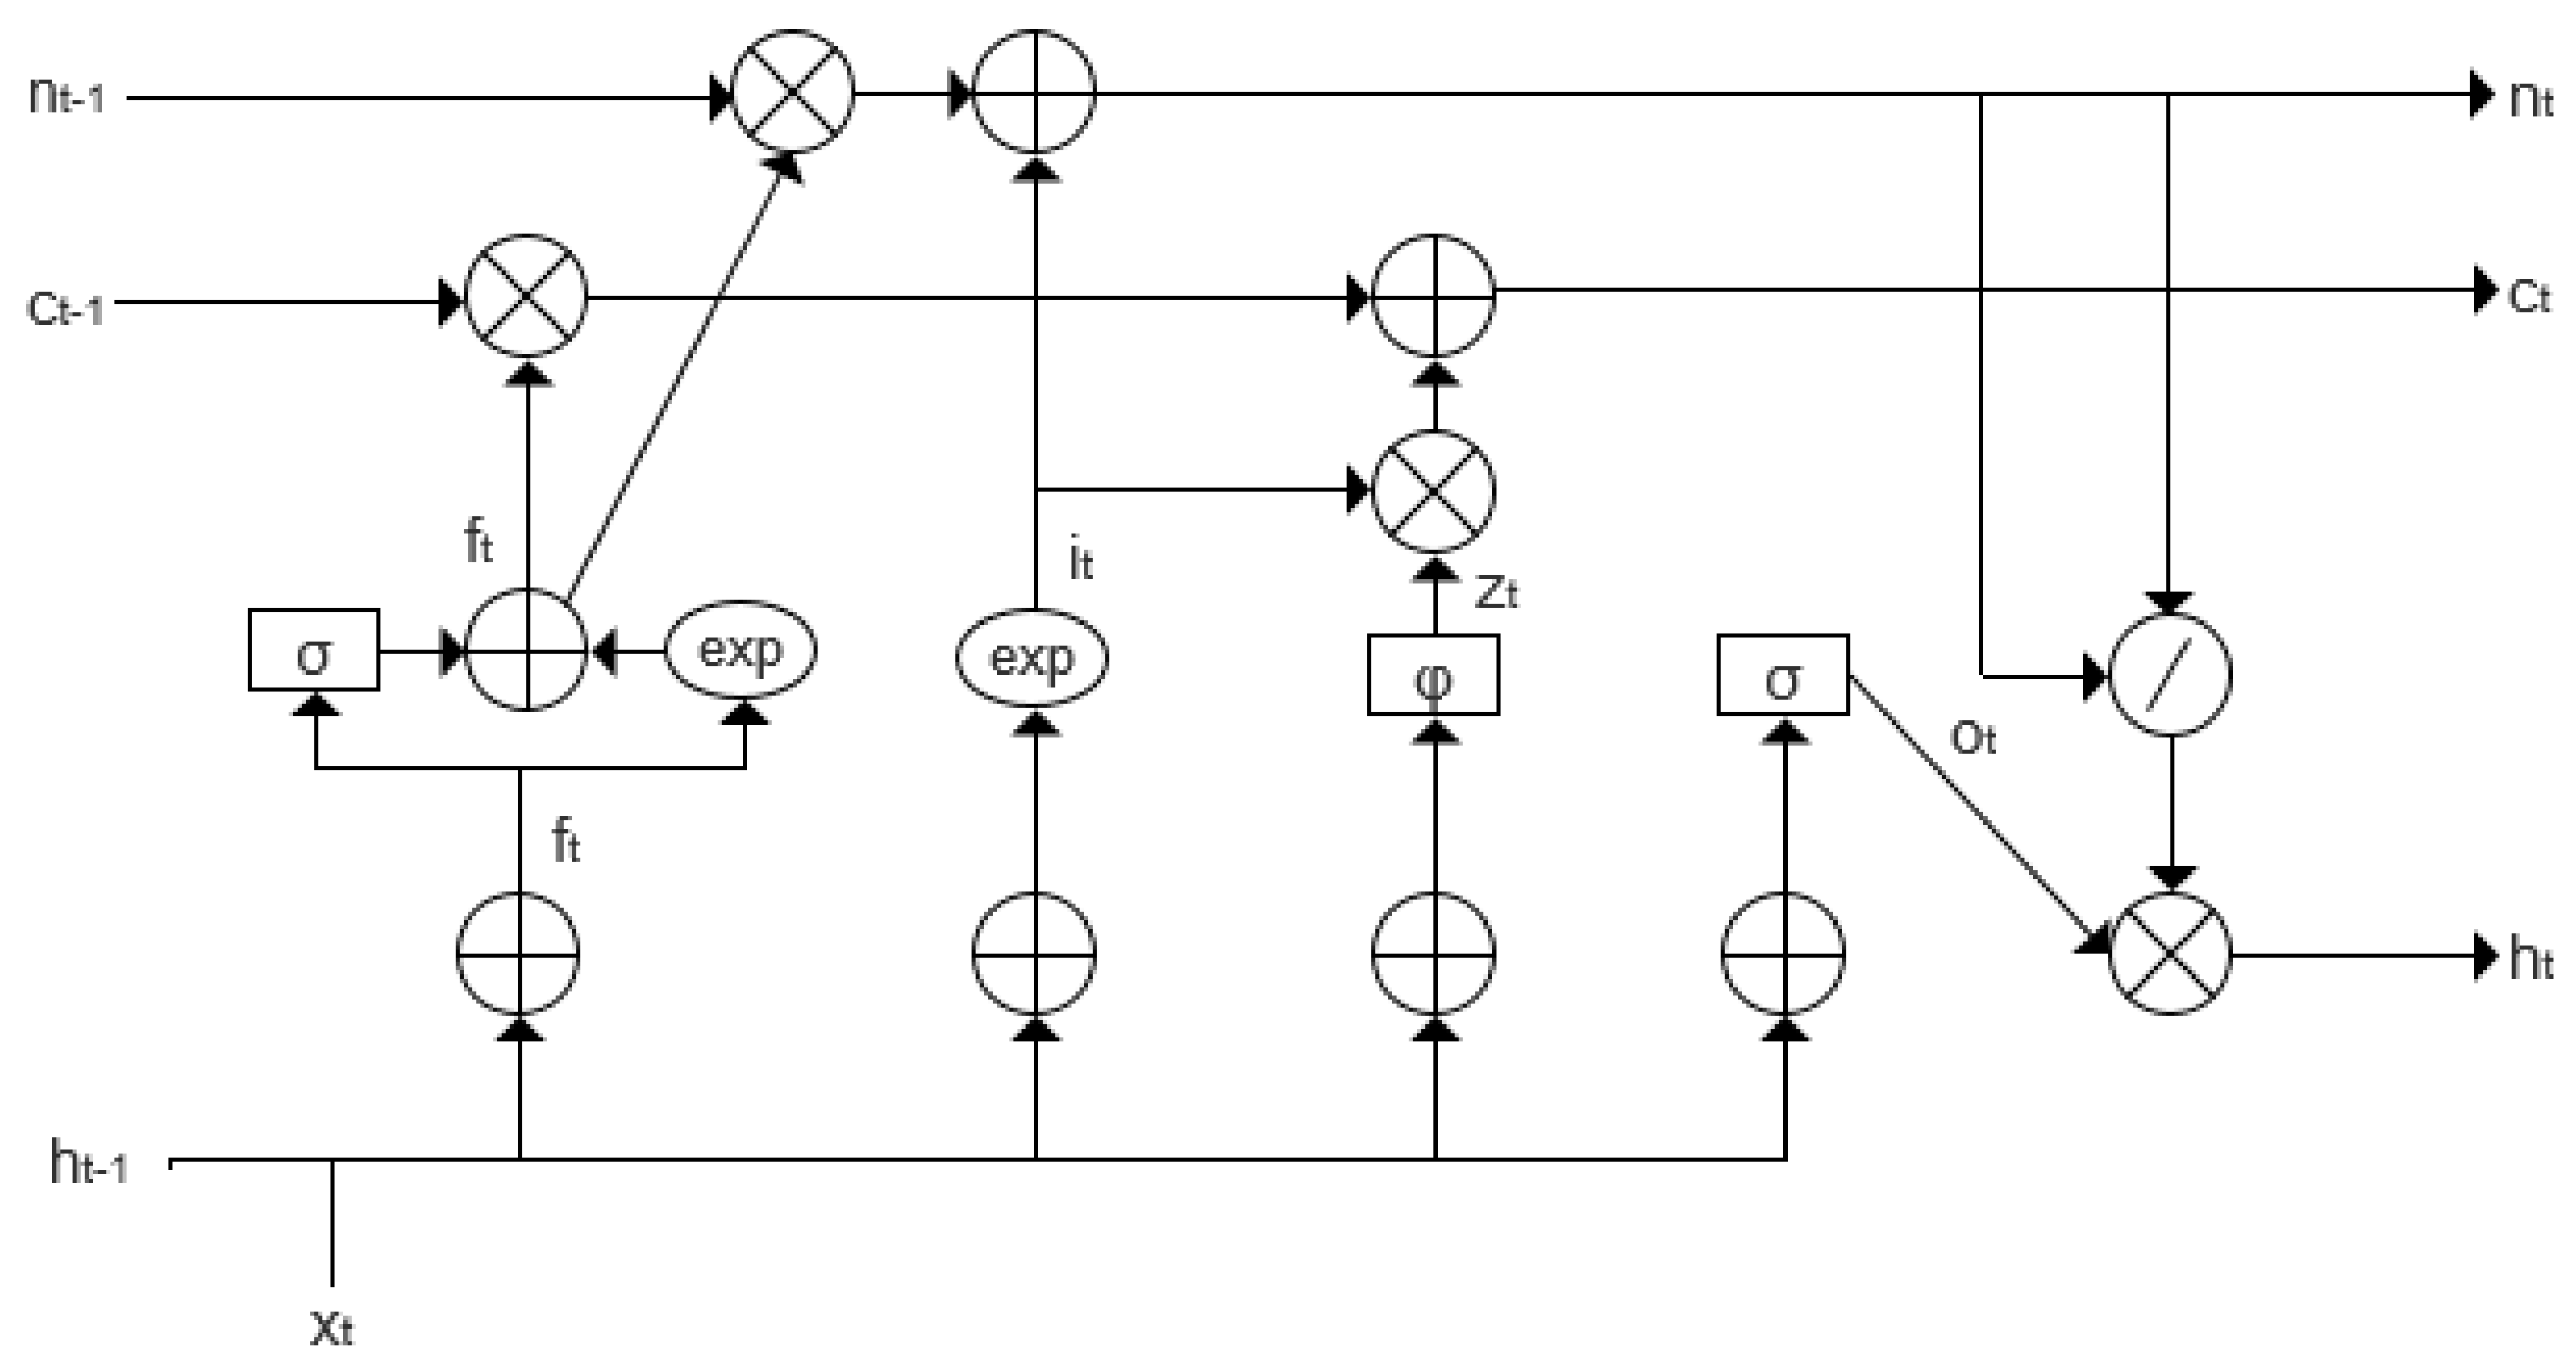
2.2.1. Application of xLSTM Network in Time-Series Feature Capture

The xLSTM network is constructed as a stacked combination of the Scalar LSTM (sLSTM) and Matrix LSTM (mLSTM) architectures, both of which were specifically designed to address limitations of the original LSTM network. The mathematical formulations of sLSTM and mLSTM are detailed in [33]. To enhance the LSTM’s ability to dynamically adjust memory storage decisions, the Scalar LSTM introduces several improvements over the conventional LSTM structure. The internal architecture of its basic computational unit is illustrated in Figure 4.
(1)
Introducing exponential gating, so that the input and forget gates have an exponential activation function.
(2)
Introducing the stabilization gate m t , which prevents the exponential activation function from leading to the overflow of values that are too large.
(3)
Introducing the normalized state, which acts similarly to the stabilization gate.
Unlike the standard LSTM, sLSTM adopts an exponential reparameterization for the input and forget gates:
i t = exp ( W i x t + r i h t 1 + b i )
f t = e x p ( W f x t + r f h t 1 + b f )
To suppress the numerical instability caused by exponential growth, a logarithmic-domain stabilizer is introduced:
m t = max ( log f t + m t 1 , log i t )
Based on this stabilizer, the input and forget gates are re-normalized as
i t = e x p ( log i t m t )
f t = e x p ( log f t + m t 1 m t )
The stabilized gates are then used to update the cell state and hidden state:
c t = f t · c t 1 + i t · z t
h t = o t · ( c t n t )
where z t denotes the cell input at time t, o t is the output gate, and n t is a learnable normalization factor used to suppress magnitude explosion.
This stabilized structure significantly mitigates gradient vanishing and explosion in long-sequence modeling, thereby improving the training stability and generalization ability of the model in temporal dependency tasks.
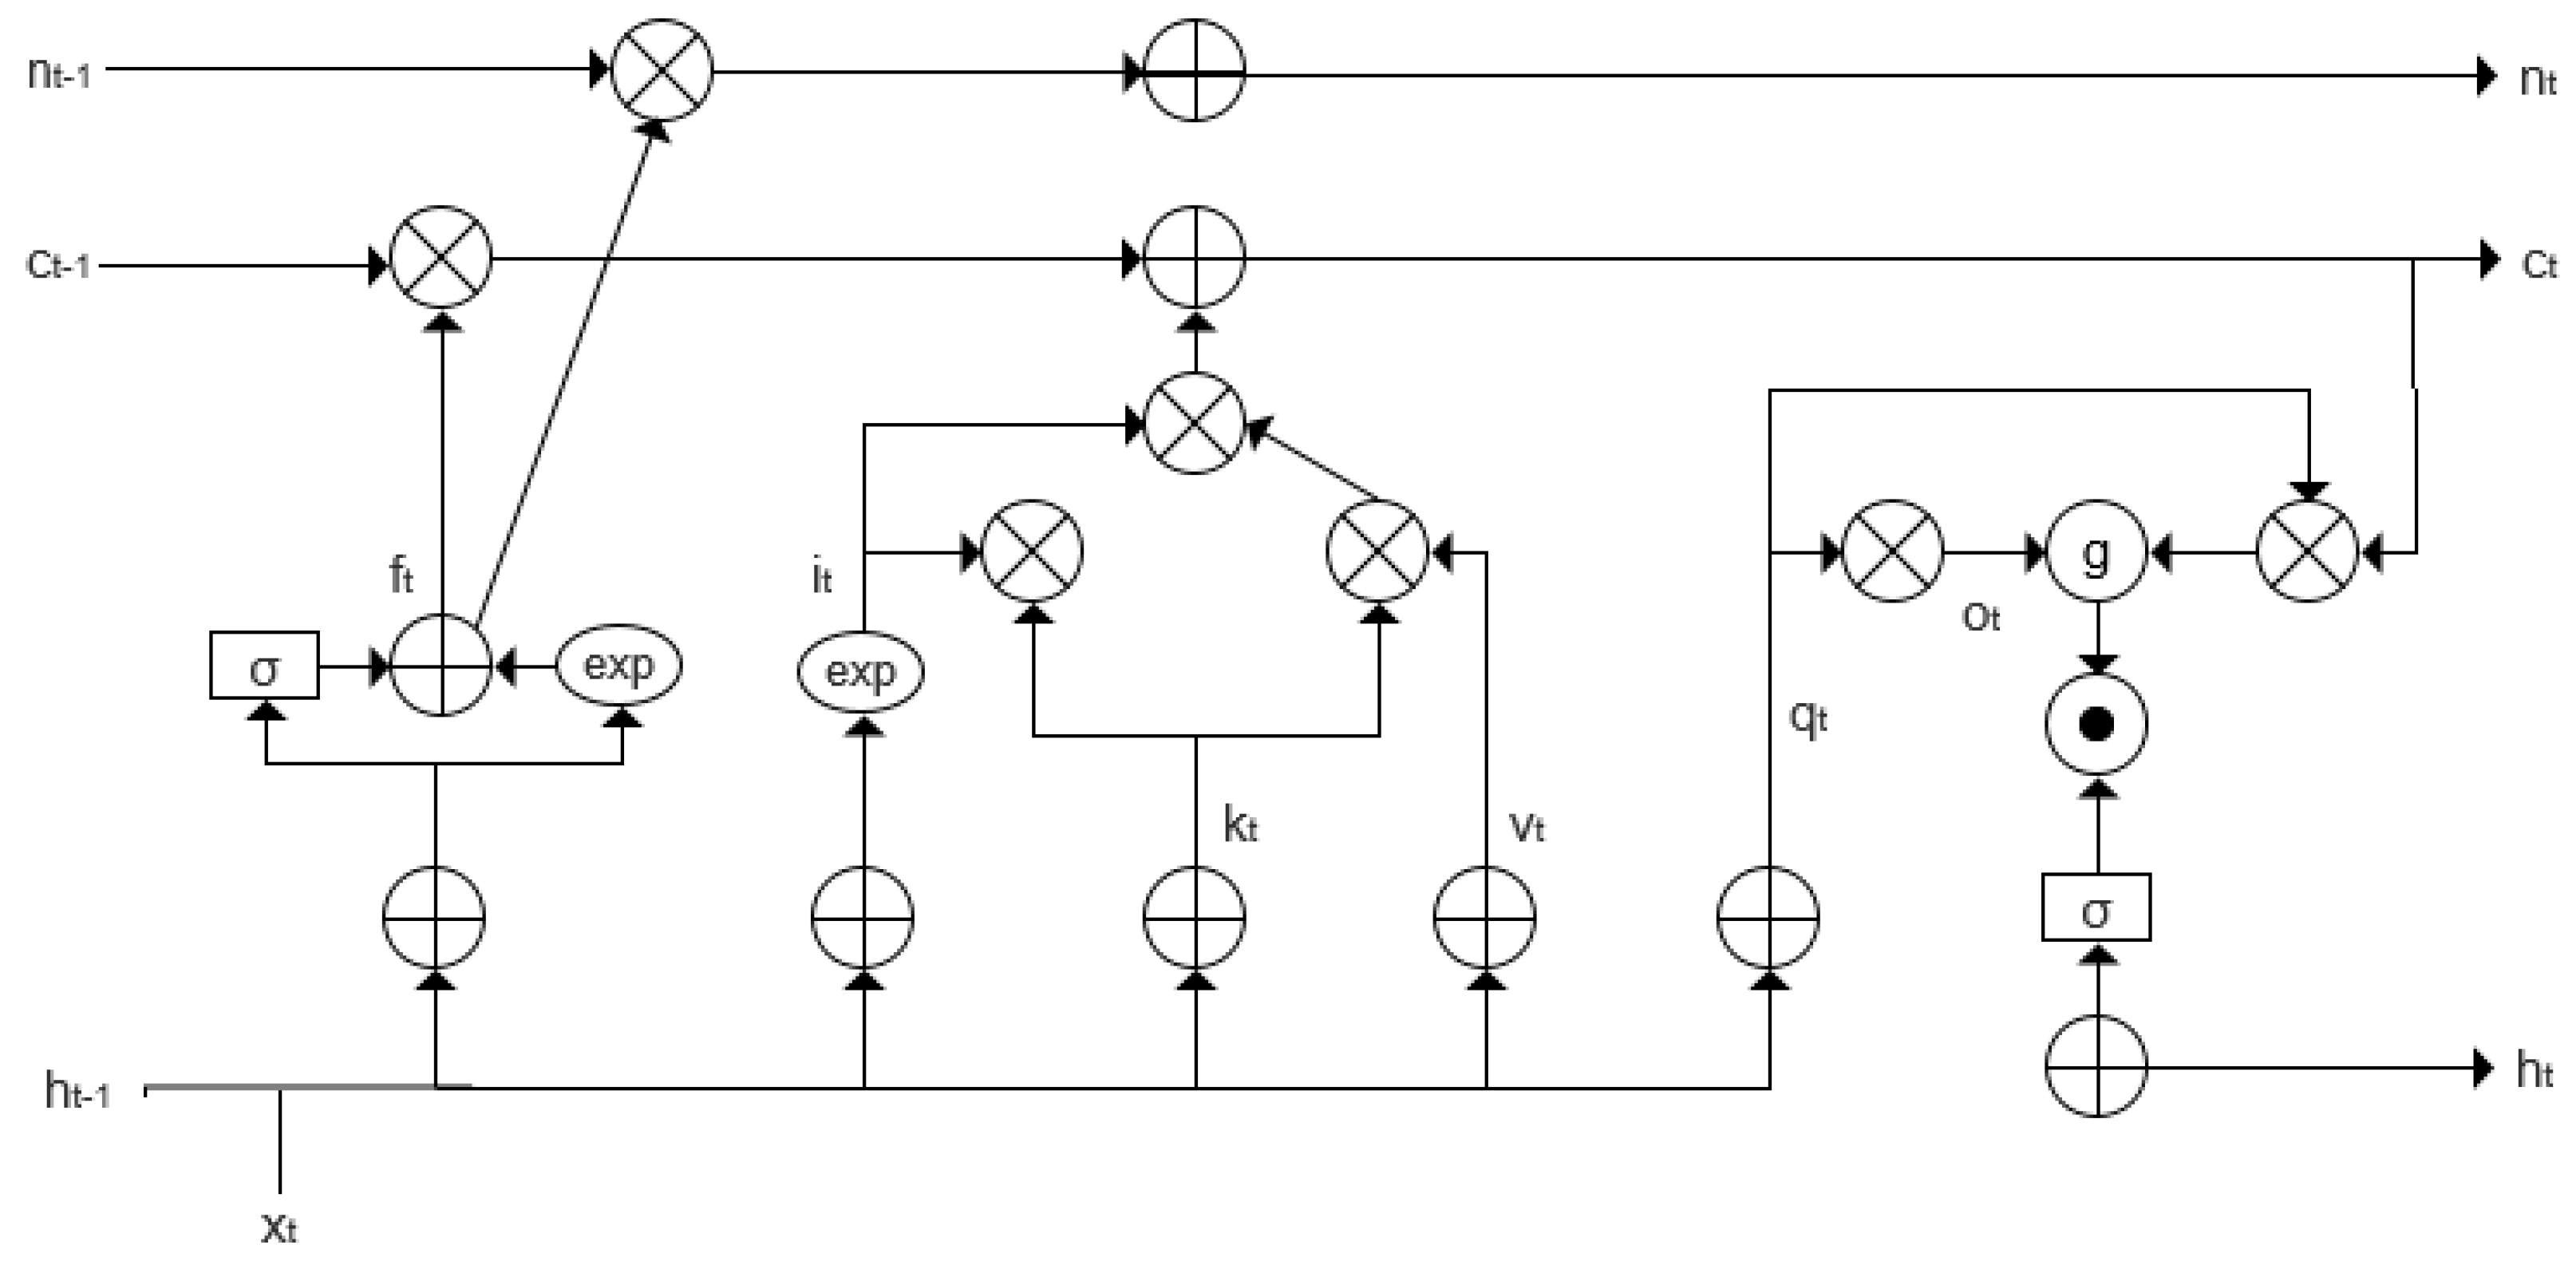
To enhance the storage capacity of the LSTM network, Matrix LSTM (mLSTM) introduces several improvements over the standard LSTM architecture. The internal structure of its basic computational unit is depicted in Figure 5.
(1)
Increasing the memory unit from scalar to matrix, and also introducing the covariance update mechanism for key–value pair storage.
(2)
Using the same stabilization gate mt as slstm to prevent the exponential activation function from leading to the overflow of values that are too large.
Specifically, the input feature x t is mapped to the query, key, and value vectors as shown in Equations (17)–(19).
q t = W q x t + b q
  k t = 1 d W k x t + b k
v t = W v x t + b v
Similar to sLSTM, a stabilizer state m t is introduced to rescale the input and forget gates. Finally, the hidden state h t is determined by the output gate and the normalized attention weights, as shown in Equation (20).
h t = o t ( C t · q t m a x { n t q t , 1 } )
The matrices W q , W k , W v and the bias vectors b q , b k , b v are the linear projection parameters for the query, key, and value vectors, respectively. The memory matrix is represented as C t , and the normalization vector is denoted by n t .
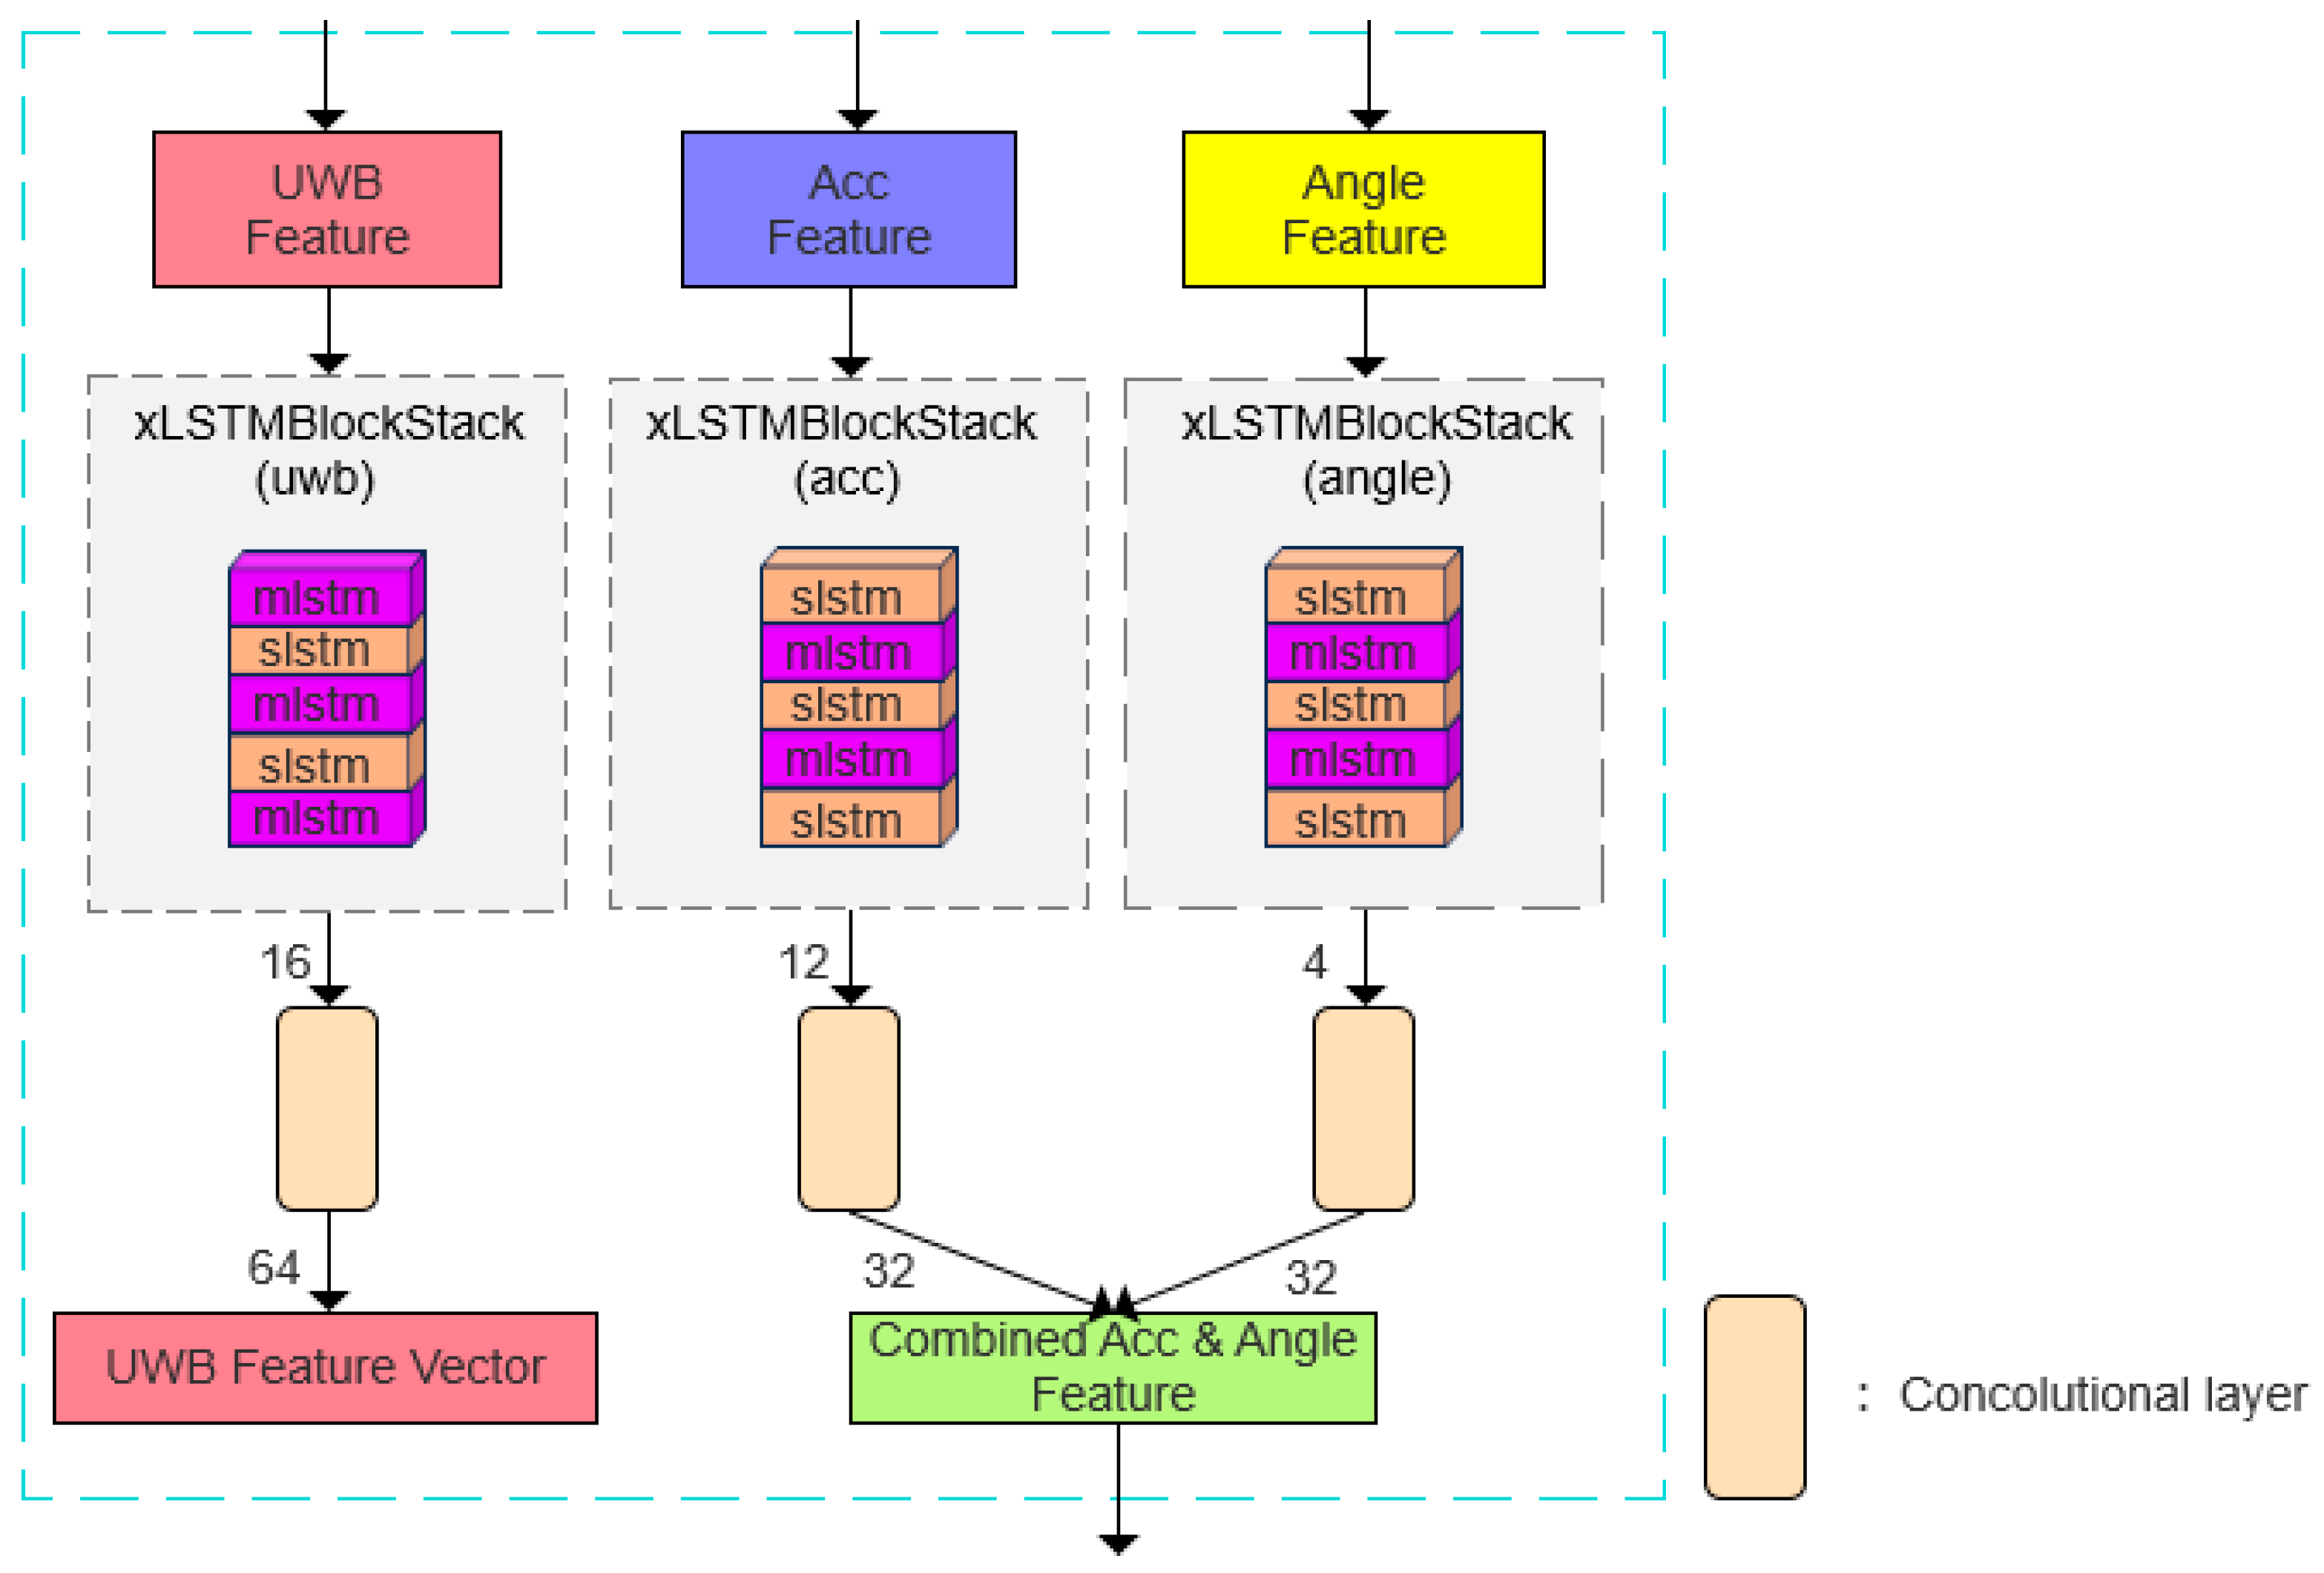
The xLSTM architecture not only alleviates the common issues of gradient vanishing and information loss encountered by traditional LSTM networks in long-sequence modeling but also provides distinct structural advantages for processing multi-sensor data. It employs a flexible stacking configuration comprising Scalar LSTM (sLSTM) and Matrix LSTM (mLSTM) units, enabling parallel modeling and differentiated feature extraction across multiple modality-specific data channels. By leveraging the temporal characteristics of various sensor inputs, xLSTM permits customization of the type and number of substructures for each modality, thereby achieving adaptive and effective modeling of heterogeneous time-series data. Moreover, the parallel architecture improves computational efficiency during the feature extraction stage. Consequently, following the extraction of basic statistical features, this study incorporates the xLSTM network for deep temporal feature learning and carefully designs its stacking configuration based on the characteristics of each data modality, as illustrated in Figure 6.
Specifically, the sLSTM layers for the UWB modality are positioned at the first and third layers, whereas the sLSTM layers for the IMU modalities—namely acceleration and heading angle—are assigned to the zeroth, second, and fourth layers. At the end of each modality branch, a one-dimensional convolutional layer with a kernel size of four is applied to extract localized temporal patterns. In the UWB branch, the convolutional output is expanded to sixteen channels and subsequently projected into a sixty-four-dimensional UWB feature vector. For the acceleration and heading angle branches, the outputs are compressed into thirty-two-dimensional vectors, which are then fused into a unified Combined Acceleration and Angle Feature. This hierarchical architecture substantially enhances the model’s capacity to capture complex temporal dependencies across heterogeneous sensor modalities.

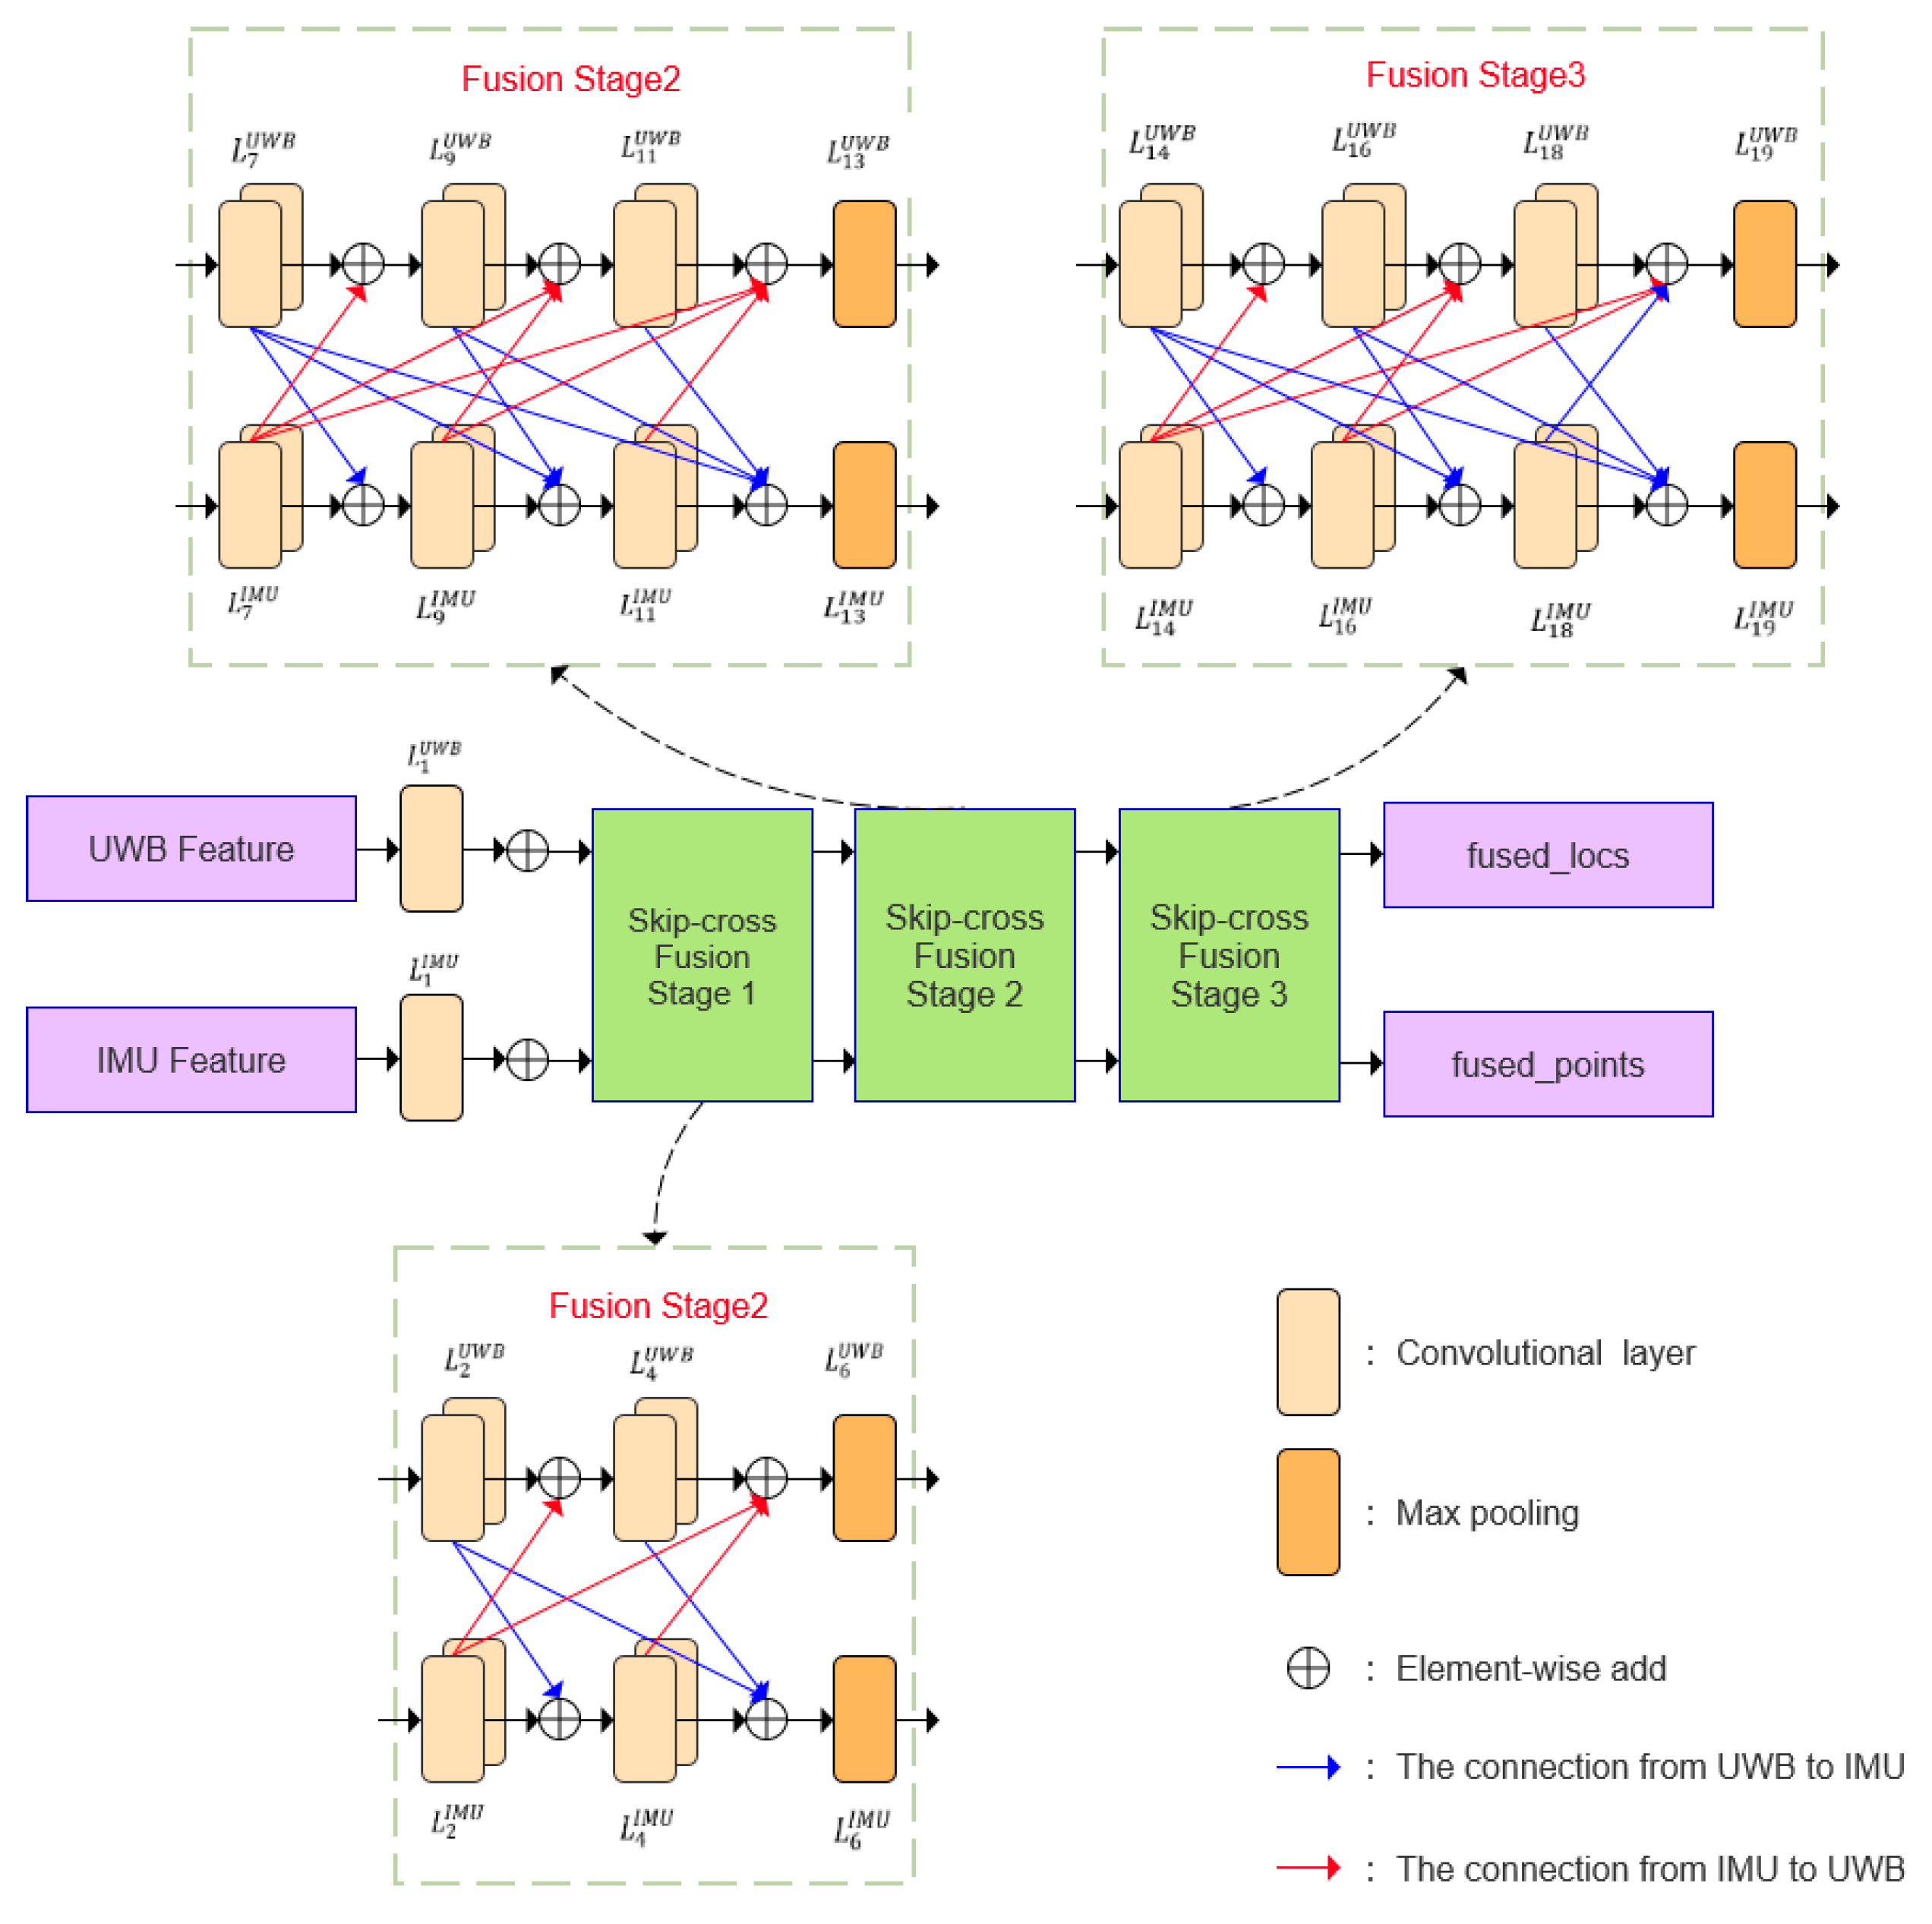
2.2.2. Residual Module for Data Fusion

To enhance the complementarity of information across different data modalities, a residual fusion module is employed for cross-modal integration of UWB and IMU features. The inputs to this module are the temporal features extracted from the respective xLSTMBlockStack branches. These features are initially expanded via convolutional layers into higher-dimensional representations, denoted as L i U W B and L i I M U , where the superscript indicates the modality and the subscript represents the layer index within each fusion stage. The overall fusion process consists of three stages—early fusion, intermediate fusion, and late fusion—implemented as Skip-cross Fusion Stages 1, 2, and 3, respectively. Each stage contains a residual fusion block that applies multi-scale convolutional processing to extract rich temporal representations from both UWB and IMU inputs. Specifically, each fusion unit employs parallel one-dimensional convolution kernels with sizes W 3 × 3 , W 5 × 5 , W 7 × 7 to capture features across multiple receptive fields, as detailed in Equation (21).
out 3 × 3 = W 3 × 3 r e s i d u a l ,   out 5 × 5 = W 5 × 5 r e s i d u a l , out 7 × 7 = W 7 × 7 r e s i d u a l
The obtained multiscale convolution results are summed and processed with batch normalization and activation function to obtain the output as shown in Equation (22).
o u t = R e L U ( B N ( out 3 × 3 + out 5 × 5 + out 7 × 7 ) + r e s i d u a l )
The primary fusion stage utilizes a two-layer multiscale convolutional residual block to process UWB and IMU features, whereas the intermediate and late fusion stages employ three-layer multiscale convolutional residual blocks to progressively strengthen interactions among different features. Furthermore, fusion weights at each stage are dynamically generated by a weight generator, which optimizes the weighted fusion to balance the complementary information from various sensors. Specifically, the dynamic weight generator calculates weights based on the average values of each feature, allowing effective regulation of the weighted fusion across diverse feature sources and enhancing overall fusion performance. In the interaction diagram, red dashed lines indicate information flow from UWB to IMU, while blue dashed lines represent information flow from IMU to UWB. Finally, the module outputs the fused feature vectors, l o c s f u s i o n and p o i n t f u s i o n , as defined in Equations (23) and (24).
l o c s f u s i o n = l o c s o u t + p o i n t t o   l o c s
p o i n t f u s i o n = p o i n t o u t + l o c s t o   p o i n t
They primarily retain the information from the positional feature source (UWB data) and the local feature source (IMU data, including acceleration and heading angle), respectively. Here, l o c s o u t and p o i n t o u t denote the outputs after processing through the residual block, while p o i n t t o   l o c s and l o c s t o   p o i n t represent the results obtained after the application of the learnable weight matrix. The residual fusion module plays a critical role in cross-modal information integration within the proposed model. It is specifically designed to generate more representative global and local features, which serve as enriched inputs for the subsequent attention mechanism. The detailed data processing flow of this module is illustrated in Figure 7.

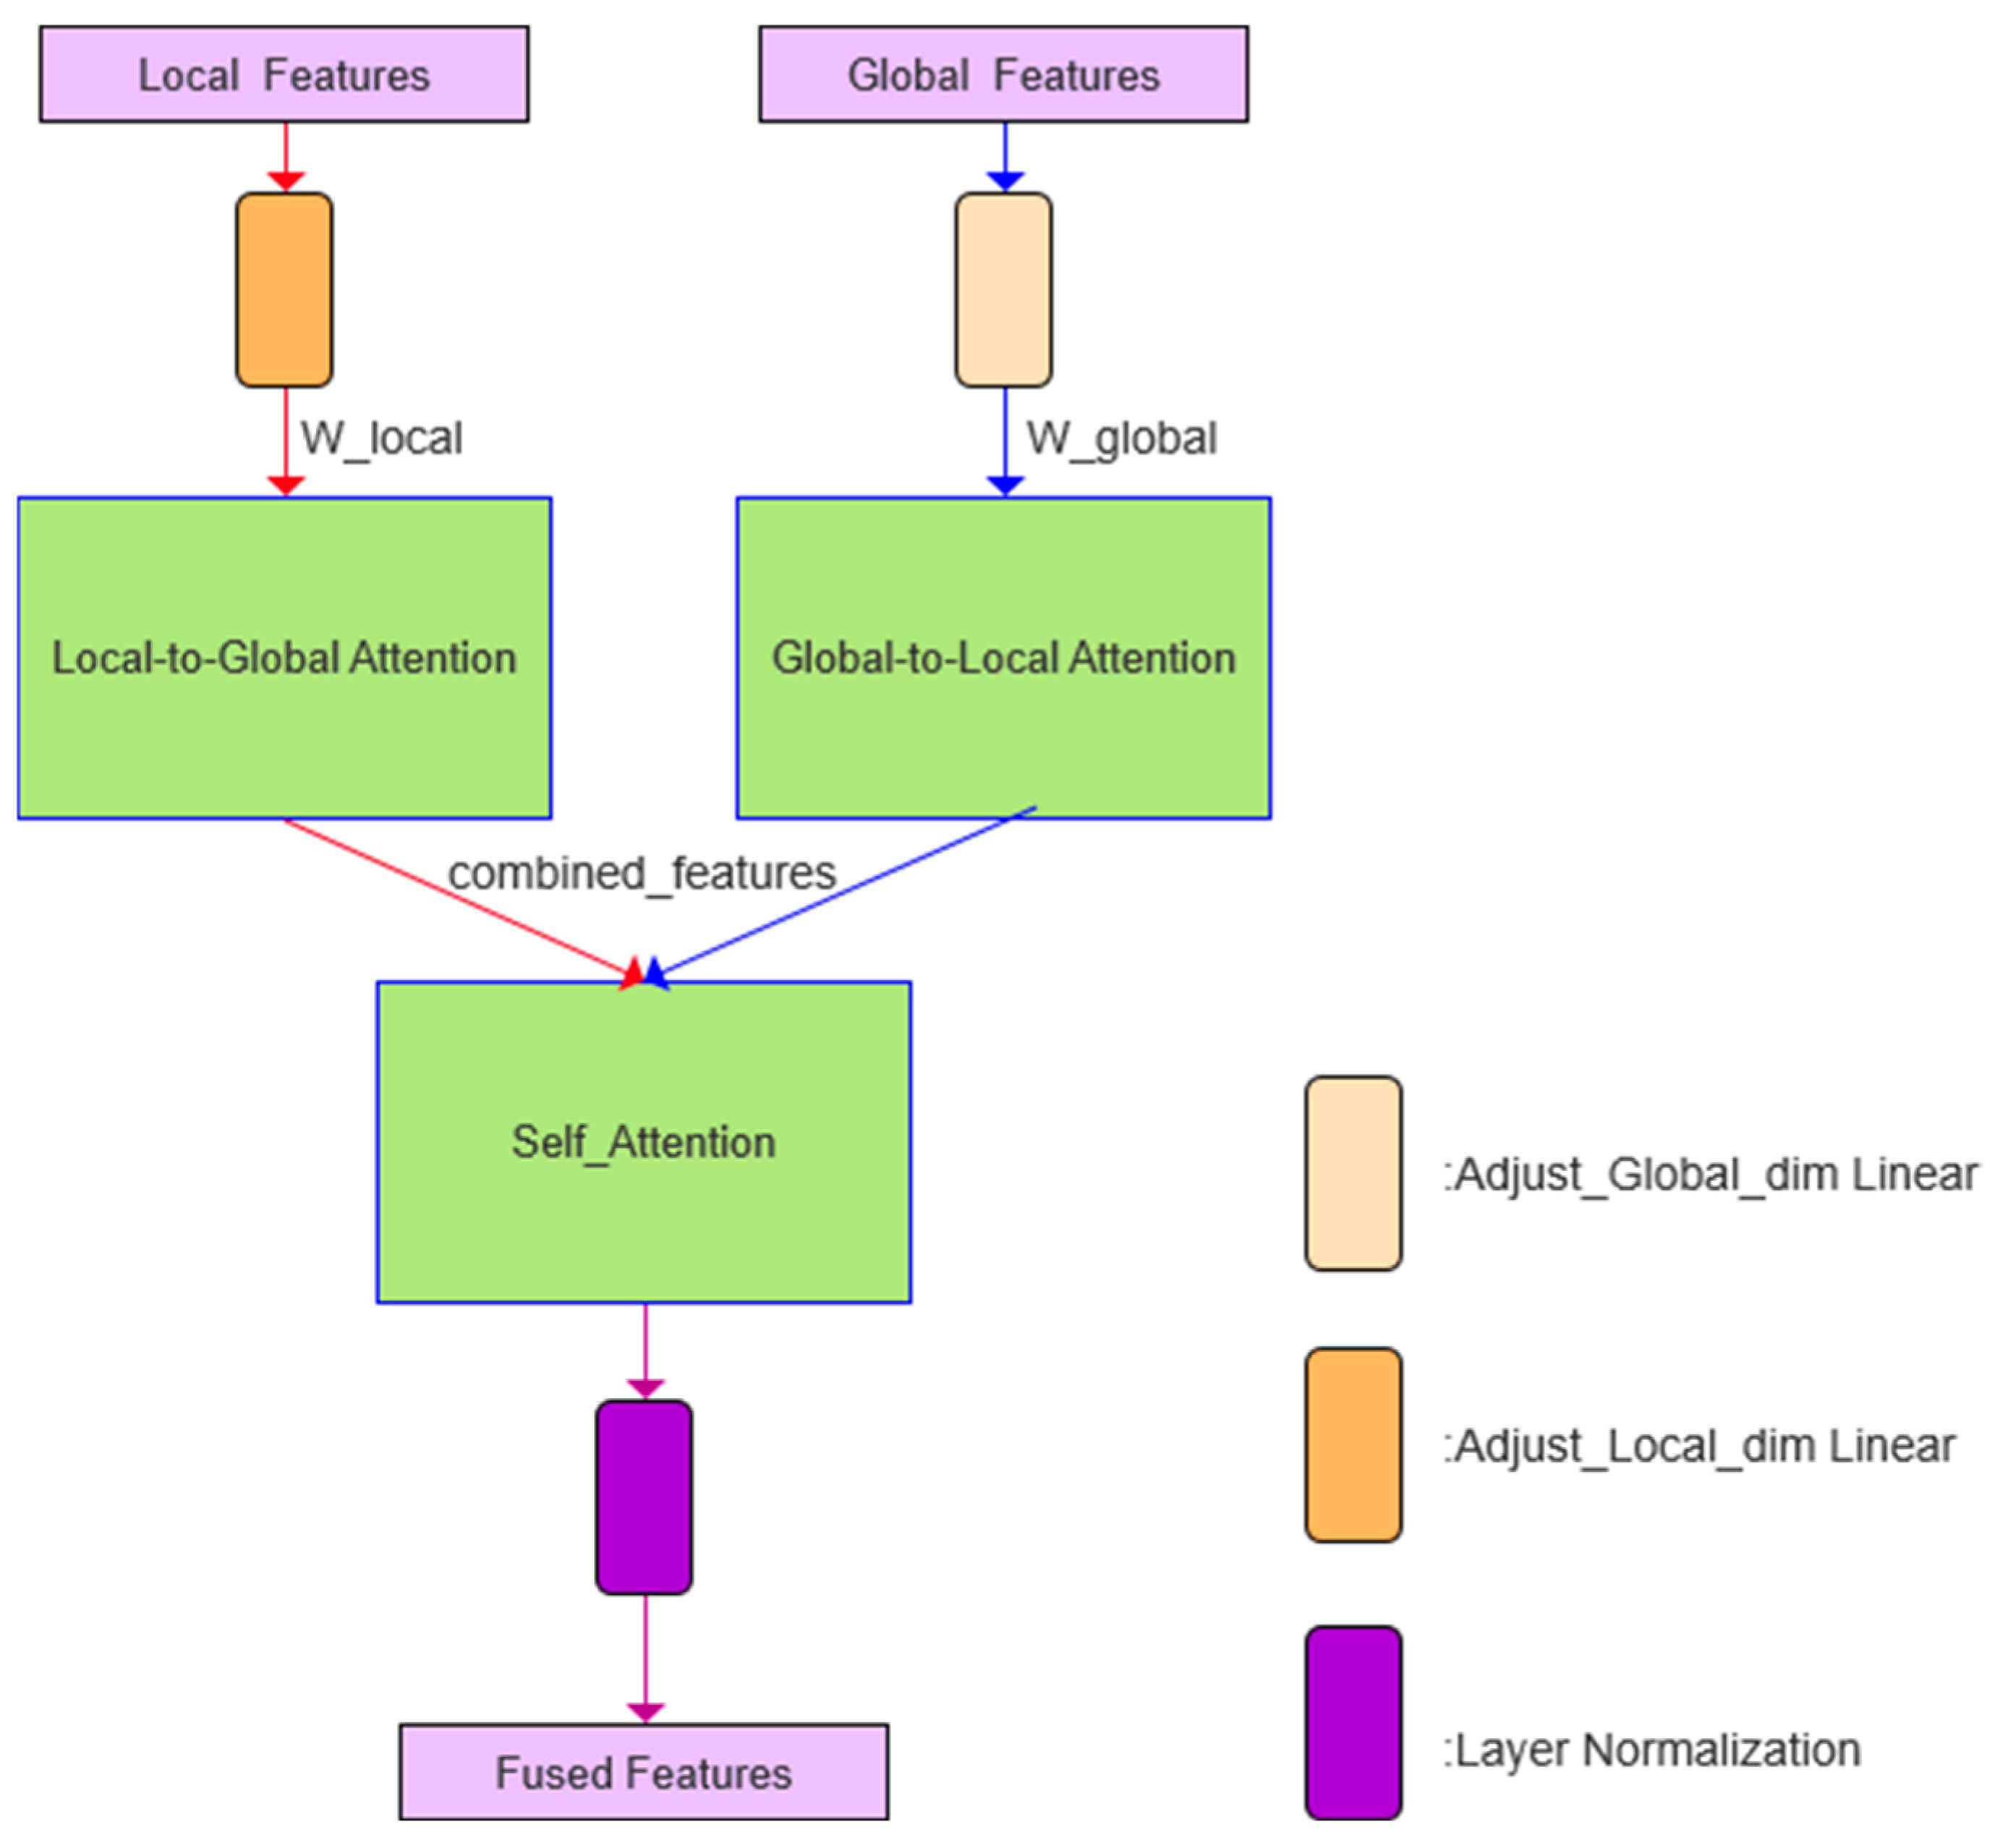
2.2.3. Application of Enhanced Attention Mechanism Module

Due to the varying reliability of different data sources under diverse non-line-of-sight (NLOS) conditions—such as static and dynamic occlusions—an attention mechanism incorporating global–local interactive attention, self-attention, and weighted fusion is employed to enhance the model’s adaptability to complex environments, as illustrated in Figure 8.
The outputs of the residual module are first adjusted via linear transformation layers to align the UWB features ( l o c s f u s i o n ) as global features and the IMU features ( p o i n t f u s i o n ) as local features, mapping both to the same dimensional space. These calibrated features are then fed into the global and local attention modules, respectively. During the global-to-local attention computation, local features act as queries while global features serve as keys and values; this operation is reversed for the local-to-global attention computation. These two processes are described by the multi-head attention formula in Equation (25), where Q denotes the query matrix, K denotes the key matrix, V denotes the value matrix, d k denotes the key dimension, and the Softmax function ensures that the attention weights sum to 1.
Attention ( Q , K , V ) = softmax ( Q K T d k ) V
Unlike traditional attention mechanisms with fixed weights, this method introduces learnable weights, as shown in Equations (26) and (27), to regulate the interaction strength between global and local features, where α and β serve as the weighting coefficients.
W e i g h t e d g l o b a l   t o   l o c a l = α × A t t e n t i o n g l o b a l   t o   l o c a l
W e i g h t e d l o c a l   t o   g l o b a l = β × A t t e n t i o n g l o b a l   t o   l o c a l
In contrast to conventional attention mechanisms with fixed weighting schemes, the proposed approach introduces learnable weights to dynamically modulate the interaction strength between global and local features. These weights are applied to the outputs of both global-to-local and local-to-global attention operations, allowing the model to adaptively adjust the fusion ratio based on the characteristics of the input data. This design enables a more flexible and data-driven modeling of cross-modal interactions. A key advantage of this strategy lies in its ability to autonomously calibrate the relative importance of global and local information through learning. For example, when the UWB signal is stable, the model tends to assign higher weights to global features, whereas it shifts its focus toward local features derived from IMU data when the UWB signal becomes unreliable. The resulting weighted global and local features are concatenated and subsequently refined using a self-attention mechanism, which further enhances their interdependencies. This refinement process is formulated in Equation (28), where X denotes the concatenated feature vector representing the integrated global–local interaction.
S e l f A t t e n t i o n ( X ) = s o f t m a x ( X X T d ) X

3. Experimental Design and Results

3.1. Data Sources and Experimental Setup

The dataset used in this study was primarily collected using the development kit from Dalian Haoru Technology Co., Ltd. in conjunction with a custom-built ranging and sensing platform developed in our laboratory. For data acquisition, we employed the LD150-I module from DecaWave, which integrates the DW1000 ultra-wideband (UWB) chip as its core component and utilizes the STM32F103CBT6 microcontroller as the main controller, as shown in Figure 9. The module is also equipped with an inertial measurement unit (IMU), either the MPU-9250 or ICM-20948, providing tri-axial acceleration, gyroscope, and magnetometer data. The UWB module is responsible for capturing distance measurements, while the IMU collects motion-related sensor data.
To support model training and inference, we employed an NVIDIA RTX 3090 GPU, which offers powerful computation capabilities and ample memory resources. Empirical measurements show that the peak memory usage reached approximately 217.30 MB during both training and inference. This consistent, stable memory consumption indicates that the system operates efficiently without encountering resource-related bottlenecks. In terms of model complexity, the proposed network comprises approximately 2.84 million parameters and incurs a computational cost of only 0.02 GFLOPs, demonstrating a lightweight design that enhances computational efficiency and reduces hardware dependency. On the validation set, the model achieved an average inference latency of 17 milliseconds per batch, satisfying the requirements for real-time or near-real-time applications. The software implementation was based on the PyTorch2.1.0 deep learning framework, known for its flexibility and efficiency in model development and training. To ensure accurate estimation of model complexity, we used the THOP library to calculate FLOPs and parameter counts. Data preprocessing and performance evaluation were carried out using well-established libraries such as NumPy and Scikit-learn, thereby ensuring standardization and reproducibility of the experimental pipeline.
To enhance the model’s adaptability to dynamic and complex indoor scenarios, two representative real-world environments were selected for testing: a narrow underground corridor and a spacious hall within an experimental building. During the movement of the mobile terminal (MT), a pedestrian was instructed to follow its trajectory while remaining positioned between the MT and a base station, thereby continuously obstructing the signal transmission. This setup was designed to simulate sustained human body occlusion commonly encountered in complex indoor environments. The experimental setups are illustrated in Figure 10 and Figure 11. In the hall scenario, the mobile terminal (MT) follows a predefined path measuring 5.87 m by 24.8 m, circulating counterclockwise around four central columns as indicated by the white solid line.
The trajectory begins at Base Station 1 (indicated by a green star marker), proceeds sequentially to Base Station 4, and then returns to Base Station 1 to complete a full loop.
In the underground passage, the base station is installed on the wall at a height of 1.65 m above the ground. The moving target (MT) traverses a predefined rectangular trajectory measuring 38.4 m by 3.2 m. While the trajectory design mirrors that of the hall scenario, the underground passage differs in that its trajectory center lacks fixed non-line-of-sight (NLOS) obstructions and only occasionally experiences random pedestrian crossings.
In these two environments, a total of 1250 and 1415 data samples were collected and normalized, respectively. For neural network training and prediction, the entire dataset was proportionally divided into a training set (64%), a validation set (16%), and a test set (20%). To minimize the impact of random distribution in the test data on the evaluation results, each neural network experiment was repeated six times, and the average of the three test results was used as the final evaluation metric. The primary evaluation criteria adopted in the experiment include the mean Euclidean error (MEE), maximum localization error (MaxMEE), mean squared error (MSE), and test time (TT). The corresponding formulas are presented in Equations (29) through (31).
M E E = 1 N i = 1 N ( x i x i ^ ) 2 + ( y i y i ^ ) 2
M a x M E E = m a x i [ 1 , N ] ( x i x i ^ ) 2 + ( y i y i ^ ) 2
M S E = 1 N i = 1 N [ ( x i x i ^ ) 2 + ( y i y i ^ ) 2 ]

3.2. Experimental Results

3.2.1. Feature Extraction Network Selection Comparison Experiment

To further validate the selection and design of the xLSTM model proposed in this study, six independent experiments were conducted for each comparative model under both test scenarios. The average mean squared error (MSE), the average of the best dynamic time warping (DTW) values, and the number of model parameters were computed for comprehensive evaluation. In addition, paired t-tests were performed using MSE as the primary evaluation metric to determine the statistical significance of performance differences between the proposed xLSTM model and other baseline methods. All comparative models employed an identical preprocessing pipeline and applied the same feature fusion strategy following neural network processing. The experimental results are summarized in Table 1.
Table 1 presents the localization performance of various network models across two representative indoor scenarios. The results indicate that the xLSTM model consistently outperforms other models on all key metrics. It achieves the lowest mean squared error (MSE) and mean absolute error (MEE) in both Scene 1 and Scene 2, along with the smallest dynamic time warping (DTW) errors of 30.235 m and 33.697 m, respectively, demonstrating excellent localization accuracy and trajectory continuity. In contrast, traditional RNN and CNN-LSTM models generally exhibit higher errors. Although the Transformer model has fewer parameters and shows reasonable point-wise error metrics (MSE and MEE), its overall trajectory deviates significantly. The DTW error of BiLSTM in Scene 1 is slightly higher (31.638 m), and its overall localization accuracy still falls short of that of xLSTM. Meanwhile, although the p-values of all comparison models relative to xLSTM exhibit some variability, they are all below 0.05. This indicates that the differences in MSE between these models and xLSTM are statistically significant, confirming that the performance improvements of xLSTM are not likely due to chance. In summary, xLSTM achieves superior accuracy and stability with a relatively small parameter size, making it well suited for complex and dynamic indoor localization environments.

3.2.2. Modular Ablation Experiments with Residual Fusion and Attentional Mechanisms

To verify the effectiveness of the improved residual fusion module and attention mechanism, we compared the mean squared error (MSE) and test time of the model on the test set before and after incorporating these enhancements. Additionally, the maximum Euclidean error—reflecting the model’s sensitivity to extreme data points—was evaluated under different model configurations. The corresponding statistical results are presented in Table 2 and Table 3.
As shown in Table 2 and Table 3, the final mean squared error (MSE) and mean Euclidean error (MEE) are significantly reduced after the proposed module enhancements, with the MEE decreasing from 0.187 m to 0.181 m. Meanwhile, the test time remains low, indicating that the improved model can more efficiently extract critical features from the input data. This allows for enhanced accuracy without increasing computational cost during inference.
To quantitatively assess the performance of various feature fusion strategies in terms of mean squared error (MSE) and computational cost, we conducted a series of comparative experiments. These experiments encompass concatenation fusion, mean fusion, attention-based fusion, and the fusion method proposed in this work. The objective is to provide a comprehensive evaluation of the trade-offs between accuracy and computational efficiency for each approach. The experimental results for both the hall and underground passage scenarios are summarized in Table 4, clearly highlighting the differences across the fusion strategies. The results clearly demonstrate that the proposed residual fusion strategy outperforms all baseline methods. It achieves the lowest mean error in both scenarios while maintaining a relatively low inference latency of approximately 29 milliseconds, thereby striking an effective balance between accuracy and computational efficiency. In contrast, the cross-attention fusion offers moderate accuracy improvements but at the cost of increased latency. Simpler strategies such as concatenation and element-wise mean fusion offer faster inference but yield noticeably higher positioning errors. Notably, the performance trends of all fusion methods remain consistent across both test environments, further validating the robustness and generalization capability of the proposed approach in complex indoor scenarios.
To explore the roles of the learnable attention weights α and β, we conducted ablation experiments, as summarized in Table 5, to further validate the effectiveness and complementarity of the bidirectional attention mechanism in complex dynamic scenarios. The results indicate that in both environments, setting either α or β to zero leads to varying degrees of performance degradation. Overall, local information plays a critical role in modeling the global spatial structure under non-line-of-sight (NLOS) conditions; however, it is noteworthy that removing α has a more pronounced impact in the hall environment than in the underground passage. This is primarily because the trajectory in the underground passage lacks fixed NLOS obstructions such as the columns present in the hall and only experiences brief occlusions caused by a small number of pedestrians, resulting in a relatively reduced importance of local information for global modeling. Nevertheless, the overall localization error in the hall environment remains lower than that in the underground passage, which can be attributed to the presence of fixed NLOS obstructions and the wider signal coverage in the hall scenario. These factors enhance the quality of global information and thereby improve the model’s localization performance.

3.2.3. Ablation Study: Evaluating the Impact of the KAN Module

To further validate the effectiveness of incorporating the Kernel-based Activation Network (KAN) module within the proposed framework, we conducted an ablation study by replacing the KAN module with a fully connected (FC) layer of comparable parameter size. The two structures were evaluated in terms of inference latency, computational complexity (measured by FLOPs), and prediction accuracy (measured by mean squared error, MSE), as shown in Table 6.
The experimental results indicate that although the FC-based variant shows slightly lower inference latency, it exhibits significantly higher computational complexity, with a notable increase in FLOPs. In contrast, the KAN-based model achieves superior prediction accuracy by substantially reducing the MSE. These findings suggest that the KAN module offers a more efficient and effective approach for modeling the complex nonlinear relationships inherent in heterogeneous temporal sensor data, thus delivering better regression performance with lower computational cost.

3.2.4. Comparative Experiments with Other Localization Methods

Traditional filtering algorithms face high design complexity when fusing UWB and IMU data and usually require manual construction of state transfer models and error models for various sensors. This process is highly dependent on a priori knowledge, and the system performance tends to degrade significantly when the model is inaccurate or the environment changes. In addition, the filter structure is highly dependent on sensor observations, and the localization accuracy is susceptible to serious impacts in the presence of occlusions, signal failures, or drastic fluctuations in ranging errors. Moreover, the traditional filtering method has poor scalability when integrating new modes, the model structure is difficult to adapt flexibly, and the parameters often need to be readjusted in different application scenarios, with limited generalization capability. In contrast, the multi-module fusion neural network architecture proposed in this paper adopts an end-to-end training strategy, which simplifies the cumbersome design process of the state transfer model and sensor error model in traditional filtering. Although the neural network training still requires some hyperparameter adjustment, it mainly relies on the data-driven learning process, which avoids the complexity of manually designing and adjusting the parameters of the physical model for different environments, and demonstrates better scalability and environmental adaptability. The architecture can effectively adapt to a variety of complex indoor environments (e.g., underground passages and halls) and maintains stable feature representation and high-precision localization performance under challenging conditions such as occlusion and dynamic interference.
To further validate the advantages of the proposed architecture over traditional filtering methods in terms of localization accuracy and robustness in complex environments, this paper designs a series of experiments aimed at evaluating the adaptability and generalization performance of various algorithms under typical challenging conditions such as occlusion and dynamic interference. The modified Cubic Kalman Filter (CKF) [17], as well as filter fusion algorithms employing the Unscented Kalman Filter (UKF) and Adaptive Robust Kalman Filter (ARKF) for fusion position adjustment, are selected as baseline methods for comparison. All algorithms were trained and tested using the same sensor inputs (UWB and IMU) with ARKF-based data preprocessing and evaluated within a unified experimental scenario. The evaluation metrics include the maximum errors along the x-axis and y-axis, the average localization error, and the maximum localization error. The experimental results are presented in Figure 12 and Figure 13.
As shown in the figure, the xLSTM model achieves the best performance across all metrics, with relatively stable fluctuations. Notably, it significantly outperforms other algorithms in terms of maximum error, maintaining it below 0.8 m. Moreover, the model consistently delivers high-precision and stable localization results across different environments, demonstrating superior environmental adaptability and strong generalization capability. Among traditional filtering methods, the CKF algorithm performs the best, achieving an average error along the y-axis comparable to that of the xLSTM network; however, it shows inferior performance on other evaluation metrics.

3.2.5. Localization Results Analysis

The statistically calculated combined comparison between the algorithm designed in this experiment and the CKF algorithm in both environments is shown in Table 7 and Table 8:
By comparing and analyzing the localization error data of the CKF algorithm and the xLSTM network algorithm across two environments, this study draws the following key conclusions: the xLSTM algorithm demonstrates excellent performance in high-precision localization scenarios. Experimental results show that the proposed xLSTM algorithm improves localization accuracy in hall and underpass environments by 60.1% and 64.8%, respectively, compared to the CKF algorithm within the critical small error range (≤0.25 m). Additionally, the accuracy improvements within the 0.5 m error range are 8.5% and 9.6%, respectively. Notably, the algorithm exhibits better error tolerance and stability, achieving 100% full coverage within the 0.5 m error range and a more concentrated and stable error distribution. To provide a more intuitive visualization of the algorithmic performance, Figure 14 and Figure 15 present the predicted trajectories of the ARKF filtering algorithm, the CKF neural network method, and the proposed algorithm. Four different markers are used: red square markers denote the true reference trajectories, green circular markers represent the fusion trajectories of the ARKF method, blue upper triangular markers correspond to the CKF model’s prediction results, and yellow lower triangular markers indicate the prediction trajectories of the model proposed in this study. This visual comparison further validates the superiority of the proposed algorithm in trajectory prediction.
From the trajectory comparison figures, it can be observed that the xLSTM algorithm generates motion trajectories closest to the ground truth in both scenarios compared to the other algorithms.

4. Discussion

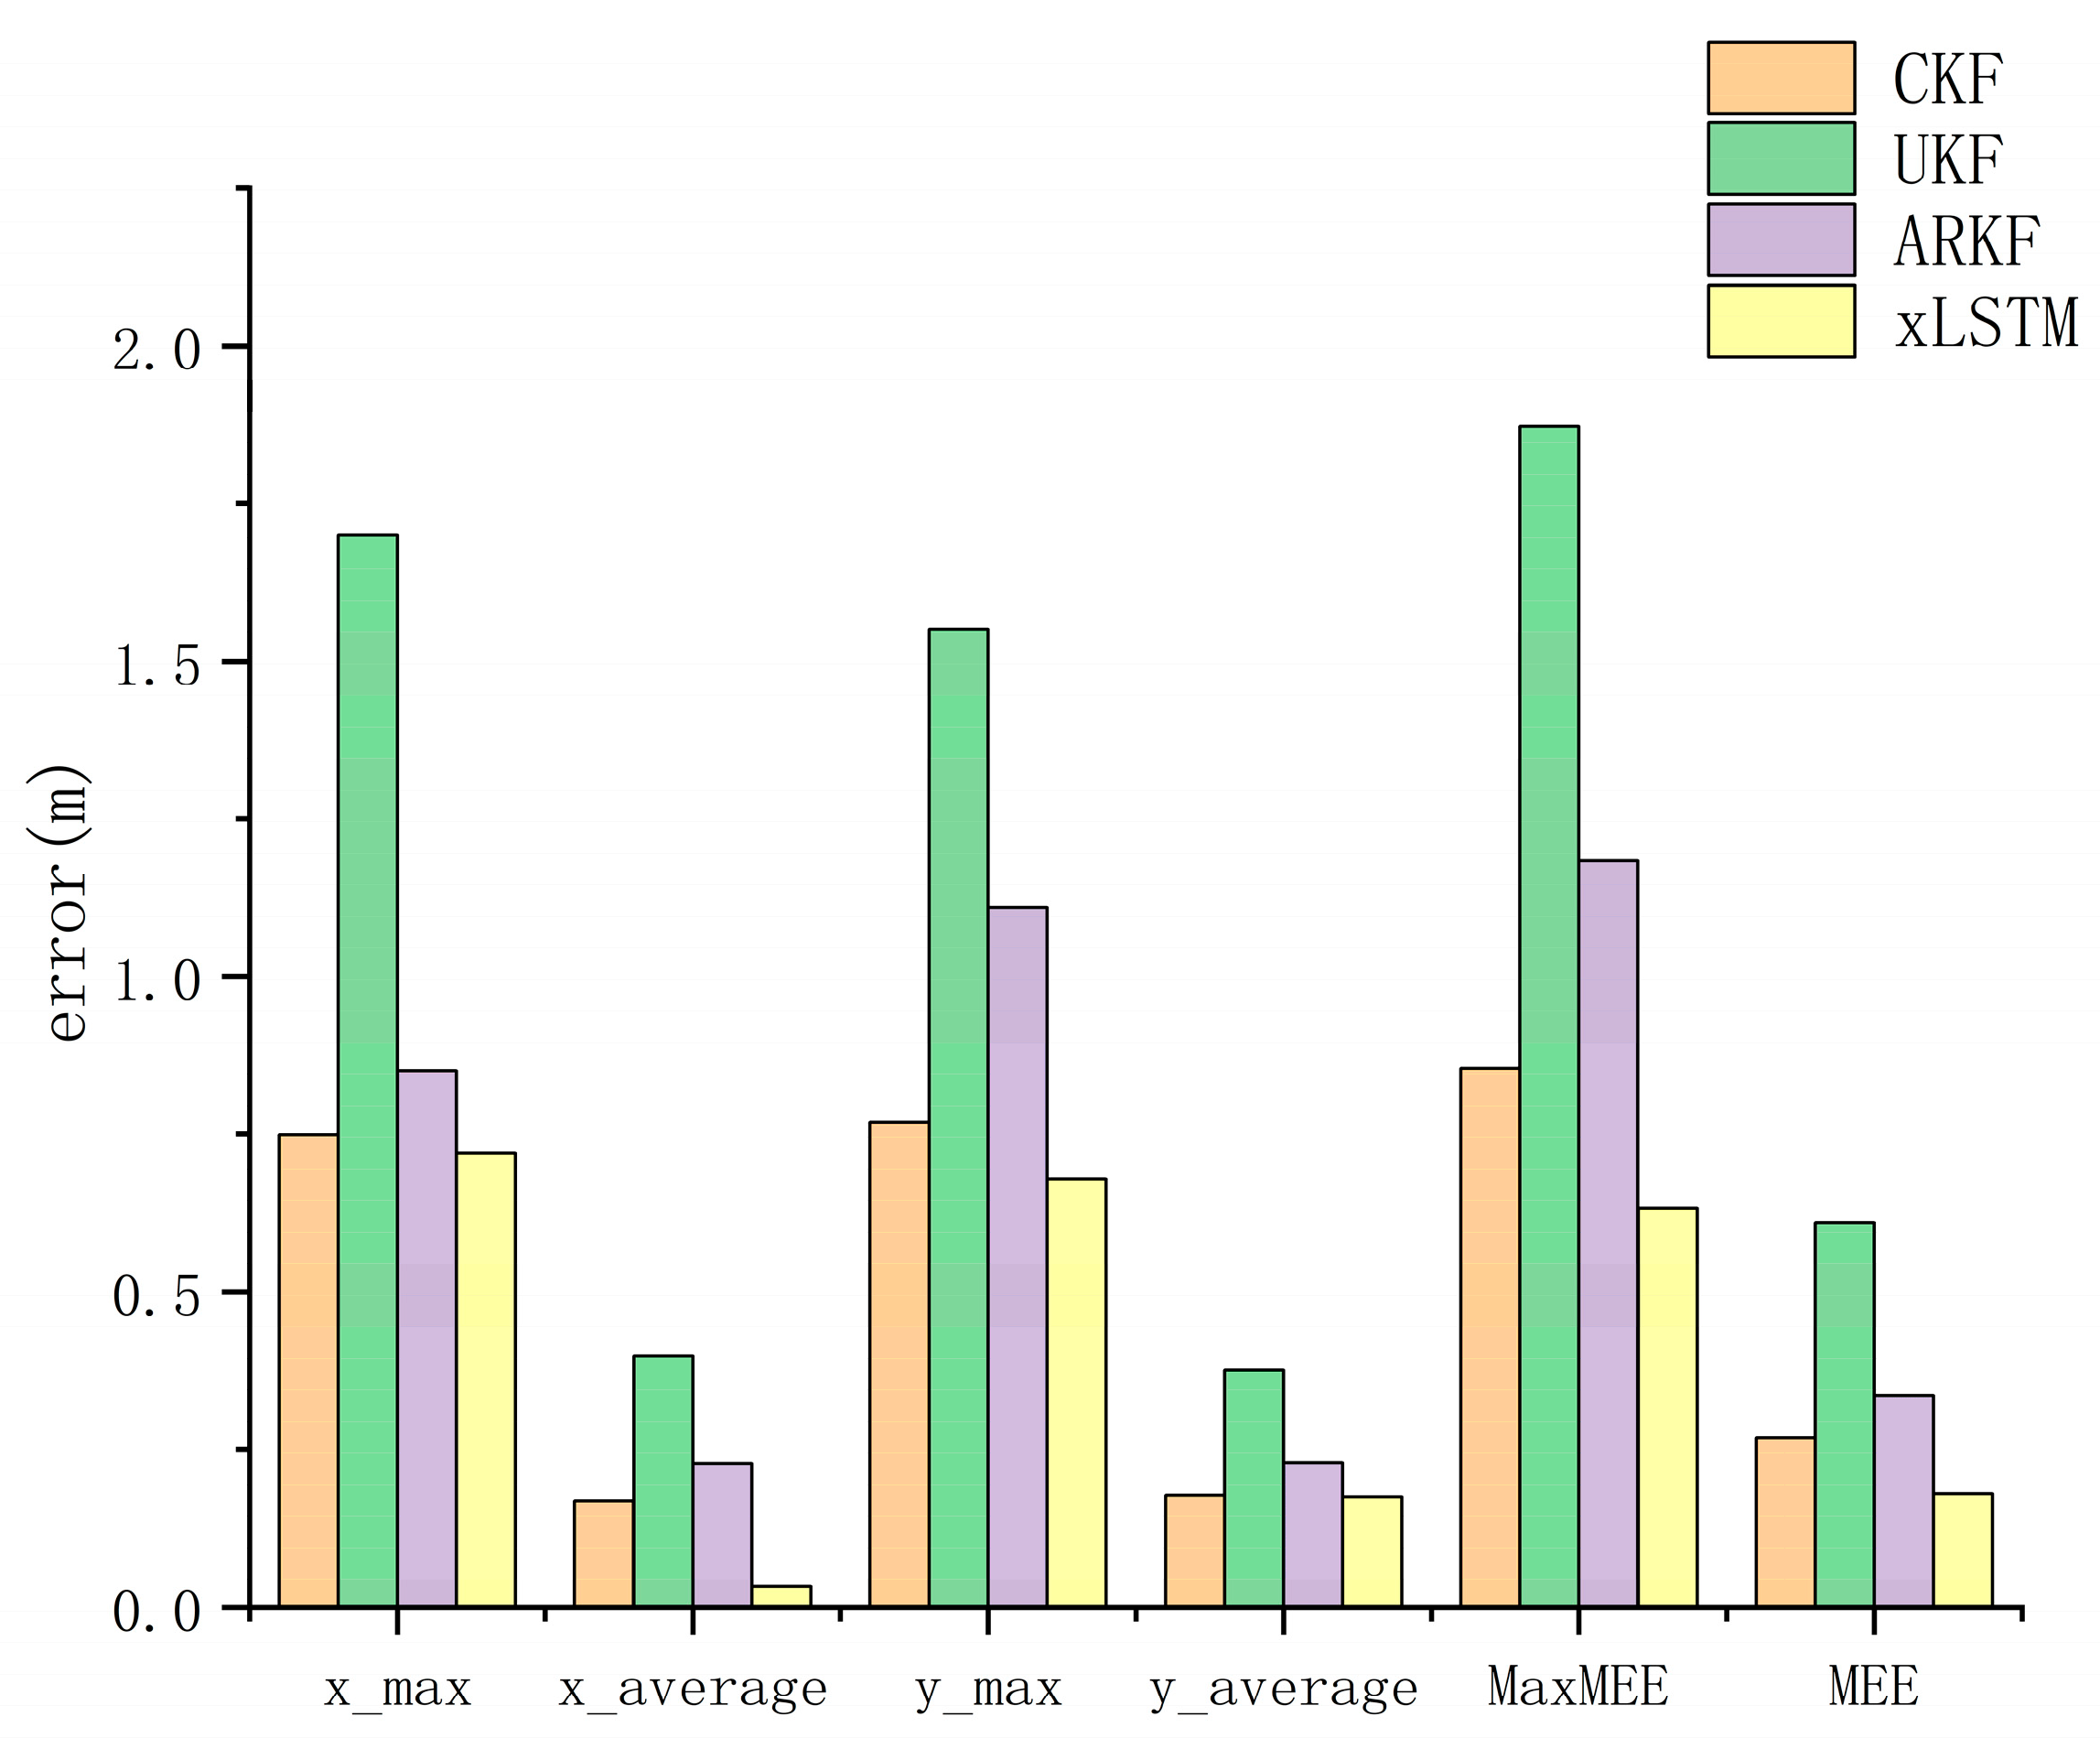
This study presents a high-precision indoor localization method based on multimodal data fusion, achieving intelligent integration of heterogeneous sources and lightweight deployment through a deep neural network architecture. The proposed approach eliminates the heavy reliance of traditional filtering algorithms on parameters such as noise covariance matrices and state equations, while also avoiding the complexity of implementation and deployment caused by extensive hardware setups. Experimental results demonstrate that, compared with various conventional fusion-based localization algorithms, the proposed neural network fusion method significantly improves localization accuracy and environmental adaptability in complex and dynamic scenarios. This work provides new insights and opportunities for applying deep learning techniques to multimodal fusion and high-precision localization tasks.
Nevertheless, several limitations remain. First, although multimodal fusion can effectively reduce estimation errors to some extent, real-world applications often involve alternating line-of-sight (LOS) and non-line-of-sight (NLOS) conditions. Second, the current method relies on supervised learning and therefore requires a considerable amount of labeled data, which may be costly or impractical to obtain in real-world scenarios. Moreover, a systematic hyperparameter search for optimizing network depth and architectural configuration has not yet been conducted.
To address these challenges, future work will focus on incorporating NLOS detection mechanisms and adaptive error compensation strategies. Additionally, we will explore semi-supervised and self-supervised learning paradigms to reduce dependence on labeled data and enhance the model’s robustness and generalization across diverse and challenging environments. We also plan to integrate automated hyperparameter optimization techniques to systematically investigate improved layer configurations and architectural designs, further unlocking the model’s performance potential.

Author Contributions

Conceptualization, H.W., J.H. and L.C.; methodology, H.W., J.H. and L.C.; software, H.W., J.H. and L.C.; validation, H.W., J.H. and L.C.; formal analysis, H.W., J.H. and L.C.; investigation, H.W., J.H. and L.C.; resources, H.W., J.H. and L.C.; data curation, H.W., J.H. and L.C.; writing—original draft preparation, H.W., J.H. and L.C.; writing—review and editing, H.W., J.H. and L.C.; supervision, J.H. and L.C.; project administration, J.H. and L.C.; funding acquisition, J.H. and L.C. All authors have read and agreed to the published version of the manuscript.

Funding

This work was supported by the Inner Mongolia Higher Education Institutions under projects “Research on Multi-Source Data Fusion Localization Algorithms for Indoor Dynamic Environments” (2024QNJS051) and “Key Technologies for Personnel Positioning System Based on Visible Light CSI in Underground Coal Mines” (2024QNJS041), as well as the National Natural Science Foundation of China (Grant No. 62461049) for the project titled “Research on Video SAR Maritime Moving Target Monitoring Method Assisted by Wake Feature in Complex Environments”.

Data Availability Statement

Part of the dataset is available on request from the authors (the data are part of an ongoing project).

Acknowledgments

The authors would like to thank all the participants in this study.

Conflicts of Interest

The authors declare no conflicts of interest. The funders had no role in the design of the study; in the collection, analyses, or interpretation of data; in the writing of the manuscript; or in the decision to publish the results.

References

  1. Asaad, S.M.; Maghdid, H.S. A comprehensive review of indoor/outdoor localization solutions in IoT era: Research challenges and future perspectives. Comput. Netw. 2022, 212, 109041. [Google Scholar] [CrossRef]
  2. Liu, F.; Liu, J.; Yin, Y.; Wang, W.; Hu, D.; Chen, P.; Niu, Q. Survey on WiFi-based indoor positioning techniques. IET Commun. 2020, 14, 1372–1383. [Google Scholar] [CrossRef]
  3. Bellavista-Parent, V.; Torres-Sospedra, J.; Perez-Navarro, A. New trends in indoor positioning based on WiFi and machine learning: A systematic review. In Proceedings of the 2021 International Conference on Indoor Positioning and Indoor Navigation (IPIN), Lloret de Mar, Spain, 29 November–2 December 2021; pp. 1–8. [Google Scholar]
  4. Sambu, P.; Won, M. An experimental study on direction finding of bluetooth 5.1: Indoor vs. outdoor. In Proceedings of the 2022 IEEE Wireless Communications and Networking Conference (WCNC), Austin, TX, USA, 10–13 April 2021. [Google Scholar]
  5. de Blasio, G.S.; Quesada-Arencibia, A.; García, C.R.; Rodríguez-Rodríguez, J.C. Bluetooth low energy technology applied to indoor positioning systems: An overview. In Proceedings of the International Conference on Computer Aided Systems Theory, Las Palmas de Gran Canaria, Spain, 17–22 February 2019; Springer International Publishing: Cham, Switzerland, 2019; pp. 83–90. [Google Scholar]
  6. Wei, L.; Zhang, H.; Yu, B.; Guan, Y. High-accuracy indoor positioning system based on visible light communication. Opt. Eng. 2015, 54, 110501. [Google Scholar] [CrossRef]
  7. Wang, R.; Niu, G.; Cao, Q.; Chen, C.S.; Ho, S.-W. A Survey of Visible-Light-Communication-Based Indoor Positioning Systems. Sensors 2024, 24, 5197. [Google Scholar] [CrossRef] [PubMed]
  8. Gao, P.; Luo, G.; Liu, Y.; Chen, W. A novel method for uwb-based localization using fewer anchors in a floor with multiple rooms and corridors. In Proceedings of the 2022 IEEE 12th International Conference on Indoor Positioning and Indoor Navigation (IPIN), Beijing, China, 5–8 September 2022; pp. 1–6. [Google Scholar]
  9. Juárez, A.; Fortes, S.; Colin, E.; Baena, C.; Baena, E.; Barco, R. UWB-based positioning system for indoor sports. In Proceedings of the 2023 13th International Conference on Indoor Positioning and Indoor Navigation (IPIN), Nuremberg, Germany, 25–28 September 2023; pp. 1–6. [Google Scholar]
  10. Qu, J. A review of UWB indoor positioning. J. Phys. Conf. Ser. 2023, 2669, 012003. [Google Scholar] [CrossRef]
  11. Park, J.W.; Lee, J.H.; Park, C.G. Robust PCA-based Walking Direction Estimation via Stable Principal Component Pursuit for Pedestrian Dead Reckoning. Int. J. Control Autom. Syst. 2024, 22, 3285–3294. [Google Scholar] [CrossRef]
  12. Poulose, A.; Han, D.S. Hybrid indoor localization using IMU sensors and smartphone camera. Sensors 2019, 19, 5084. [Google Scholar] [CrossRef]
  13. Feng, D.; Wang, C.; He, C.; Zhuang, Y.; Xia, X.-G. Kalman-filter-based integration of IMU and UWB for high-accuracy indoor positioning and navigation. IEEE Internet Things J. 2020, 7, 3133–3146. [Google Scholar] [CrossRef]
  14. Moghadam, S.M.; Yeung, T.; Choisne, J. The effect of imu sensor location, number of features, and window size on a random forest model’s accuracy in predicting joint kinematics and kinetics during gait. IEEE Sens. J. 2023, 23, 28328–28339. [Google Scholar] [CrossRef]
  15. Hu, G.; Wan, H.; Li, X. A high-precision magnetic-assisted heading angle calculation method based on a 1D convolutional neural network (CNN) in a complicated magnetic environment. Micromachines 2020, 11, 642. [Google Scholar] [CrossRef]
  16. Han, Y.; Wei, C.; Li, R.; Wang, J.; Yu, H. A novel cooperative localization method based on IMU and UWB. Sensors 2020, 20, 467. [Google Scholar] [CrossRef] [PubMed]
  17. Ji, P.; Duan, Z.; Xu, W. A Combined UWB/IMU Localization Method with Improved CKF. Sensors 2024, 24, 3165. [Google Scholar] [CrossRef]
  18. Zhu, W.; Zhao, R.; Zhang, H.; Lu, J.; Zhang, Z.; Wei, B.; Fan, Y. Improved Indoor Positioning Model Based on UWB/IMU Tight Combination with Double-Loop Cumulative Error Estimation. Appl. Sci. 2023, 13, 10046. [Google Scholar] [CrossRef]
  19. Venkata Krishnaveni, B.; Suresh Reddy, K.; Ramana Reddy, P. Indoor positioning and tracking by coupling IMU and UWB with the extended Kalman filter. IETE J. Res. 2023, 69, 6757–6766. [Google Scholar] [CrossRef]
  20. Li, X.; Ye, J.; Zhang, Z.; Fei, L.; Xia, W.; Wang, B. A Novel Low-Cost UWB/IMU Positioning Method with the Robust Unscented Kalman Filter Based on Maximum Correntropy. IEEE Sens. J. 2024, 24, 29219–29231. [Google Scholar] [CrossRef]
  21. Liu, F.; Li, X.; Wang, J.; Zhang, J. An adaptive UWB/MEMS-IMU complementary kalman filter for indoor location in NLOS environment. Remote Sens. 2019, 11, 2628. [Google Scholar] [CrossRef]
  22. Sun, J.; Sun, W.; Zheng, J.; Chen, Z.; Tang, C.; Zhang, X. A Novel UWB/IMU/Odometer-Based Robot Localization System in LOS/NLOS Mixed Environments. IEEE Trans. Instrum. Meas. 2024, 73, 7502913. [Google Scholar] [CrossRef]
  23. Tian, Q.; Wang, K.I.-K.; Salcic, Z. Human body shadowing effect on UWB-based ranging system for pedestrian tracking. IEEE Trans. Instrum. Meas. 2018, 68, 4028–4037. [Google Scholar] [CrossRef]
  24. Zhang, H.; Wang, Q.; Li, Z.; Mi, J.; Zhang, K. Research on high precision positioning method for pedestrians in indoor complex environments based on UWB/IMU. Remote Sens. 2023, 15, 3555. [Google Scholar] [CrossRef]
  25. Zou, A.; Hu, W.; Luo, Y.; Jiang, P. An Improved UWB/IMU Tightly Coupled Positioning Algorithm Study. Sensors 2023, 23, 5918. [Google Scholar] [CrossRef]
  26. Ali, R.; Liu, R.; Nayyar, A.; Qureshi, B.; Cao, Z. Tightly coupling fusion of UWB ranging and IMU pedestrian dead reckoning for indoor localization. IEEE Access 2021, 9, 164206–164222. [Google Scholar] [CrossRef]
  27. DurmuŞ, Ş.; Demİr, U.; AkgÜn, G.; Yildirim, A. Investigation of UWB-IMU Sensor Fusion for Indoor Navigation with DoE. In Proceedings of the 2023 Innovations in Intelligent Systems and Applications Conference (ASYU), Sivas, Turkiye, 11–13 October 2023; pp. 1–6. [Google Scholar]
  28. Poulose, A.; Han, D.S. Feature-Based Deep LSTM Network for Indoor Localization Using UWB Measurements. In Proceedings of the 2021 International Conference on Artificial Intelligence in Information and Communication (ICAIIC), Jeju Island, Republic of Korea, 13–16 April 2021; pp. 298–301. [Google Scholar]
  29. Krapež, P.; Vidmar, M.; Munih, M. Distance Measurements in UWB-Radio Localization Systems Corrected with a Feedforward Neural Network Model. Sensors 2021, 21, 2294. [Google Scholar] [CrossRef] [PubMed]
  30. Almassri, A.M.M.; Shirasawa, N.; Purev, A.; Uehara, K.; Oshiumi, W.; Mishima, S.; Wagatsuma, H. Artificial Neural Network Approach to Guarantee the Positioning Accuracy of Moving Robots by Using the Integration of IMU/UWB with Motion Capture System Data Fusion. Sensors 2022, 22, 5737. [Google Scholar] [CrossRef]
  31. Chen, Z.; Zou, H.; Yang, J.; Jiang, H.; Xie, L. WiFi fingerprinting indoor localization using local feature-based deep LSTM. IEEE Syst. J. 2019, 14, 3001–3010. [Google Scholar] [CrossRef]
  32. Liu, Z.; Wang, Y.; Vaidya, S.; Ruehle, F.; Halverson, J.; Soljačić, M.; Hou, T.Y.; Tegmark, M. Kan: Kolmogorov-arnold networks. arXiv 2024, arXiv:2404.19756. [Google Scholar]
  33. Beck, M.; Pöppel, K.; Spanring, M.; Auer, A.; Prudnikova, O.; Kopp, M.; Klambauer, G.; Brandstetter, J.; Hochreiter, S. xlstm: Extended long short-term memory. arXiv 2024, arXiv:2405.04517. [Google Scholar]
Figure 1. Illustration of TOA-based localization. The tag broadcasts a signal, and multiple base stations receive it at different times depending on the distance. The localization is performed by intersecting the range circles derived from the time-of-flight measurements.
Electronics 14 02730 g001
Figure 2. Schematic diagram of bilateral bidirectional ranging. The diagram illustrates the message exchange process and timestamp definitions in a UWB bilateral ranging session. Key timestamps are used to compute the signal’s round-trip time and ultimately estimate the distance between the tag and the base station. T r o u n d 1 and T r o u n d 2 denote the round-trip durations measured by the tag and the base station, respectively; T r e p l y 1 and T r e p l y 2 indicate the corresponding response delays. T p r o p represents the one-way signal propagation time.
Electronics 14 02730 g002
Figure 3. Architecture of the proposed multimodal data fusion system.
Electronics 14 02730 g003
Figure 4. sLSTM architecture diagram.
Electronics 14 02730 g004
Figure 5. mLSTM architecture diagram.
Electronics 14 02730 g005
Figure 6. xLSTM-based feature modeling architecture for multi-sensor data.
Electronics 14 02730 g006
Figure 7. Schematic diagram of the data fusion residual module. Dashed lines indicate the internal structures of modules at each stage.
Electronics 14 02730 g007
Figure 8. Schematic of the attention mechanism process. The outputs from the local-to-global and global-to-local attention modules are concatenated to form a unified cross-modal representation. This representation is further refined through a self-attention mechanism and layer normalization to produce the final fused representation. Arrow colors indicate different data streams: red for the local (IMU) stream, blue for the global (UWB) stream, and purple for the output flow.
Electronics 14 02730 g008
Figure 9. Module physical diagram.
Electronics 14 02730 g009
Figure 10. Experimental setup in the hall scene, Scene 1.
Electronics 14 02730 g010
Figure 11. Experimental setup in the underground corridor scene, Scene 2.
Electronics 14 02730 g011
Figure 12. Prediction errors in the hall scenario under 6 evaluation criteria.
Electronics 14 02730 g012
Figure 13. Prediction errors in the underpass scenario under 6 evaluation criteria.
Electronics 14 02730 g013
Figure 14. Comparison of trajectories obtained by each fusion method in the hall scene.
Electronics 14 02730 g014
Figure 15. Comparison of trajectories obtained by each fusion method in the underpass scene.
Electronics 14 02730 g015
Table 1. Experimental comparison of feature networks for sensor fusion.
Scene 1MSEMEEDTW (m)Params (M)p-Value
x_LSTM0.0030.18130.2352.840
RNN0.0090.36335.9682.8400.001
Transformer0.0080.27659.3851.2300.003
BiLSTM0.0060.23731.6382.8500.001
CNN-LSTM0.0070.25533.3742.8500.018
Scene 2MSEMEEDTW (m)Params (M)p-Value
x_LSTM0.0030.18733.6972.840
RNN0.0120.35446.5682.8400.003
Transformer0.0080.27966.9621.2300.006
BiLSTM0.0120.37636.2812.8500.004
CNN-LSTM0.0080.28843.6052.8500.015
Table 2. Comparison of each evaluation metric before and after model improvement in the hall scene, Scene 1.
ConvMS-ConvAttnAttn-LWMSEMEETest Time
Module 0.00280.94130.2349
Module 0.00190.18120.1719
Module 0.01251.18040.1832
Table 3. Comparison of each evaluation metric before and after model improvement in the underpass scene, Scene 2.
ConvMS-ConvAttnAttn-LWMSEMEETest Time
Module 0.01180.33030.1774
Module 0.00260.18750.1746
Module 0.00300.21210.1732
Table 4. Quantitative comparison of feature fusion strategies based on MEE and computational cost.
Variant NameFusion StrategyInference Latency (ms) Scene 1, Scene 2MEE
Scene 1, Scene 2
Concat FusionConcatenation + Linear Projection16.06, 16.580.32, 0.34
Mean FusionElement-wise Mean Fusion16.13, 16.610.37, 0.39
Attention FusionCross-Attention18.77, 16.250.23, 0.27
Residual FusionThree-Stage Residual Fusion17.89, 17.210.18, 0.19
Table 5. Ablation study results of learnable attention weights α and β.
Scene 1Model SettingMSE
Full Model0.0019
α = 00.0050
β = 00.7385
Scene 2Model SettingMSE
Full Model0.0026
α = 00.0381
β = 00.6709
Table 6. Performance comparison between KAN and fully connected layers.
Scene 1Model SettingFLOPsMSEInference Latency (ms)
Traditional FC0.1900.00117.430
KAN0.0200.00616.896
Scene 2Model SettingFLOPsMSEInference Latency (ms)
Traditional FC0.1920.00317.891
KAN0.0210.00817.213
Table 7. Positioning error comparison between CKF and xLSTM in the hall scenario.
Error RangeCKF Method AccuracyxLSTM Method AccuracyAccuracy Improvement
≤0.25 m44.4%72.0%60.1%
≤0.5 m89.4%97.0%8.5%
≤0.75 m99.7%100.0%0.3%
Table 8. Positioning error comparison between CKF and xLSTM in the underpass scenario.
Error RangeCKF Method AccuracyxLSTM Method AccuracyAccuracy Improvement
≤0.25 m47.9%79.1%64.8%
≤0.5 m91.2%100.0%9.6%
≤0.75 m99.2%100.0%0.8%
Disclaimer/Publisher’s Note: The statements, opinions and data contained in all publications are solely those of the individual author(s) and contributor(s) and not of MDPI and/or the editor(s). MDPI and/or the editor(s) disclaim responsibility for any injury to people or property resulting from any ideas, methods, instructions or products referred to in the content.

