Article

Cluster Voltage Control of Active Distribution Networks Considering Power Deficit and Resource Allocation

1
School of Automation, Wuhan University of Technology, Wuhan 430070, China
2
School of Electrical Engineering and Automation, Wuhan University, Wuhan 430072, China
*
Author to whom correspondence should be addressed.
Electronics 2025, 14(13), 2639; https://doi.org/10.3390/electronics14132639
Submission received: 16 May 2025 / Revised: 17 June 2025 / Accepted: 26 June 2025 / Published: 30 June 2025

Abstract

Aiming at the problems of frequent voltage overruns in distribution networks and difficulties in centralized optimal dispatch due to the uncertainties of distributed renewable energy sources and bus loads, this paper proposes a dynamic cluster voltage control method considering power deficit and resource allocation in an active distribution network. First, the modularity index is constructed by considering the ability of the bus electrical coupling, and the voltage regulation resources are allocated by balancing power compensation capacity and physical connectivity. This method competes with cluster partitioning and selects pilot buses. Then, an active and reactive power coordinated control model based on non-dominated sorting genetic algorithm II (NSGA-II) is developed. The model aims to minimize voltage violations, distribution network losses, and power consumption costs. Finally, five representative control scenarios are simulated and compared on an enhanced IEEE 51 bus distribution network. The results show that the proposed strategy effectively mitigates node voltage violations, reduces the losses, and enhances resource efficiency.

1. Introduction

As China’s “dual-carbon” targets advance, the distributed generation (DG) industry is driven to a rapid development, and installed capacity is continually expanded. However, DG outputs, such as distributed photovoltaic (PV) and wind power, are characterized by randomness and volatility, which give rise to a series of issues: network loss aggravation, bus voltage limit frequent violations, and the significant cost of generation and maintenance [1]. Consequently, voltage control in distribution networks becomes difficult and complex [2,3], which severely impacts power quality as well as system security and economic performance.
Voltage control is a key strategy in distribution networks, which optimizes power flow distribution. It ensures voltage levels and reduces network losses, and extensive studies focus on medium voltage distribution systems. References [4,5] apply a multi-objective integrated energy dispatch model with centralized voltage control. In reference [6], a two-stage robust optimization model for centralized PV dispatch in active distribution networks is developed. Most works use economic cost and voltage stability metrics as objective functions [7,8]. However, there are some problems like high computational burden and poor control efficiency, thus giving rise to the source-network “clustering” concept in voltage control.
In recent years, studies on cluster voltage control in distribution networks with distributed generation have already been conducted. In the study of [9], a dynamic electro-thermal capacity voltage control strategy for overhead transmission lines was implemented. Though it builds a multi-energy distributed constraint model, the impact of cluster partitioning is not emphasized. Reference [10] clusters the network based on inter- and intra-domain coupling levels. A central node is then selected using a secondary voltage control method. However, the reactive-power optimization performance is not verified. Reference [11] considers the scenarios of PV connected with all buses, and an improved PSO cluster voltage control strategy is proposed. However, the strategy fails to be applicable when PV units only connect limited nodes. In the paper of [12], the network accomplishes power decoupling and classifies clusters into three types according to the characteristics of supply and demand. In this way, a sequential reactive-then-active power dispatch of the key bus in each cluster is established, yet generator constraint conditions and their impacts are not considered. Although the above works implement distributed voltage control for clustered distribution networks through cluster partitioning and dominant bus selection with various technical perspectives, few strategies consider both source load power margins and inter-cluster information exchange. Additionally, flexible scheduling of voltage regulation resources and bus connections can help avoid the impact of increasing regulation costs in the network.
In summary, considering power deficiency and the allocation of voltage regulation resources, this paper proposes a dynamic cluster voltage control strategy for active distribution networks. First, the electrical coupling degree of nodes is used to construct modularity. Then, cluster partitioning and pilot bus are achieved based on the power compensation characteristics and signal interaction ability of the voltage regulation resources. Next, a coordinated power flow control model, which is built with voltage deviation, network loss, and power consumption cost as evaluation metrics, is solved by the NSGA-II in a multi-objective iterative process. Finally, simulations are carried out on a modified IEEE 51 node distribution network. Multiple scenarios are designed to demonstrate and validate the effectiveness and rationality of the proposed control strategy.

2. Cluster Partitioning and Pilot Bus

2.1. Electrical Modularity

In polar coordinates, the Newton–Raphson power flow update equation is given by
Δ P Δ Q = H N M L Δ θ Δ U = J Δ θ Δ U ,
where ΔP and ΔQ are the active and reactive power mismatches at each bus. ΔU and Δθ are the voltage magnitude and angle changes. J is the Jacobian matrix of the power flow. H, N, M, and L are the corresponding submatrices of J.
According to [13], a decoupled form is obtained
Δ U = ( N H M 1 L ) 1 Δ P + ( L M H 1 N ) 1 Δ Q = S P Δ P + S Q Δ Q
where SP/SQ are the active and reactive power sensitivity matrices with respect to voltage. Their (i, j) elements, S i j PU and S i j QU , are the active/reactive voltage sensitivity factors of bus i to bus j. The reactive electrical distance factor is given by Equation (3).
e i j Q = lg S j j QU / S i j QU
Considering the electrical coupling between nodes in the distribution network, the network is set to have Nb nodes. The reactive electrical distance between bus i and bus j is defined by Equation (4).
H i j Q = k = 1 N b ( e i k Q e j k Q ) 2
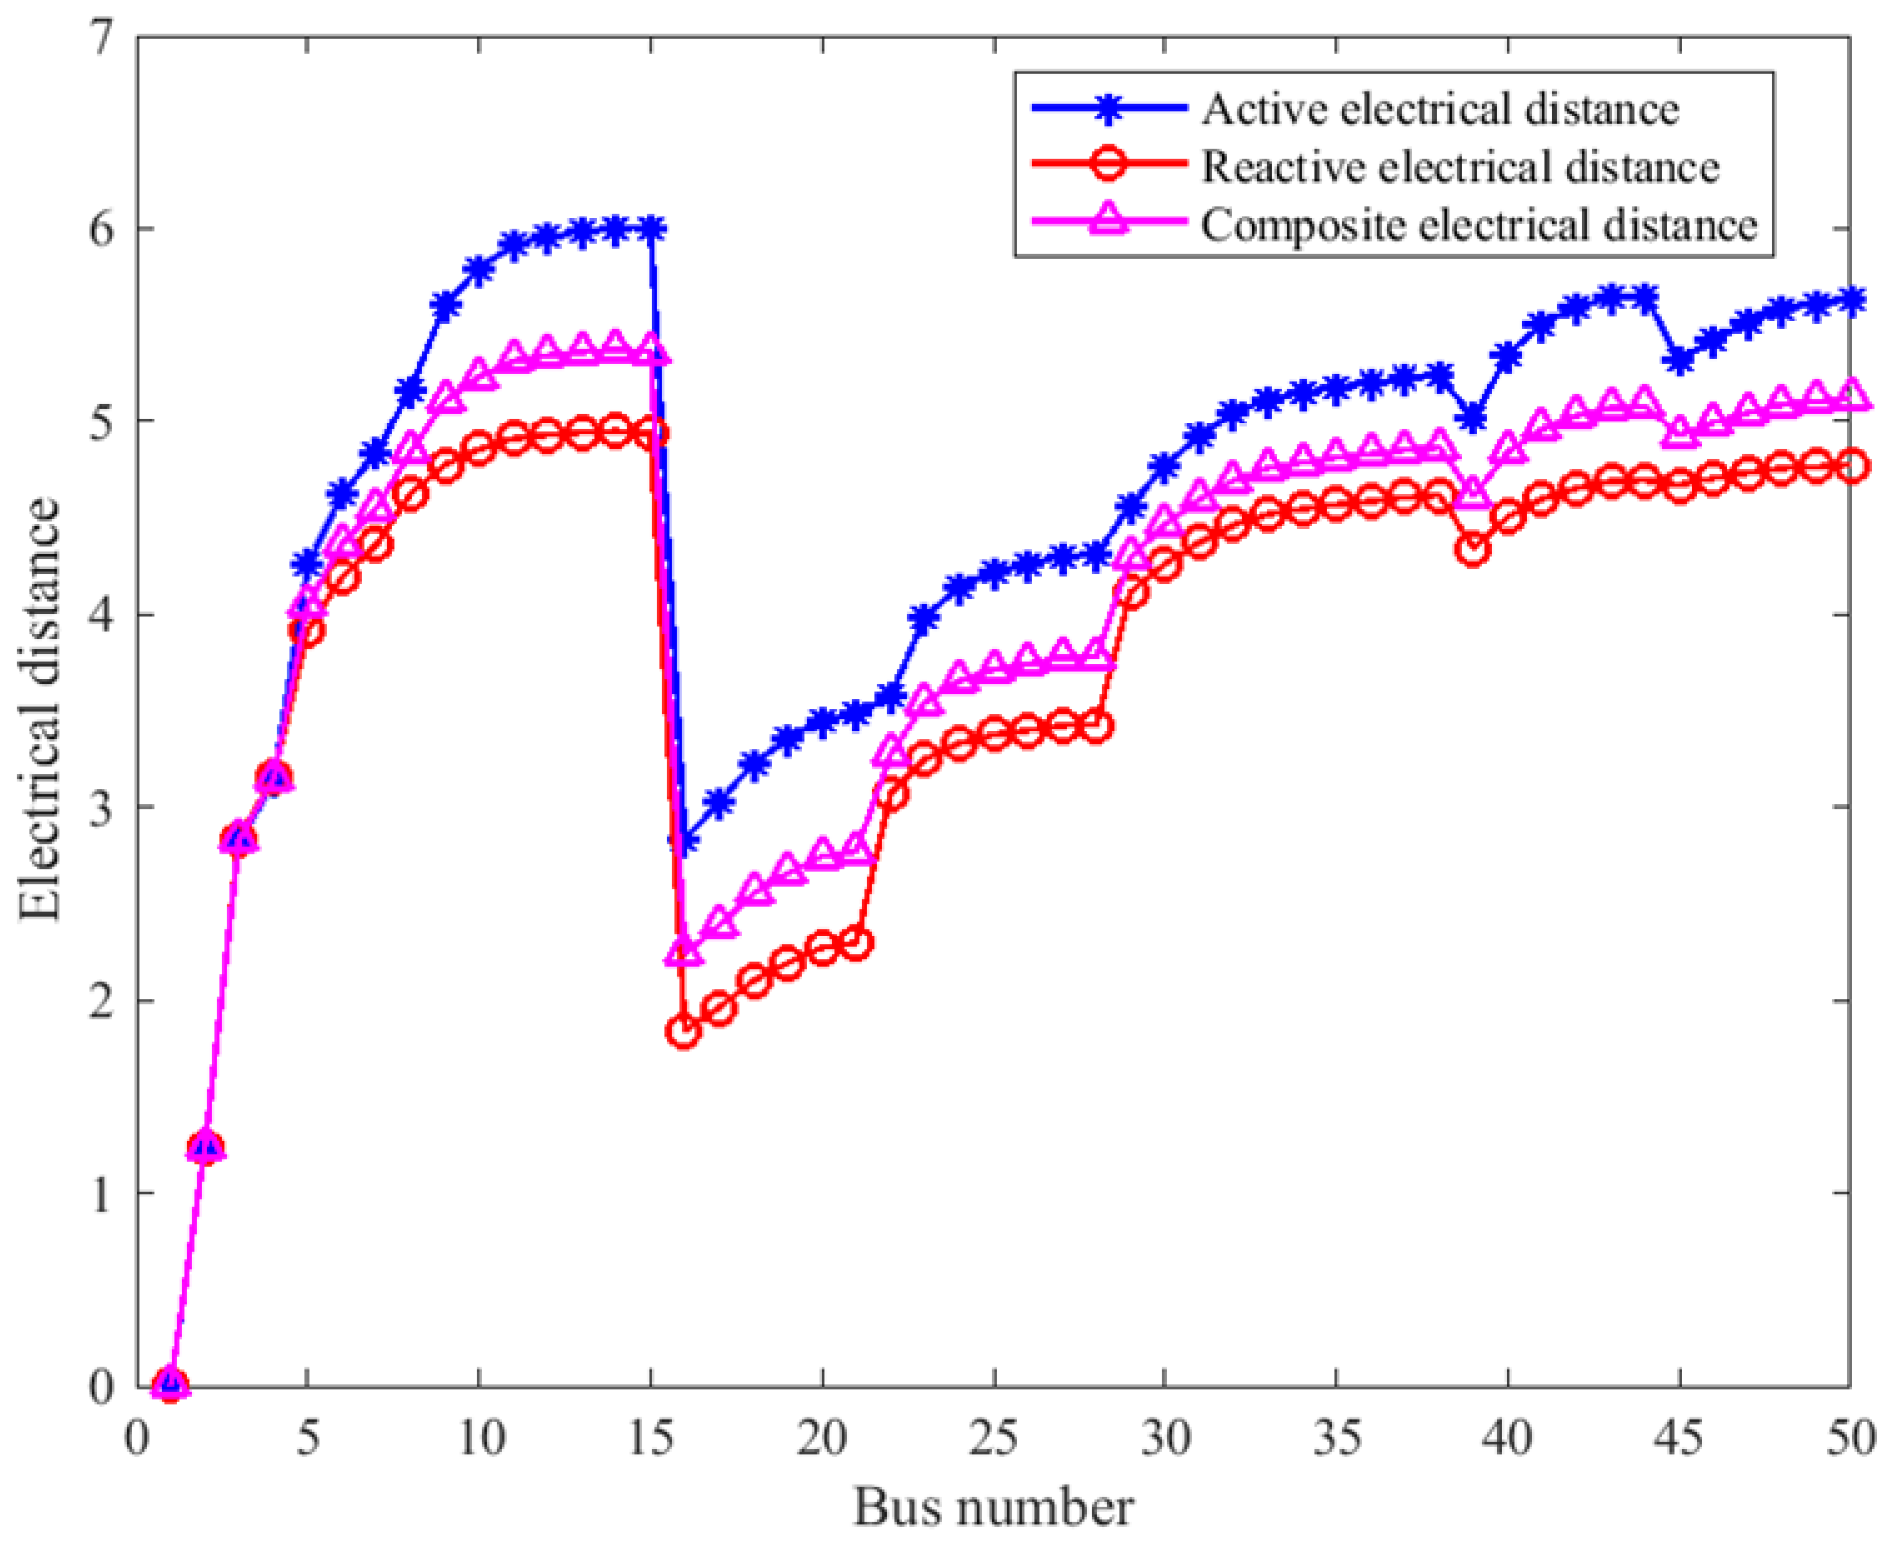
By analogy with Equations (3) and (4), the active electrical distances are obtained and shown in Appendix A Figure A1, where the overall trend matches that in the study of [14]. The electrical edge weight between nodes is computed from the electrical distances as
A i j = 1 H i j P + H i j Q max ( H P + H Q )
A modularity function σ, based on the improved electrical distance, is adopted to measure the electrical coupling and structural strength of clusters in the distribution network [15], expressed as
σ = 1 2 m i = 1 N b j = 1 N b A i j k i k j 2 m φ ( i , j )
where m = i = 1 N b j = 1 N b A i j / 2 is the sum of all edge weights in the network. k i = j = 1 N b A i j denotes the sum of weights of all edges connected to node i. The indicator φ(i,j) equals 1 if nodes i and j reside in the same cluster. Otherwise, it equals 0.

2.2. Design of Voltage Regulation Resource and Power Metrics

2.2.1. Voltage Regulation Resource Allocation

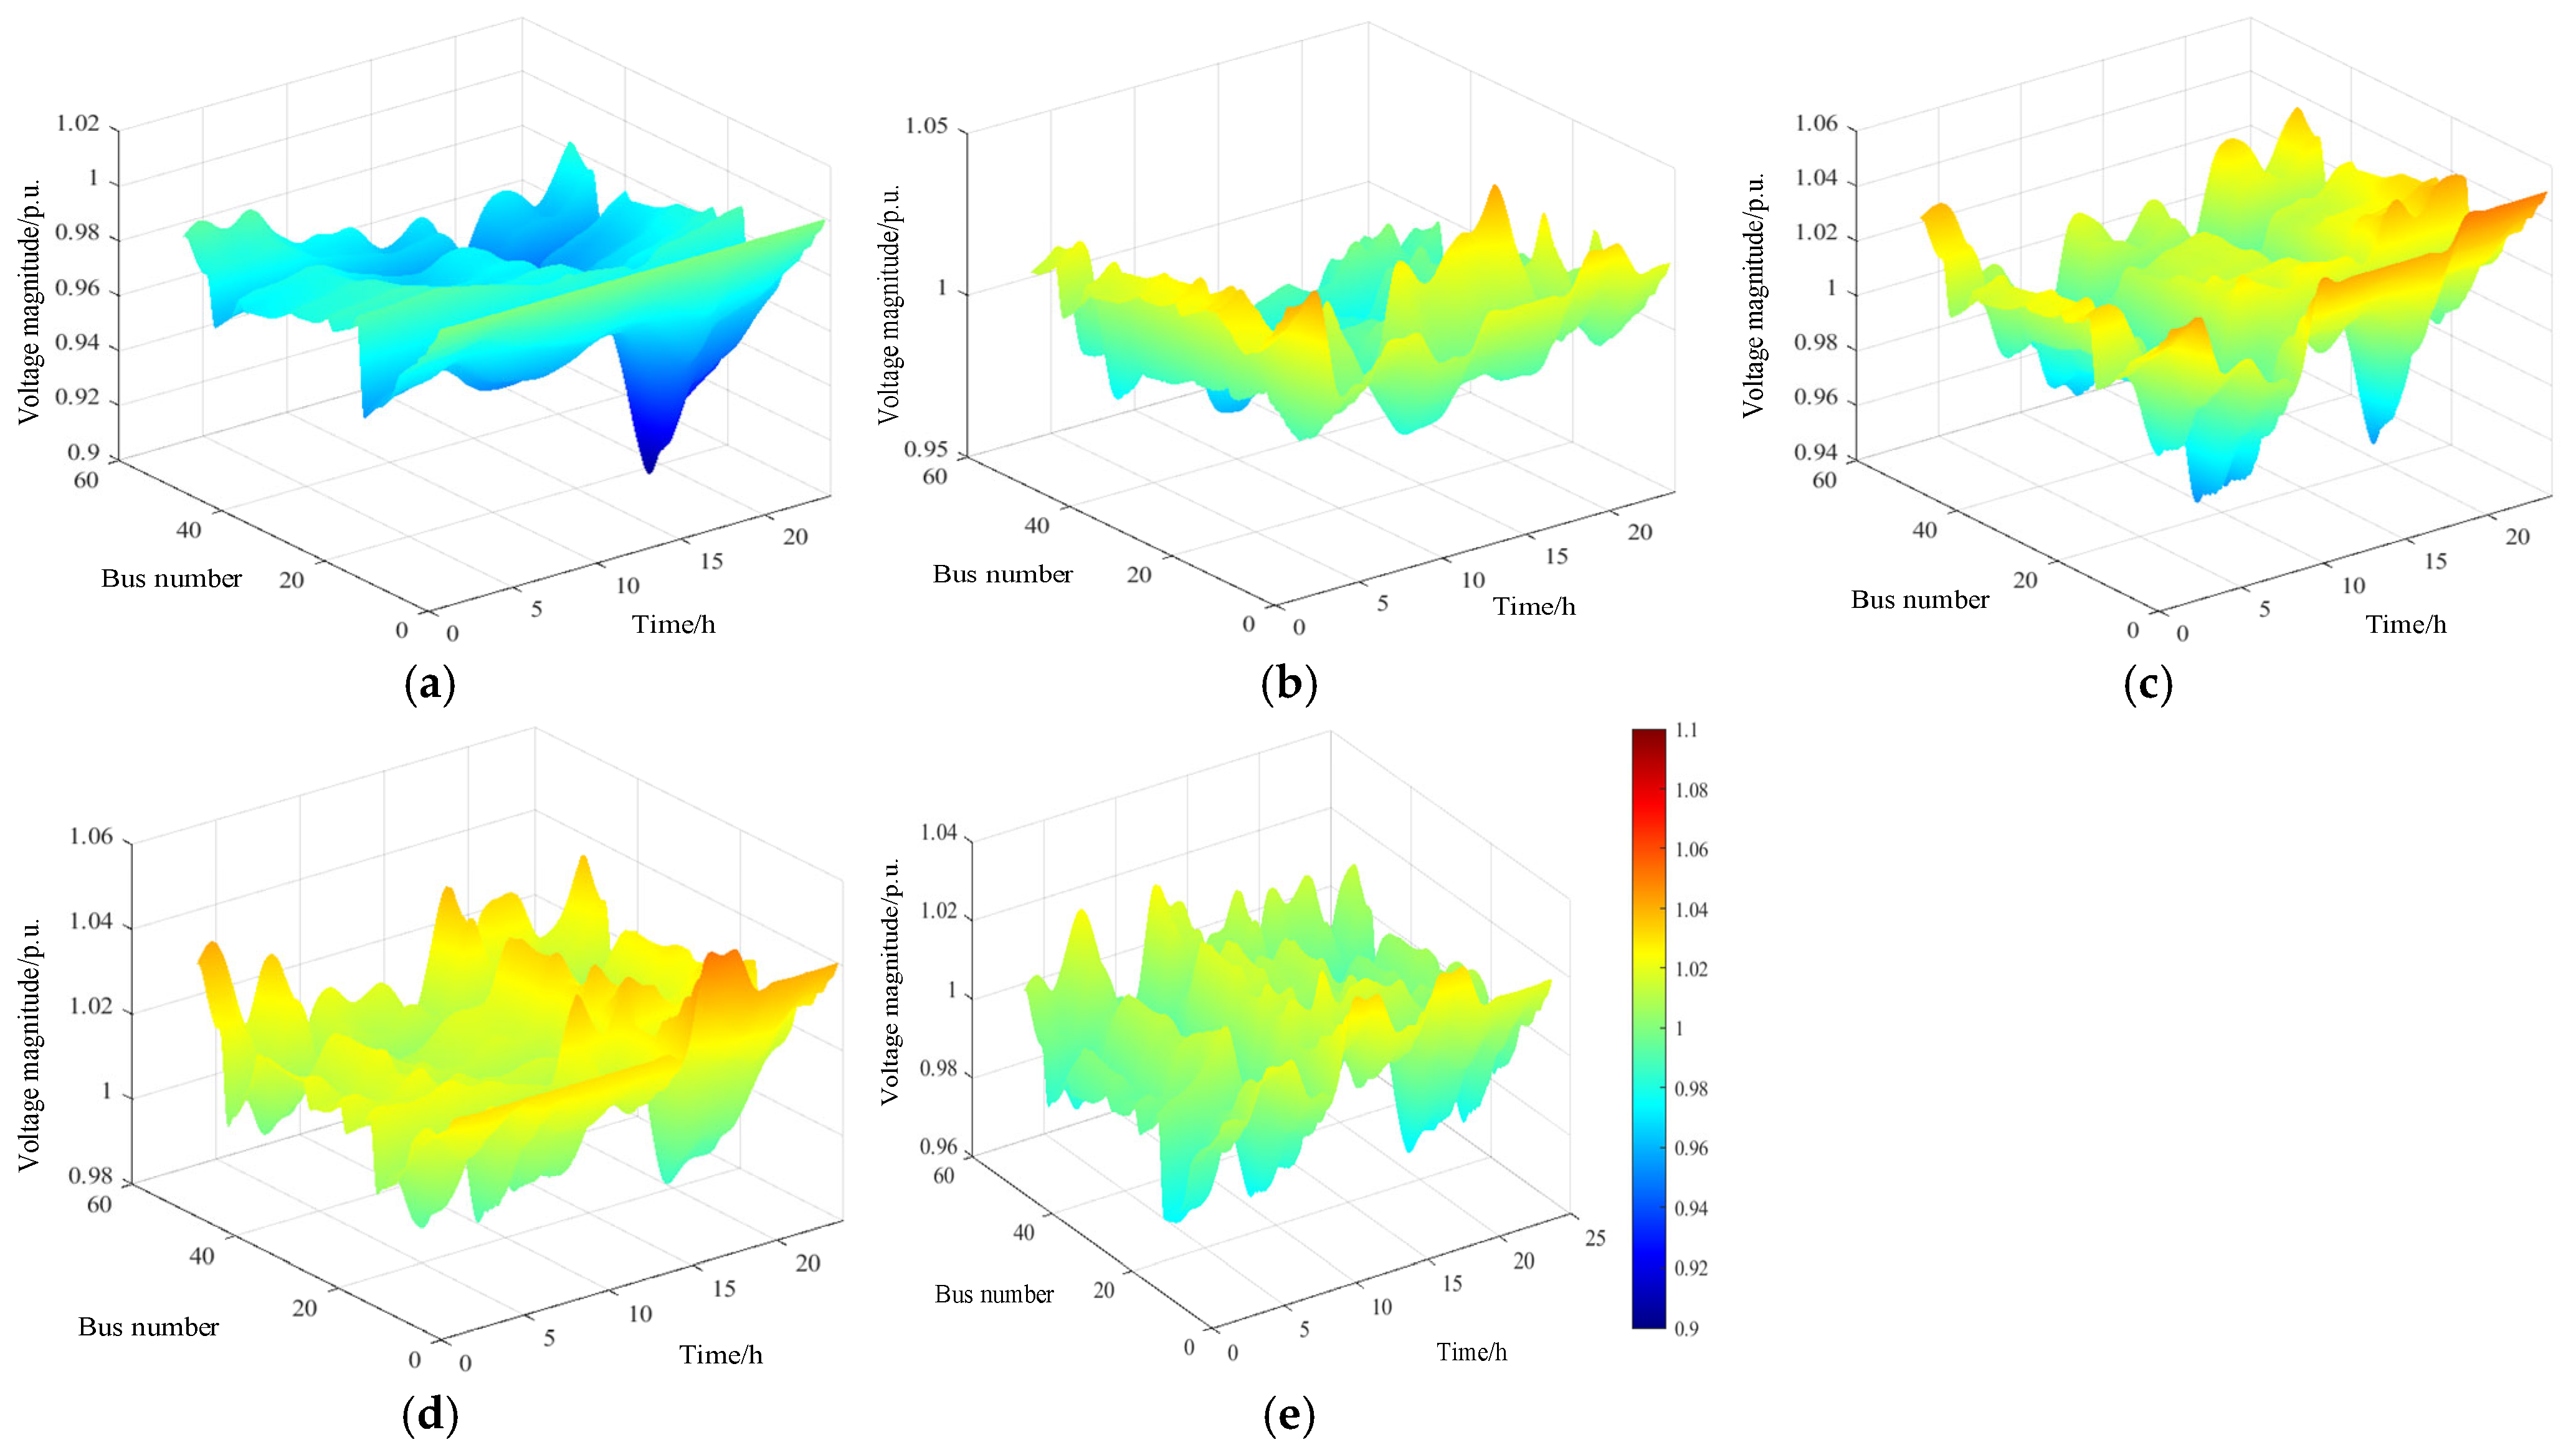
As the load fluctuations and uncertainty in wind–solar outputs increase, under-voltage occurs when load consumption is low, and over-voltage occurs when DG output is high. Figure 4a shows the per-unit bus voltage profile of the 24 h case study. As can be seen in Figure 4a, some bus voltages are still out of limits after DG connection. This finding indicates that DG connection alone could not provide effective local voltage support, and a risk of active or reactive power shortage within clusters still remains. Meanwhile, inter-cluster imbalance in voltage control device allocation could also lead to insufficient control response and resource waste.
To solve these issues, a power evaluation metric considering voltage regulation resource allocation is designed. This metric identifies the weakest cluster by assessing its active and reactive coverage capabilities and guides the selective deployment of Energy Storage Systems (ESSs), Capacitor Banks (CBs), and Static VAR Compensators (SVCs). This method not only compensates for active and reactive gaps within clusters but also maintains balanced inter-cluster resource distribution, thereby ensuring overall voltage safety and stability.

2.2.2. Active Power Coverage Metric

Based on the available active resources, an active power coverage metric is introduced. It is subdivided into two metrics: the intra-cluster active deficiency metric and inter-cluster active balance metric.
The active deficiency metric is designed to evaluate each cluster’s ability to support bus active power. More specifically, it is computed as the difference between the power demand of all buses and the ESS’s maximum output and reflects whether active resources are scarce or abundant. The formula is as follows:
P vac = min k 1 , , N col i C k P i load + j k R j ESS
where Ncol is the total number of clusters. Ck is the set of buses in the k-th cluster. ℜk is the set of active power resources in the k-th cluster. P i load is the difference between DG output and load demand, that is, the actual active power demand at bus i. R j ESS is the discharge capacity of the j-th ESS at full output.
The inter-cluster active balance metric is defined to measure balance in active resource allocation among clusters, expressed as
P dif = 1 N col k = 1 N col i C k P i load + j k R j ESS P var ¯ 2
where P var ¯ is the mean active power of each cluster under DG and ESS. Then, a sigmoid function is used to build the active coverage metric
P cover = 1 1 + exp α 1 ( P vac + P dif )
where α1 is a sensitivity factor that adjusts the steepness of the mapping. From (9), smaller intra-cluster active deficiency and smaller inter-cluster active difference yield larger Pcover. The reverse holds true as well.
Similarly, under reactive resource allocation, the reactive coverage metric is divided into two metrics: the intra-cluster reactive deficiency metric and the inter-cluster reactive balance metric. The reactive demand of cluster buses considered the maximum output of CB or SVC, and Qcover is obtained by referring to Equations (7)–(9).

2.3. Communication Distance Metric

In smart grids and distributed control systems, communication distance affects data latency and synchronization. Consequently, a communication distance metric is introduced in cluster partitioning to evaluate relative delay among nodes in the communication network, expressed as
C dis = 2 N k N k 1 i j ε k exp d i j
where εk and Nk are the set of branches connecting two nodes and the number of nodes in cluster k, respectively. dij is the composite communication distance between nodes i and j, expressed as
d i j = γ 1 d i j dis / D 0 + γ 1 L i j / L max + γ 3 P L R i j / P L R max
where γ1, γ2 and γ3 are weighting coefficients satisfying γ1 + γ2 + γ3 = 1. d i j dis and D0 denote the physical line length between bus i and j and the reference distance (100 km), respectively; Lij is the round-trip communication delay from buses i to j and back; PLRij is the ratio of lost packets between buses i and j to the total number of transmitted packets; Lmax and PLRmax are the maximum communication delay and the maximum packet loss rate observed in the current network, respectively [16].

2.4. Comprehensive Evaluation Metric

An integrated evaluation framework is constructed by a weighted combination of electrical structure, power regulation, and communication characteristics as follows
ρ = ω 1 σ + ω 2 P cover + ω 3 Q cover + ω 4 C dis
where ω1, ω2, ω3, and ω4 are the weighting coefficients of each metric and subject to ω1 + ω2 + ω3 + ω4 = 1.

2.5. Selection of Pilot Bus

The pilot bus can help clusters quickly identify connection nodes for resource allocation by considering the impacts of bus voltage and information transfer. By cluster partitioning and pilot bus connection, necessary power compensation is provided, which improves the system’s overall active and reactive power coordinated control capability to some extent.
The pilot bus selection is based on two metrics: a voltage evaluation metric and a communication centrality metric. First, the voltage evaluation metric I i V objectively reflects each bus’s relative voltage state and enables effective overall voltage regulation. Second, the communication centrality metric I i D measures each bus’s coverage capability in information transmission and ensures sufficient timeliness and stability. Thus, these two metrics together form the evaluation framework of the pilot bus, expressed as
I i = I i V + I i D I i V = 1 V i V min / V max V min I i D = 1 d i min { d i } / max { d i } min { d i }
where Vi is the voltage magnitude of bus i in the cluster. Vmin and Vmax are the minimum and maximum voltages of cluster k with resource allocation, that is, V min = min { V i | i C k } and V max = max { V i | i C k } . C k expresses the set of buses in cluster k. di = Di/D0 is the normalized link distance of bus i. Di and D0 denote the actual coverage distance of bus i and the reference communication distance, respectively.

3. Dynamic Cluster Control Strategy for Active Distribution Networks Based on NSGA-II

Despite the integration of voltage regulation resources, the distribution network experiences frequent voltage fluctuations and increased losses and costs due to the power randomness and volatility. Therefore, it is necessary to ensure system safety and stability [17]. Due to the inherent uncertainties in DG and load outputs, significant deviations frequently occur between forecasted and actual data. As a result, optimal operational performance is difficult to achieve with raw forecasts alone. In this section, resource allocation response times are taken into account, and an NSGA-II-based cluster voltage control model is developed.
The strategy assesses voltages at pilot buses and regulated voltage regulation resource allocations at those buses. The control variables are the power of DGs and voltage regulation resources at time t. In the active and reactive power coordination stage, OLTCs and CBs are discrete voltage devices, characterized by slow response times and the inability to perform continuous adjustment. In contrast, DGs, SVCs, and ESSs are categorized as continuous regulation devices, capable of rapid operation and efficient information exchange. The adaptive correction stage is based on power coordination control, aiming to mitigate the voltage variations in the DGs and load fluctuations.

3.1. Active and Reactive Power Coordination Control

The power coordination control model is based on a 1-day period and considers the minimum objective function of voltage deviation, network losses, and energy costs. The constraints include branch current constraints, OLTC constraints, CB constraints, ESS constraints, SVC constraints, DG output constraints, and voltage safety constraints.

3.1.1. Objective Function

To balance network security and economic operation, the voltage deviation, network losses, and energy cost are chosen as the optimization objectives of the voltage control model.
Δ U = max i , t | U i , t U ref | ,           i N b , t T ,
f loss = t = 1 T i , j = 1 N b G i j ( U i , t 2 + U j , t 2 2 U i , i U j , t cos θ i j , t ) ,
C cos t = t = 1 T c t BUY P t BUY + t = 1 T C dev , t
where ΔU, floss, and Ccost denote the voltage deviation, network losses, and power consumption cost, respectively. Ui,t represents the actual voltage magnitude at bus i and time t. Uref is the reference voltage (1 p.u.). Gij is the line conductance between buses i and j. c t BUY and P t BUY are the purchasing cost coefficient and purchased power for period t. T is 24 h. Cdev,t represents the operating cost of the control devices at time t and is expressed as
C dev , t = i = 1 N DG c i , t DG P i , t DG + k = 1 N SOU c k , t S k , t
where NDG denotes the number of DGs. c i DG and P i DG present the DG operating cost coefficient and its output, respectively. NSOU introduces the number of resource devices. ck,t and Sk,t are the cost coefficient vector of resource k at period t and the corresponding power absorption/injection, respectively. Power purchase costs and device operating costs are referenced from the study of [18].

3.1.2. Constraints

DistFlow power-flow constraints are adopted in [19] to ensure system power balance and voltage relations, expressed as
P j , t B U Y + P j , t D G P j , t D + P j , t D I S P j , t CH = k δ ( j ) P j k , t i ε ( j ) P i j , t R i j I i j , t 2 ,       j N b
Q j , t B U Y + Q j , t SVC Q j , t D + Q j , t CB = k δ ( j ) Q j k , t i ε ( j ) Q i j , t X i j I i j , t 2 ,           j N b
where P j , t B U Y , P j , t D G , P j , t D , P j , t D I S and P j , t CH denote, respectively, the active power of purchased electricity, DG output, load demand, ESS discharge, and ESS charge at bus j and time t. Q j , t B U Y , Q j , t SVC , Q j , t D and Q j , t CB are the reactive power of purchased electricity, SVC output/absorption, load demand, and CB output at bus j and time t. Pij,t and Qij,t present the active and reactive power flows on branch ij at time t. ε(j) and δ(j) indicate the sets of buses downstream from and upstream to bus j, respectively. Rij and Xij refer to the resistance and reactance of branch ij. Iij,t is the current magnitude on branch ij at time t. The voltage magnitude is as follows:
U j , t 2 = U i , t 2 2 ( P i j , t R i j + Q i j , t X i j ) + I i j , t 2 ( R i j 2 + X i j 2 ) , i j L ,
U j , t 2 I i j , t 2 = P i j , t 2 + Q i j , t 2 , i j L
where L is the set of branches, and U j , t 2 is the voltage magnitude at bus j in period t.
In the constraints on voltage regulation resources and DGs, discrete output devices such as OLTCs and CBs are limited in the number of operations per scheduling period to extend their service life. And continuously controllable devices like SVCs, ESS units, PV inverters, and wind turbine inverters are constrained by their device capacities and inherent output capabilities in both active and reactive power. Specific constraint formulations are provided in the study of [13].

3.2. Adaptive Correction Mechanisms Considering Uncertainty

3.2.1. Source Load Prediction Error Model

The adaptive correction model uses a time interval of ΔT = 15 min. Based on the actual source load operating state at the current time and the forecasted state at the next time step, it establishes a probabilistic model of source load prediction error and achieves the adaptive correction at the current time step. The prediction error of DG and load is treated as a random variable, which is expressed as the difference between the actual value and the predicted value.
The DG output follows a Beta distribution [20], and the probability density of the prediction error is expressed as
f ( P i , t DG ) = Γ ( α + β ) Γ ( α ) + Γ ( β ) ( P i , t DG P i , t DG , max ) α 1 ( 1 P i , t DG P i , t DG , max ) β 1
where α and β denote the shape parameters of the Beta distribution, and Γ represents the Gamma function. P i , t DG is the active power output of the i-th DG at time t, and P i , t DG , max is its maximum active power capacity.
The load prediction error is modeled by a normal distribution [21], and the probability density function is
f ( P i , t load ) = 1 2 π ε P e x p P i , t load μ P 2 2 ε P 2 f ( Q i , t load ) = 1 2 π ε Q e x p Q i , t load μ Q 2 2 ε Q 2
where P i , t load and Q i , t load are the active and reactive loads, respectively; εP and εQ denote the standard deviations of the active and reactive load errors; and μP and μQ denote their corresponding means.

3.2.2. Uncertainty Model

The error prediction of the uncertainty model is referenced to the distribution network’s current operating state. The objective function is then expressed as
F t = min Δ U t ,   min f loss , t   min C cos t , t
The branch current constraints, OLTC constraints, CB constraints, ESS constraints, SVC constraints, DG output constraints, and voltage security constraints are identical to those in the power coordination control model.

3.3. NSGA-II Model Solution

NSGA-II is a multi-objective genetic algorithm based on the concept of Pareto optimality. Two key mechanisms—non-dominated sorting and crowding distance—are introduced during selection and reproduction. First, the population is divided into several Pareto fronts according to dominance relations. Second, crowding distance is used to maintain diversity within each front, and then individuals from higher-ranked fronts are preferentially preserved. As a result, NSGA-II achieves both convergence and uniform solution distribution under reasonable computational complexity. The algorithm flow is shown in Appendix A, Figure A2. The details are provided in the study of [22], and the multi-objective optimization formulation for adaptive iterative updating is Equation (24).

4. Case Study

4.1. Case Overview and Parameter Settings

To validate the effectiveness of the proposed strategy, simulations are conducted on the IEEE 51-bus case [23]. The base voltage of the distribution system is 11 kV. The configurations of DG and voltage regulation resource are described below: PVs and wind turbines are installed at buses 16, 37, and 50, each with a capacity of 0.5 MW. Two ESS units are each assigned a 1 MWh energy capacity and a 0.2 MW charge/discharge power rating over one hour; charge efficiency is set to 0.9, and the initial state of charge is 0.05 MWh. An SVC is provided with a reactive power compensation range of −250 kvar to +250 kvar. An OLTC is located at bus 1, featuring 10 tap positions, a regulation range of ±5 × 1%, a step size of 0.01 p.u., and a maximum of 8 tap changes per period. Six capacitor-bank units are available; each unit offers a 50 kvar regulation step and is limited to eight switching operations per period.
Forecast data for the next 24 h are generated based on summer-day load and DG output data from a county in China, combined with historical meteorological analysis. The resulting forecast is shown in Appendix A, Figure A3a. As we can see, voltage violations below the lower limit are most pronounced at buses 11–16 during 16:00–21:00. And at 18:00, the voltage at bus 16 falls to 0.904 p.u. and must be mitigated by DG reactive power and resource allocation. Therefore, the 18:00 interval is chosen for cluster partitioning, providing the basis for resource allocation in subsequent power flow coordinated control.

4.2. Cluster Partitioning Results

A genetic algorithm (GA) is configured with a population size of 100 and a maximum of 200 generations. The crossover probability is set to 0.8. The mutation probability is initialized at 0.1 and increases with each generation. Roulette-wheel selection is used to retain individuals. The distribution network is partitioned, and voltage regulation resources are allocated based on the composite evaluation metric and pilot bus selection method. As shown in Figure 1, the network is divided into five clusters. Controllable devices are paired within selected clusters for active/reactive power regulation.
To validate the effectiveness of the proposed comprehensive evaluation metrics, both it and the clustering metric from [11] were compared using a genetic algorithm. Specifically, the metric in [11] considers only modularity, whereas the proposed metrics also account for power adequacy and communication latency. Table 1 presents the results for each method, averaged over 30 runs on the same 51-node test system.
First, the power margin results from the combined action of loads, DG units, and voltage regulation resources within the cluster, serving as the basis for the power coverage metric. In Cluster 1, Bus 1 serves as both the balancing bus and the slack bus, injecting 10 MW and 10 MVAr into the network. This configuration provides Cluster 1 with sufficient supply capacity to meet high-load demands, but its injection is excluded when calculating the power margins of Cluster 1. As a result, despite Cluster 1 having a large bus count and highly negative power margins, no actual supply–demand deficit exists.
Second, when considering power margins for all clusters except Cluster 1, each cluster exhibits a reactive power surplus using the proposed metrics, and Clusters 3 and 4 also meet their active power demands; by contrast, under the metric in [11], Clusters 2 and 4 show deficits in both. Moreover, compared with [11], our power coverage metric improves reactive and active coverage by 11.94% and 12.87%, respectively. These results demonstrate that the proposed metrics allocate regulation resources more rationally and address supply–demand gaps more effectively.
Finally, in terms of modularity and communication distance metrics, our design outperforms the clustering metric in [11] by 3.96% and 16.40%, respectively, demonstrating enhanced node coupling and communication timeliness.

4.3. Multi-Objective Optimization Control Results

4.3.1. Analysis of NSGA-II Algorithm Results

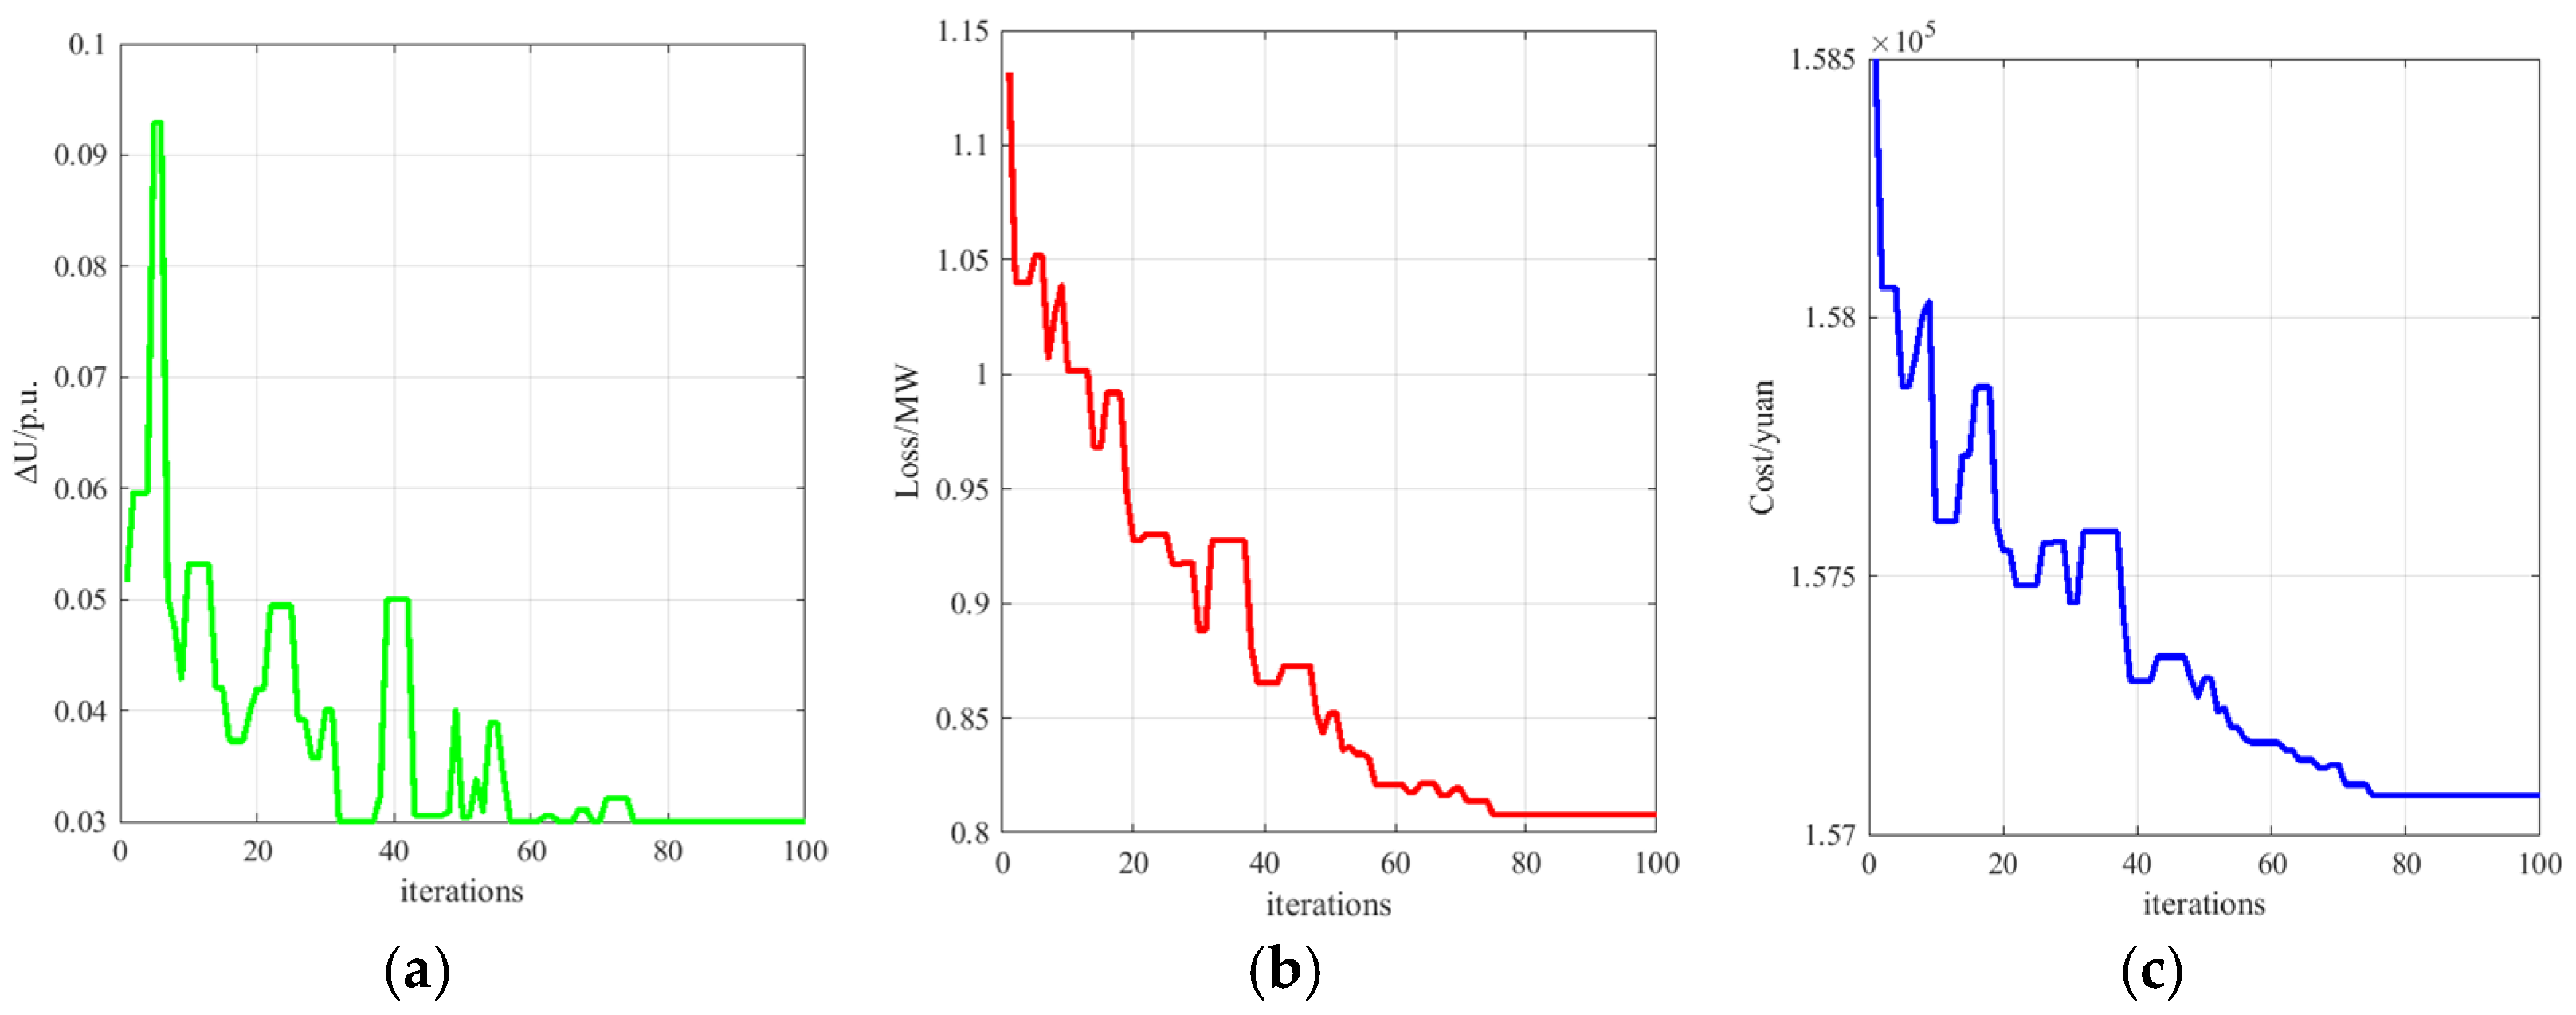
A 24 h dynamic simulation is conducted on the MATLAB R2022b platform. The algorithm parameters are set as follows: a population size of 100 and a maximum of 100 generations, with crossover and mutation rates at 0.9 and 0.1, respectively. Based on NSGA-II with objective (24) and the clustering results in Figure 1, the model performs coordinated active/reactive power control. Figure 2 shows the evolution of its three objective functions over the iterations.
Figure 2 shows voltage deviation, network losses, and cost steadily decreasing as iterations progress. Although the smaller range of voltage deviation induces more pronounced curve fluctuations, all three objective curves stabilize after the 80th iteration. Figure 3 shows the Pareto front distribution obtained by NSGA-II at the 100th iteration.
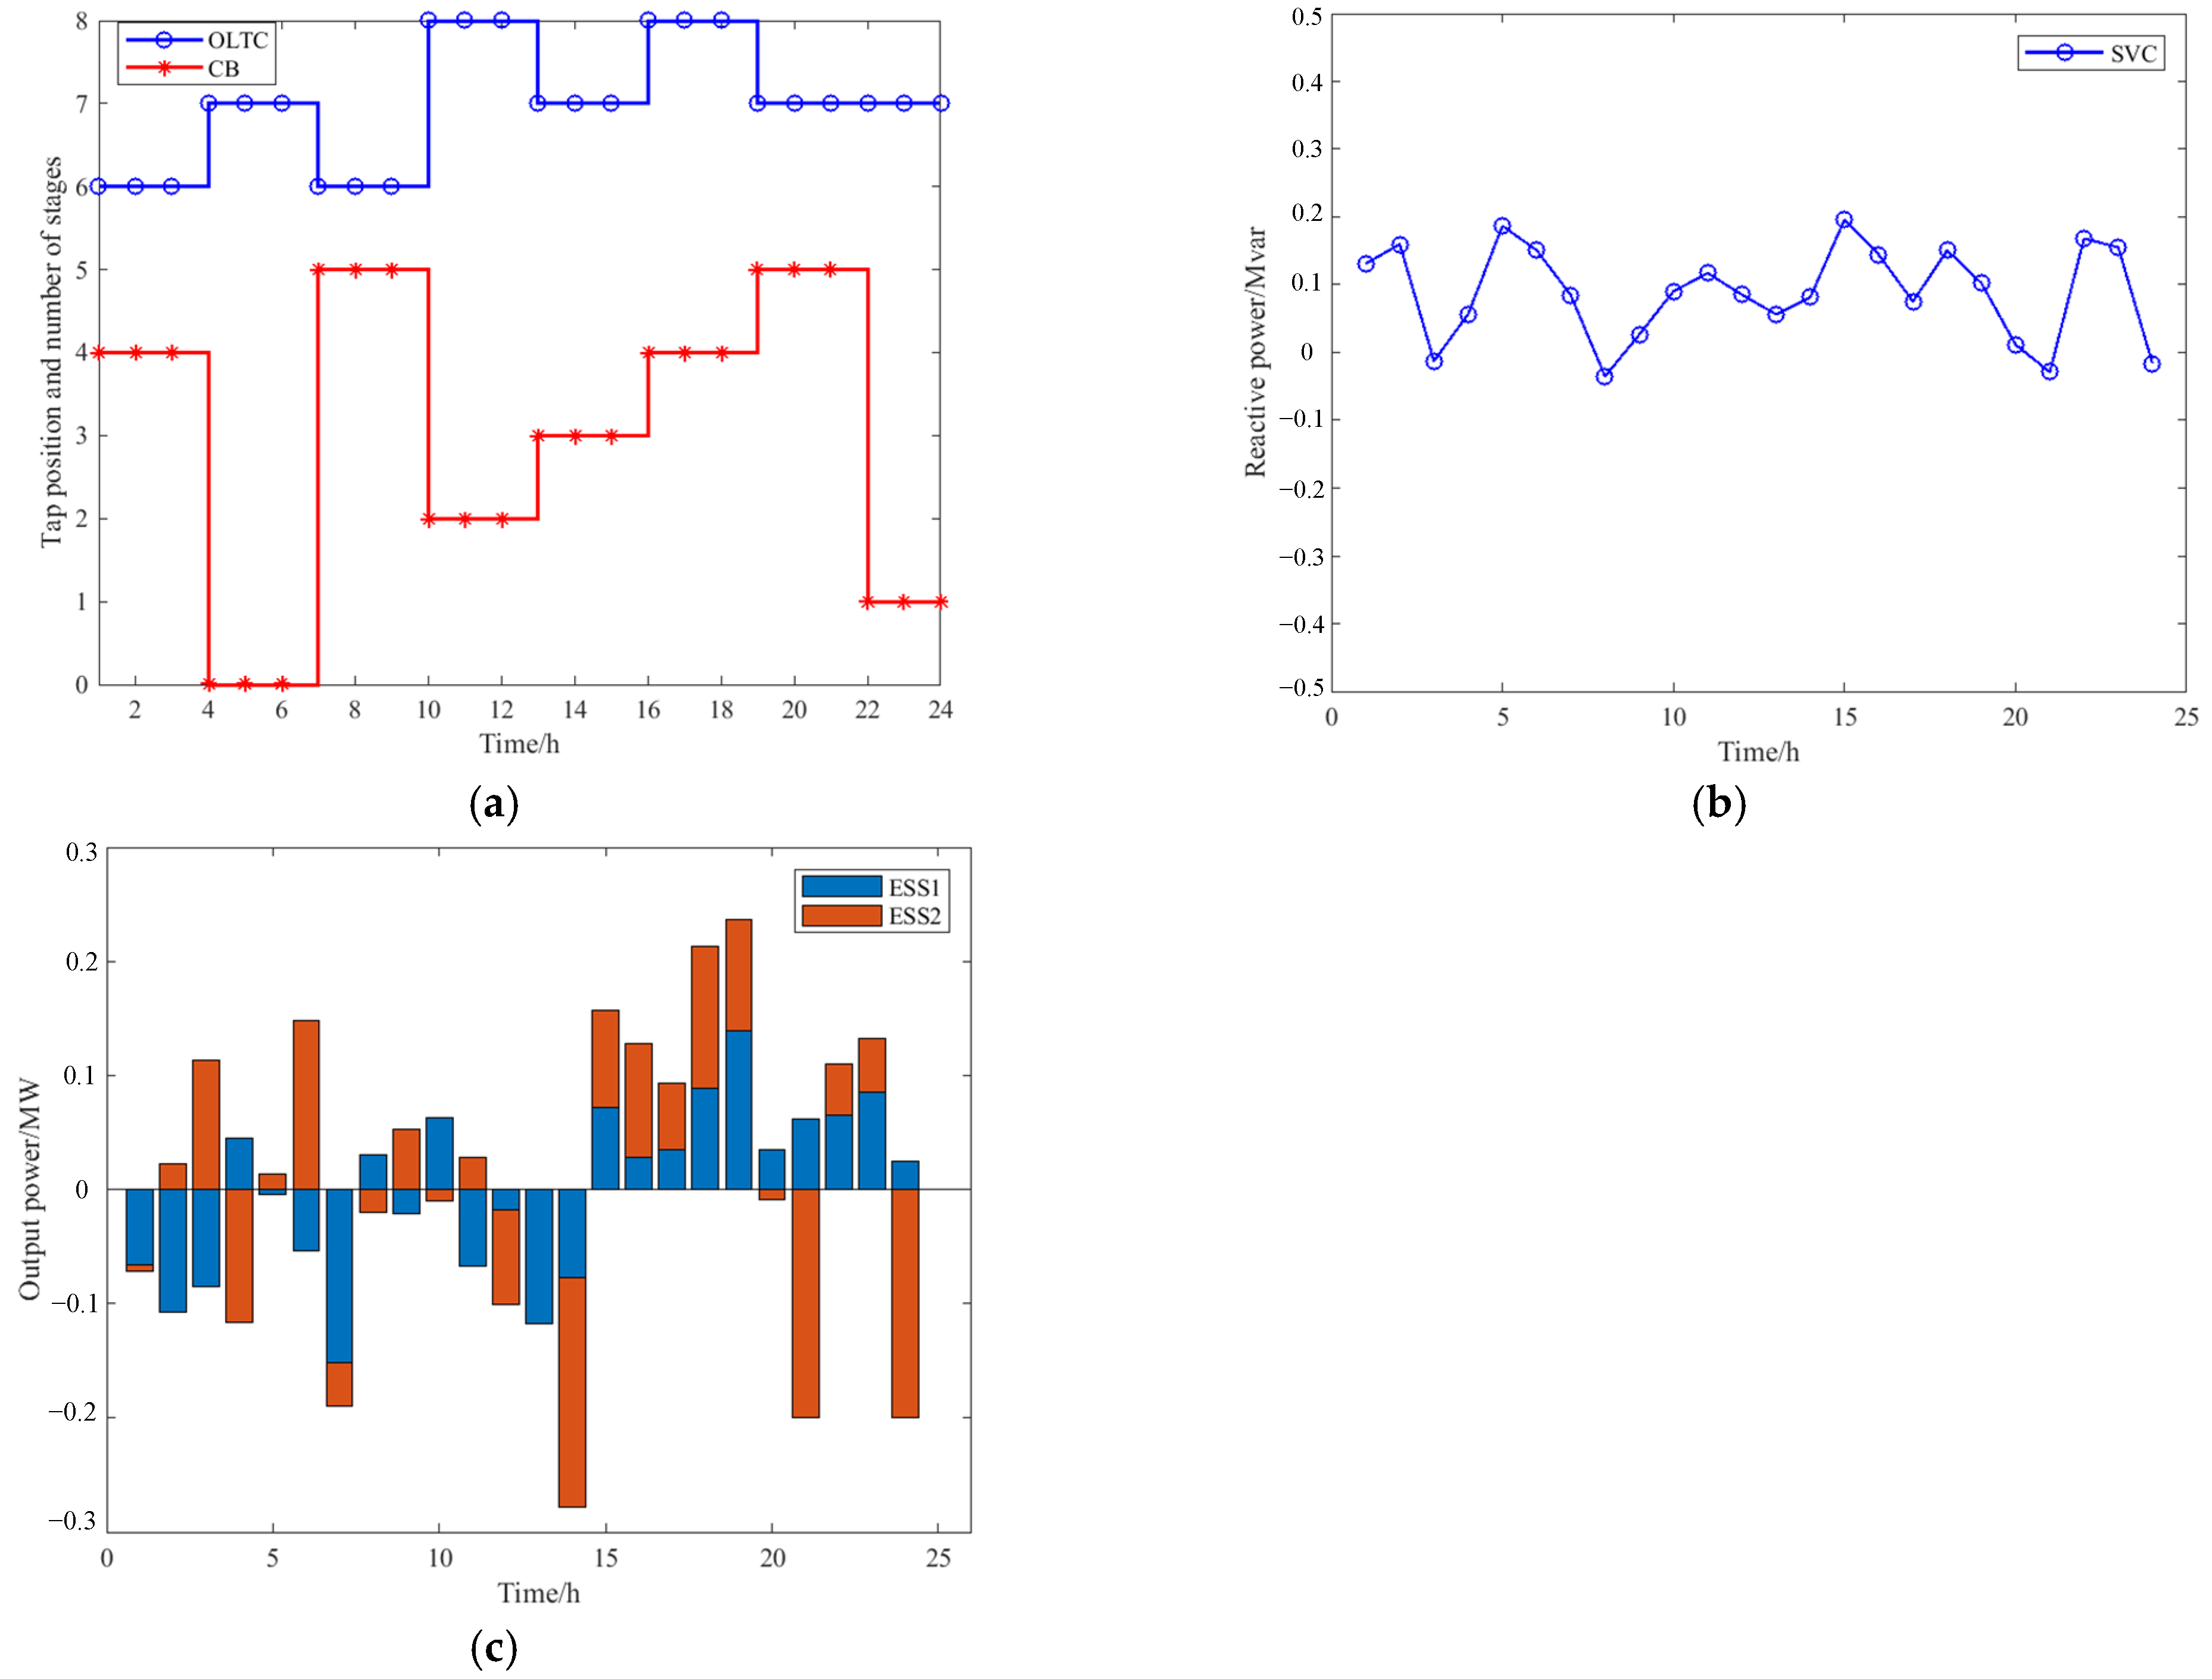
As shown in Figure 3, the solution set presents a typical trade-off surface across the three objective dimensions, which exhibits good diversity and convergence. The red circle is identified as rank 1 of the Pareto solution with the largest crowding distance, and the solution is therefore adopted as the final power flow control result. The operating parameters of DGs and voltage regulation resources are provided in Appendix A (Figure A4).
To verify the superiority of the optimization method proposed in this paper, we compared it with two other heuristic algorithms: multi-objective particle swarm optimization (MOPSO) and the multi-objective evolutionary algorithm based on decomposition (MOEA/D). Each algorithm was executed 100 times, and the results for voltage deviation, network losses, and power consumption cost are summarized in Table 2.
As can be seen from Table 2, the network losses and power consumption cost using the NSGA-II algorithm are superior to those of MOPSO and MOEA/D. Although MOEA/D and NSGA-II achieve the same voltage deviation, NSGA-II reduces network losses by 8.7 kW and electricity costs by RMB 2550 compared to MOEA/D.

4.3.2. Multi-Scenario Safety Comparison

To validate the safety and economic performance of the proposed strategy, five scenarios are simulated under 24 h operating conditions:
(1)
Scenario 1: Only DGs are employed for the network.
(2)
Scenario 2: Centralized control with DGs and resources (see Appendix A, Figure A5a).
(3)
Scenario 3: Active power regulation with DGs and ESS units (see Appendix A, Figure A5b).
(4)
Scenario 4: Reactive power regulation with DGs, SVCs, and CBs (see Appendix A, Figure A5c).
(5)
Scenario 5: Active and reactive power cluster voltage control (see Figure 1).
Figure 4 shows the time series of bus voltage per-unit values for each scenario. In particular, the color-bar legend on the right in Figure 4e maps voltage per-unit values to colors. And the same mapping applies to all subfigures in Figure 4.
In Scenario 1, no voltage regulation resources are present, and voltage violations are observed at some buses, particularly at 18:00. In contrast, regulation resources are employed in Scenarios 2–5, and these violations are eliminated, although the effectiveness varies. Scenario 3 applies real power optimization control with ESS units and DGs. From Figure 4c, Bus 7 voltage falls to 0.952 p.u. at 16:00. This undervoltage risk is caused by insufficient reactive power compensation. Scenario 4 uses reactive power devices such as SVCs and CBs. Although the dynamic injection and absorption of reactive power raise all bus voltages above 0.98 p.u., overvoltage is induced by excessive DG active power injection (Bus 1 reaches 1.051 p.u. at 16:00). Therefore, real and reactive power optimized control is required to meet voltage limit criteria in all day dynamic operating conditions.
Scenario 2 and Scenario 5 both employ coordinated power flow control. In Scenario 2, a centralized dispatch scheme is implemented at the feeder end. The daily minimum and maximum voltages are 0.956 p.u. and 1.041 p.u., respectively. This range is narrower than those in Scenarios 3 and 4, indicating improved voltage stability. However, this ‘one size fits all’ centralized approach cannot account for regional impedance characteristics and load temporal variations. As a result, slight overvoltage risks remain at certain buses. In contrast, Scenario 5 applies cluster voltage control by considering electrical distance, power margins, and line impedance differences. The overall voltage fluctuation bandwidth is confined to 0.97–1.032 p.u., which achieves the optimal dynamic per-unit voltage performance of the distribution network.
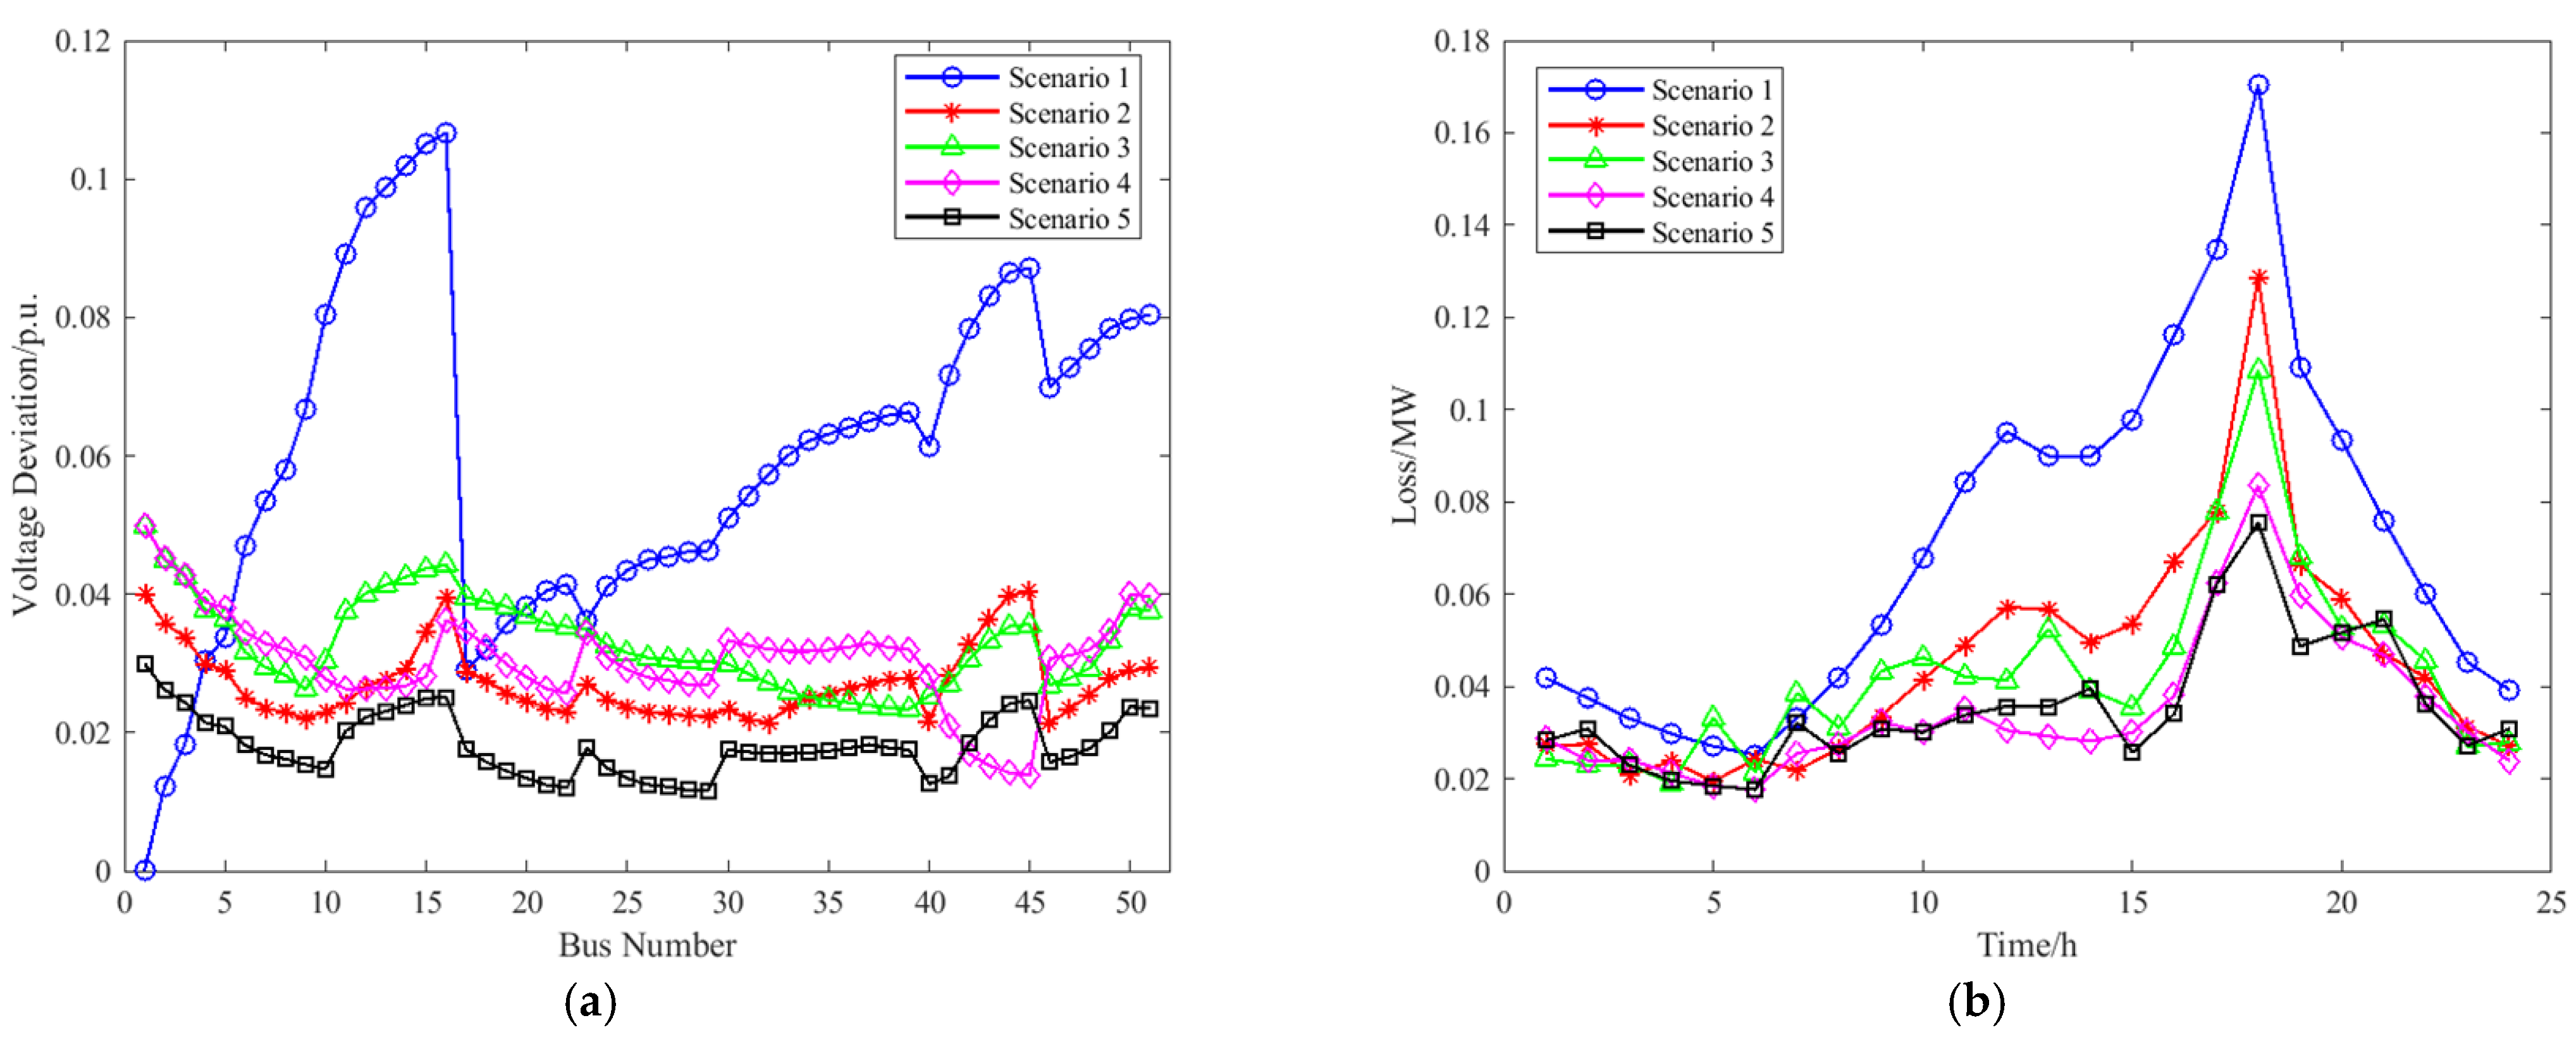
A reference voltage of 1 p.u. is used to calculate voltage deviations under various operating conditions, and the results are shown in Figure 5a. Although local deviations at buses 42–45 reach a minimum in Scenario 4, overall deviation is minimized in Scenario 5, and its performance is superior. Network losses under different scenarios are presented in Figure 5b. Losses in Scenarios 4 and 5 differ only slightly. This is because both scenarios employ the same voltage/var control, and I2R losses from reactive currents are minimal. However, Scenario 5—guided by stability and economic objectives—causes a slight loss increase of 0.0116 MW. This marginal rise reflects the loss penalty incurred for enhanced voltage quality in the multi-objective optimization. But the additional loss represents only 1.44% of Scenario 5’s total network losses and is therefore acceptable.

4.3.3. Multi-Scenario Economic Comparison

Economic costs of various scenarios are shown in Table 3. Power consumption cost is highest in Scenario 2, second in Scenario 3, and lowest in Scenario 5, and the cost of Scenario 2 is 0.72% higher than Scenario 5. This increase is attributed to the centralized power control strategy’s uneven resource allocation, which leads to frequent device cycling and reduced scheduling efficiency. The operating cost in Scenario 5 is reduced by approximately 0.29% and 0.10% compared to Scenarios 3 and 4, respectively. This small difference indicates that more frequent device operations in Scenarios 3 and 4 result in a shortened equipment lifespan and higher operating cost. However, Scenario 5 not only achieves the lowest power consumption cost through coordinated active/reactive power optimization but also balances device loads and alleviates maintenance pressure. The economic advantage of the cluster voltage regulation strategy is thereby demonstrated.

4.4. Uncertainty Impact Analysis

To verify the impact of uncertainty in this paper, two cases are defined:
Case 1: No uncertainty correction mechanism is applied. Voltage control is performed using day-ahead forecast data only.
Case 2: An adaptive uncertainty correction mechanism is employed to achieve optimized voltage control.
In Case 2, optimization was performed over 96 intervals throughout the day, and the resulting continuous fluctuation forecast data are shown in Figure A3b. Next, simulation results for the eight intervals from 10:15 to 12:00 are obtained in both Case 1 and Case 2, and the corresponding resource allocation control actions are derived. Finally, these control actions are applied separately to the actual operating data of the same day, and Table 4 presents the optimized results for each case.
Voltage deviation is referenced to 1.00 p.u. As shown in Table 4, network losses, average voltage deviation, and energy costs are reduced by 27.78%, 22.16%, and 10.25%, respectively, in Case 2 compared to Case 1. This is because overcompensation caused by single-point forecasts is prevented under the uncertainty correction mechanism. Consequently, power consumption costs and network losses are lowered. Voltage stability is thus achieved more precisely.

5. Conclusions

In summary, the contributions of the proposed cluster voltage control method considering power deficits and resource allocation are as follows:
(1)
An improved clustering optimization method is proposed. Voltage regulation resources are introduced to address power deficit risk and uneven resource allocation in the distribution network. The results show that the proposed clustering partitioning metric makes a more uniform power distribution with lower margin requirements.
(2)
In the cluster voltage control model, the NSGA-II algorithm shows algorithmic superiority over the next best MOEA/D algorithm by reducing the network loss and power consumption cost by 8.7 kW and RMB 2550, respectively.
(3)
In multi-scenario comparative analyses, the full-day voltage deviation is reduced from 0.085 p.u. under centralized control to 0.062 p.u. Network losses and power consumption costs are reduced by 27.41% and 0.72%, respectively. This approach effectively suppresses voltage fluctuations and lowers both network losses and energy costs.
Considering the limitations of computational power and the unpredictability of real-world engineering, future work will employ the ADMM algorithm for parallel subcluster computation and thoroughly investigate the impact of uncertainty scenarios on voltage control.

Author Contributions

Conceptualization, X.W., P.M. and D.Z.; methodology, J.T. and J.X.; software, X.W.; validation, X.W.; formal analysis, X.W.; investigation, J.X.; resources, P.M. and D.Z.; data curation, Y.Z.; writing—original draft preparation, X.W.; writing—review and editing, X.W. and J.T.; visualization, D.Z.; supervision, P.M.; project administration, P.M.; funding acquisition, P.M. All authors have read and agreed to the published version of the manuscript.

Funding

This research received no external funding.

Data Availability Statement

The original contributions presented in this study are included in this article; further inquiries can be directed to the corresponding author.

Conflicts of Interest

The authors declare no conflicts of interest.

Appendix A

Figure A1. Electrical distance of buses.
Electronics 14 02639 g0a1
Figure A2. Flowchart of the NSGA-II algorithm.
Electronics 14 02639 g0a2
Figure A3. Fluctuation curves of load and DG: (a) Day-ahead forecast curves for load and DG output. (b) Continuous fluctuation forecast data.
Electronics 14 02639 g0a3
Figure A4. Result of cluster voltage control strategy: (a) Number of OLTC/CB stages engaged. (b) SVC reactive power absorption/injection. (c) ESS charging/discharging power.
Electronics 14 02639 g0a4
Figure A5. Distribution network topologies in different scenarios: (a) Scenario 2. (b) Scenario 3. (c) Scenario 4.
Electronics 14 02639 g0a5

References

  1. Liang, Z.; Ye, C.; Liu, Z.; Li, M.; Wang, P.; Zhao, J. Grid-connected scheduling and control of distributed generations clusters: Architecture and key technologies. Power Syst. Technol. 2021, 45, 3791–3802. [Google Scholar]
  2. Chamana, M.; Chowdhury, B.H.; Jahanbakhsh, F. Distributed Control of Voltage Regulating Devices in the Presence of High PV Penetration to Mitigate Ramp-Rate Issues. IEEE Trans. Smart Grid 2018, 9, 1086–1095. [Google Scholar] [CrossRef]
  3. Xu, J.; Cao, Q. Research on the status and application of distributed photovoltaic grid-connected power generation in China. Energy Conserv. 2020, 6, 45–48. [Google Scholar]
  4. Liu, Z.; Zhao, S.; Luo, X.; Huang, Y.; Gu, R.; Li, J.; Li, L. Two-layer energy dispatching and collaborative optimization of regional integrated energy system considering stakeholders game and flexible load management. Appl. Energy. 2025, 379, 124918. [Google Scholar] [CrossRef]
  5. Su, Z.; Zheng, G.; Wang, G.; Mu, Y.; Fu, J.; Li, P. Multi-objective optimal planning study of integrated regional energy system considering source-load forecasting uncertainty. Energy 2025, 319, 134861. [Google Scholar] [CrossRef]
  6. Ding, T.; Li, C.; Yang, Y.; Jiang, J.; Bie, Z.; Frede, B. A two-stage robust optimization for centralized-optimal dispatch of photovoltaic inverters in active distribution networks. IEEE Trans. Sustain. Energy 2016, 8, 744–754. [Google Scholar] [CrossRef]
  7. Florez, H.; López, G.; Carreo-Franco, E.M.; Muñoz-Galeano, N.; López-Lezama, J.M. Application of intelligent systems in volt-var centralized control in modern distribution systems of electrical energy. Electronics 2022, 11, 446. [Google Scholar] [CrossRef]
  8. Samende, C.; Bhagavathy, S.; McCulloch, M. Power loss minimization of off-grid solar DC nano-grids-part I: Centralized control algorithm. IEEE Trans. Smart Grid 2021, 12, 4715–4725. [Google Scholar] [CrossRef]
  9. Zhang, Z.; Wang, Y.; Wang, C.; Su, Y.; Wang, Y.; Dai, Y. Distributed Chance-Constrained Optimal Dispatch for Integrated Energy System With Electro-Thermal Couple and Wind-Storage Coordination. IEEE Trans. Ind. Appl. 2025, 61, 833–846. [Google Scholar] [CrossRef]
  10. Yang, Y.; Sun, Y.; Wang, Q.; Liu, F.; Zhu, L. Fast Power Grid Partition for Voltage Control With Balanced-Depth-Based Community Detection Algorithm. IEEE Trans. Power Syst. 2022, 37, 1612–1622. [Google Scholar] [CrossRef]
  11. Hu, X.; Yin, R.; Shi, M.; Zhu, P.; Li, T. Distributed Photovoltaic Cluster Partition and Reactive Power Optimization Strategy Based on Improved Particle Swarm Optimization Algorithm. Power Capacitor React. Power Compens. 2021, 42, 14–21. [Google Scholar]
  12. Ge, J.; Liu, Y.; Pang, D.; Wang, C.; Wang, Z.; Liu, Z. Cluster Division Voltage Control Strategy of Photovoltaic Distribution Network with High Permeability. High Volt. Eng. 2024, 50, 74–82. [Google Scholar]
  13. Li, X.; Xie, J.; Zhang, S. A Two-Stage Robust Strategy for Voltage/Var Control in Distribution Networks Based on Cluster Partitioning. Proc. CSEE 2024, 1–14. Available online: https://link.cnki.net/urlid/11.2107.tm.20240930.1418.003 (accessed on 10 May 2025).
  14. Ding, M.; Liu, X.; Bi, R.; Hu, D.; Ye, L.; Zhang, J. Method for cluster partition of high-penetration distributed generators based on comprehensive performance index. Autom. Electr. Power Syst. 2018, 42, 47–52. [Google Scholar]
  15. Li, C.; Dong, Z.; Li, J.; Zhang, H.; Jin, Q.; Qian, K. Control strategy of voltage regulation for distributed energy storage cluster in distribution network. Autom. Electr. Power Syst. 2021, 45, 133–141. [Google Scholar]
  16. Kebebew, A.; Ababu, Y.; Mulugeta, L. Towards Developing Enhanced Cluster-Based QoS-Aware Routing in MANET. J. Comput. Netw. Commun. 2020, 2020, 5481916. [Google Scholar]
  17. Li, P.; Zhang, C.; Wu, Z.; Xu, Y.; Hu, M.; Dong, Z. Distributed adaptive robust voltage/var control with network partition in active distribution networks. IEEE Trans. Smart Grid 2020, 11, 2245–2256. [Google Scholar] [CrossRef]
  18. Qi, Y.; Shang, X.; Nie, J.; Huo, X.; Wu, B.; Su, W. Optimization of CCHP micro-grid operation based on improved multi-ob- jectivegrey wolf algorithm. Electr. Meas. Instrum. 2022, 59, 12–19. [Google Scholar]
  19. Hou, S.; Fu, A.; Duque, E.M.; Palensky, P.; Chen, Q.; Vergara, P.P. DistFlow Safe Reinforcement Learning Algorithm for Voltage Magnitude Regulation in Distribution Networks. J. Mod. Power Syst. Clean Energy 2025, 13, 300–311. [Google Scholar] [CrossRef]
  20. Wang, Z.; Wang, Z.; Wang, Z.; Pang, D.; Ge, J. Multi-time Scale Distributed Voltage Optimization for High Penetration Photovoltaic AC/DC Hybrid Distribution Networks. High Volt. Eng. 2024, 1–15. [Google Scholar] [CrossRef]
  21. He, Y.; Li, Y.; Liu, J.; Xiang, X. A Two-Stage Fault Reconfiguration Strategy for Distribution Networks with High Penetration of Distributed Generators. Electronics 2025, 14, 1872. [Google Scholar] [CrossRef]
  22. Deb, K.; Pratap, A. A fast and elitist multiobjective genetic algorithm: NSGA-II. IEEE Trans. Evol. Comput. 2002, 6, 182–197. [Google Scholar] [CrossRef]
  23. Gampa, S.; Das, D. Optimum placement and sizing of DGs considering average hourly variations of load. Int. J. Electr. Power Energy Syst. 2015, 66, 25–40. [Google Scholar] [CrossRef]
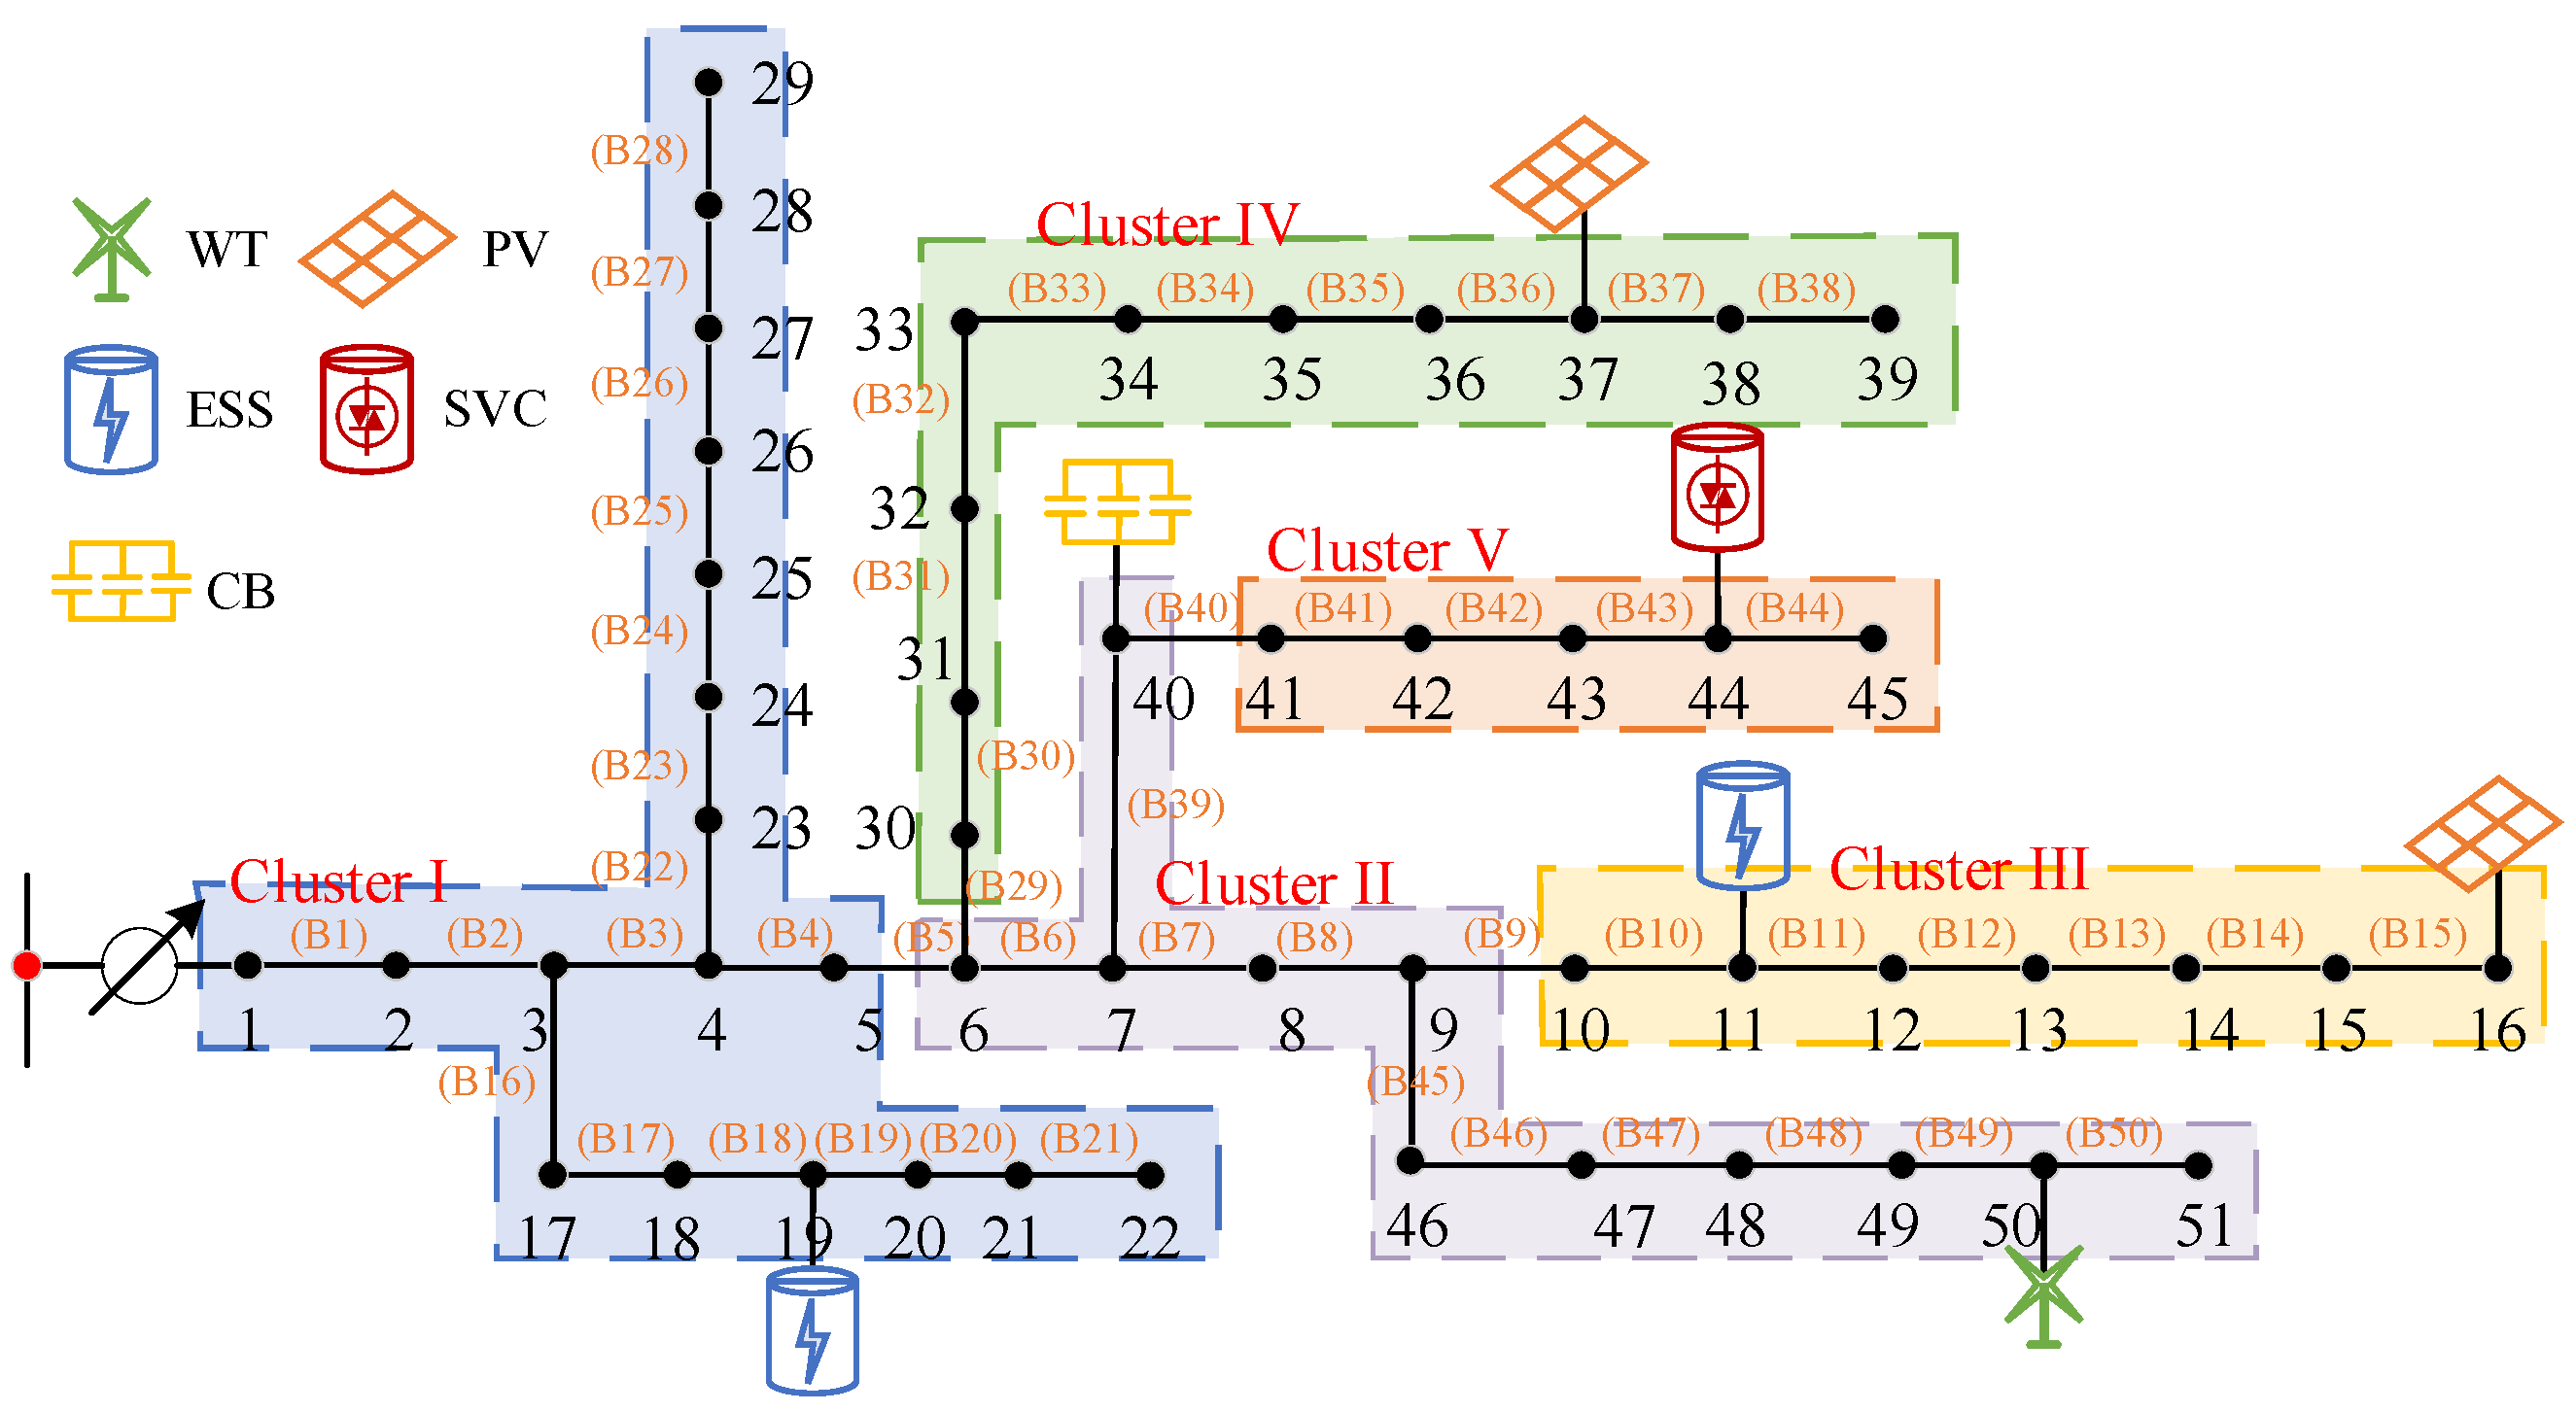
Figure 1. IEEE 51-bus topology and partitioning results.
Electronics 14 02639 g001
Figure 2. Iteration curves of objective function: (a) voltage deviation, (b) network losses, (c) power consumption cost.
Electronics 14 02639 g002
Figure 3. Pareto result at 100th iteration.
Electronics 14 02639 g003
Figure 4. Dynamic per-unit voltage profiles of the 51-bus system under multiple scenarios: (a) Scenario 1. (b) Scenario 2. (c) Scenario 3. (d) Scenario 4. (e) Scenario 5.
Electronics 14 02639 g004
Figure 5. Network losses and voltage deviations in different scenarios: (a) maximum voltage deviation of the 51-bus system, (b) 24 h losses of the distribution network.
Electronics 14 02639 g005
Table 1. Bus allocation and metric comparison in different methods.
Cluster IDBus NumbersReactive Power Margin/kvarActive Power Margin/kWReactive Power CoverageActive Power CoverageModularity MetricCommunication Distance Metric
Comprehensive evaluation method11–5, 17–29−539−6500.50520.38490.44640.2001
26–9, 40–51217−148
310–1645210
430–395723
541–45101−298
The literature [11]11–6, 17–30−287−9280.45130.34100.42940.1719
27–16, 40–51−20−100
331–39337263
441–45−149−98
Table 2. Comparison results from different optimization algorithms.
AlgorithmVoltage Deviation (p.u.)Network Losses (MW)Power Consumption Cost (×104 CNY)
MOPSO0.050.831016.101
MOEA/D0.030.816415.963
NSGA-II0.030.807715.708
Table 3. Power consumption cost in different scenarios.
Scenario 2Scenario 3Scenario 4Scenario 5
Power consumption cost (×104 CNY)15.82115.75315.72315.708
Operating cost (×104 CNY)1.8571.8261.8151.807
Table 4. Optimization results in different cases.
Network Losses (MWh) Average Voltage Deviation (p.u.)Power Consumption Cost (×104 CNY)
Case10.10350.02042.0227
Case20.08100.01671.8346
Disclaimer/Publisher’s Note: The statements, opinions and data contained in all publications are solely those of the individual author(s) and contributor(s) and not of MDPI and/or the editor(s). MDPI and/or the editor(s) disclaim responsibility for any injury to people or property resulting from any ideas, methods, instructions or products referred to in the content.