1. Introduction
The dynamic vision sensor (DVS), also known as event camera or neuromorphic camera, is a sensing device that draws inspiration from biological systems and operates asynchronously, much like the human eye, responding to changes in brightness rather than capturing entire frames at a fixed rate, like in traditional CMOS and CCD sensors. This paradigm shift makes it possible to overcome several limitations of classic computer vision hardware: conventional frame-based cameras suffer from motion blur, especially in the presence of high-speed moving objects, and exhibit high latency due to the global exposure time needed for sufficient light to reach the sensor and acquire each frame; in contrast, event cameras exhibit much higher temporal resolution and substantially reduced latencies. Furthermore, event cameras have an inherent high dynamic range, typically around 120 dB, double the capacity of conventional cameras [
1], which allows them to function effectively in a wide range of lighting conditions, providing accurate and timely detection of fast moving objects.
Because of their unique performance characteristics, event cameras have been proposed as a successful sensing solution in many application fields such as robotics, surveillance, agriculture, intelligent transportation systems, or medicine [
2], but, despite their success, they still require extensive research to fully exploit their potential and address existing limitations [
3]. In fact, the continuous nature of event data, as well as the noise and sensitivity of the sensor controlled by internal parameters—called
biases—can produce a large amount of information that requires efficient processing algorithms to effectively handle the data stream. Biases are adjustable settings in the sensor’s measurements that can accumulate over time and can significantly affect the quality and quantity of the recorded data; different camera biases can enhance/degrade performance or affect computer vision system robustness. In addition, the sparse output of event cameras can be challenging to integrate with existing computer vision systems, which are typically optimized to process dense image data.
Effective computer vision systems are highly dependent on the quality of available data sources. Low-quality data impair the algorithm’s capability to analyze and extract the desired output and/or generate accurate predictions. Moreover, computer vision datasets provide a standardized benchmark for researchers to evaluate and compare their models and/or algorithms, establishing consistent and repeatable results.
Event-based vision is not an exception. Providing solid benchmarks, event-based datasets are crucial for advancing event-based vision. In essence, the synergy of efficient algorithms, suitable hardware, and abundant data is poised to accelerate advancements in the event-based research community, enhancing its application in various domains [
4]. Typically, datasets are taken in real-world, unconstrained environments, where the sensor is used in a single configuration across multiple scenarios or optimized individually for each scene. Although such datasets are well-engineered for their specific target applications, the acquired scenes are usually only loosely controlled, which limits the researchers’ ability to systematically study how biases in event cameras affect data acquisition. Instead, repeatable scenes recorded while systematically changing controlled parameters can allow for a thorough evaluation of sensor performance under varying conditions, ensuring that the sensor’s behavior is well-understood and predictable. Moreover, while several studies propose a comparison between RGB and event cameras and experimental evaluations of single sensors have been conducted in controlled environments, these studies often do not provide access to the acquired data, thus preventing further studies and analyses. Furthermore, varying levels of scene noise and data degradation allow for the evaluation of robustness and reconstruction methods under realistic sensor failure conditions. Surprisingly, the state of the art shows an evident lack of studies with publicly released materials and data for the aforementioned scenario. Indeed, experimental evaluations of event cameras in controlled laboratory settings often limit their focus to a specific application [
5] or sensor [
6], or they exclude noise from the analysis [
7]. Furthermore, most of these datasets are not publicly released. Only a few studies combine performance analysis with publicly available data, such as investigations of radiation tolerance or dropout and bandwidth limitations [
8,
9]. They highlight the growing interest in controlled sensor evaluation but do not provide comprehensive and parametrically varied datasets to enable systematic assessment of sensor behavior under different conditions.
This work aims to fill this gap by answering the following research questions: Q1: How shall an experimental systematic campaign be designed to enable the evaluation of diverse event camera computer vision tasks in varying sensor configurations, scene dynamics, and illumination conditions? Q2: To what extent do environmental and configurational conditions affect the performance of event cameras in capturing visual information?
To address these aspects, this work introduces the JRC INVISIONS Neuromorphic Sensors Parametric Tests (JRC_INVISIONS_PARAMETRIC_2025) dataset (see
Figure 1), designed specifically to examine the impact of different sensor configurations in controlled scenarios and repeatable scene dynamics in terms of object shape, motion, and illumination conditions. In addition to providing ground truth for standard computer vision tasks with the goal of facilitating computer vision research in the area, we perform an experimental evaluation of sensors, analyzing event statistics, performance under varying speed and illumination, and acquisition artifacts such as event loss, transmission delays, and motion-induced distortions from line-based readout.
Three scenarios are considered: moving targets, mechanical vibrations, and rotations. Ground truth data related to each specific scenario are annotated. Therefore, the JRC_INVISIONS_PARAMETRIC_2025 dataset can be used to evaluate the resilience of several low- and middle-level computer vision tasks to loss of data and/or noise-induced data degradation. Furthermore, the presented dataset also enables the systematic evaluation of scene invariance under varying conditions, as identical scenes can be repeatedly captured with controlled modifications to experimental parameters and sensor settings, providing a comprehensive benchmark for assessing and optimizing solutions to challenging tasks, such as automated calibration and bias tuning. To the best of our knowledge, this is the first dataset of its kind in the literature.
The manuscript is organized as follows.
Section 2 summarizes the working principles of the event camera, while
Section 3 outlines the related work. The dataset is presented in
Section 4, while its structure and release details are reported in
Section 5.
Section 6 presents a quantitative and qualitative analysis of the performance of event cameras for the tasks under consideration, using the proposed dataset. The JRC_INVISIONS_PARAMETRIC_2025 dataset is extensive and unique in terms of recorded data, benchmark scenarios, and recording conditions; a discussion in
Section 7 sums up the contributions, expressing some consideration with respect to other datasets and synthetic data.
Section 8 has the conclusion. The dataset is made publicly available at [
10].
2. Event Camera Principles
The purpose of this section is to briefly introduce the fundamental concepts of event-based vision, event data representation, and the family of neuromorphic sensors used in this work. In addition, details on event generation and the influence of sensor biases on the number of events detected, which are a key aspect of this dataset, are reported. Refer to the surveys in [
3] for a complete overview and [
2] for a detailed reference to other state-of-the-art surveys.
Event cameras are image sensors that, like frame cameras, convert light into electric charge and process it into electronic signals, but, instead of capturing intensity, each pixel asynchronously captures intensity changes in the scene. Thus, instead of images, the camera outputs events, with the
i-th event
defined by
where
is the position with coordinates
where the event occurs,
is the timestamp, and
the polarity of the event, i.e., ON (positive)/OFF (negative), to represent an intensity change from darker to brighter or vice versa. The event is streamed if the brightness (
L) increment exceeds different thresholds for positive and negative events (
). Defining the increment as
the event will have polarity
, as
Theasynchronous nature of each pixel can produce timestamps with microsecond resolution.
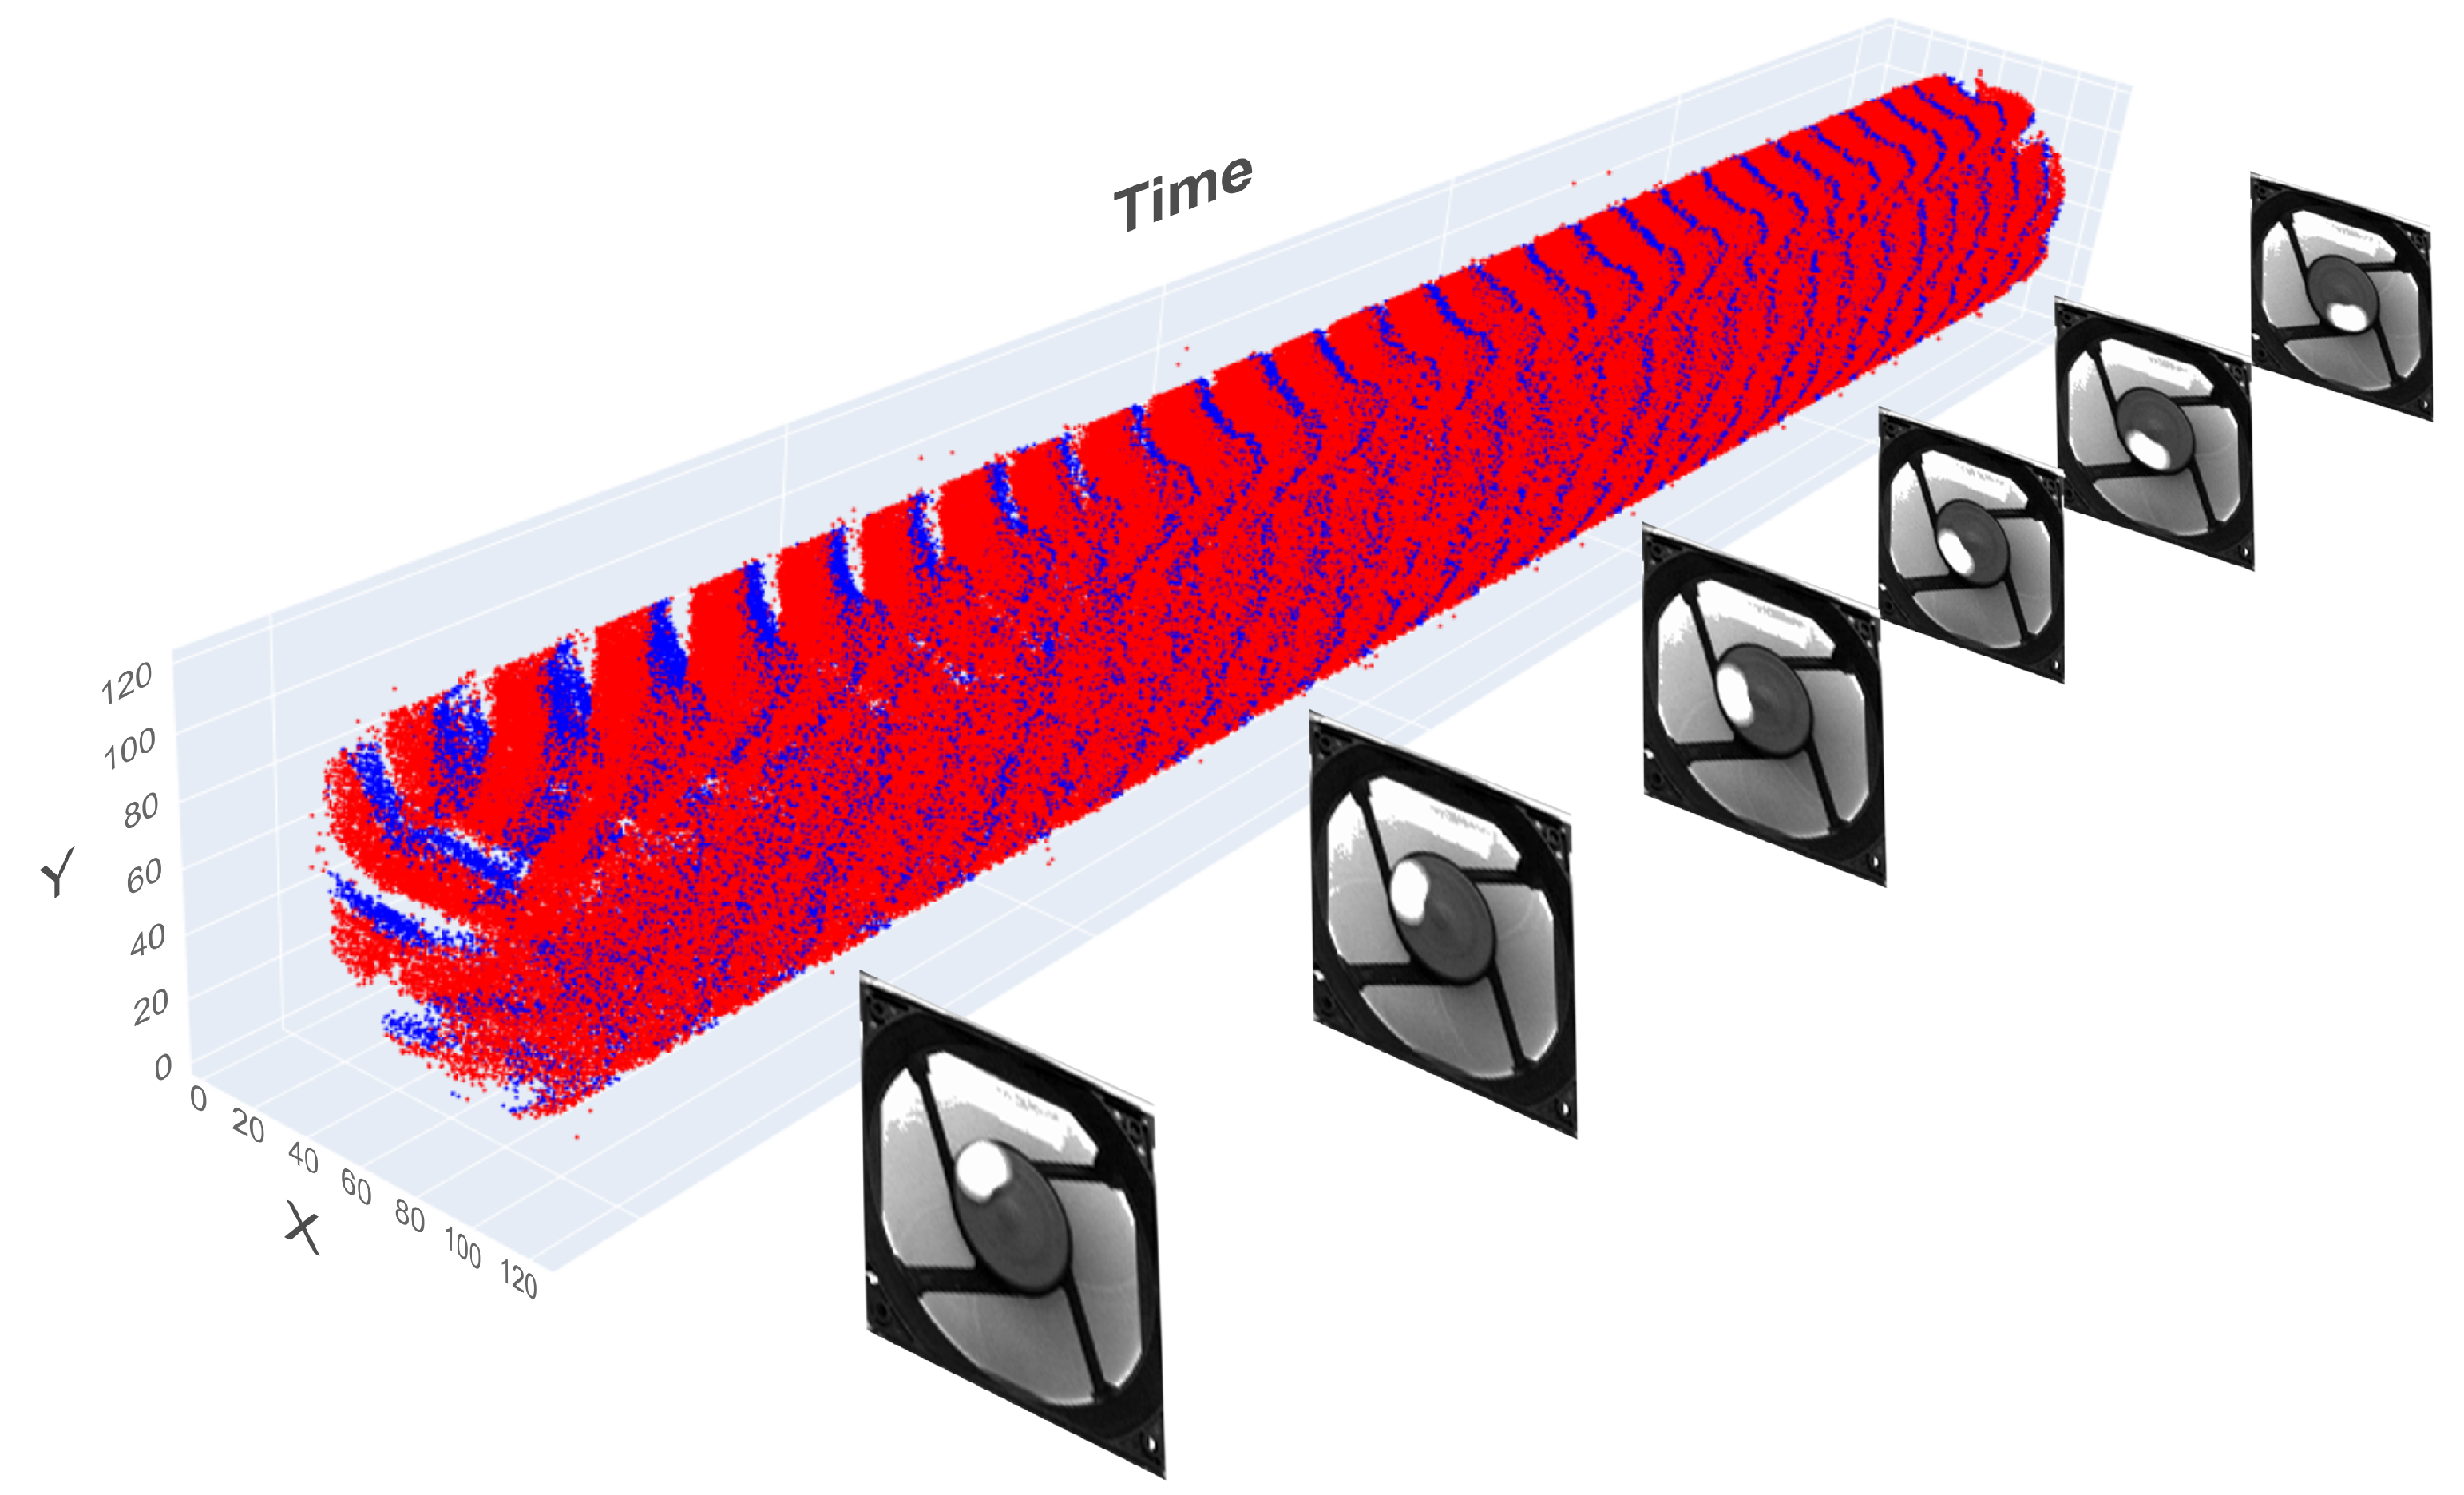
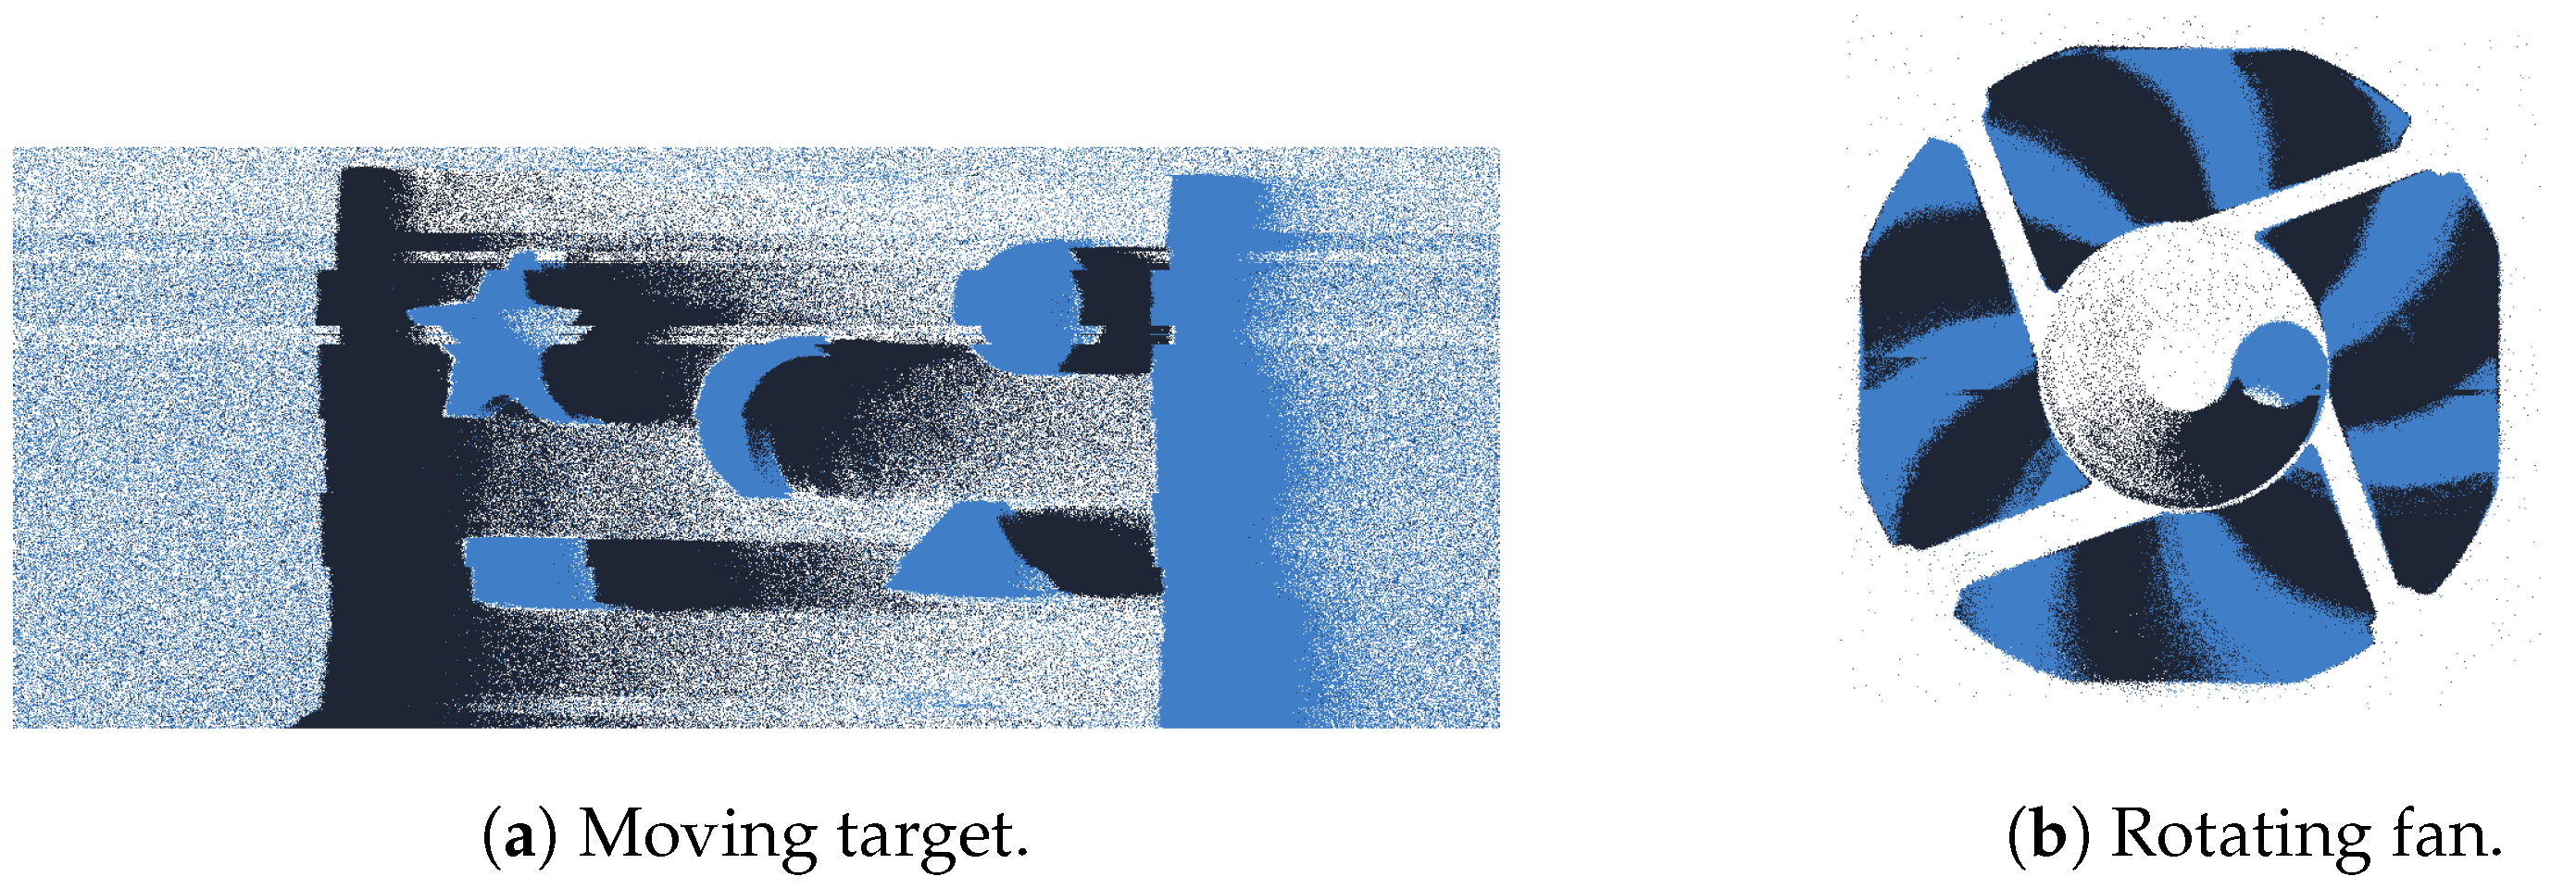
In
Figure 2, there is a comparison of the acquisition by a traditional frame camera and by an event camera in front of a rotating fan. The frame-based camera captures a frame at constant intervals independently of the scene dynamics. Instead, the event sensor asynchronously captures events if the brightness change (ON for light changing from darker to lighter, OFF from lighter to darker) for a given pixel is above a threshold. Therefore, in the case of a still scene, the event camera will not produce any output. By accumulating events over a temporal window, it is possible to obtain a 2D representation of the events. The process involves grouping all the events that occur in each pixel within the selected time interval. This results in an image where each pixel intensity represents the aggregated event activity during the accumulation period. This can be observed in
Figure 3.
At this stage, we only described the working principles of the DVS, i.e., the nature of events and how they are generated. For this work (see
Section 4), it is important to introduce the
dynamic and active-pixel vision sensor (DAVIS) [
11], which combines both event- and frame-based sensing capabilities into a single device. The DVS component of DAVIS will capture asynchronous events, responding to changes in the scene with high temporal precision, while the Active-Pixel Sensor (APS) component provides complementary information, giving conventional image frames at fixed intervals. In DAVIS technology, each pixel is equipped with both event- and frame-based circuitry, sharing photodiodes. This hybrid design allows DAVIS to address the limitations of both modalities, enabling high-speed, low-latency vision in dynamic environments. However, the spatial resolution is lower compared to DVS because of the increased complexity of the single-pixel circuitry, reducing the maximum achievable resolution on a given chip size area. Moreover, the associated higher power consumption to manage both streams favors designs with lower spatial resolution. Finally, the Asynchronous Time-based Image Sensor (ATIS) [
12] has pixels that independently and asynchronously detect brightness changes like for the case of DVS, but it also includes an exposure measurement circuit that can measure absolute illumination changes. Unlike DAVIS, the ATIS does not produce conventional frames but can generate absolute brightness information.
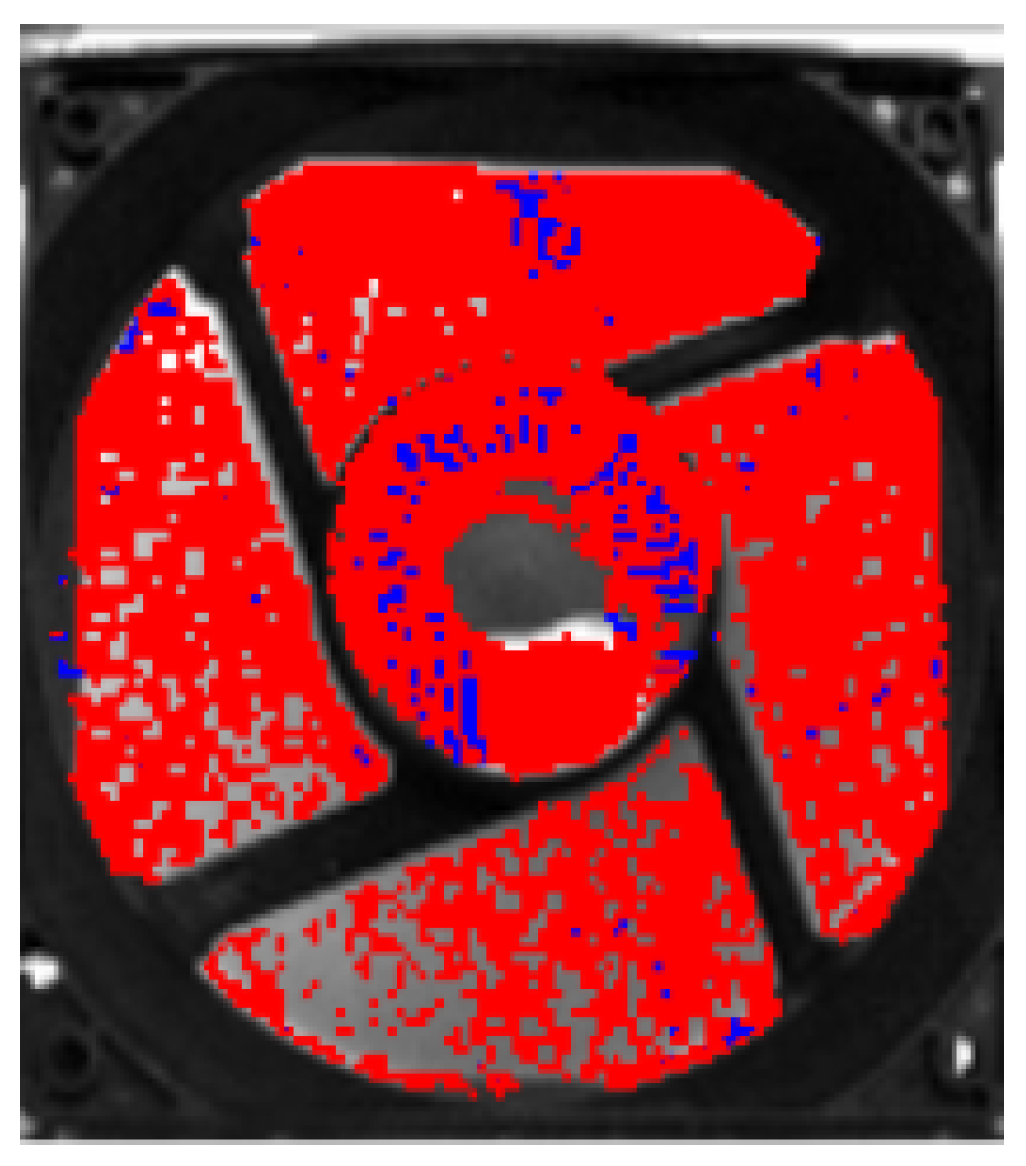
Concerning event representation, similar considerations apply; however, events that occurred during the acquisition of a frame can be placed on top of the classic image, as shown in
Figure 4. Refer to [
13,
14] for more information on hardware aspects and the various families of neuromorphic sensors, including emerging technologies.
To conclude this section, a more in-depth analysis of biases is crucial. Biases are sensor settings that encompass various configurations, ranging from regulating the number of events the camera generates to adjusting its sensitivity to positive or negative light changes in the environment. Different bias settings affect the operational speed and responsiveness of the sensor. Although each event camera manufacturer defines and tunes its own set of biases, these parameters generally serve to control key aspects of sensor behavior, such as event triggering thresholds and the temporal response of pixels after an event. In this work, the parametric campaign is led by changes in the following biases:
Threshold for ON and OFF events: This adjusts the contrast sensitivity for ON and OFF events. For ON events, it will determine the level by which the pixel must be brighter before an ON event occurs; vice versa, for the OFF threshold, the pixel level must be darker to generate an OFF event.
Refractory period: It defines the time period during which the pixel will be blind before it can again start to detect changes in the light-related signal coming from the first stage.
It emerges how, in general, the optimization of sensor settings is subject to two primary trade-offs: one between sensor speed and the level of output noise and another between noise mitigation and the range of detectable signals, highlighting the need for a balanced approach to achieve optimal performance.
3. Related Work
Numerous datasets acquired with event cameras, often used in combination with other perception sensors, have been introduced as benchmarks for training and evaluating various computer vision tasks. Such datasets can be generally categorized based on the specific task, such as regression and classification, or by the presence of other sensors like frame-based cameras, LiDAR, inertial measurement units (IMUs), etc. However, such datasets either lack focus on laboratory-controlled environments or fail to capture repetitive tasks under systematically varied camera parameters, instead relying on ideal configurations for event cameras. Data acquisition typically occurs with no or minimal control over the environment, leading to variability in factors such as the presence of moving objects and/or lighting conditions.
With respect to datasets acquired in laboratory settings, several authors deal with the experimental evaluation of event cameras but usually focus on a very specific task such as image reconstruction [
15], object detection latency [
16], or very precise operational contexts, such as a flapping-wing robot [
5]. Other works focus on a comparison with other sensors, as in the work in [
17] that introduces the concept of
power–performance curves, a theoretical approach to decide between different sensors for a given task; this approach mainly considers the trade-off between the performance obtained with respect to the power consumption. Other works deal with comparison with specialized sensors, such as high-speed cameras [
6], or limit the evaluation to ideal conditions, e.g., without considering noise [
7], pixel latency, and exposure time [
17].
Very few studies provide performance analysis and release data at the same time. The work in [
8] performs optical testing in terms of radiation tolerance and event camera characterization, focusing on hardware and circuital aspects. In the work of Holešovskỳ et al. [
9], a test bed is proposed to perform an experimental comparison of event and frame cameras and to analyze some limitations in terms of dropout and bandwidth.
4. The JRC INVISIONS Neuromorphic Sensors Parametric Tests
The JRC_INVISIONS_PARAMETRIC_2025 dataset is composed of sequences captured by different event cameras and eventually integrated with a frame-based camera in three scenarios reproduced on an optical table, which provides a controlled environment for precise image acquisition and manipulation. Three cases have been designed, i.e.,
Moving targets;
Mechanical vibrations;
Rotating fan.
Each case presents its characteristics and challenges, which will be discussed in detail in the following sections. We first introduce the materials and methods in terms of hardware, sensors, and common technical considerations that are shared among the three use cases.
4.1. Materials and Methods
The JRC_INVISIONS_PARAMETRIC_2025 dataset is composed of a total of 2156 sequences recorded with two different event cameras and 3226 images obtained with a frame camera.
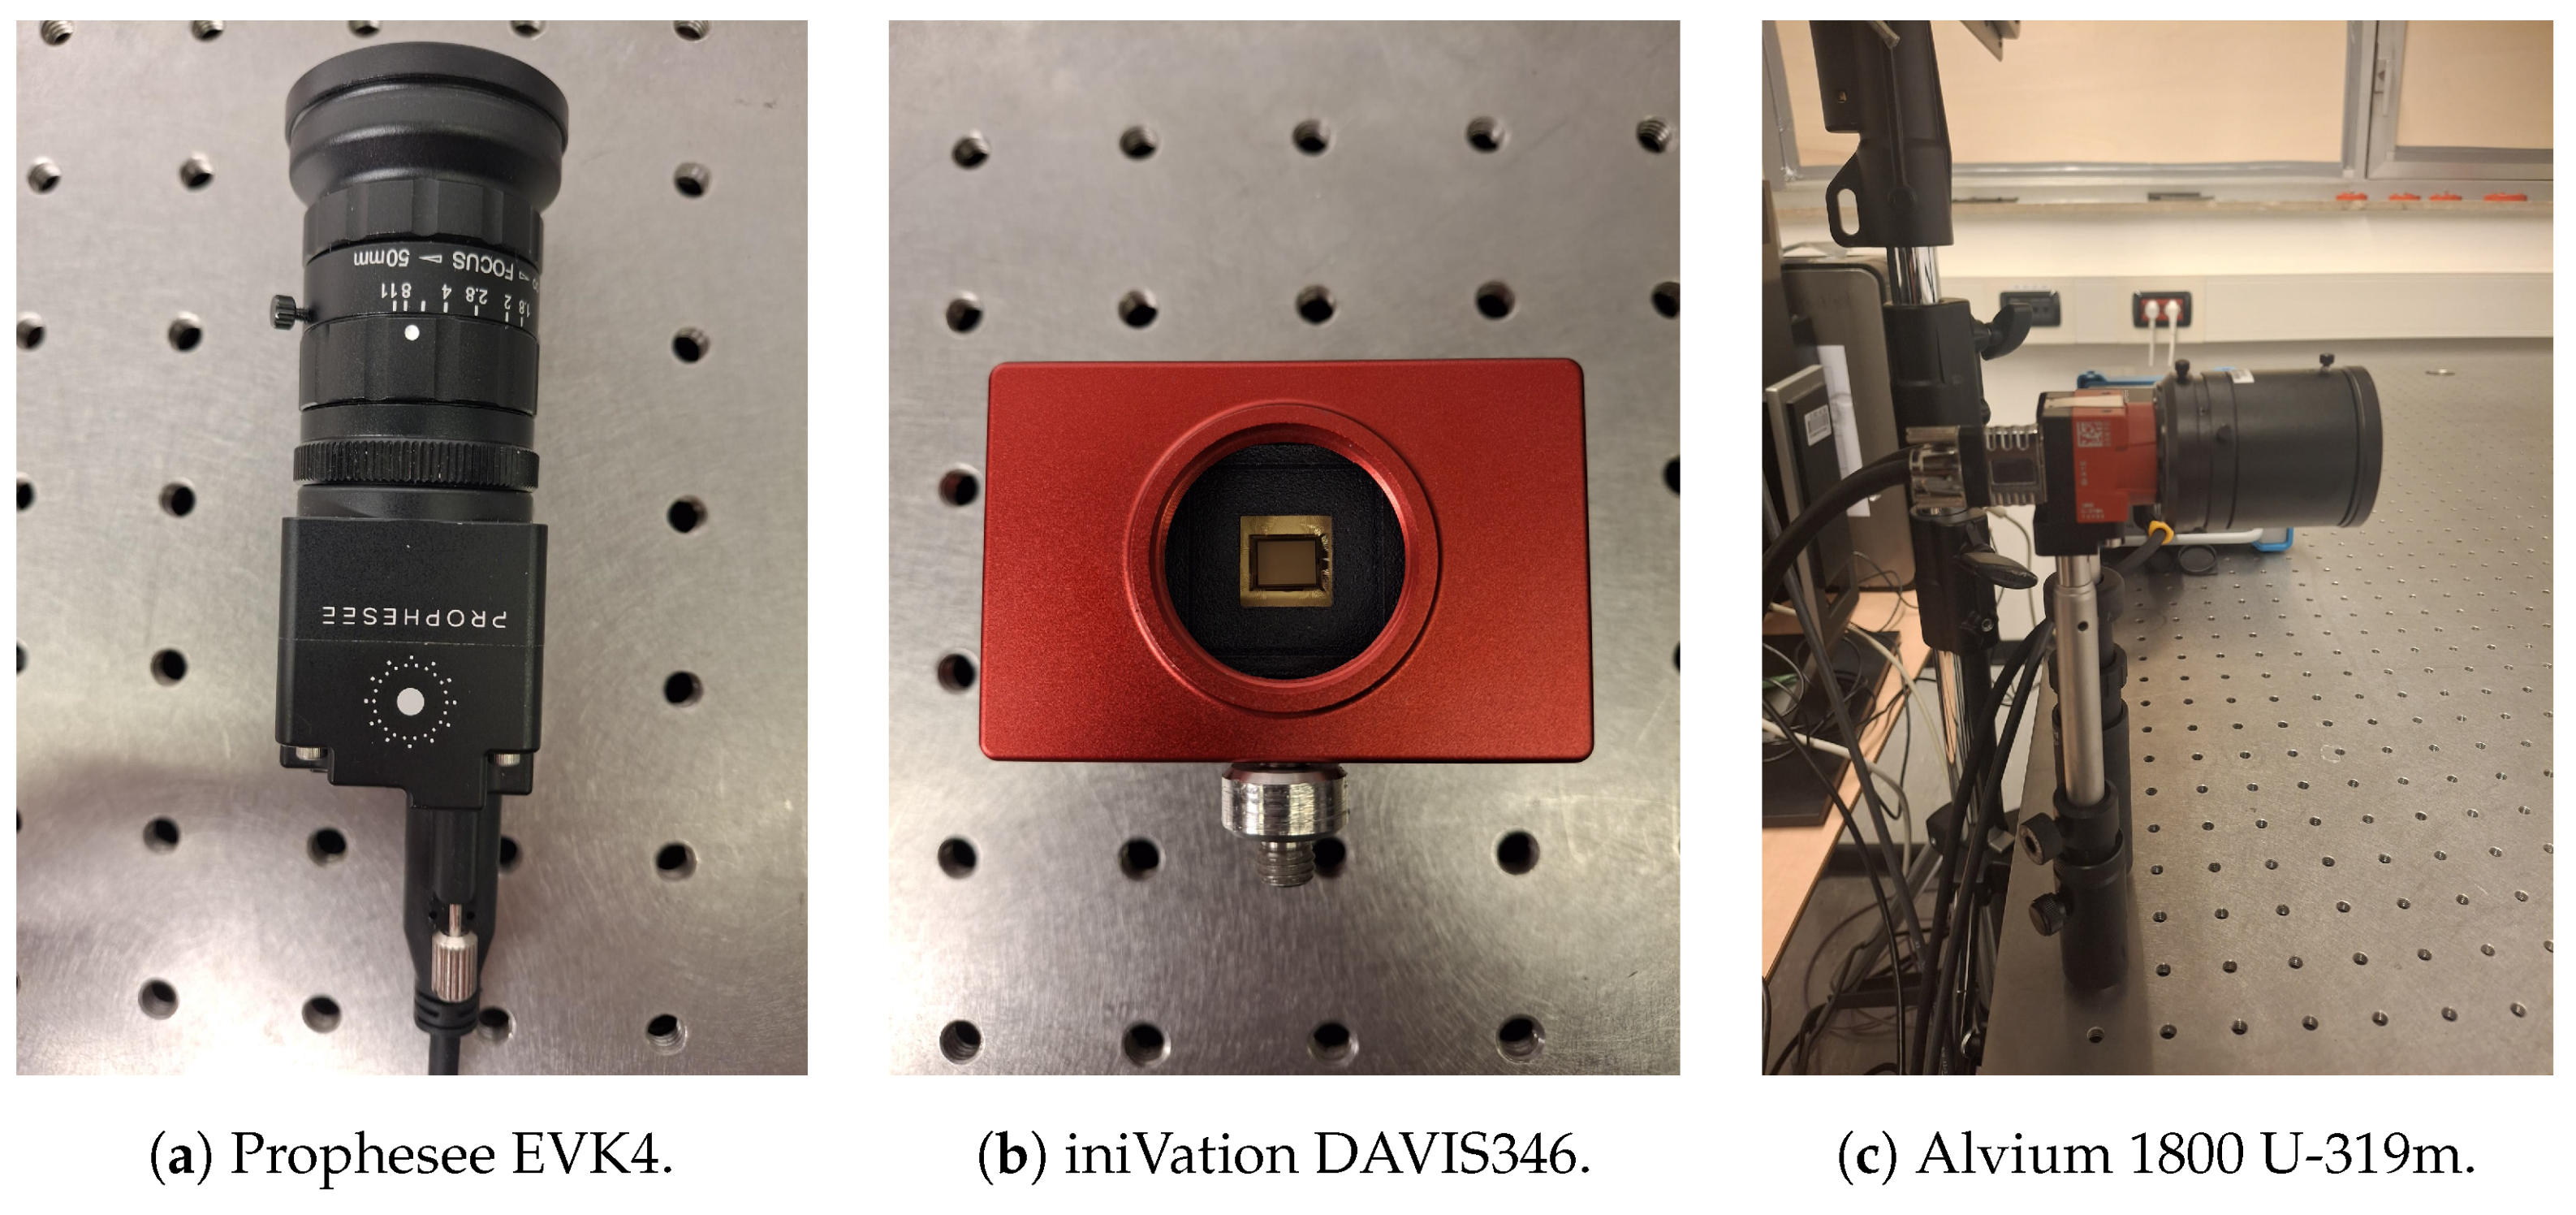
The event cameras used in this dataset are the Prophesee Evaluation Kit 4 HD (EVK4) [
18] and the iniVation DAVIS346 [
19]. The EVK4 integrates the SONY IMX636 (HD) stacked event-based vision sensor, released by Sony Semiconductor Solutions. It has a sensor size of
and provides events with a resolution of
pixels. The DAVIS346 provides both event and frame streams, both with a resolution of
pixels, and guarantees a bandwidth of 12 MEvents/second. A frame camera, namely the Allied Vision Alvium 1800 U-319m with a resolution of 3.2 MP and working at 53 fps, is integrated with the EVK4’s event stream for the case of moving targets (see
Section 4.2) to provide grayscale information.
Figure 5 shows the three sensors used in the acquisition campaign.
For the first two scenarios, the movements are produced by the Aerotech ACT165DL-1200 Direct-Drive Linear Actuator (Aerotech, Pittsburgh, PA, USA), specifically designed for precision and motion control applications with active feedback; it guarantees bidirectional repeatability with 1
m error and precision of 5
m. The linear drive is piloted with Aerotech’s Soloist
© linear series single-axis servo controllers software Soloist Motion Composer v4.04.002. Two views of the linear drive used during the acquisition of the dataset are reported in
Figure 6.
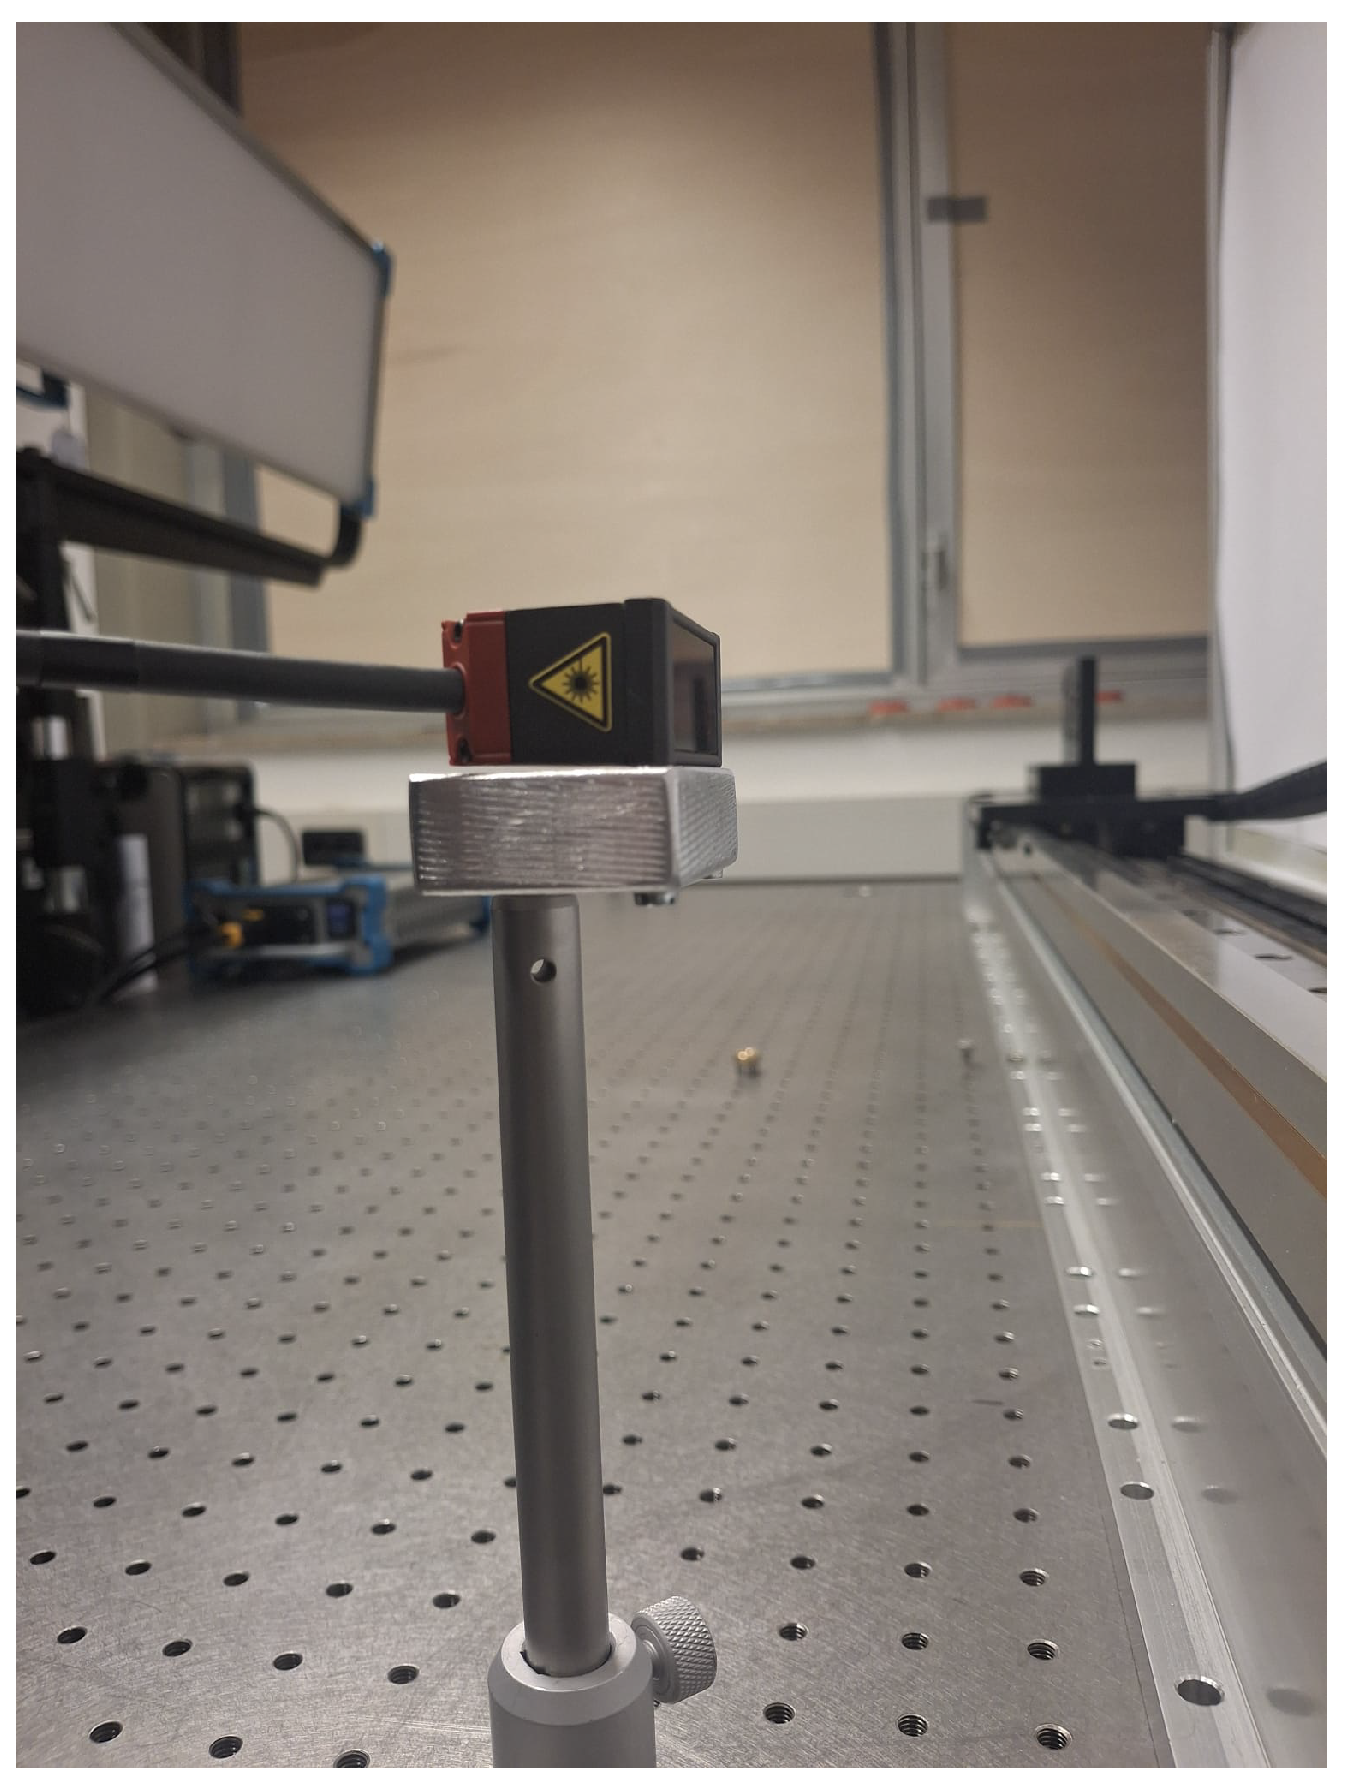
Furthermore, a Micro-Epsilon optoNCDT ILD1420-100 positional laser (see
Figure 7) is used in each of the three cases, which serves both to synchronize the capture from the different streams (events and video) and to acquire the ground truth data related to mechanical vibrations and the rotating object. It has a working range of 50
–100
, with a repeatability of 2
, and a sampling rate of 4
. The only illumination source in the dark laboratory is the ARRI SkyPanel S120-C (see
Figure 8), providing light from 2800 K to 10,000 K continuous variable-correlated color temperature and with adjustable intensity range with smooth, flicker-free dimming control, allowing for precise modulation of illumination levels for experimental consistency.
About the software implementation, for the frame camera and the Prophesee EVK4, we use the Python v3.9.19 programming language to manipulate and process the data. In particular, the OpenCV library is used for image manipulation tasks, to calibrate the frame camera, to compute the homography with the DVS, and to generate the printable markers. The Prophesee Metavision SDK [
20] v5.0.0 camera calibration module is customized using the C++ programming language to calibrate the EVK4. For DAVIS346, the DV software v1.6.2 platform [
21] is used to acquire and process data.
To conclude this section, it is important to highlight that, for the event cameras, the limited computational capacity and hardware camera design restrict the total amount of data throughput that can be transmitted with the consequence of many dropped events at very high event rates. Therefore, in real scenarios, it is important to limit the generated event rate, and this can be achieved by acting at two levels:
Scene level: if the application requirements allow, one can act in terms of camera distance, focus, illumination, etc.
Sensor level: biases have the most direct impact on the number of generated events; moreover, event camera producers implement mechanisms, like the region of interest (ROI), to limit the active pixel area and the event rate controller (ERC) [
22] to maintain the event rate below a certain threshold.
Details on how this is managed are reported case by case in the following subsections.
4.2. Moving Targets
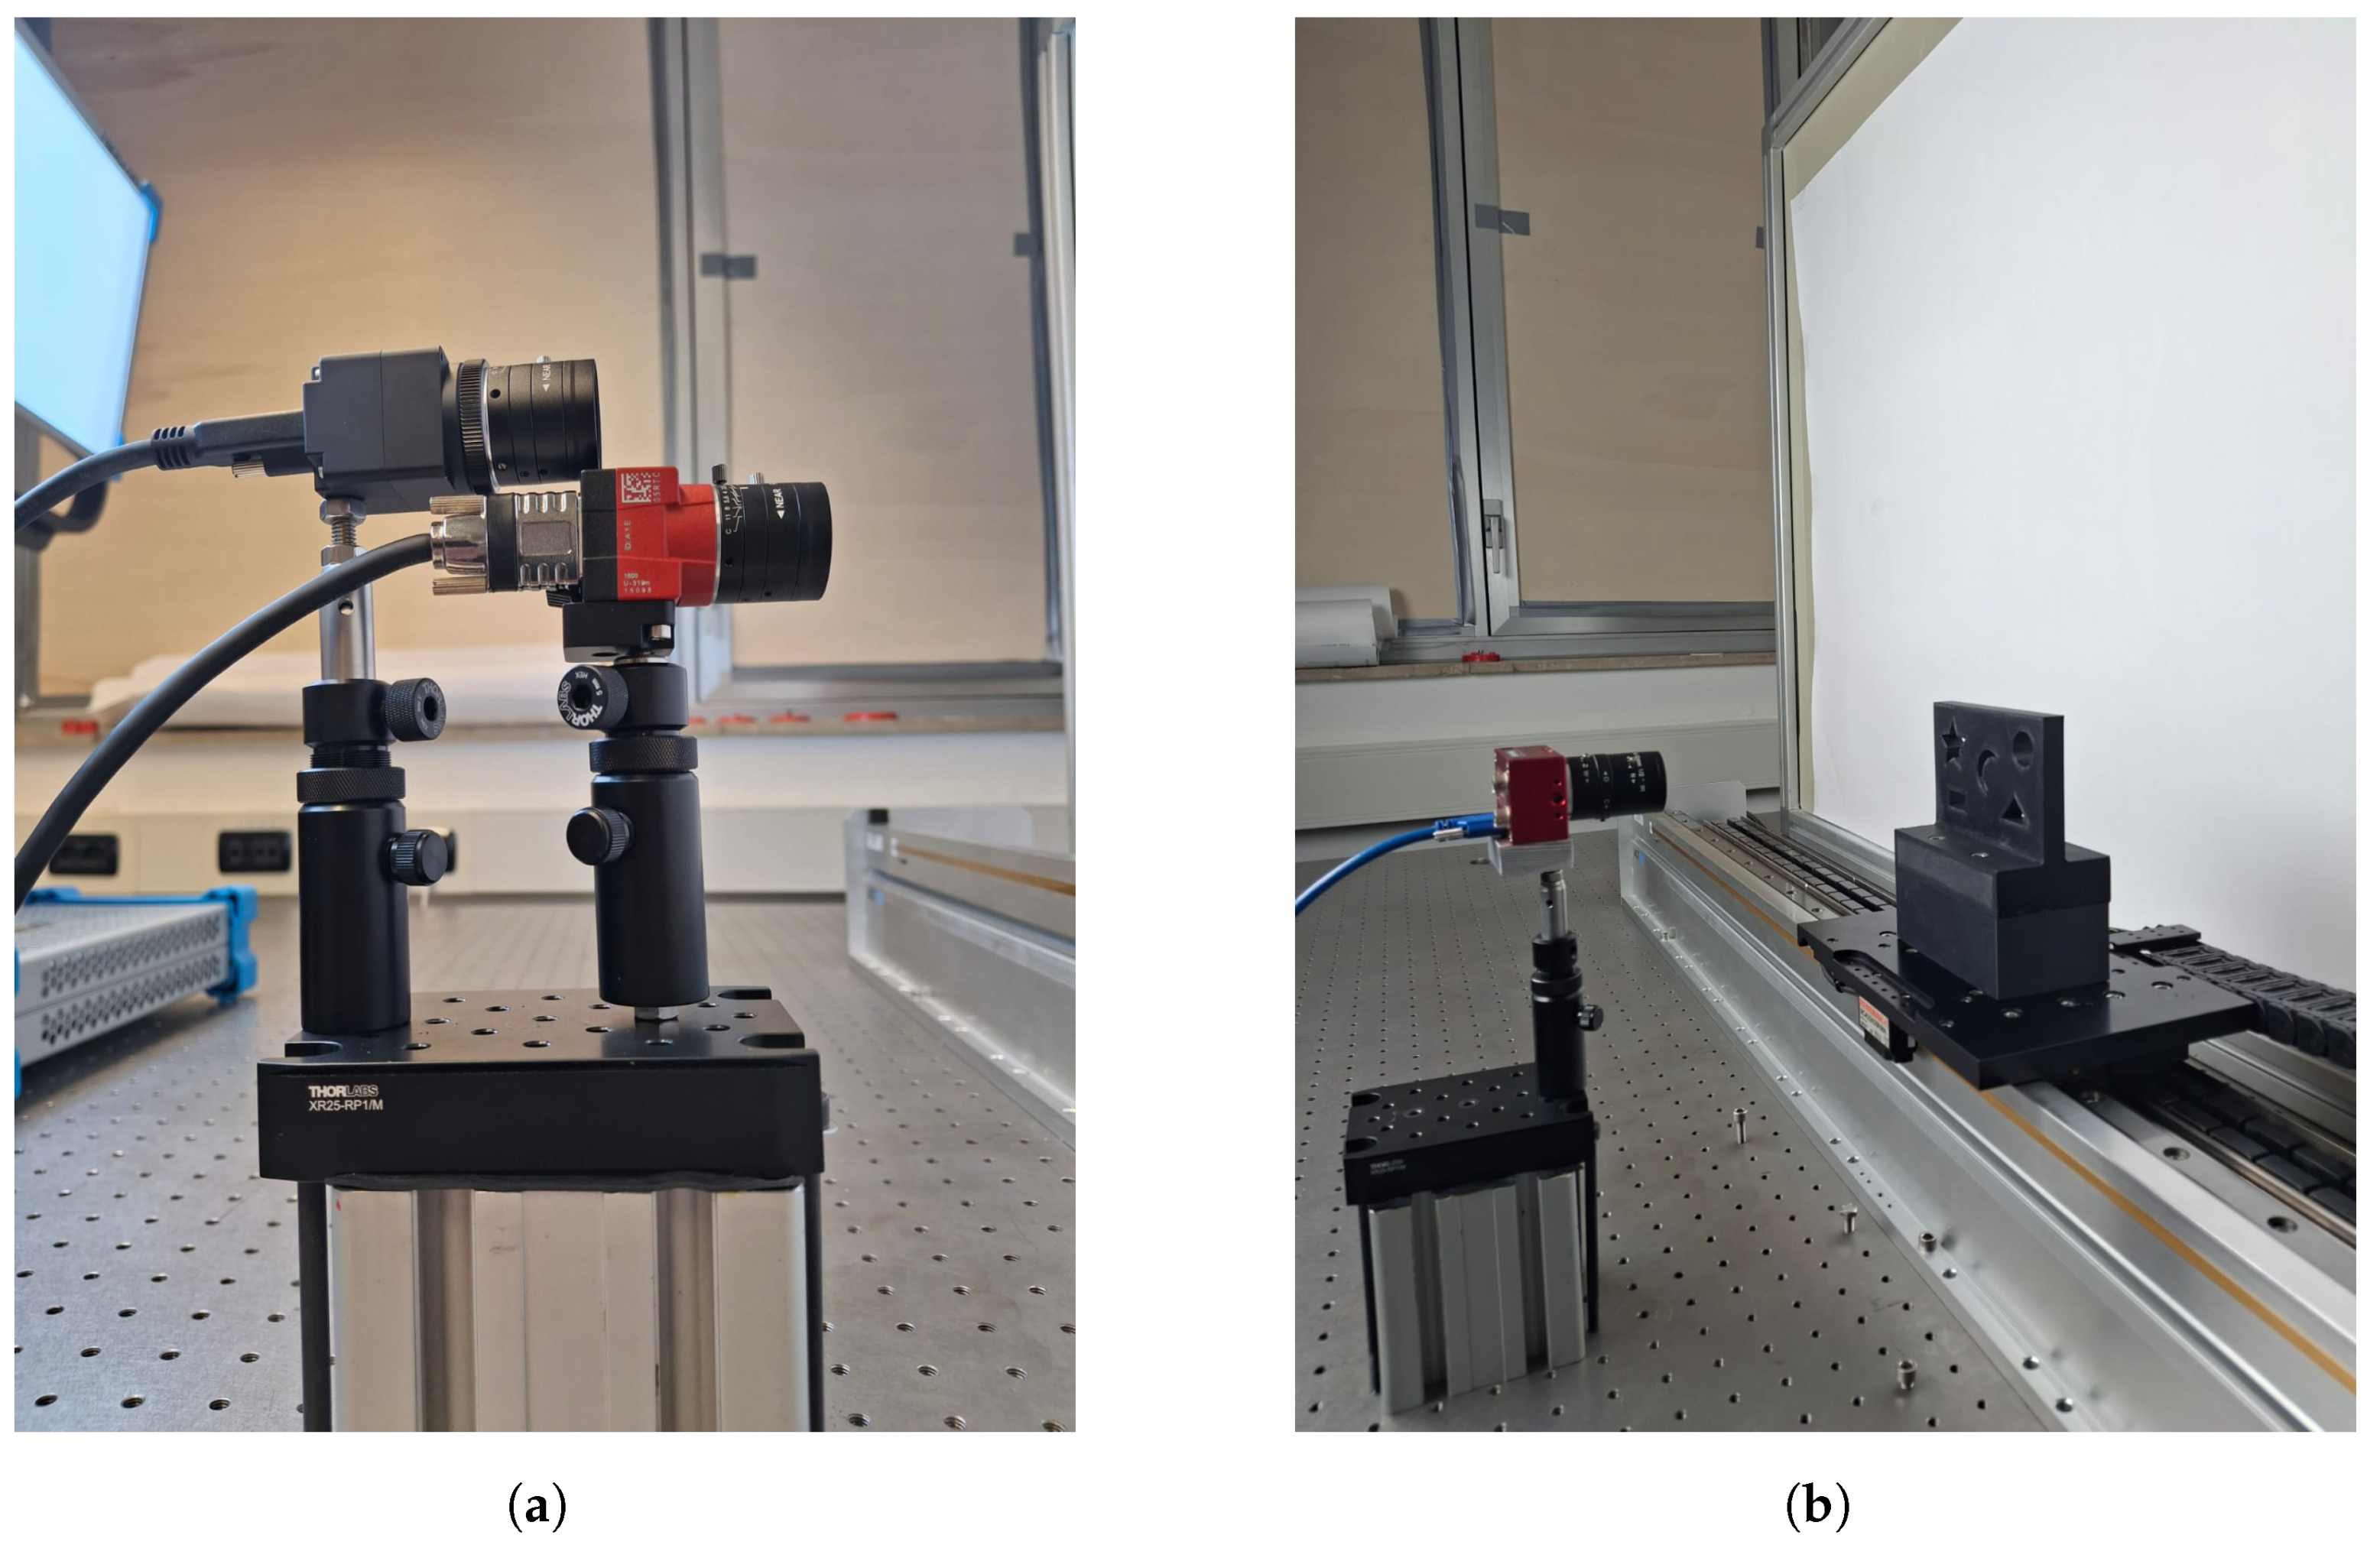
This part of the dataset consists of both event- and frame-based camera data, recording different targets placed on the top of the linear servo motor while moving at different speeds on a single axis. The event camera is placed with the field of view parallel to the direction of movement. The acquisition for this scenario is performed twice, once for each event camera. When using EVK4, a frame camera is placed near the event camera as shown in
Figure 9a; with this setup, the event and frame streams are acquired in parallel. The setup for the case of the DAVIS346 is shown instead in
Figure 9b.
To avoid obtaining blurred frame images already at the initial incremental speeds, the exposure time is set (for both the frame camera and the DAVIS346 frame data) to 5 for each image. The same scene is captured with different thresholds and camera-configurable bias values selected in a grid search strategy, while the tabletop carriage moves back and forth (based on the numerical input provided) along the axis for 100 in each direction at increasing speeds from to with incremental steps of .
Each scene is acquired with three illuminance intensities, setting the light temperature at 6000
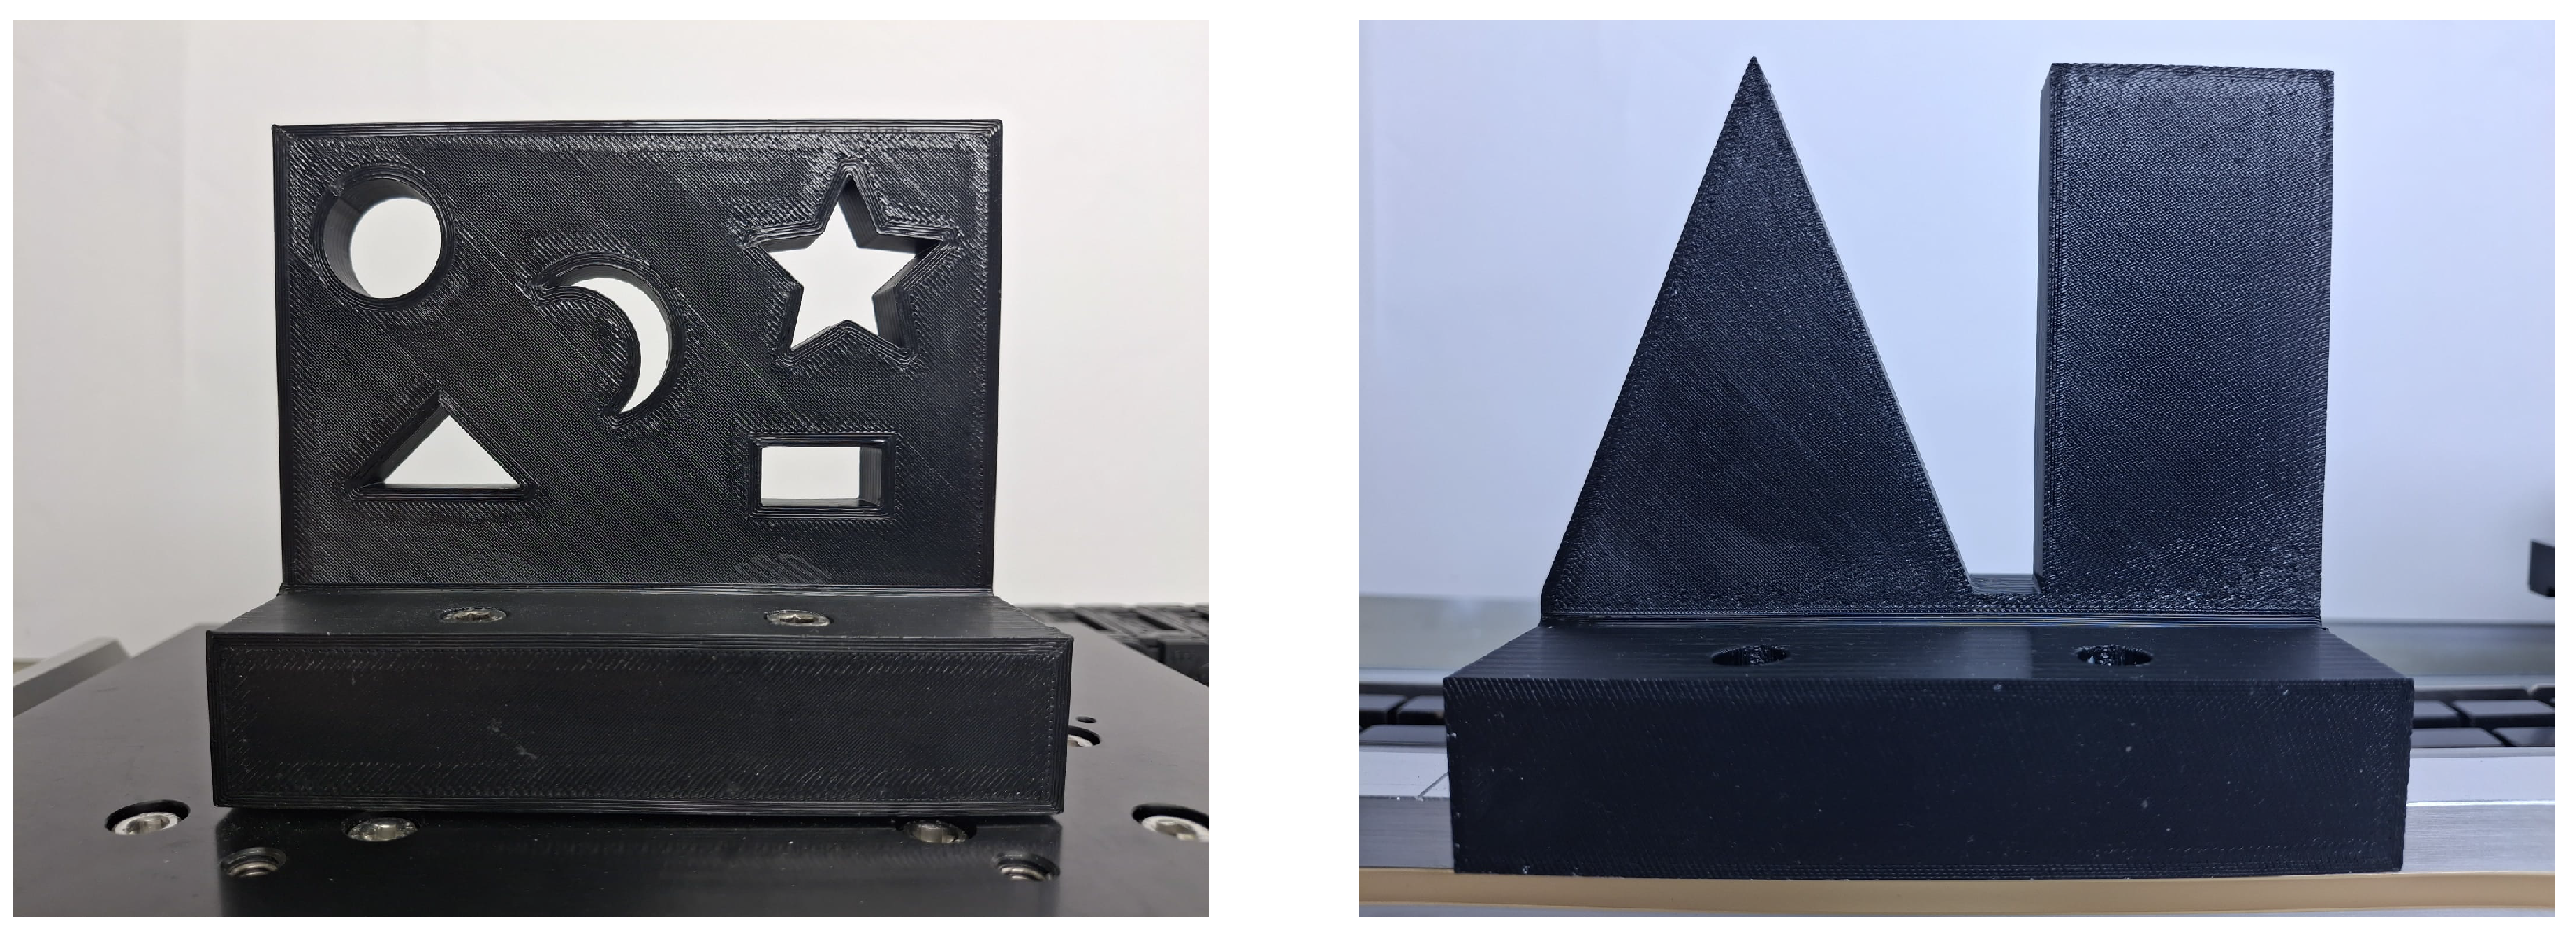
. The three illuminance levels received by an illuminometer placed in correspondence with the event cameras, oriented coherently with the sensors’ line of sight, are stored. CAD-designed targets are reported in
Figure 10. Textured targets have been included to enhance the realism of the acquired data: in real-world scenarios, event cameras naturally generate events along textured surfaces due to local intensity changes; using a plain background would result in an unrealistically low event density. Also, the intrinsics of the frame and event cameras are calculated. During the acquisitions with the EVK4, the Micro-Epsilon optoNCDT ILD1420-100 laser is used as a switch to start and stop the recording of the scene, which consists of a target passing from the right to the left across the camera’s field of view. For the paired frame camera, the same acquisition is performed for each illumination level and for each target speed. In the case of the event camera, the same scene acquisition is also repeated for each bias configuration. Recording for both cameras starts when the target leaves the laser’s detection range and ends when the target distance from the laser re-enters the laser measurement range.
We observed that the configured testing system inherently introduces a variable latency, induced by the mismatch between the microsecond-resolution timestamps and the millisecond-scale latency of the serial port. In detail, the laser sensor output is read through a serial connection at 112,000 baud. This setup introduces a maximum latency of 0.25 ms (due to the laser’s sampling rate at 4 KHz), plus the communication delay through the serial interface, resulting in millisecond synchronization accuracy between the two camera streams. This latency is more observable at higher linear drive speeds. Lastly, camera artifacts (see
Section 6) can be introduced depending on the bias configuration (related to the expected number of events per acquisition slot). However, each scene can be easily adjusted at the user’s convenience by shifting the timestamp index of the first event to be monitored at the desired point. Instead, for acquisition with the DAVIS346, the synchronization between frame and event data is given at the sensor level, thus overcoming the latency challenges of the previous configuration. In this way, a longer video can be recorded for each bias combination, with increasing target speeds and capturing both movement directions. This explains the difference in the total number of sequences reported in
Table 1.
Intrinsic camera calibration matrices are computed for each sensor. In the case of the event camera paired with the frame camera, since the target is parallel to both views, the homography matrix between the EVK4 and the frame camera is computed by manually selecting four planar points from the target while varying the illumination to have corners visible in both fields of view.
Finally, images from all frame-based data (from both Alvium 1800 U-319m and iniVation DAVIS346) are processed with different corner (Harris [
23] and Shi-Tomasi [
24]) and keypoint detection algorithms (ORB [
25]); results are stored and provided with the dataset. Having the frame images and the DAVIS346 frame sequences, the user can test other corner and/or keypoint detectors or perform other low- middle-level computer vision tasks on the data.
An example of six frames from the frame camera during acquisition is shown in
Figure 11. To conclude this part, note that a test of the vibrations on the optical table induced by the fast linear drive movements was conducted. Two MicroStrain © wireless three-axis accelerometers were placed on the top of the camera mounting plates and on the optical table. Given the negligible difference in vibrations measured between the sensor and the table, we can reasonably treat the sensor and table as a rigid body system, where the vibrations of the table can be considered negligible with respect to the sensor’s measurements.
4.3. Mechanical Vibrations
This case is implemented considering the academic interest of event camera applications in two different scenarios, namely the analysis of mechanical vibrations [
26,
27,
28] and the detection of fiducial markers [
29,
30]. Despite the importance of these two application areas, to our knowledge, there are no publicly available data to create a common and shared evaluation framework for these tasks.
An image of the reproduced scenario is shown in
Figure 12. A metallic bar (THOR Labs 150
long metric TR-Series post) is placed on the tabletop of the linear drive while performing very short movements (5
) at about 8
and 14
. For this scenario, only the event camera data is recorded: quick vibrations would give low-quality frame data. Therefore, the vibration is recorded with the EVK4 since it has higher spatial resolution than the DAVIS346. Data are recorded varying two different bias configurations: the first configuration represents the camera’s default bias settings, while the second is optimized to reduce external noise while keeping sharp edges to favor detection. The ground truth information is estimated by placing the positional laser pointing to the metal bar, and the frequency can be computed from the period of each vibration.
A test of the vibrations of the optical table was conducted as for the case of moving targets. Results have shown that, for this case, the camera and optical table movements are non-coherent, generating a different coordinate system. Thus, the camera is mounted on a tripod and placed outside the optical table, with a target distance of 100 . The intrinsic calibration matrix of the event camera is computed and released.
We use the same setup to record data for ArUCO marker detection [
31], with markers attached to the bar surface in two configurations, namely horizontal and diagonal with respect to the camera field of view. These two directions are selected considering the different appearances of the inner binary identification units of the markers in terms of edges. Vertical detection can be inferred by simply swapping
coordinates. As in the previous case, only the EVK4 data is recorded. Ground truth information, including marker IDs and their corresponding sizes, is provided with the dataset. Six different markers are used, two for each side length of 20
, 40
, and 60
(see
Figure 13). In this way, for the aforementioned scenario, a total of 26 sequences have been generated. Some examples of the accumulation image for the aforementioned case are shown in
Figure 14.
4.4. Rotation Estimation
This scenario is taken into account due to the growing number of academic works that employ event cameras as a non-invasive system to estimate the rotational speed or the frequency of rotating objects [
32,
33,
34]. For this task, there are often missing publicly available data.
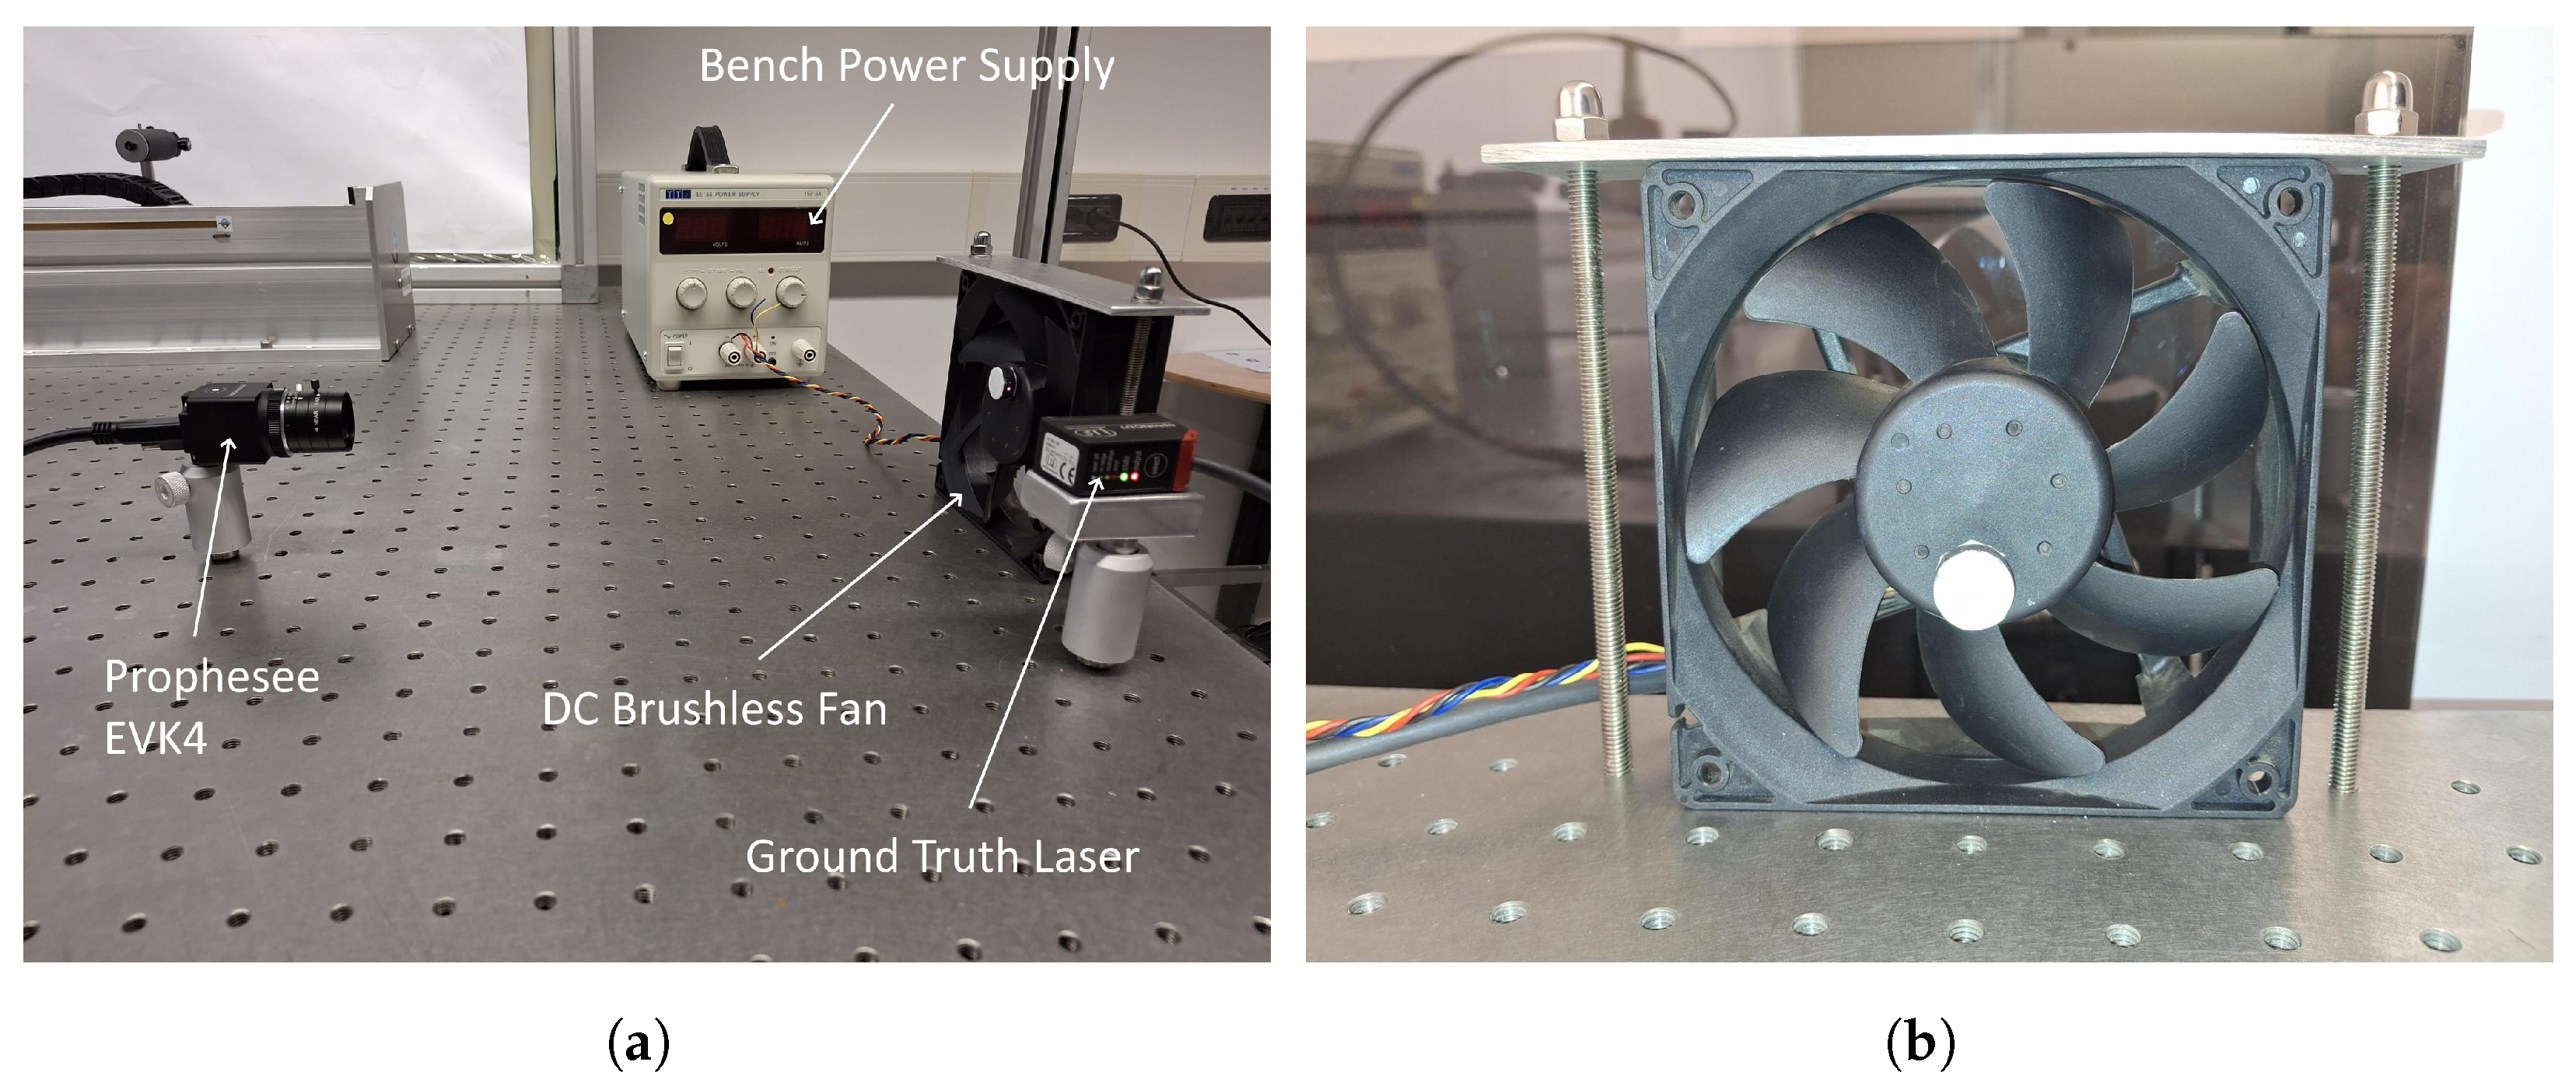
For this scenario, a consumer laptop fan (the Foxconn DC brushless fan PV123812DSPF 01), with dimensions of
, is rigidly fixed on the surface of the optical table. A variable voltage supply is used to drive the fan, allowing continuous control over the motor’s rotational speed and enabling the achievement of a range of velocities through adjustments to the input voltage. An image of the setup is shown in
Figure 15a. Since this solution does not provide feedback on the effective rotation speed, an eccentric cylinder was attached to the central axle of the fan, and the laser is placed as shown in
Figure 15b, allowing for the ground truth measurement of the periodicity of the signal with the technique described in the previous section.
As for the other two use cases of the dataset, different bias configurations are set for each rotational speed, varying the ON and OFF thresholds. The first acquisition is carried out using the EVK4 with five different bias settings. It is worth noting that a noticeable event drop rate is observed with all of the proposed configurations. For this reason, a second acquisition is performed with reduced camera focus and setting an ROI, additionally selecting biases with higher threshold values to mitigate the drop rate. Finally, a third acquisition is performed using the DAVIS346, recording data with nine different ON/OFF thresholds. Summing up, a recording is generated for each bias configuration and for each rotational speed.
Given the high-speed nature of this scenario, where the frame sensor cannot capture the high dynamics of the rotation, for this case we use the EVK4 alone without the coupled frame camera. In contrast, for the DAVIS346, frame data are included as they are readily available from the sensor. In this case, the exposure time is set to 3 , capturing the scene at 25 fps (frame interval of 40 ).
The illumination is kept fixed during the sequence acquisition, and the illuminance value is included in the dataset. The intrinsic calibration matrix of the sensors employed is computed and released for both event cameras. An example of the data obtained with the DAVIS346 is reported in
Figure 4.
5. Dataset Structure and Release Details
The dataset is released in the Joint Research Centre Data Catalogue [
35] in accordance with the JRC Data Policy [
36] and is made available at [
10]. The complete copyright, documentation, and usage guidelines are provided in the data folders. The dataset is organized into three main folders, corresponding to the use cases previously described.
For moving targets, each subfolder corresponds to one of the two sensors used. Within each, data are further grouped by the target and then by the speed plus the illuminance level. The subfolders are self-documented and include a 3D CAD model of the target, ROI/calibration data, frames, corners, and keypoints extracted on each frame, raw sensor data (proprietary binary Metavision raw for EVK4 and AEDAT4 [
37] files for the DAVIS346 data), exported event stream in open format (HDF5 for the EVK4 and CSV for the DAVIS346), and example accumulation images.
For mechanical vibrations, a separate folder is created for each sequence. Folder names reflect the object type, i.e., bar or ArUCO, the specific bias configuration, and, for the makers, the ID and sizes. As in the previous case, both the raw file and the HDF5 version are present. Since the linear drive can have tiny changes in the total execution time when performing vibrations, we stored the min, max, mean, and median values of the computed ground truth frequency. However, note that only decimal values change. Moreover, two videos are generated from accumulation images to facilitate the benchmarking of state-of-the-art detections without having to process large files; the first is a video at 30 fps and an accumulation time of ; the second is a video at 500 fps and an accumulation time of 2 . Note that, having the full list of events, one can easily generate videos at different frame rates and/or deal with custom accumulation strategies. Printable PDFs of the ArUCO markers in real sizes and a CAD of the metallic bar are included, as well as an intrinsic camera calibration matrix and additional metadata (object distance, illuminance, etc.).
For the rotating fan, data are grouped into three subfolders. In total, there are nine bias configurations and 54 acquisitions with the DAVIS346. For the EVK4, an acquisition is performed using the full available resolution and another one after having defined the ROI. In both cases, five different bias configurations are defined, for a total of 60 sequences.
In
Table 1, the structure of the folders composing the dataset, data on bias configurations and number of sequences, and benchmark computer vision scenarios are summarized.
Moving Target Data Structure
As multiple variables can assume various values in this scenario and all possible combinations have been considered, we provide a detailed breakdown of each variable as defined in its reference API, along with the specific values used in our analysis. For each of the two targets, we have the following:
For the Prophesee EVK4, the following are true:
- –
Bias positive threshold,
bias_diff_off:
- –
Bias negative threshold,
bias_diff_off:
- –
Dead time bias (refractory time),
bias_refr:
- –
- –
For the iniVation DAVIS346, the following are true:
- –
Bias positive threshold,
diffOn:
- –
Bias negative threshold,
diffOff:
- –
Dead time bias (refractory time),
refr:
- –
Inhibitory refractory filter (inverse refractory)
ifrefr:
- –
Velocity
v as in Equation (
7):
- –
Illuminance
i as in Equation (
8):
Each experimental run corresponds to a unique combination of these parameters, forming a point in this five-dimensional space (six for DAVIS346).
6. Experimental Evaluation of Event Cameras
In this section, we analyze sequences from the proposed dataset to evaluate the suitability of event cameras for tasks and boundary conditions, such as object tracking and motion detection, that the experimental campaign is representative of under various boundary conditions. The goal is to identify potential limitations and provide practical insights into the suitability of event cameras for deployment in unconstrained, real-world environments, where lighting conditions are variable and event rates are unpredictable.
By analyzing the event count across multiple bias settings and target speed variations, it is possible to quantitatively understand the sensitivity of the sensor to changes in environmental dynamics, particularly in scenarios involving low illumination or increasingly faster dynamics. The following plots visualize the distribution of events for the moving target scenario with three different bias configurations, for all velocities and illuminations considered in the JRC_INVISIONS_PARAMETRIC_2025 dataset (see
Section 4.2), revealing clear trends and deviations that emerge under different conditions.
In
Figure 16 and
Figure 17, the cumulative number of events is shown for the sequences recorded in the moving target scenario. Three bias configurations are compared: The first uses lower threshold values, which result in a significantly higher number of events. However, a substantial portion of these events are likely due to sensor noise. This explains the much higher number of captured events for the first acquisitions, in particular at the lowest target speed, considering that the total sequence length is higher and the bias configuration contributes to the elevated event counts. In contrast, the second and third configurations adopt progressively higher thresholds, which reduce the number of outlier events while preserving the sensor’s responsiveness to meaningful changes. With the exception of the slow-motion case with low threshold values, the number of inlier events generated by the sensor remains relatively consistent across the different target speeds, showing the ability of the sensor to capture fast dynamics without a significant loss.
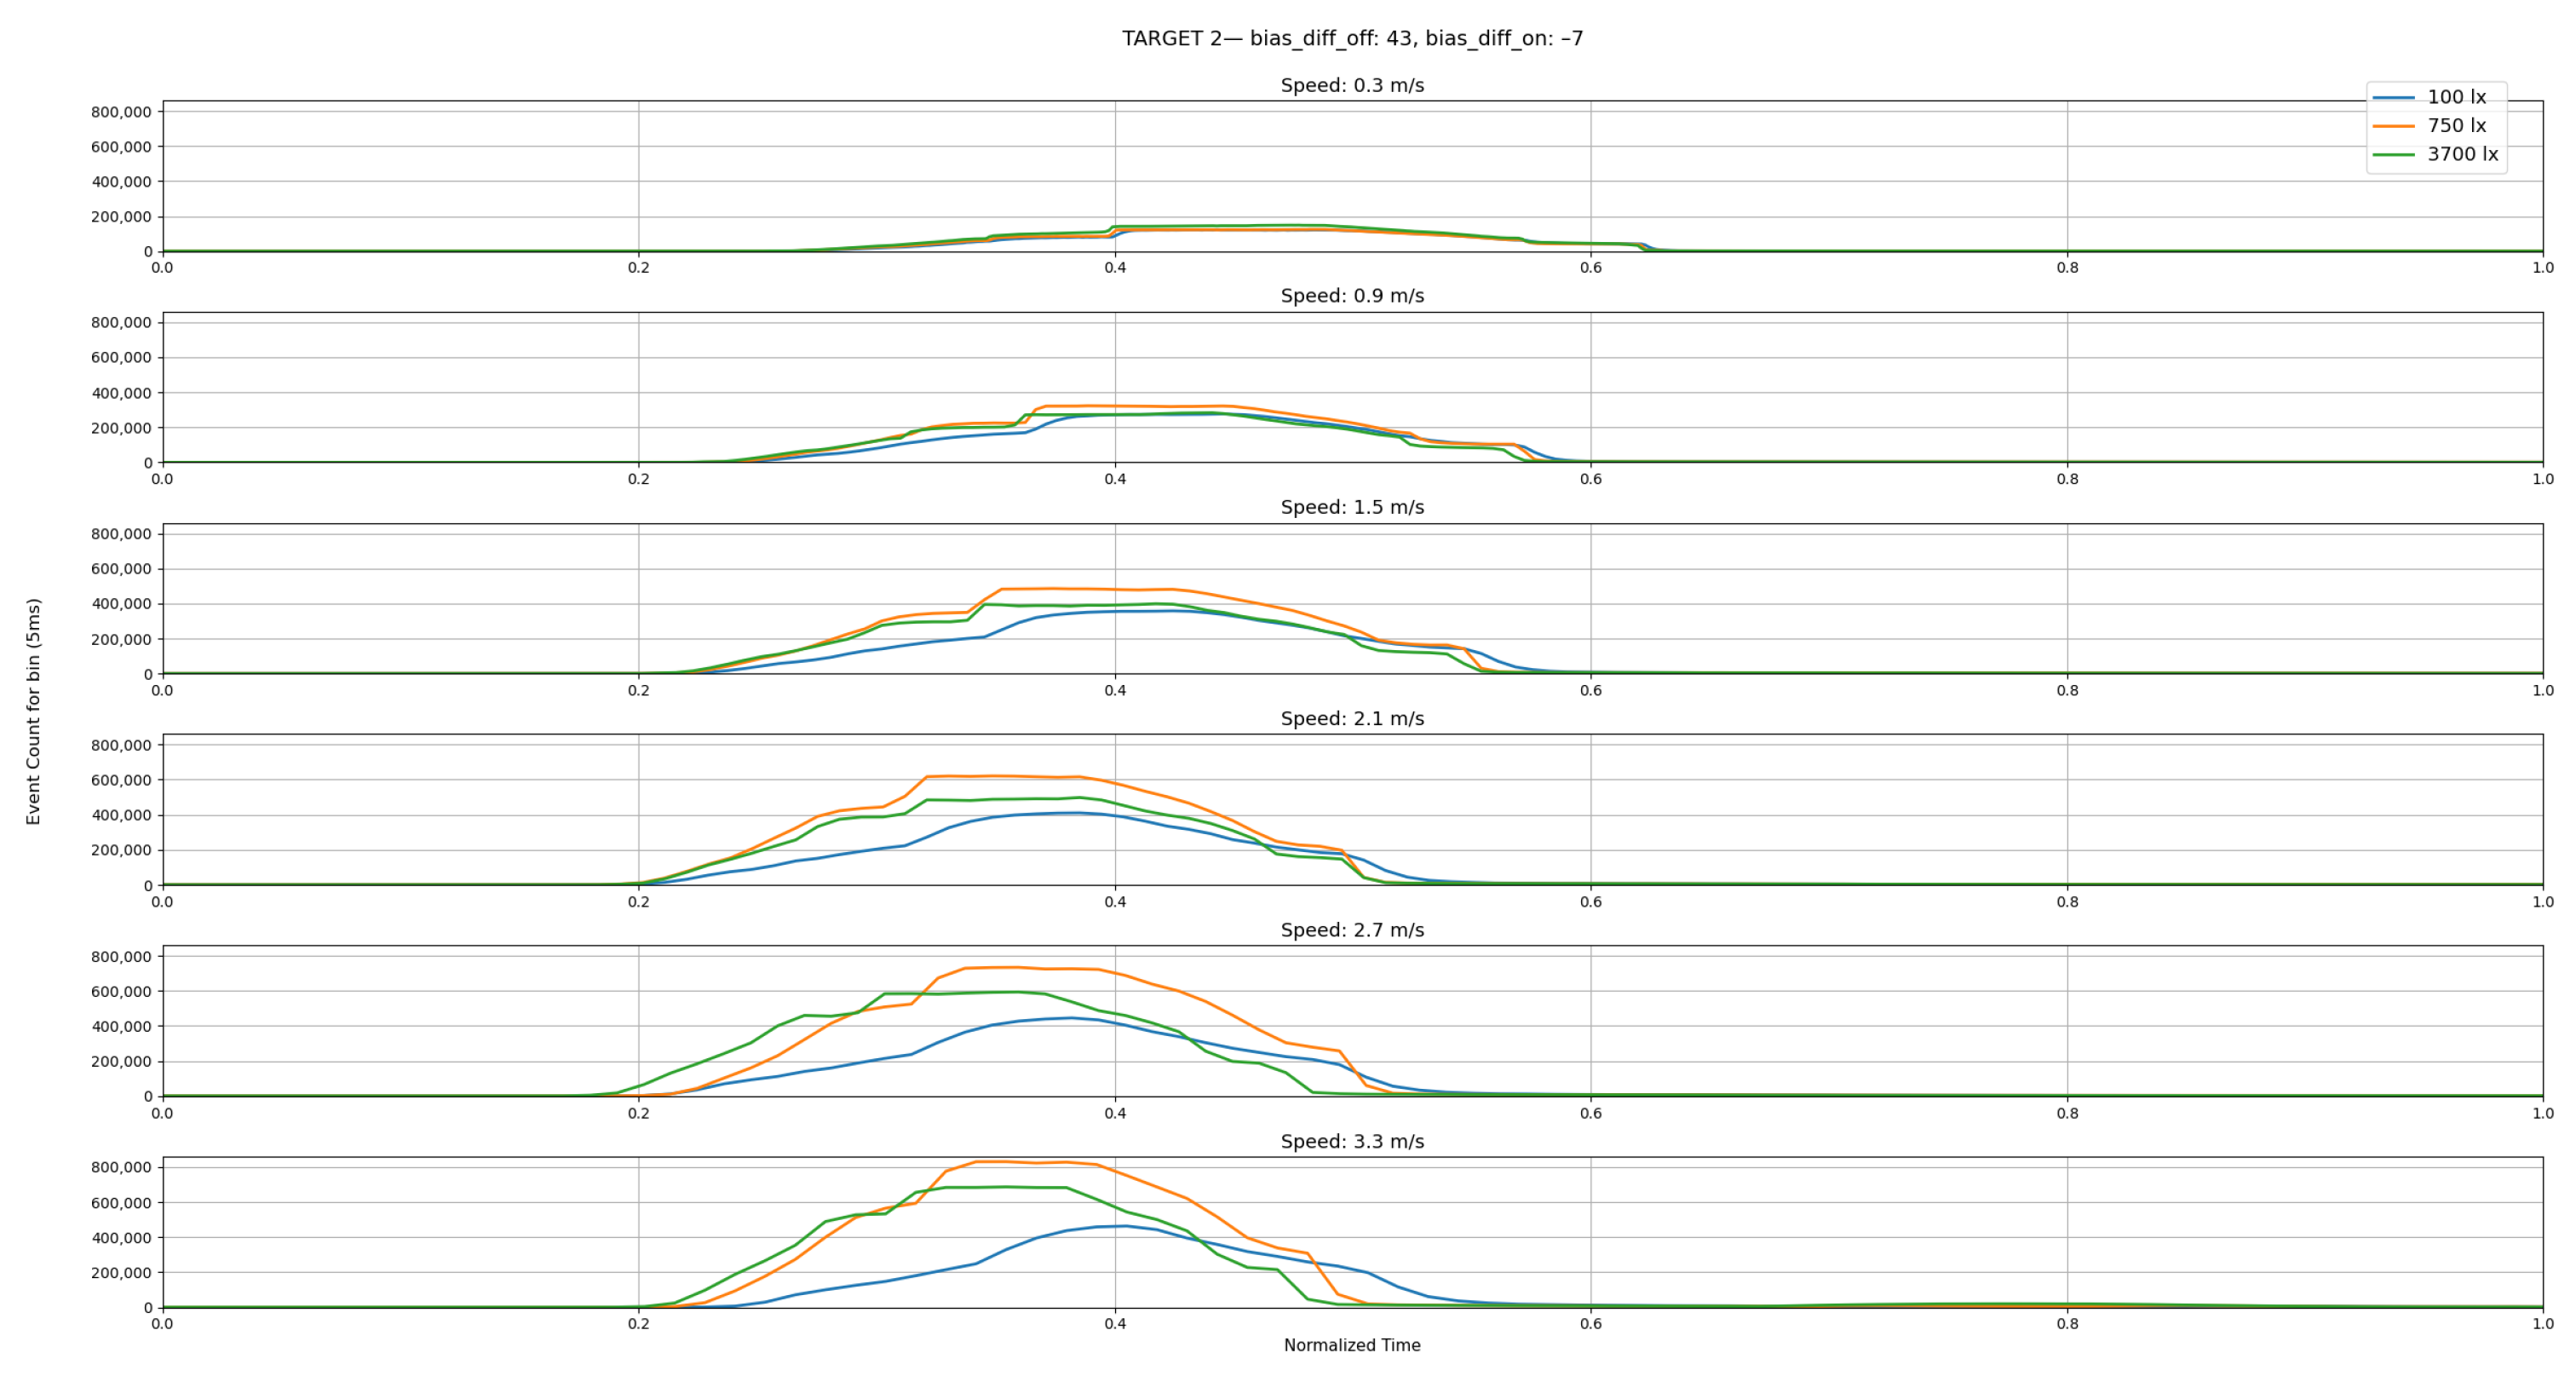
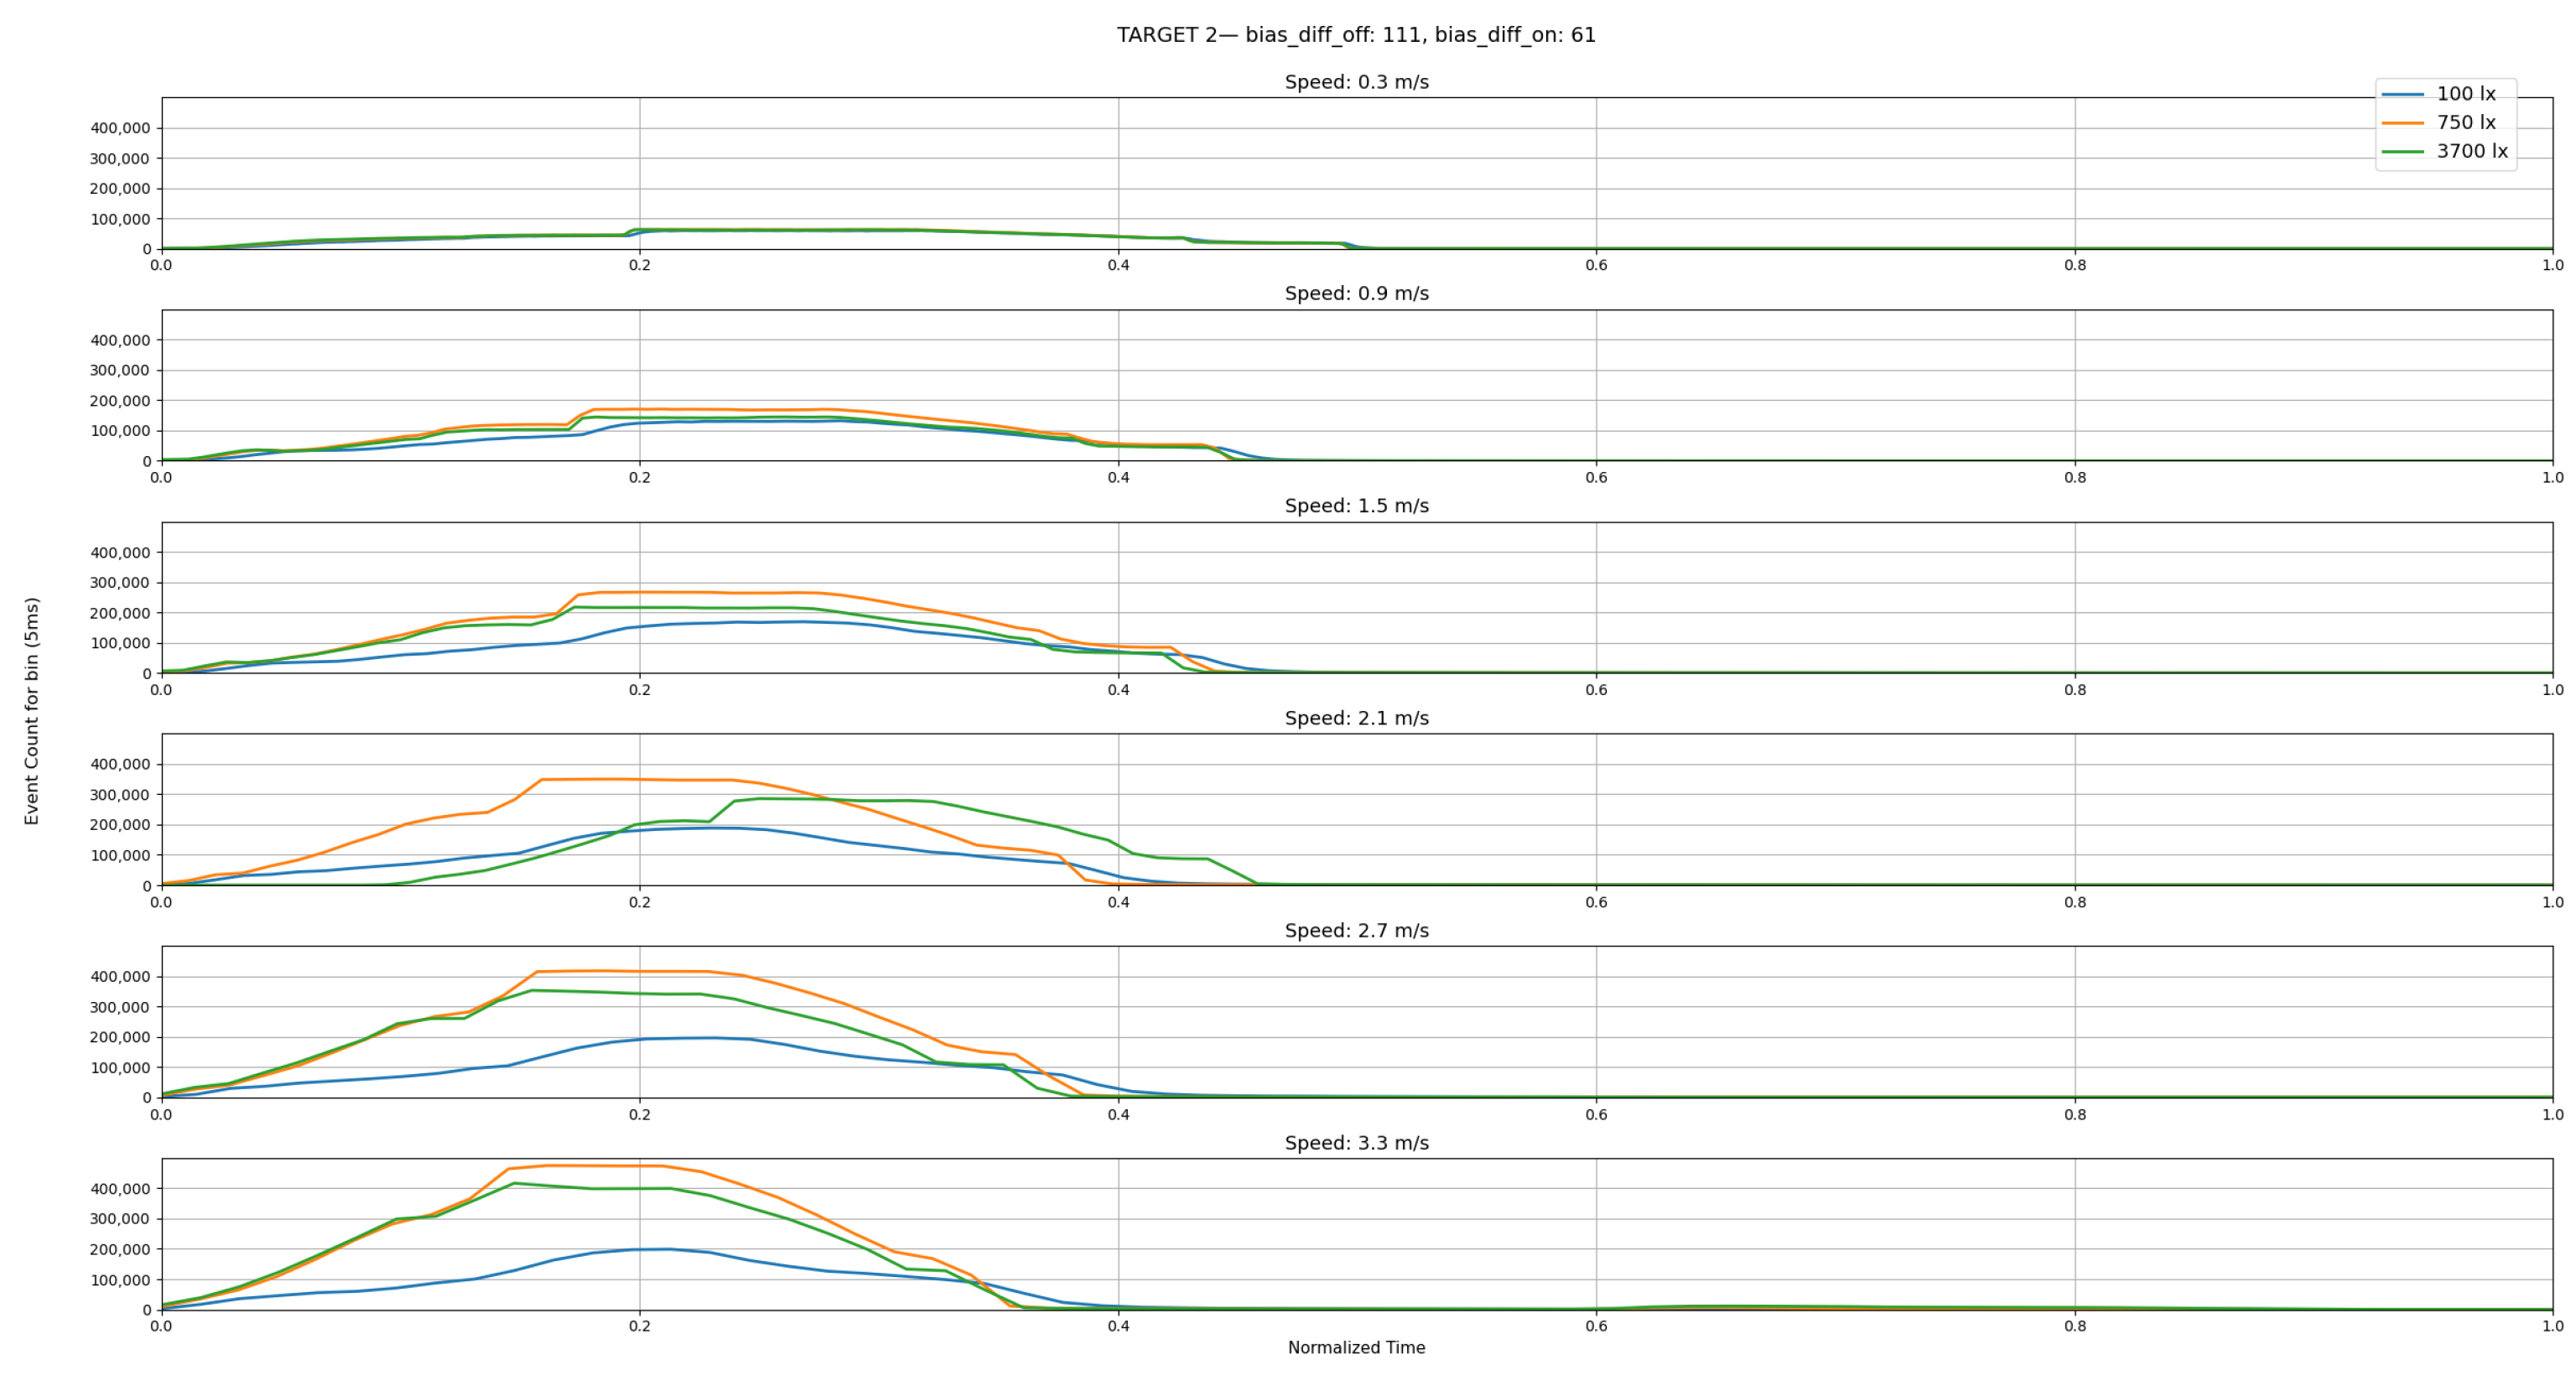
Although cumulative plots are useful for understanding overall event generation, they tend to be influenced by sequence duration. To mitigate this effect and better highlight the temporal distribution of events, we analyze the event rate over time using normalized plots. The plots in
Figure 18,
Figure 19,
Figure 20,
Figure 21,
Figure 22 and
Figure 23 show the event rate with a bin size of 5
, normalizing the time to the interval [0–1]. It is possible to observe that the peak event activity consistently aligns with intervals of rapid target motion, demonstrating that the sensor is capable of capturing fast dynamics even at higher speeds. The trend of the curves is similar for a given configuration for the different speeds, suggesting that the sensor maintains sufficient temporal resolution under demanding conditions. The exception of the shape of the last plot in
Figure 20 and
Figure 23 is due to the presence of a portion of the linear drive belt that becomes visible at the highest speed used in the dataset, which generated additional events in the final part of the sequence. This phenomenon does not occur at lower speeds.
Thus, as expected, we obtain empirical evidence of the feasibility of employing event cameras in scenarios beyond the capabilities of conventional imaging systems, as demonstrated by the accompanying frame data of the sequences in the dataset, which become unusable under high-speed motion due to severe blur.
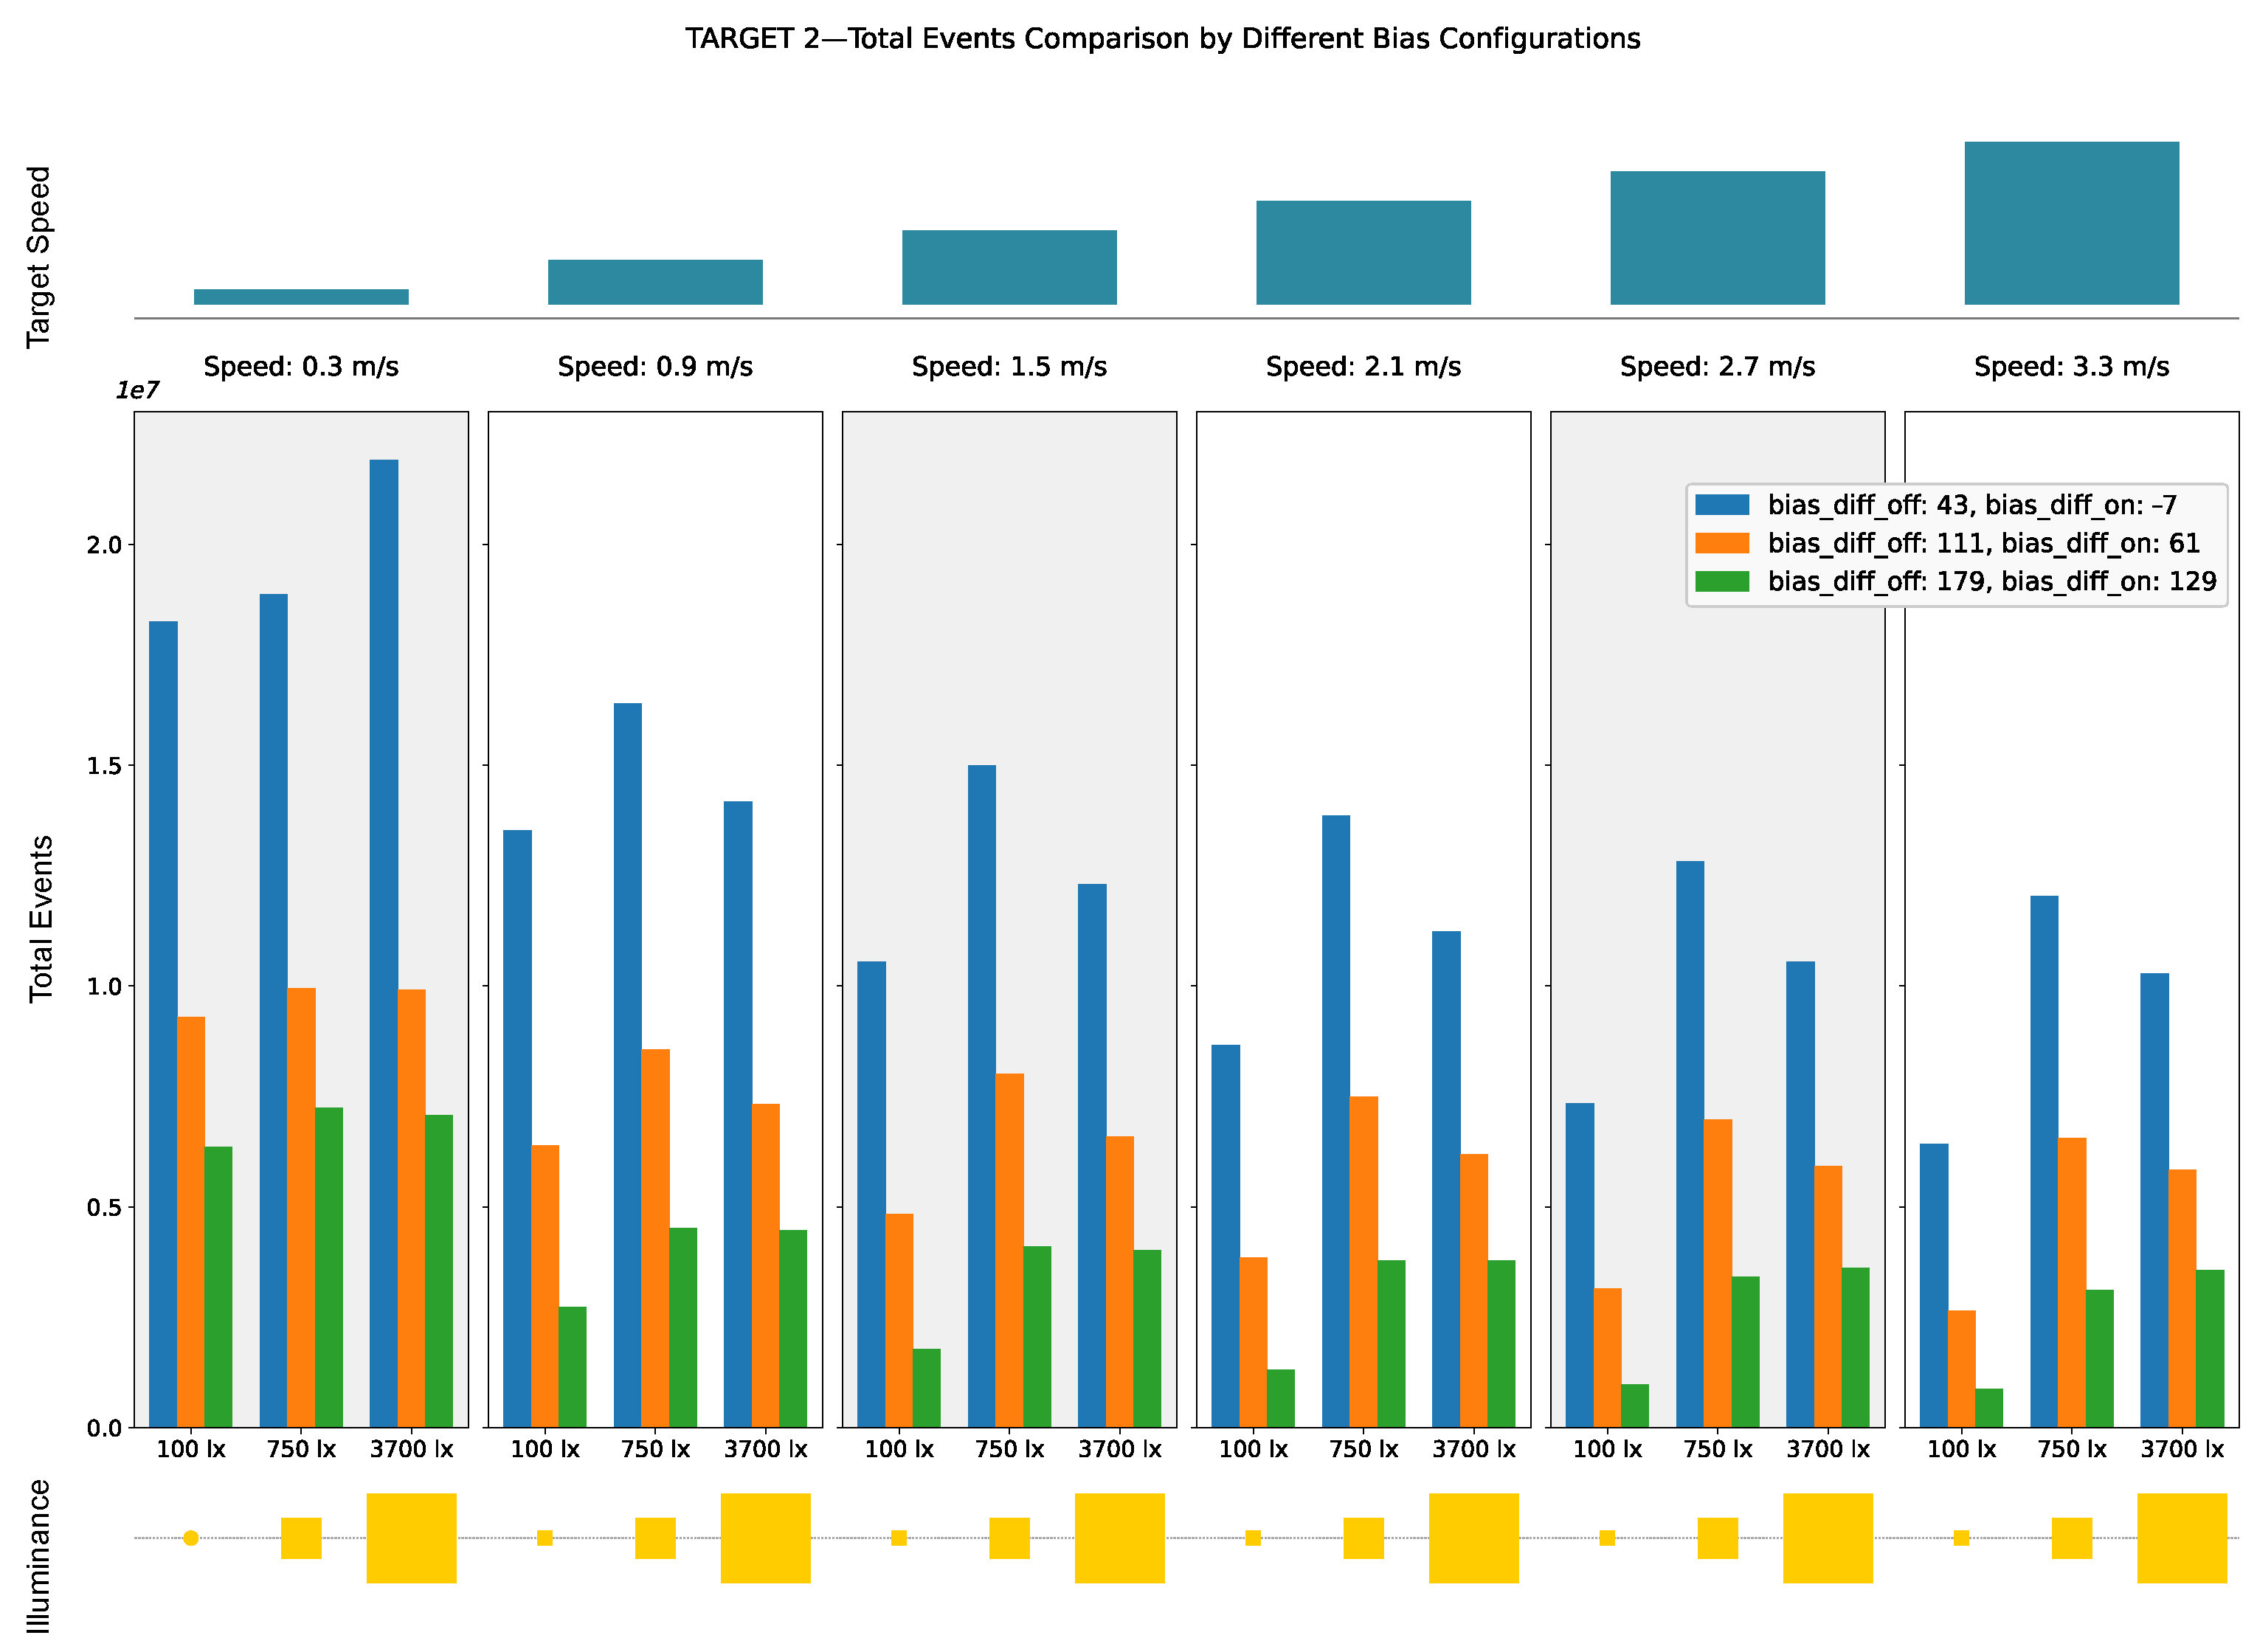
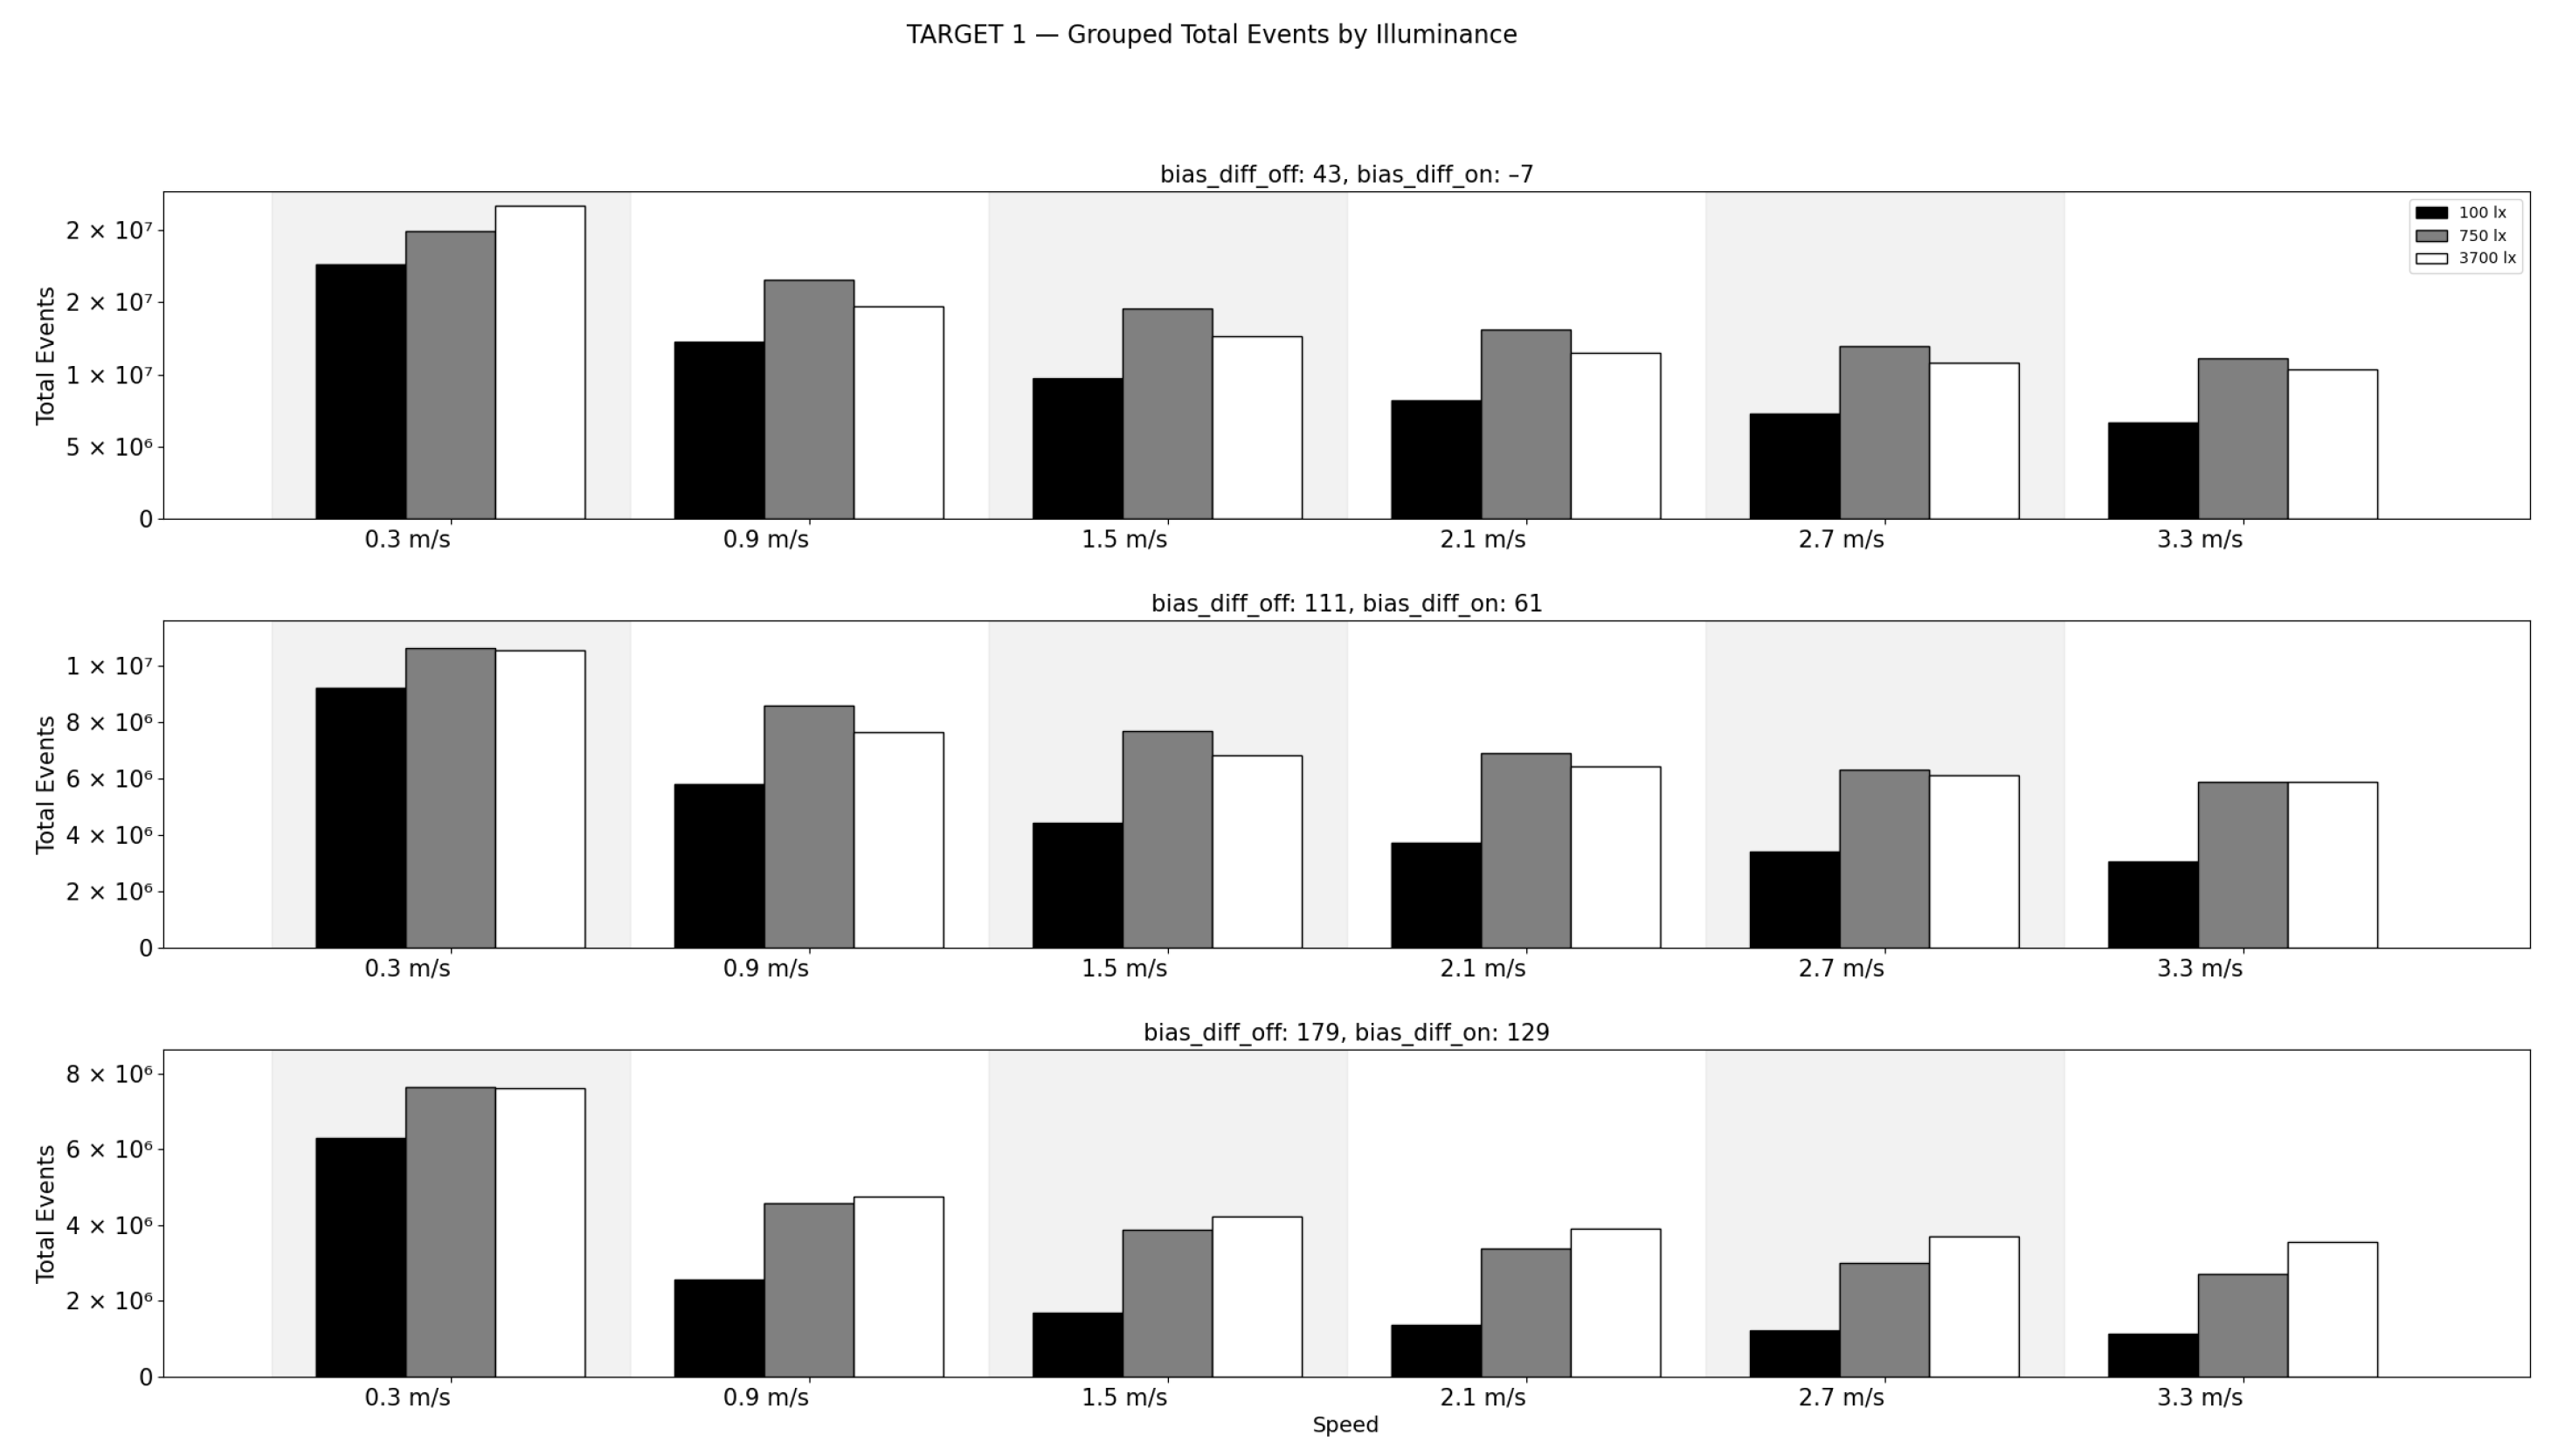
However, if we consider the lighting invariance, we can reorder the data by showing cumulative data for different speed and bias configurations, as in
Figure 24 and
Figure 25. Since each bias configuration generates a different number of events, the scales are relative to the same configuration in each subplot. From these plots it emerges that, for low illuminance values, the sensor captures significantly fewer events compared to well-lit scenes, primarily due to reduced contrast.
A binary classification of individual events as
signal or
noise is technically infeasible due to the inherent properties of event data, and it would require labeling each event, which is impractical given the absence of ground truth data at the same temporal resolution (33 ms compared to microseconds). Moreover, in textured regions of the target, a part of the event activity may be treated as noise even though it reflects proper intensity changes exceeding the bias-defined thresholds. Nevertheless, it remains valuable to quantitatively evaluate the event rate generation during transitions over edges, background, and the textured region. Therefore, we performed a localized analysis on a small ROI, defined as in
Figure 26, by manually annotating time intervals as
edges,
background, or
texture. The obtained results are shown in
Figure 27,
Figure 28 and
Figure 29 and illustrate the event distribution on the scenes previously analyzed for the case of speed equal to
, for illumination levels of 100, 750, and 3700 lx, respectively. These results confirm that, as expected, the event generation rate is strongly influenced by both the bias configuration and illumination level, and they additionally highlight the role of scene appearance, as different scene components elicit distinct activity patterns.
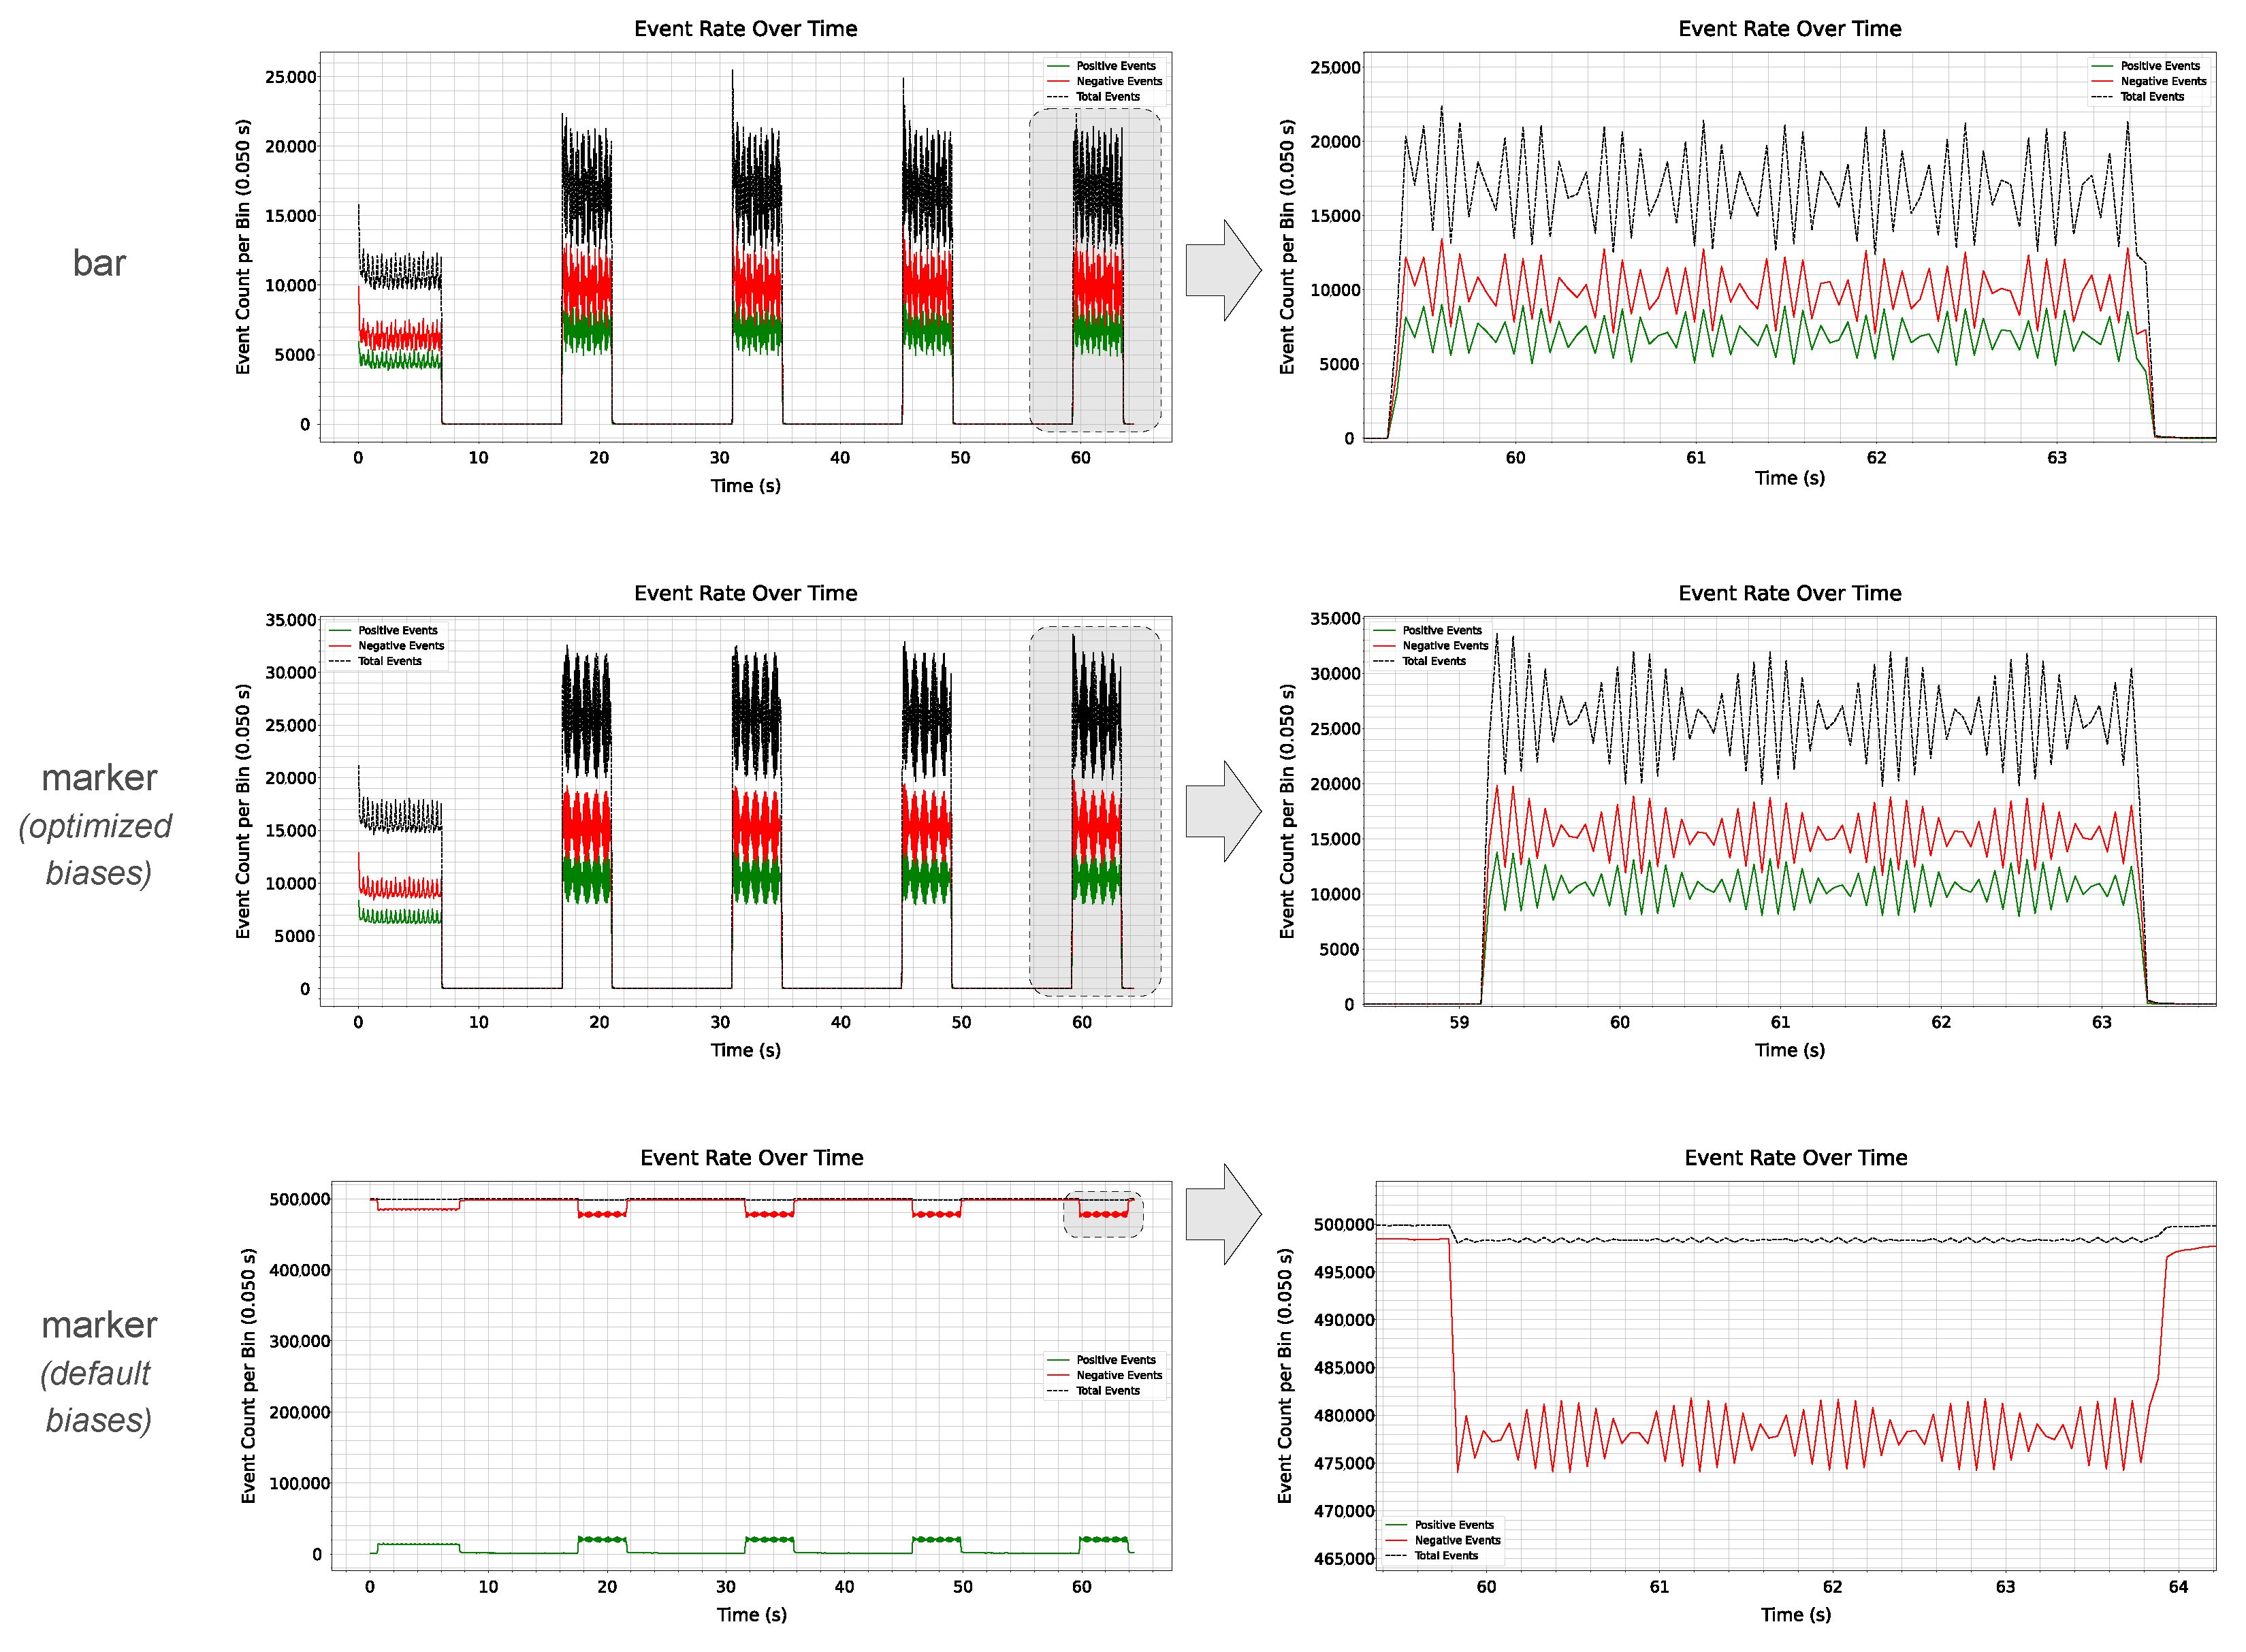
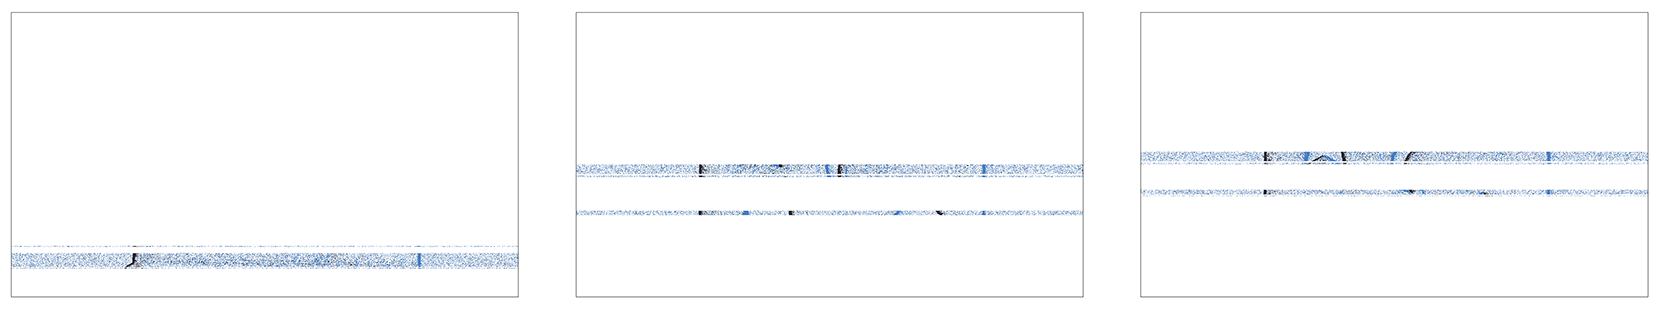
For the case of vibrations, it is possible to analyze the ability of the sensor to detect the polarity change period. Three examples of such an analysis on the dataset (see
Section 4.4) are reported in
Figure 30. The first row represents the case of the vibrating bar with an optimized bias configuration; the second corresponds to a vibrating marker again with an optimized bias configuration; and the third refers to a vibrating marker in the case of default biases. The sensor demonstrates the ability to effectively capture temporal changes in the scene, as is evident in the overall signal in terms of oscillations in event polarity, where positive and negative events alternate in response to changing dynamics. This is more evident in the case of the marker (due to sharp edges in the image appearance), even in the case of default biases. However, this analysis strongly depends on the accumulation time of events and does not extend to the actual estimation of signal frequency, which in turn involves several challenges, including the asynchronous and sparse nature of the event stream, noise induced by background motion, varying event rates due to camera configuration, and parameter-dependent estimations introduced by accumulation time, integration window size, or event polarity [
38,
39,
40]. Similar considerations are valid for rotations (see
Figure 31).
To collect raw, unfiltered data and rigorously evaluate the performance of event cameras under challenging conditions, we have chosen not to enable any filter such as ERC, anti-flicker, etc.; this way, in general, all the events produced by the camera during the experimental campaign are streamed, avoiding any filter algorithm that would possibly affect event measurements. However, readout saturation, bandwidth, and computational limits of devices, as well as the connection transfer speed (the USB link between the camera and the computer), may affect the acquisition: exceeding the maximum limits can therefore cause display lag, data loss, or corruption. An example of this phenomenon is shown in
Figure 32, where the images have an accumulation time of 100
. Therefore, the need to carefully configure and optimize the sensor biases and filters in order to ensure smooth acquisition, to avoid artifacts and data loss, introduces additional constraints for condition-varying acquisitions that must be addressed.
This becomes even more evident in the case of fast movement. For example, for fast velocities (
), an accumulation time of 2
can show misalignments and data corruption, as shown in
Figure 33.
Note that the same behavior is observed also with a Prophesee EVK3 [
41] and the iniVation DAVIS346.
7. Discussion
Although event cameras offer significant advantages over traditional frame cameras, comprehensive studies with publicly released data are still necessary to fully evaluate their performance. By proposing consistent and repeatable benchmark data while varying controlled environmental conditions and camera configurations, the proposed dataset is unique in its type and purpose. While existing datasets are well-suited for their respective application domains, their lack of controlled and repeatable acquisition settings limits their usefulness in the systematic evaluation of camera settings and algorithmic performance. Deep learning-based solutions, for instance, typically benefit from large-scale, diverse datasets that can be collected in unconstrained environments since they are ideal for training and validating high-level vision tasks. At the same time, such datasets are less appropriate for fine-grained sensor analysis or to assess robustness under controlled degradations.
The dataset section on moving targets can serve as a benchmark for several computer vision tasks such as edge detection, optical flow, or tracking, as well as comparing the performance of event cameras and frame-based cameras, which become impractical solutions at higher object speeds. Additionally, the synchronized frame data provides a valuable reference for the development of motion deblurring algorithms and autobiasing techniques in event cameras, allowing for more accurate and robust processing. The unique feature of the dataset of capturing the same scene patch at multiple speeds also supports the development and evaluation of automatic data restoration methods for event cameras. In particular, the intentional introduction of bias settings that induce data loss enables the assessment of camera performance under degraded input conditions, providing valuable insights into the robustness and reliability of event cameras in real-world applications.
The mechanical vibration scenario focuses on capturing high-frequency periodic motion, which is typically challenging for standard frame-based cameras. Data were acquired using two distinct bias configurations: the default factory settings and a noise-optimized configuration designed to suppress noise while preserving edge sharpness. This setup ensures that the data are suitable for assessing (i) the robustness to noise, (ii) the effectiveness of accumulation strategies, and (iii) frequency domain analysis.
The rotating fan scenario targets the evaluation of motion estimation under varying sensor settings and rotational speeds. For each configuration, sequences were recorded at six distinct rotational velocities, allowing for a fine-grained analysis of temporal resolution and bias sensitivity. As in the vibration scenario, this setup facilitates the assessment under varying spatiotemporal resolutions and sensor configurations, while also supporting benchmarking under degraded or suboptimal bias settings.
The experiments carried out in this study highlight both the strengths and limitations of event-based cameras in a range of controlled and challenging scenarios. Although high temporal resolution and dynamic range offer clear advantages over traditional frame cameras, practical deployment reveals several constraints that must be carefully considered. The experiments in low illumination conditions highlight a commonly overlooked limitation: the potential loss of events in low-light conditions, which may affect the robustness of event-based systems in real-world applications. This suggests that, despite the high dynamic range typically associated with event cameras, when deploying such sensors in outdoor or uncontrolled lighting scenarios, attention must be paid to illumination levels to ensure reliable event generation. Laboratory settings allow for careful control of parameters, ensuring that event generation remains within the computational and bandwidth constraints of the system; nevertheless, real-world environments present a very different challenge. In uncontrolled scenarios, it is often difficult to anticipate all relevant variables: surface textures, lighting variations, and unpredictable motion dynamics can significantly affect event rates. Even in the case where approximate ranges for speed, appearance, and/or object size may be estimated, the variability and complexity of natural scenes make precise tuning impractical. This highlights a key limitation of current event cameras: they require task-specific calibration and careful parameter adjustment, which limits their out-of-the-box applicability and ease of integration in general-purpose vision pipelines. Effective deployment still requires expert configuration and scene-specific adaptation, which can limit their usability in broader, dynamic applications.
Benchmarks datasets such as MVSEC [
42], DSEC [
43], and N-Caltech101 [
44] have significantly advanced event-based vision research, but their design and different goals imply key limitations that the proposed dataset directly addresses. In particular, MVSEC and DSEC offer high-quality real-world recordings for tasks such as depth estimation and optical flow, while N-Caltech101 provides an object classification benchmark. However, these datasets are generally nonrepeatable, lacking systematic control over environmental parameters such as illumination or bias settings. Lastly, it is important to include in the analysis datasets created using event camera simulators, as in [
45,
46]. The costs of event cameras and the presence of few commercial companies and, consequently, of off-the-shelf sensors, have led to event-data simulators and emulators. They work by mimicking the sampling processes of event-based sensors and their different thresholds, generating data cost-effectively to fulfill the need for affordable, high-quality labeled events in algorithm development and benchmarking. However, if it is true that it has been proven that models trained on simulated dataset generalize well in real scenarios for many computer vision tasks [
45,
47], it is also important to note that they usually generate suboptimal results with blurry frames typical of fast dynamic scenes and cannot model the noise of event cameras. In addition, simulators increase computational demand and reconstruction artifacts, which can alter data or neglect event-specific characteristics [
48]. However, emerging problems and research areas, such as automatic optimal bias estimation [
49], cannot be fully addressed by means of simulated data only. In particular, synthetic data cannot simulate specific sensor responses, such as sensitivity to different bias configurations and the associated impact in terms of scene dynamics, and, consequently, the present parametric experimental campaign can provide significant findings.
Table 2 provides a comparison with state-of-the-art event camera data collections, an event camera simulator (the ESIM [
45]), and the proposed dataset. The JRC INVISIONS Neuromorphic Sensors Parametric Tests dataset is distinguished primarily through its rigorous control and systematic variation of sensor parameters and environmental conditions. Unlike simulators such as the ESIM, which provide synthetic event data lacking real sensor noise and artifacts, the proposed dataset offers real-world recordings with measurable bias effects over time, crucial for developing robust event-based vision algorithms. Although the ESIM allows one to set positive and negative thresholds, it does not simulate actual hardware behavior, such as data loss, readout saturation, or temporal jitter, limiting its realism for bias-sensitive evaluations.
The proposed dataset leverages event-based computer vision tasks summarized in
Table 1 for the tasks of object detection and tracking, speed estimation, angular velocity estimation, frequency estimation, fiducial marker detection. Moreover, the presence of synchronized frame data lets one provide a base for 3D reconstruction, camera autobiasing, and frame deblurring techniques. As a consequence, the dataset underpins a range of core low- and middle-level event-based vision tasks that are the building blocks of real-world applications [
2]. Examples are the systematic variation of camera parameters and controlled illumination conditions that enable rigorous benchmarking of event-based tracking, essential in robotics and surveillance applications, and the inclusion of periodic motion and vibration scenes, essential for characterizing mechanical systems. Therefore, the dataset contributes to filling the gap between simulation and deployment, fostering the development and evaluation of robust, real-time event-based algorithms for complex real-world environments.
8. Conclusions
This work presented the experimental JRC INVISIONS Neuromorphic Sensors Parametric Tests (JRC_INVISIONS_PARAMETRIC_2025) dataset, specifically designed to examine the influence of different event camera settings in dynamic scenes’ acquisition, performed in highly controlled and reproducible experimental setups. The dataset comprises three distinct use cases, each accompanied by precise ground truth annotations relevant to its specific context. By enabling repeatable acquisitions across systematically varied conditions (such as object speed, light intensity, and sensor configuration), this dataset will provide a unique tool for gaining insight on the influence of each parameter on the sensor acquisition. By providing associated frame data and ground truth information, this dataset will aim to represent a basis for benchmarking the reliability of event-based low- and middle-level perception tasks. We provide, in this way, an answer to the first research question posed in
Section 1. In addition, to answer to the second introduced question, an analysis has been performed in terms of data quality, sensor robustness, and operational constraints, analyzing both the potential and current limitations of event-based cameras and offering insight into their practical viability across diverse scenarios. To our knowledge, this is the first publicly available dataset designed with this level of configurability and repeatability for analyzing bias-related effects in event camera data, thus providing a valuable benchmark for both current applications and future developments, such as automatic bias adaptation. The JRC dataset is made available for download through the Joint Research Centre Data Catalogue, enabling researchers to leverage this resource to advance the state of the art in event-based perception.
The work and data collection presented here are part of a broader research project aimed at advancing the understanding of event camera performance in controlled settings and supporting the development of resilient event-based vision systems [
50]. In future work, a benchmark of state-of-the-art event-based methods will be performed for the tasks the released data cover. In the second phase, we intend to explore more advanced use cases, such as automatic bias calibration and the analysis of algorithmic performance in real scenarios, leveraging the dataset’s inherent flexibility to support the development of resilient event-based vision solutions.


