5.2.1. The Detection Capability
Under the experimental setting with
,
, and
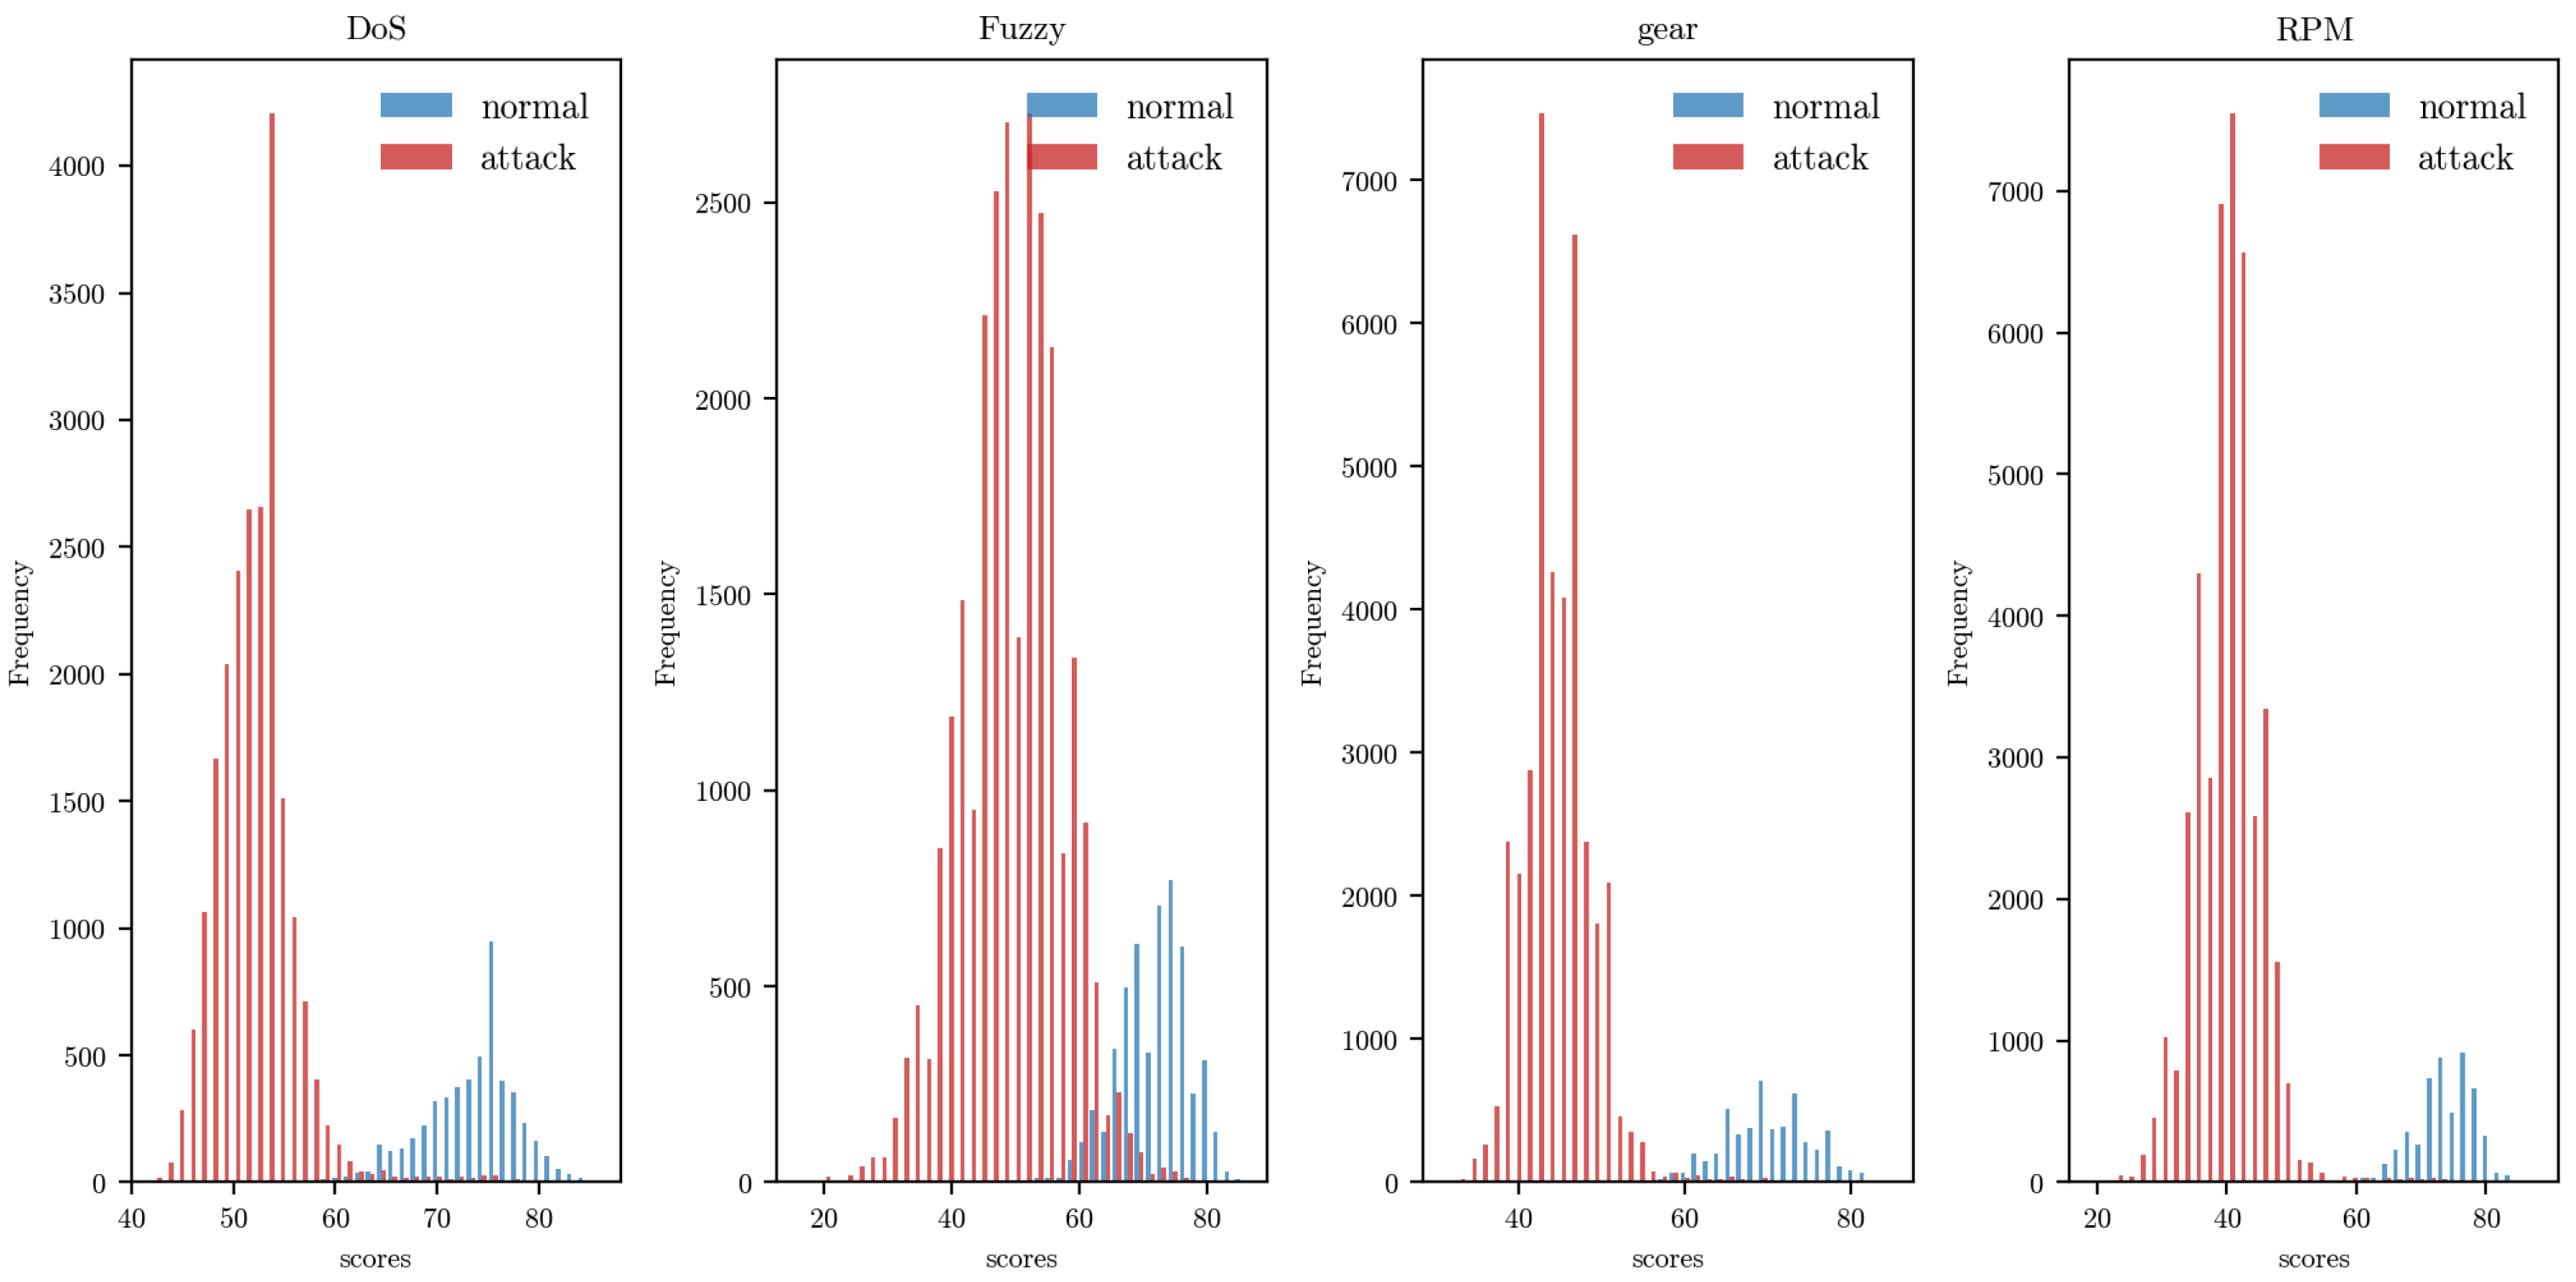
, we evaluate the detection performance across all four attack types in the car hacking dataset. To analyze the behavior of the similarity-based detection mechanism further, we present boxplots and histograms (see
Figure 4 and
Figure 5) illustrating the distribution of the similarity scores for both normal and anomalous samples. The visualizations show clear separation between the two distributions, indicating that the proposed method effectively differentiates between normal and attack patterns.
Table 5 compares the performance of our proposed method with five representative baseline approaches. Among them, iForest [
23], ECOD [
25], and the AE [
24] are the baseline methods we implemented as part of our evaluation framework. In contrast, the remaining two WINDS [
19] and GIDS [
14] are included based on results reported in the prior literature.
The proposed method outperforms all of the non-AI baselines across most of the attack types and evaluation metrics, demonstrating clear advantages in both accuracy and robustness. Although the AE method achieves a slightly higher performance, the proposed method maintains comparable scores. In particular, for gear spoofing attacks, the proposed method achieves the best results on all metrics except the FNR. iForest performs poorly across all scenarios, with consistently low F1- and AUROC scores, indicating its limited suitability. ECOD achieves excellent results in detecting fuzzy attacks (F1 = 0.9962), but its overall performance is hindered by weak results for gear and RPM spoofing. WINDS shows a relatively good performance for gear and RPM attacks but still falls short of the proposed method. These results suggest that the method offers a favorable trade-off between a lightweight implementation and detection effectiveness.
One notable limitation of the proposed method is its comparatively lower performance on fuzzy attacks, with slightly reduced AUROC and F1-scores relative to those of the AE and ECOD. Fuzzy attacks operate by injecting randomly generated CAN frames into the network, which may inadvertently trigger unintended ECU behaviors. We hypothesize that due to their randomized yet structurally valid nature, fuzzy attack frames exhibit traffic patterns that are more similar to benign CAN messages compared to other attack types. This resemblance may reduce the contrast in the similarity scores and make anomaly detection more challenging for similarity-based methods. Supporting this, we observe that the average similarity score for fuzzy attack samples is significantly higher than that for the other attack types, indicating that these messages are more likely to be mistaken as normal under the proposed hash-based detection mechanism. The following table reports the mean similarity scores for both normal and attack segments.
Since the proposed method computes locality-sensitive hashes over aggregated sequences of
n consecutive CAN frames, we further investigate how the proportion of attack frames within each segment affects the resulting similarity score.
Table 6 also presents the Pearson’s correlation coefficients between the number of attack frames and the corresponding detection scores across the four attack types. The results show a negative correlation in all cases, meaning that the more attack frames are included in a segment, the less similar it becomes to normal data. The correlation coefficients range from −0.57 to −0.72, indicating at least a moderate to strong negative linear relationship across all attack types. This indicates a moderate to strong inverse linear relationship: as more attack frames are included in a segment, the less similar it becomes to normal data. These findings validate the scoring mechanism for our method—segments that contain more abnormal behavior tend to diverge more significantly from the learned normal profile.
However, among the four attacks, the correlation is weakest for fuzzy attacks. This aligns with the earlier observation that fuzzy attack frames, though malicious, are syntactically valid and randomly distributed, making them more likely to be blended into normal segments without drastically altering the hash-based similarity. As a result, even segments containing multiple fuzzy attack frames may retain relatively high similarity scores, contributing to the reduced detection sensitivity observed for this attack type.
To validate the generalization capability of our method further, we also conducted experiments on the Car Hacking: Attack & Defense Challenge 2020 dataset. This dataset presents a different set of attack scenarios and vehicle configurations, providing a complementary evaluation setting for assessing the robustness of our approach.
Table 7 presents the overall detection performance of our proposed method and that of several baseline approaches. We set
,
, and
. The proposed method achieves a high AUROC of 0.9974, indicating its excellent discriminative ability. Its F1-score (0.9801) and accuracy (0.9758) are also competitive, closely matching those of the autoencoder (AE), which slightly outperforms in accuracy but exhibits a higher false negative rate. This suggests that our method is more sensitive to anomalous patterns, reducing missed detections. Traditional anomaly detection methods such as Isolation Forest and ECOD perform considerably worse in this setting, with ECOD achieving only 54.0% accuracy and a 55.3% AUROC. Isolation Forest yields a better AUROC (0.7616) but suffers from a high false positive rate (FPR = 0.2493), limiting its practical usability. CAVIDS [
26] is a lightweight intrusion detection method designed specifically for connected autonomous vehicles (CAVs). It is based on Logical Analysis of Data (LAD), a rule-based two-class classification technique that constructs partially defined Boolean functions (pdBfs) from historical CAN message data. CAVIDS shows a strong performance in its accuracy (0.9700) but lags behind in its F1-score. The XGBoost-based method from [
22] reports only the F1-score (0.864), which is significantly lower than that of the proposed method.
Overall, our method demonstrates robust generalization to a dataset with different characteristics and attack patterns, maintaining a strong detection capability without relying on deep learning or model retraining.
5.2.2. The Runtime and Resource Overhead
Table 8 summarizes the average runtime per sample and the estimated storage overhead for each evaluated method. Our method involves computing a locality-sensitive hash digest for each test frame series and comparing it against the most recent
k stored digests, which demonstrates low computational latency (0.93 ms) and minimal memory usage (3.2 KB), as it only stores a fixed-size sliding window of
LSH digests. In contrast, the autoencoder (AE) introduces a higher storage overhead (21 MB), mainly due to its trained neural network parameters. As a deep learning model, the AE contains a large number of parameters and requires substantial matrix computations, making it unsuitable for deployment on resource-constrained devices such as in-vehicle ECUs [
27]. iForest also requires moderate memory (1.44 MB), reflecting the number and depth of the isolation trees.
Notably, ECOD differs from the other methods in that it retains the full training dataset as part of its model representation. This design makes its storage requirements directly dependent on the training data size and thus difficult to express as a fixed overhead in kilobytes or megabytes. As such, we omit its estimated storage value in the table.
Therefore, our method demonstrates significant advantages in both the storage and runtime overhead, making it particularly well suited to deployment on the CAN bus.
5.2.4. The Influence of the Hyperparameters
We examine how varying the hyperparameters
n (the number of CAN frames concatenated to form a frame series) and
k (the number of recent LSH digests stored) affects the detection performance.
Figure 6 and
Figure 7 depict the AUROC, accuracy, and F1-score under different values of
n and
k.
The Car Hacking Dataset:All three metrics (AUROC, accuracy, and F1-score) show a consistent decline as n increases. This indicates that aggregating too many CAN frames into a single sequence may blur the temporal locality and dilute the distinction between normal and anomalous patterns. Notably, extreme values of k also hurt the performance: setting leads to significant fluctuations—particularly at —while introduces visible degradation, likely due to the inclusion of outdated behavioral patterns in the reference window. The best trade-off is observed when to 100 and to 200.
The Car Hacking Challenge dataset: The performance trends are less monotonic but still reflect similar sensitivities. All three metrics generally peak at across most k values and drop sharply at . The AUROC for reaches its maximum at , while both the accuracy and F1-score also show the optimal performance in the n = 100–150 range. At , the performance deteriorates across the board, especially for , confirming that excessive aggregation combined with a large reference window weakens anomaly separability.
Summary and recommendations: These results demonstrate that both hyperparameters affect the performance in a coupled manner. A small aggregation window () ensures a good temporal resolution, while a moderately sized reference set () balances the memory usage with detection robustness.
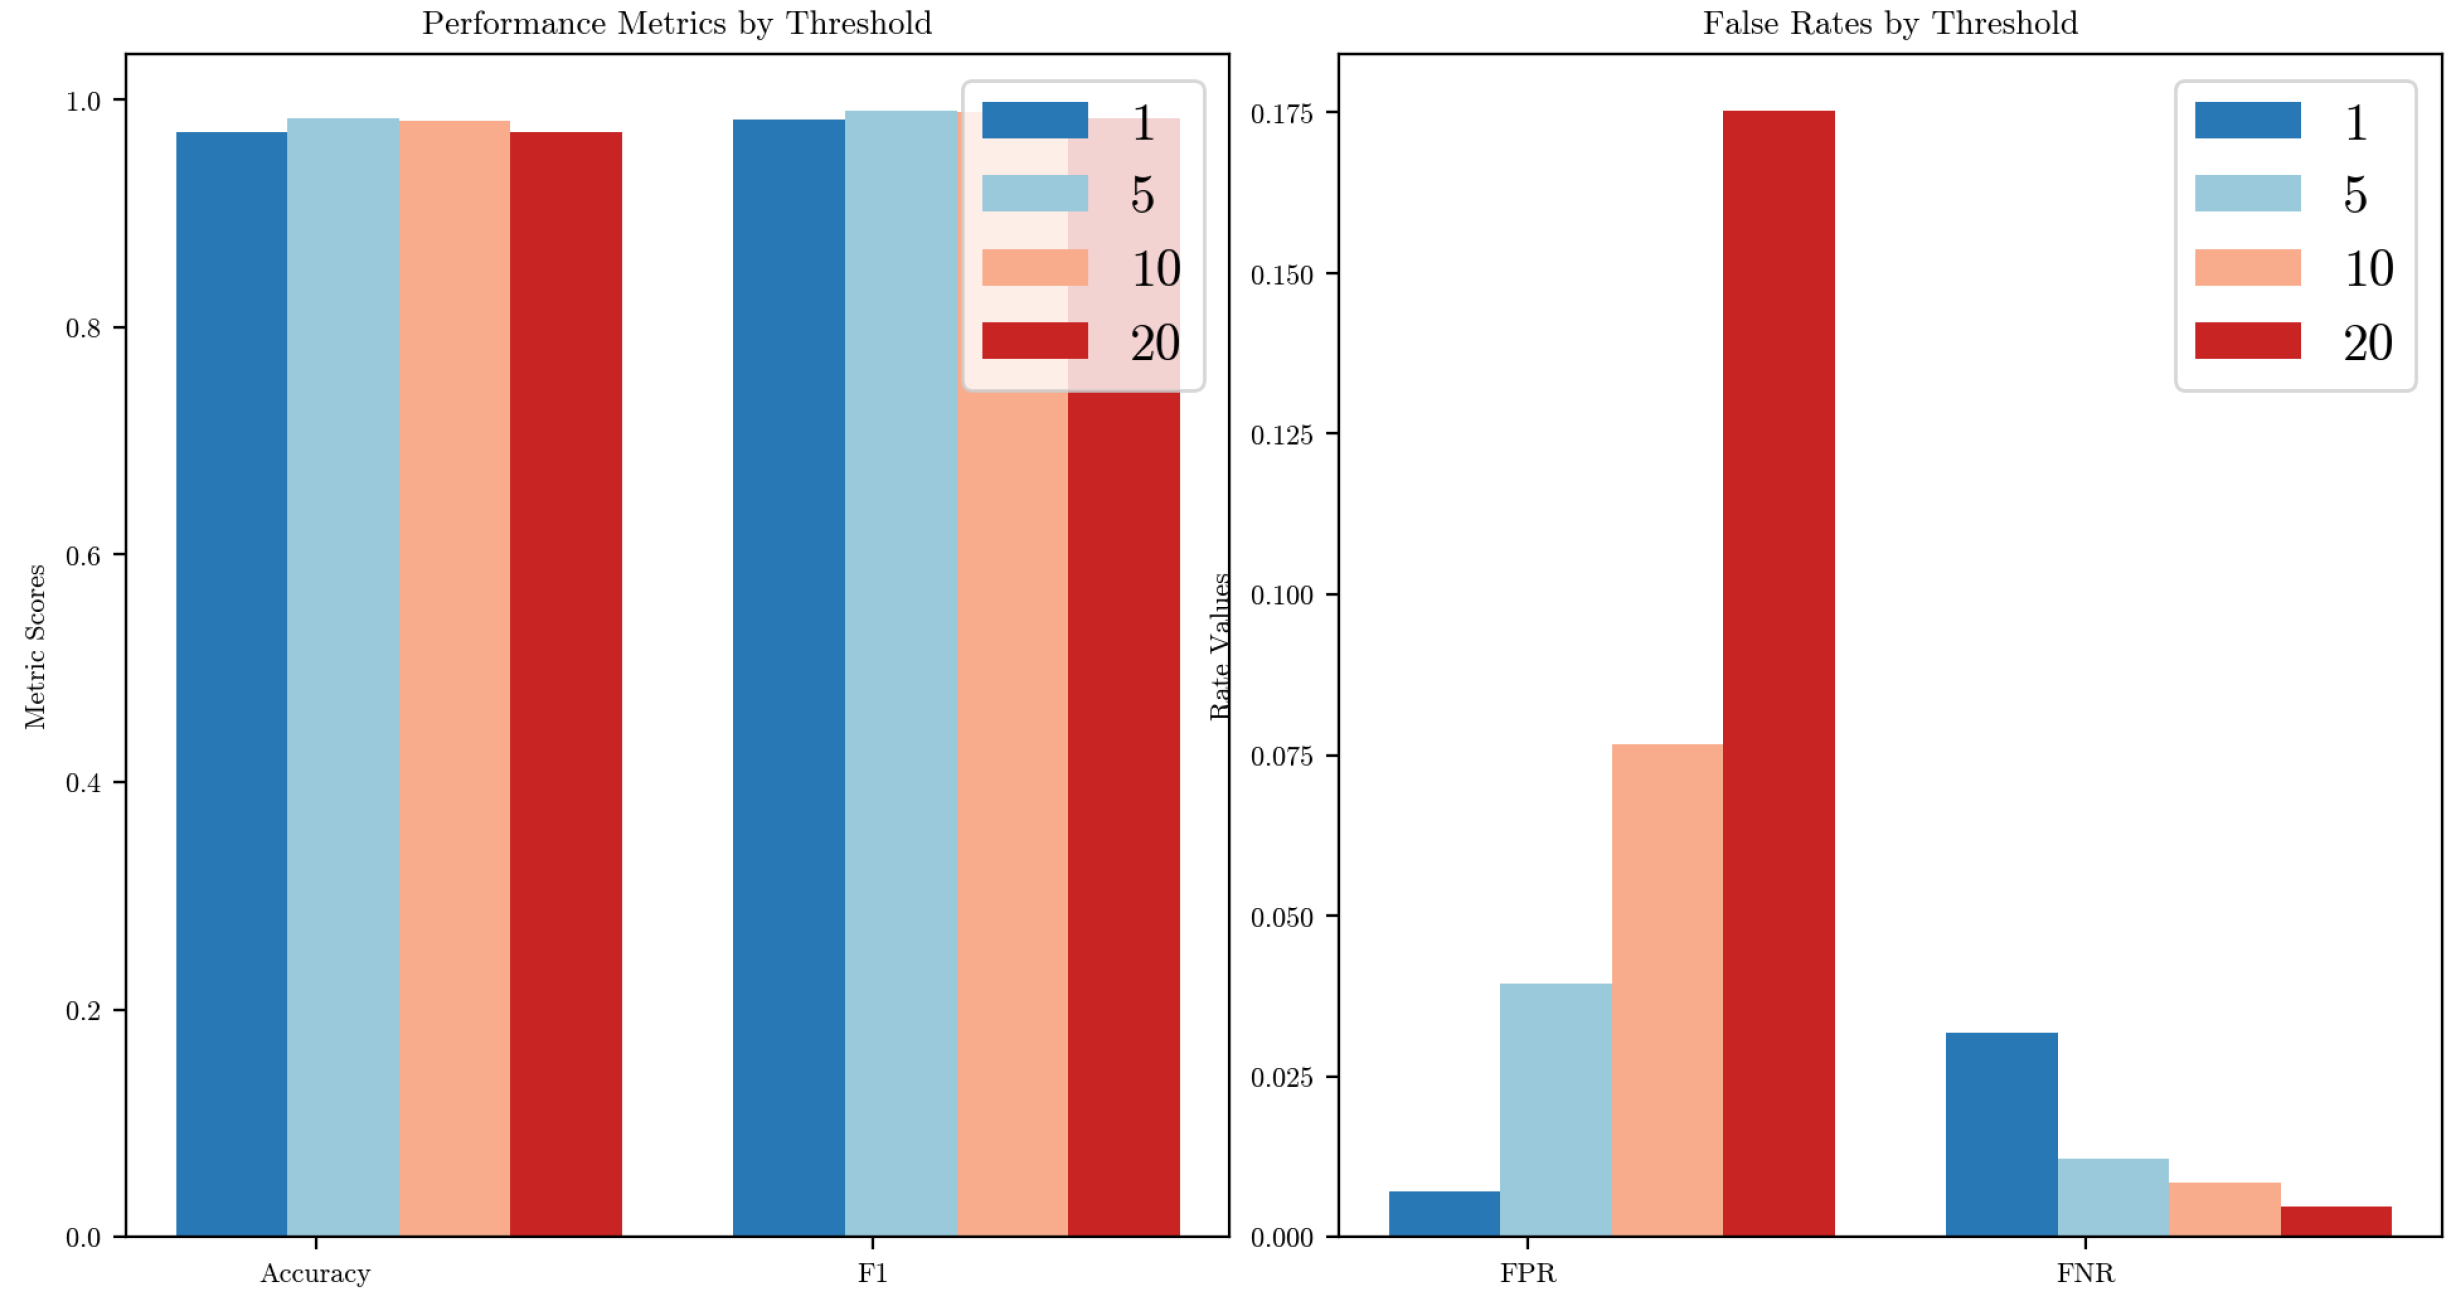
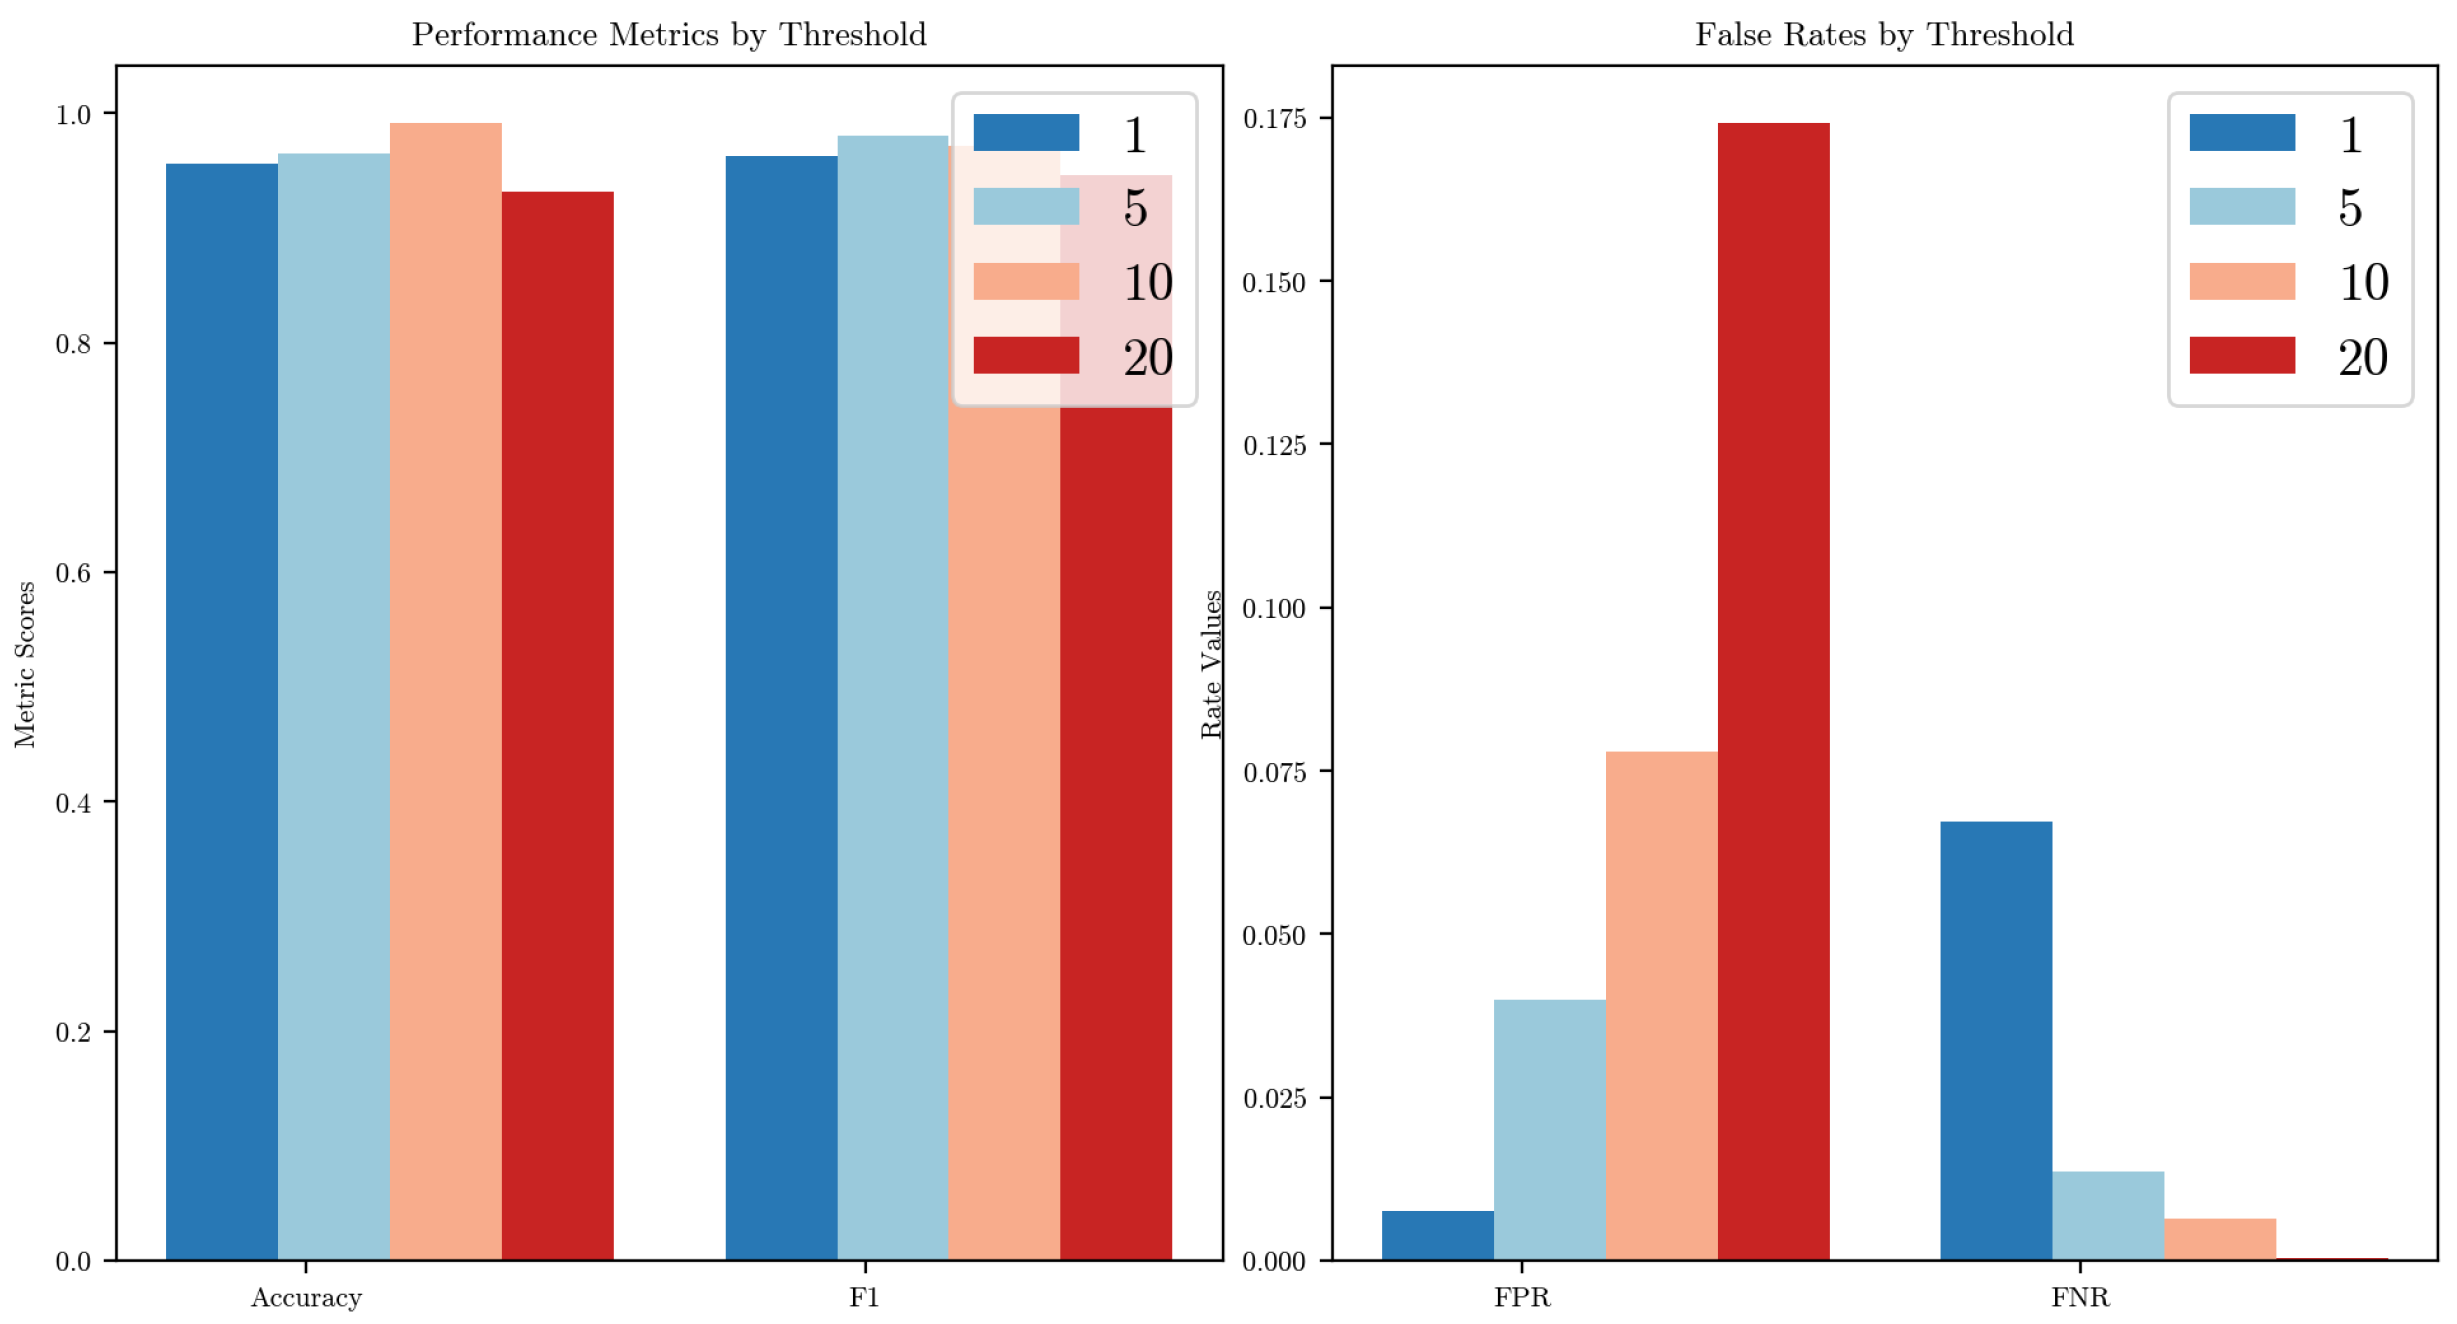
Figure 8 and
Figure 9 illustrate the effects of varying the detection threshold
performance metrics and error rates across the two datasets. We define
as the
-th percentile of the similarity score distribution computed from a set of normal data. Specifically, thresholds corresponding to the 1st, 5th, 10th, and 20th percentiles were evaluated.
In both cases, setting yields the most balanced performance: the accuracy and F1-score remain high, while both the false positive rate (FPR) and false negative rate (FNR) are kept at acceptable levels. When is too low (e.g., 1), the threshold becomes overly strict, increasing the FNR slightly, as more anomalies are misclassified as normal. Conversely, as increases to 10 or 20, the threshold becomes more permissive, leading to a noticeable increase in the FPR, particularly evident in the car hacking dataset, where the FPR exceeds 17% at .
The patterns are consistent in the Car Hacking Challenge dataset, though the performance curves are flatter. This indicates that the method is relatively robust to threshold variations but still benefits from a carefully chosen . Based on these observations, we adopt as the default setting for all experiments.
5.2.5. The Impact of the Choice of LSH Algorithm
In addition to Nilsimsa, we also selected another locality-sensitive hashing algorithm, TLSH [
28], to evaluate its effectiveness. TLSH is an improved variant of Nilsimsa that uses a Pearson hash to compute trigram hash values. Instead of the average used by Nilsimsa, TLSH adopts quartiles for thresholding. The final TLSH digest incorporates a checksum, length information, and quartile-based statistical information, while the similarity is determined by the Hamming distance between Bloom filters.
Table 10 shows the comparative performance of these two LSH algorithms. The experimental results demonstrate that Nilsimsa outperforms TLSH across all metrics. For TLSH, the AUROC, accuracy, and F1-score fall below 0.98, and its FPR is notably higher than that of Nilsimsa—indicating a higher tendency towards false alarms. However, the FNR for both algorithms is roughly similar, remaining below 0.02.
We also note that TLSH only considers hash values in the range of 0–127, whereas Nilsimsa uses 256 possible outputs in its bucket mapping. In smaller- to medium-scale datasets, Nilsimsa’s finer-grained distribution allows it to detect minor variations in the input data, capturing more subtle features. Consequently, Nilsimsa’s performance proves superior to that of TLSH in this scenario.


