Article

Detection of Trees and Objects in Apple Orchard from LiDAR Point Cloud Data Using a YOLOv5 Framework

1
Department of Agricultural Machinery Engineering, Graduate School, Chungnam National University, Daejeon 34134, Republic of Korea
2
Department of Smart Agricultural Systems, Graduate School, Chungnam National University, Daejeon 34134, Republic of Korea
3
FYD Company Ltd., Suwon 16676, Republic of Korea
*
Author to whom correspondence should be addressed.
Electronics 2025, 14(13), 2545; https://doi.org/10.3390/electronics14132545
Submission received: 27 May 2025 / Revised: 20 June 2025 / Accepted: 21 June 2025 / Published: 24 June 2025

Abstract

Object detection is crucial for smart apple orchard management using agricultural machinery to avoid obstacles. The objective of this study was to detect apple trees and other objects in an apple orchard using LiDAR and the YOLOv5 algorithm. A commercial LiDAR was attached to a tripod to collect apple tree trunk data, which were then pre-processed and converted into PNG images. A pre-processed set of 1500 images was manually annotated with bounding boxes and class labels (trees, water tanks, and others) to train and validate the YOLOv5 object detection algorithm. The model, trained over 100 epochs, resulted in 90% precision, 87% recall, mAP@0.5 of 0.89, and mAP@0.5:0.95 of 0.48. The accuracy reached 89% with a low classification loss of 0.001. Class-wise accuracy was high for water tanks (96%) and trees (95%), while the “others” category had lower accuracy (82%) due to inter-class similarity. Accurate object detection is challenging since the apple orchard environment is complex and unstructured. Background misclassifications highlight the need for improved dataset balance, better feature discrimination, and refinement in detecting ambiguous objects.

1. Introduction

Apple (Malus domestica) is one of the major fruit crops worldwide, growing mainly in temperate agro-climatic zones [1,2,3]. It accounts for about half of the deciduous fruit tree production worldwide and has become a profitable cash crop for producers [4]. Appropriate orchard management is substantially important to achieve a satisfactory yield in fruit orchards. Object detection plays an important role in automating several essential tasks, such as yield estimation, fruit harvesting robots, and targeted pest management, allowing for more efficient and precise orchard management, especially in complex working environments with complex apple tree geometries. The process of detecting and localizing objects within images is a computer vision task known as object detection [5,6]. Object detection is a fundamental computer vision task that involves both the classification and localization of objects within an image. As a core component of artificial intelligence, it significantly influences the performance of other applications [7], particularly in the field of agriculture [8,9,10]. It plays a pivotal role in image analysis and the broader context of agricultural automation. Accurate detection of trees and other classes of objects in orchard environments is essential for robotic perception and safe navigation. Object detection is fundamental for robotic operations, such as seed dispensing and obstacle avoidance. This integration highlights the synergy between visual intelligence and autonomous field operations, reinforcing the need for robust real-time detection frameworks like YOLOv5 [11]. Object detection in apple orchards plays a crucial role in enhancing orchard management by improving precision agriculture practices, resource optimization [12], and decision-making [13,14]. The ability to accurately detect and classify objects, such as apple trees, water tanks, concrete posts, and the visibility of humans as dynamic objects is engaged with data collection. This enables the efficient monitoring, automation, and yield estimation of fruits in orchards [6,15,16]. Traditional object detection methods are more time-consuming than state-of-the-art methods or algorithms used for object detection in fruit orchard management [17]. Therefore, object detection algorithms are used to detect general instances of one or more predefined object classes in a given scene. Object detection using images is an intuitive task for the human brain; however, it remains a complex challenge for computational systems. Over the past few years, several algorithms have been developed to address these challenges effectively.

2. Related Works

Object detection algorithms are generally categorized into two stages: one- and two-stage [18,19]. The one-stage object detection frameworks consist of models such as You Only Look Once (YOLO) [20,21,22,23,24], SSD [25], DSSD [26], RetinaNet [27], RefineDet [28], whereas two-stage algorithms mainly include R-CNN [29], Fast R-CNN [30], Faster R-CNN [31,32], and Mask R-CNN [33]. One-stage algorithms rely on regression techniques to directly predict detection results, which possess a high speed of detection; however, they often struggle to accurately detect small-scale objects. One-stage detection eliminates the need for candidate box generation, whereas two-stage detection algorithms generate bounding box candidates and then classify objects within them. It offers high accuracy and robustness with low error rates [34,35]; however, it requires more time for processing, making them less suitable for applications in real-time detection. Several one-stage (e.g., SSD and YOLO) and two-stage (e.g., Faster R-CNN and Mask R-CNN) object detection algorithms have been applied in agricultural studies. While two-stage detectors are often more accurate, they tend to have slower inference speeds, making them less suitable for real-time field applications.
One-stage detectors like YOLOv5 offer a strong balance between speed and accuracy, which is critical in complex orchard environments where real-time detection is required for integration with agricultural machinery. The aim was to develop a deployable and scalable detection pipeline for apple orchards using LiDAR PCD data. The streamlined architecture of YOLOv5, efficient training convergence, compatibility with 2D projections of 3D point clouds, and demonstrated field performance justified its selection for this study. Compared with other one-stage detectors, such as SSD, RetinaNet, and YOLO, the YOLO series stands out for its unique architecture and continuous performance improvements [7]. The YOLO algorithm, first introduced by Redmon et al. [20], has emerged as one of the most widely used techniques for object detection due to its efficiency and accuracy. The YOLO series has undergone continuous development through five major variants: YOLOv1 to YOLOv5 [20,21,22,23,24].
The field of computer vision continues to evolve rapidly, enabling automated systems to analyze and make sense of information using images [36,37]. Object detection is a fundamental task in this field [38] that focuses on accurately identifying and localizing objects within stationary images or sequences of videos [39]. Over the past few years, several algorithmic innovations have emerged, leading to substantial improvements in detection accuracy and efficiency [40]. Among the advancements in object detection is the YOLO algorithm, initially presented by Redmon et al. [20]. The name reflects the unique methodology, wherein the entire image is processed in one forward pass to detect and determine the spatial positions of objects. Conversely, in conventional two-stage detection frameworks, the YOLO model formulates the detection of objects as a regression task [20], applying one convolutional neural network (CNN) to predict both bounding box coordinates and class scores simultaneously across the entire image [41], offering a streamlined alternative to traditional multi-stage detection pipelines. This enhances the efficiency of object detection and makes the YOLO algorithm a widely adopted framework for applications requiring high speed and accurate visual recognition.
In recent years, object detection has gained prominence through the adoption of deep learning approaches, particularly using CNN, to enhance both detection precision and computational performance. Prominent CNN-based object detection models include YOLOv3 [22], YOLOv5 [42], and Mask R-CNN [33]. Obstacle detection in orchards commonly relies on LiDAR [43,44,45], ultrasonic [46], infrared [47], and computer vision methods [48,49]. Chen et al. [46] integrated cameras and ultrasonic sensors with a moving average filter, achieving 93.62% recall and 98.96% accuracy in tree trunk detection. Shalal et al. [50] used low-cost color vision and laser scanning, while Freitas et al. [51] applied 3D point clustering for reliable detection of people and bins. Although laser and ultrasonic sensors offer high accuracy, their high cost limits their widespread use [52]. Computer vision offers a cost-effective alternative, especially with CNN-based methods [53]. Two-stage models like R-CNN variants [29,30,31], and one-stage models, such as YOLO [20,22] and SSD [25], are widely applied. Li et al. [54] proposed a MobileNetV2-YOLOv3 model for orchard obstacles, achieving 88.64% mAP. Integrating LiDAR with a deep learning object detection model, such as the YOLO model, offers an effective and promising solution for the accurate identification of apple trees and objects in an unstructured apple orchard environment.
A region-based CNN approach was applied by Wang et al. [55] in their study, which successfully identified individual trees from airborne LiDAR data. While their approach focused on forest environments and used R-CNN for region proposals, this study adopted YOLOv5 for faster inference and real-time detection in orchard settings with ground-based LiDAR. LiDAR sensors enable the acquisition of high-resolution three-dimensional geometric information, effectively capturing the structural characteristics of apple trees and their surrounding objects. Combined with the YOLOv5 algorithm, it provides visualization of objects and high-precision detection. This approach enhances the detection performance and processing efficiency when applied to orchard environments with complex structures. Therefore, this study aimed to identify apple trees and other objects using LiDAR and the YOLOv5 algorithm for smart orchard management.
This study integrates PCD data with a 2D deep learning framework (YOLOv5) without requiring any modifications to the original model architecture. This approach offers a practical and efficient solution for real-time object detection in apple orchards, distinguishing itself from previous studies that rely on RGB imagery alone or require custom model adaptations to process 3D data. The major contributions of this study to the existing body of knowledge are summarized below to enhance clarity and highlight the novelty of this study.
  • The proposed detection pipeline, including pre-processing and training, would optimize for deployment on resource-constrained platforms such as UAVs or mobile agricultural robots, making it suitable for real-time orchard monitoring.
  • The model was trained and validated using real-world data collected from a commercial apple orchard, accounting for occlusion, class imbalance, and visual ambiguity, which improves robustness under field conditions.
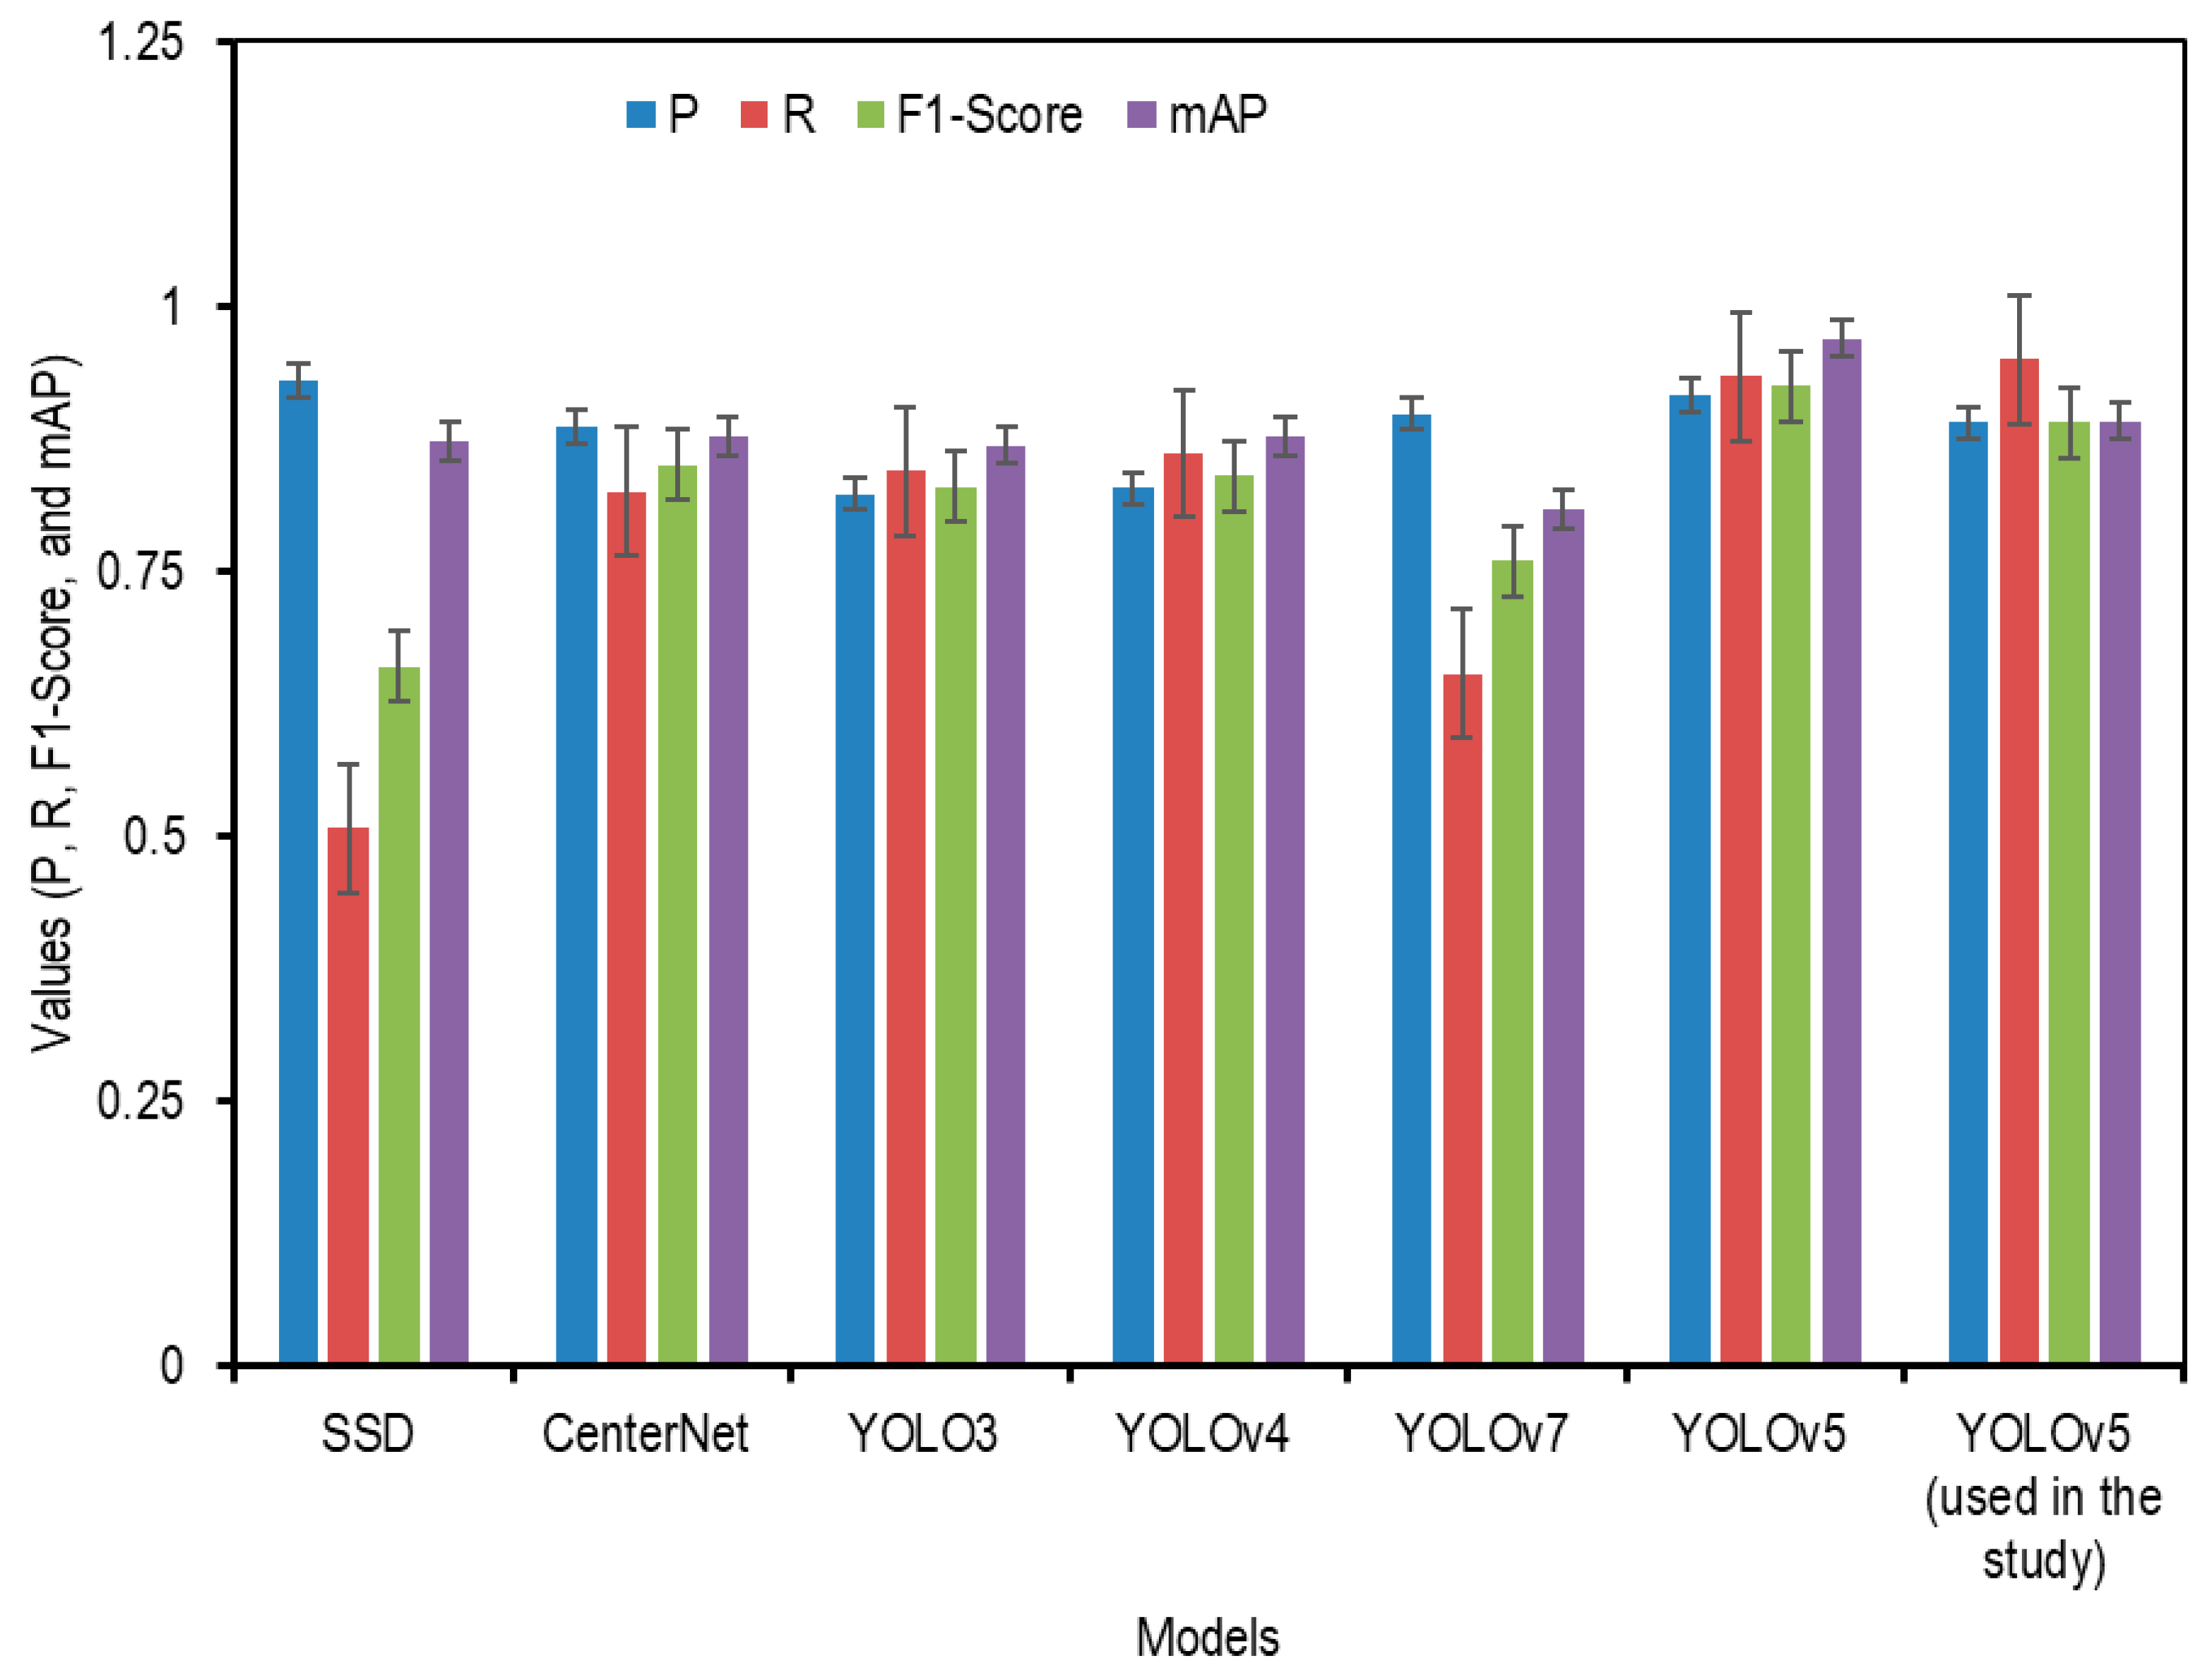
  • The study provides a performance comparison of the proposed method with other object detection models, including SSD, YOLOv3–v7, and transformer-based approaches, supporting the justification for adopting YOLOv5 in precision agriculture.
  • The findings suggest economic feasibility by reducing the manual labor and processing time. Moreover, the detection framework was shown to be scalable and transferable to other fruit orchards (e.g., pear, orange, peach, and persimmon) through minimal retraining.
The remainder of this paper is organized as follows: Section 3 presents the materials and methods, including details on the data collection site, sensor specifications, pre-processing pipeline, YOLOv5 architecture, and model training procedures. Section 4 outlines the experimental results and model performance based on multiple key indicators, such as precision, recall, mAP, and confusion matrix. Section 5 discusses the theoretical and practical implications, challenges observed during the model development, and possible improvements. This section also summarizes the findings and highlights the economic benefits, scalability of the detection framework, and potential for cross-crop applicability in other orchard environments. Finally, Section 6 concludes the study.

3. Materials and Methods

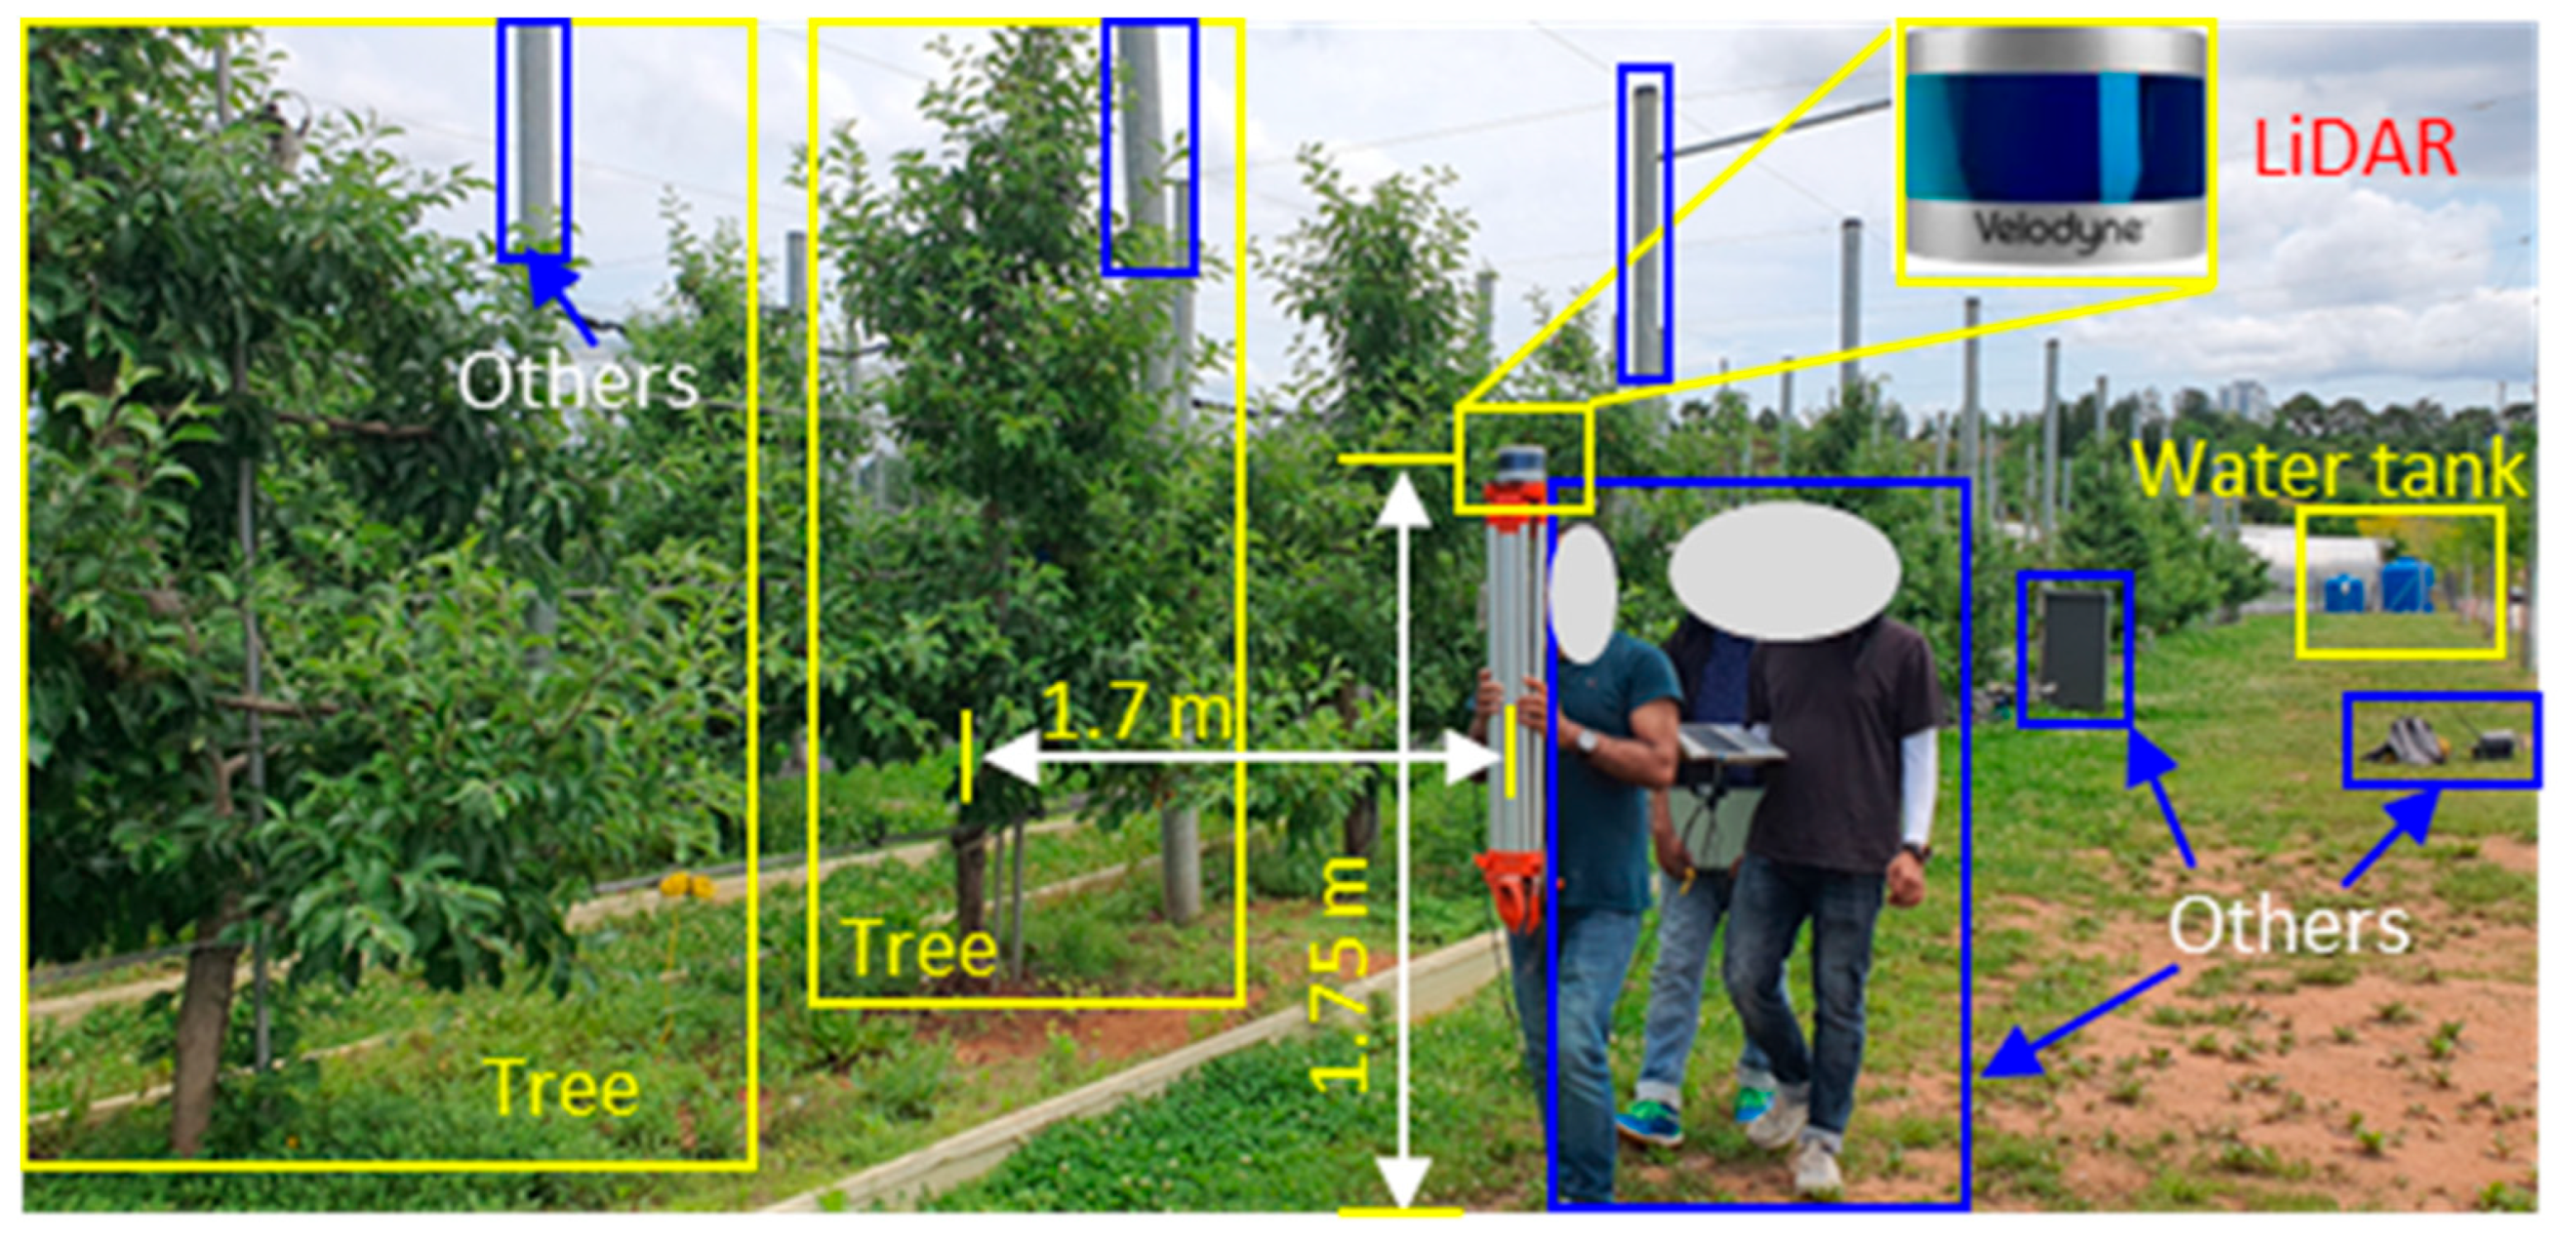
3.1. Data Collection Site

Data were collected from an apple orchard of the National Institute of Horticultural and Herbal Science (NIHHS), Rural Development Administration (RDA), Jeonju, Republic of Korea. Figure 1 shows the data collection site in the apple orchard. This site was selected for its representative horticultural conditions, providing an ideal setting to test and validate the computational performance of LiDAR sensors in identifying apple trees and other objects. The trees were planted in aligned rows, with each row consisting of 15 trees that varied in shape and size to reflect the natural diversity of the orchard. A spindle-shaped planting method was applied for the plantation of apple trees in the orchards. The trees were planted nine years earlier at the time of data collection, on 15 May 2023. The orchard soil was characterized as loamy.

3.2. Sensor Selection and Data Collection

A three-dimensional (3D) commercial LiDAR (model: VLP−16, Ouster, Inc., San Francisco, CA, USA) was used for data collection. Table 1 presents the key specifications of the LiDAR. It consists of a 100 m scanning range with low power consumption. It has a compact and lightweight design and the capability of dual return, which makes the applications of this sensor ideal in agricultural fields, such as plant and orchard tree geometric feature characterization and object detection in open field and orchard conditions. The sensor consists of 16 channels and is capable of acquiring up to 300,000 points per second in the single-return scanning mode. It provides a 360° horizontal field of view (HFOV) and a 30° vertical field of view (VFOV), featuring a ±15° tilt in the vertical direction. Although the sensor includes visible rotating components, it demonstrated long durability and stable performance across varying temperatures, delivering accurate and 3D detailed information. The LiDAR used in this study was a factory-calibrated commercial-grade unit with pre-configured intrinsic parameters to ensure accurate distance and angular measurements. Prior to the field trials, the sensor data output was validated under controlled conditions to confirm measurement reliability. Additionally, to minimize extrinsic inaccuracies due to handheld motion, the LiDAR was mounted on a tripod and operated at a consistent walking speed. Several test runs were performed before the actual data collection to verify the spatial consistency and alignment.
Data collection involved scanning the apple trees, including objects in the apple orchard, such as water tanks and concrete posts, and the visibility of humans as dynamic objects engaged with data collection for object detection. The LiDAR system was carefully configured to ensure accurate and reliable data acquisition. The setup featured LiDAR as the core device for capturing 3D spatial information. Additional components included a terminal box for managing the sensor data stream, a laptop for collection, visualization, and pre-processing, and a 12 V battery for supplying power to the entire system. For operational stability, the LiDAR was securely attached to a fixed plate on the tripods. Figure 2 presents a schematic representation of the system configuration, highlighting the integration of each component to enhance the data acquisition efficiency and overall system performance. Figure 3 illustrates the data collection of apple trees and other objects using LiDAR. According to the average tree height, the LiDAR was positioned 1.75 m above the ground, and the lateral distance from the sensor to the central axis of the tree rows was 1.7 m for side-view scanning. The collected raw data were saved in the PCAP format. The sensor was manually moved to capture the tree-side profiles during data collection. The FOV was fixed to cover the entire tree height and object classes in the orchard. The HFOV was set to 360° to capture both the left and right sides of the objects to be detected. Additionally, an external global positioning system (GPS) (model: GPS18x LVC, Garmin Ltd., Olathe, KS, USA) was integrated into the setup for accurate geolocation and synchronization of data. For data acquisition, open-source software (Veloview, Ver. 5.1.0, Kitware, Inc., Clifton Park, NY, USA) was utilized. This software enabled the real-time visualization, selection, and interpretation of LiDAR data, including distance measurements, return intensity, laser ID, return type, azimuth, time, and distance. It also offers export functions for point cloud data in CSV format, including x, y, and z coordinates. Commercially available open-source software (model: Veloview, Ver 5.1.0, Kitware, Inc., Clifton Park, NY, USA) and the programming language Python (ver. 3.11.5) were used to convert the captured data and pre-process them into usable 3D point cloud formats, respectively. The software supports the visualization, detailed analysis, and spatial measurement of data [56].
To minimize sensor-induced or environmental variability during LiDAR scanning, consistent scanning was performed. The same operator performed all scans under clear and sunny weather conditions. Meteorological data during the collection period indicated an average temperature of 19 °C (ambient), 36 °C (maximum), and 5.7 °C (minimum) when the mean relative humidity was 68% (ranging from 20% to 98%), and the average wind speed was 5.24 ms−1 (ranging from 1.10 to 10.30 ms−1) on the same day. Although formal control plots or replicates were not established, multiple scanning passes were conducted across the representative rows to ensure repeatability. Scanning was also cross-validated by comparing multiple frames from the same location. This controlled approach aimed to reduce the effects of transient environmental changes and operator variability, thereby enhancing the consistency of PCD data acquisition. Although environmental parameters, such as temperature, wind speed, and light conditions, were recorded during the data collection period, a formal statistical correlation analysis between environmental factors and LiDAR return variability or detection accuracy was not performed. However, data acquisition was conducted under stable and clear conditions within a single day to minimize environmental variation.
To ensure sampling homogeneity, tree morphological variation was statistically characterized prior to data acquisition. Structural attributes, including tree height, canopy volume, and spacing, were measured across multiple trees in each row. Descriptive metrics such as the mean, mean absolute error (MAE), standard deviation, linear coefficient of determination (r2), concordance correlation coefficient (CCC), and root mean squared error (RMSE) were computed. This facilitated the selection of representative rows with uniform geometry, thereby enhancing the model’s reliability. The sensor estimated tree height (3.05 ± 0.34 m) closely matched the measured values (3.13 ± 0.33 m), with MAE and RMSE of 0.08 m and 0.09 m, respectively, whereas r2 was 0.98 and CCC was 0.96. Canopy volume estimates (13.76 ± 2.46 m3) also aligned with ground truth (14.09 ± 2.10 m3), yielding an MAE of 0.57 m3, RMSE of 0.61 m3, and r2 = 0.97. Similarly, tree and row spacing estimates (3.04 ± 0.17 m and 3.35 ± 0.08 m) exhibited strong agreement with measured distances (3.18 ± 0.24 m and 3.40 ± 0.05 m), supported by RMSE values of 0.12 m and 0.07 m, and r2 values of 0.92 and 0.94, respectively. These results confirm the high accuracy and consistency of the sensor-estimated morphological measurements under controlled sampling conditions.
Several control measures were implemented to minimize motion-induced distortion and positional drift during handheld LiDAR scanning. The LiDAR was mounted on a rigid tripod and carried at a consistent walking speed to ensure uniform scanning. The scanning trajectory was linear and parallel to the tree rows, thereby reducing angular deviations. During data collection, redundant scanning passes were performed over the same sections to assess repeatability. Furthermore, during pre-processing, frames with noticeable motion artifacts were excluded using point cloud consistency checks.

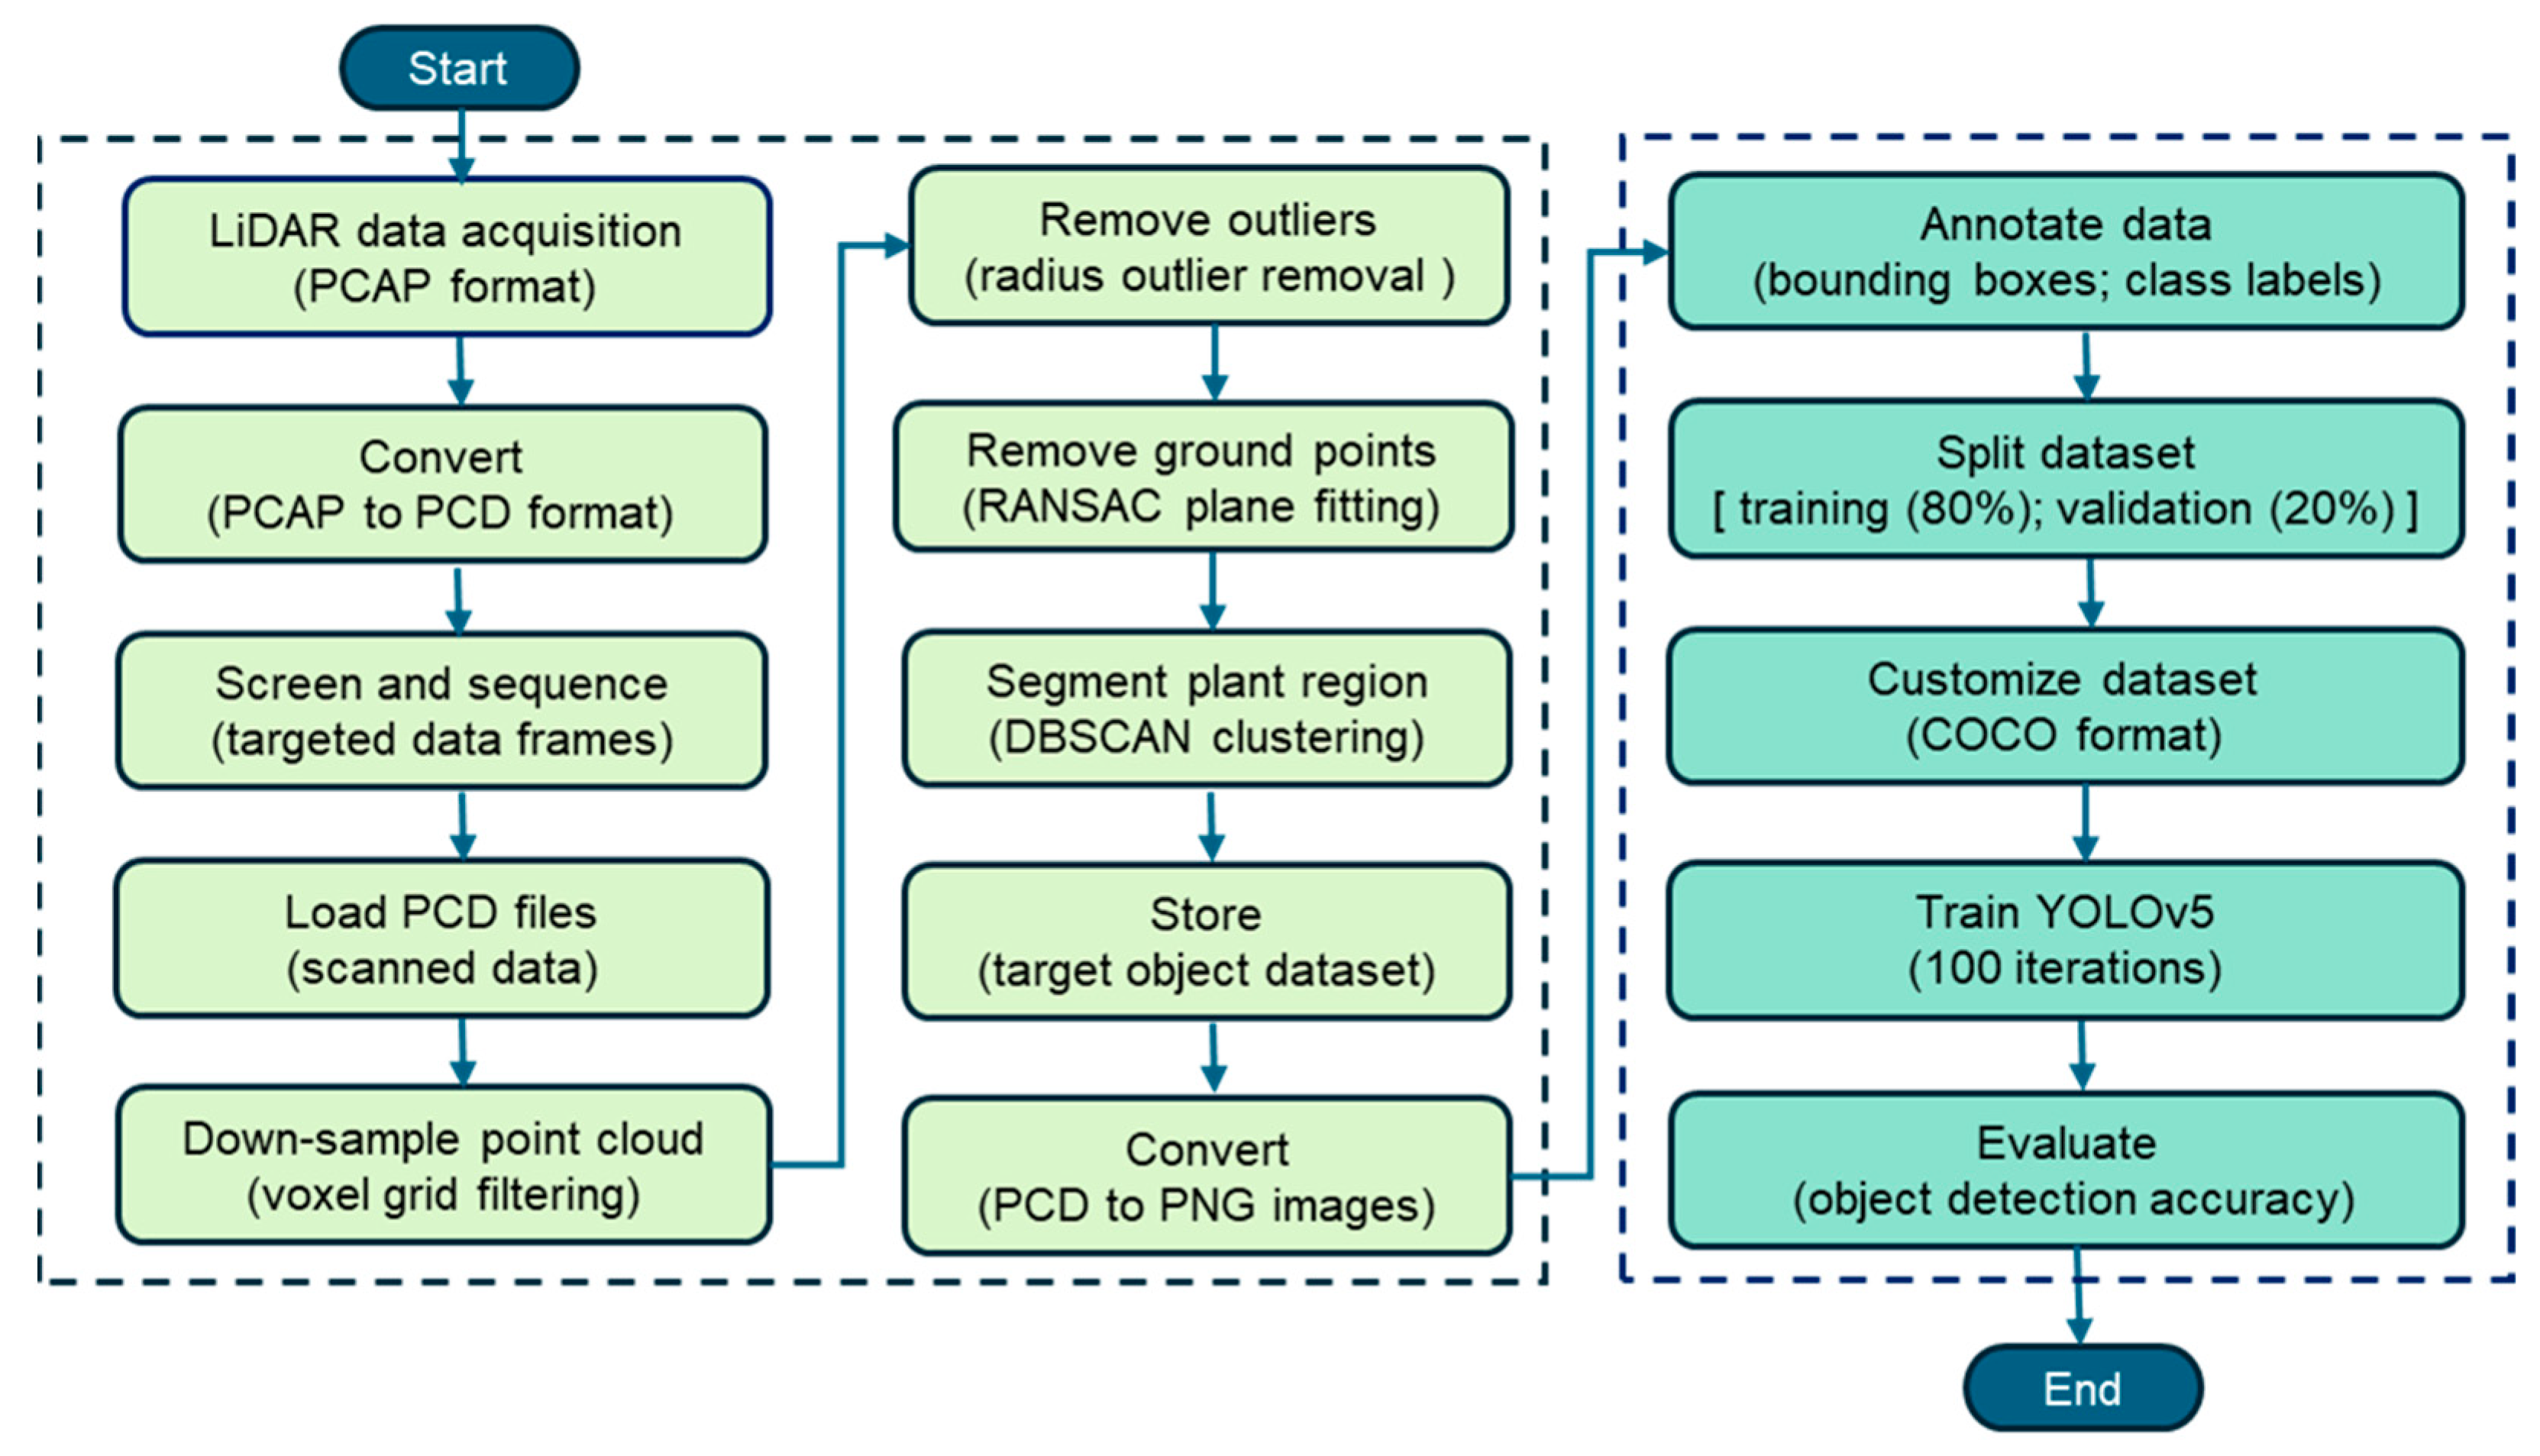
3.3. Data Pre-Processing Procedure
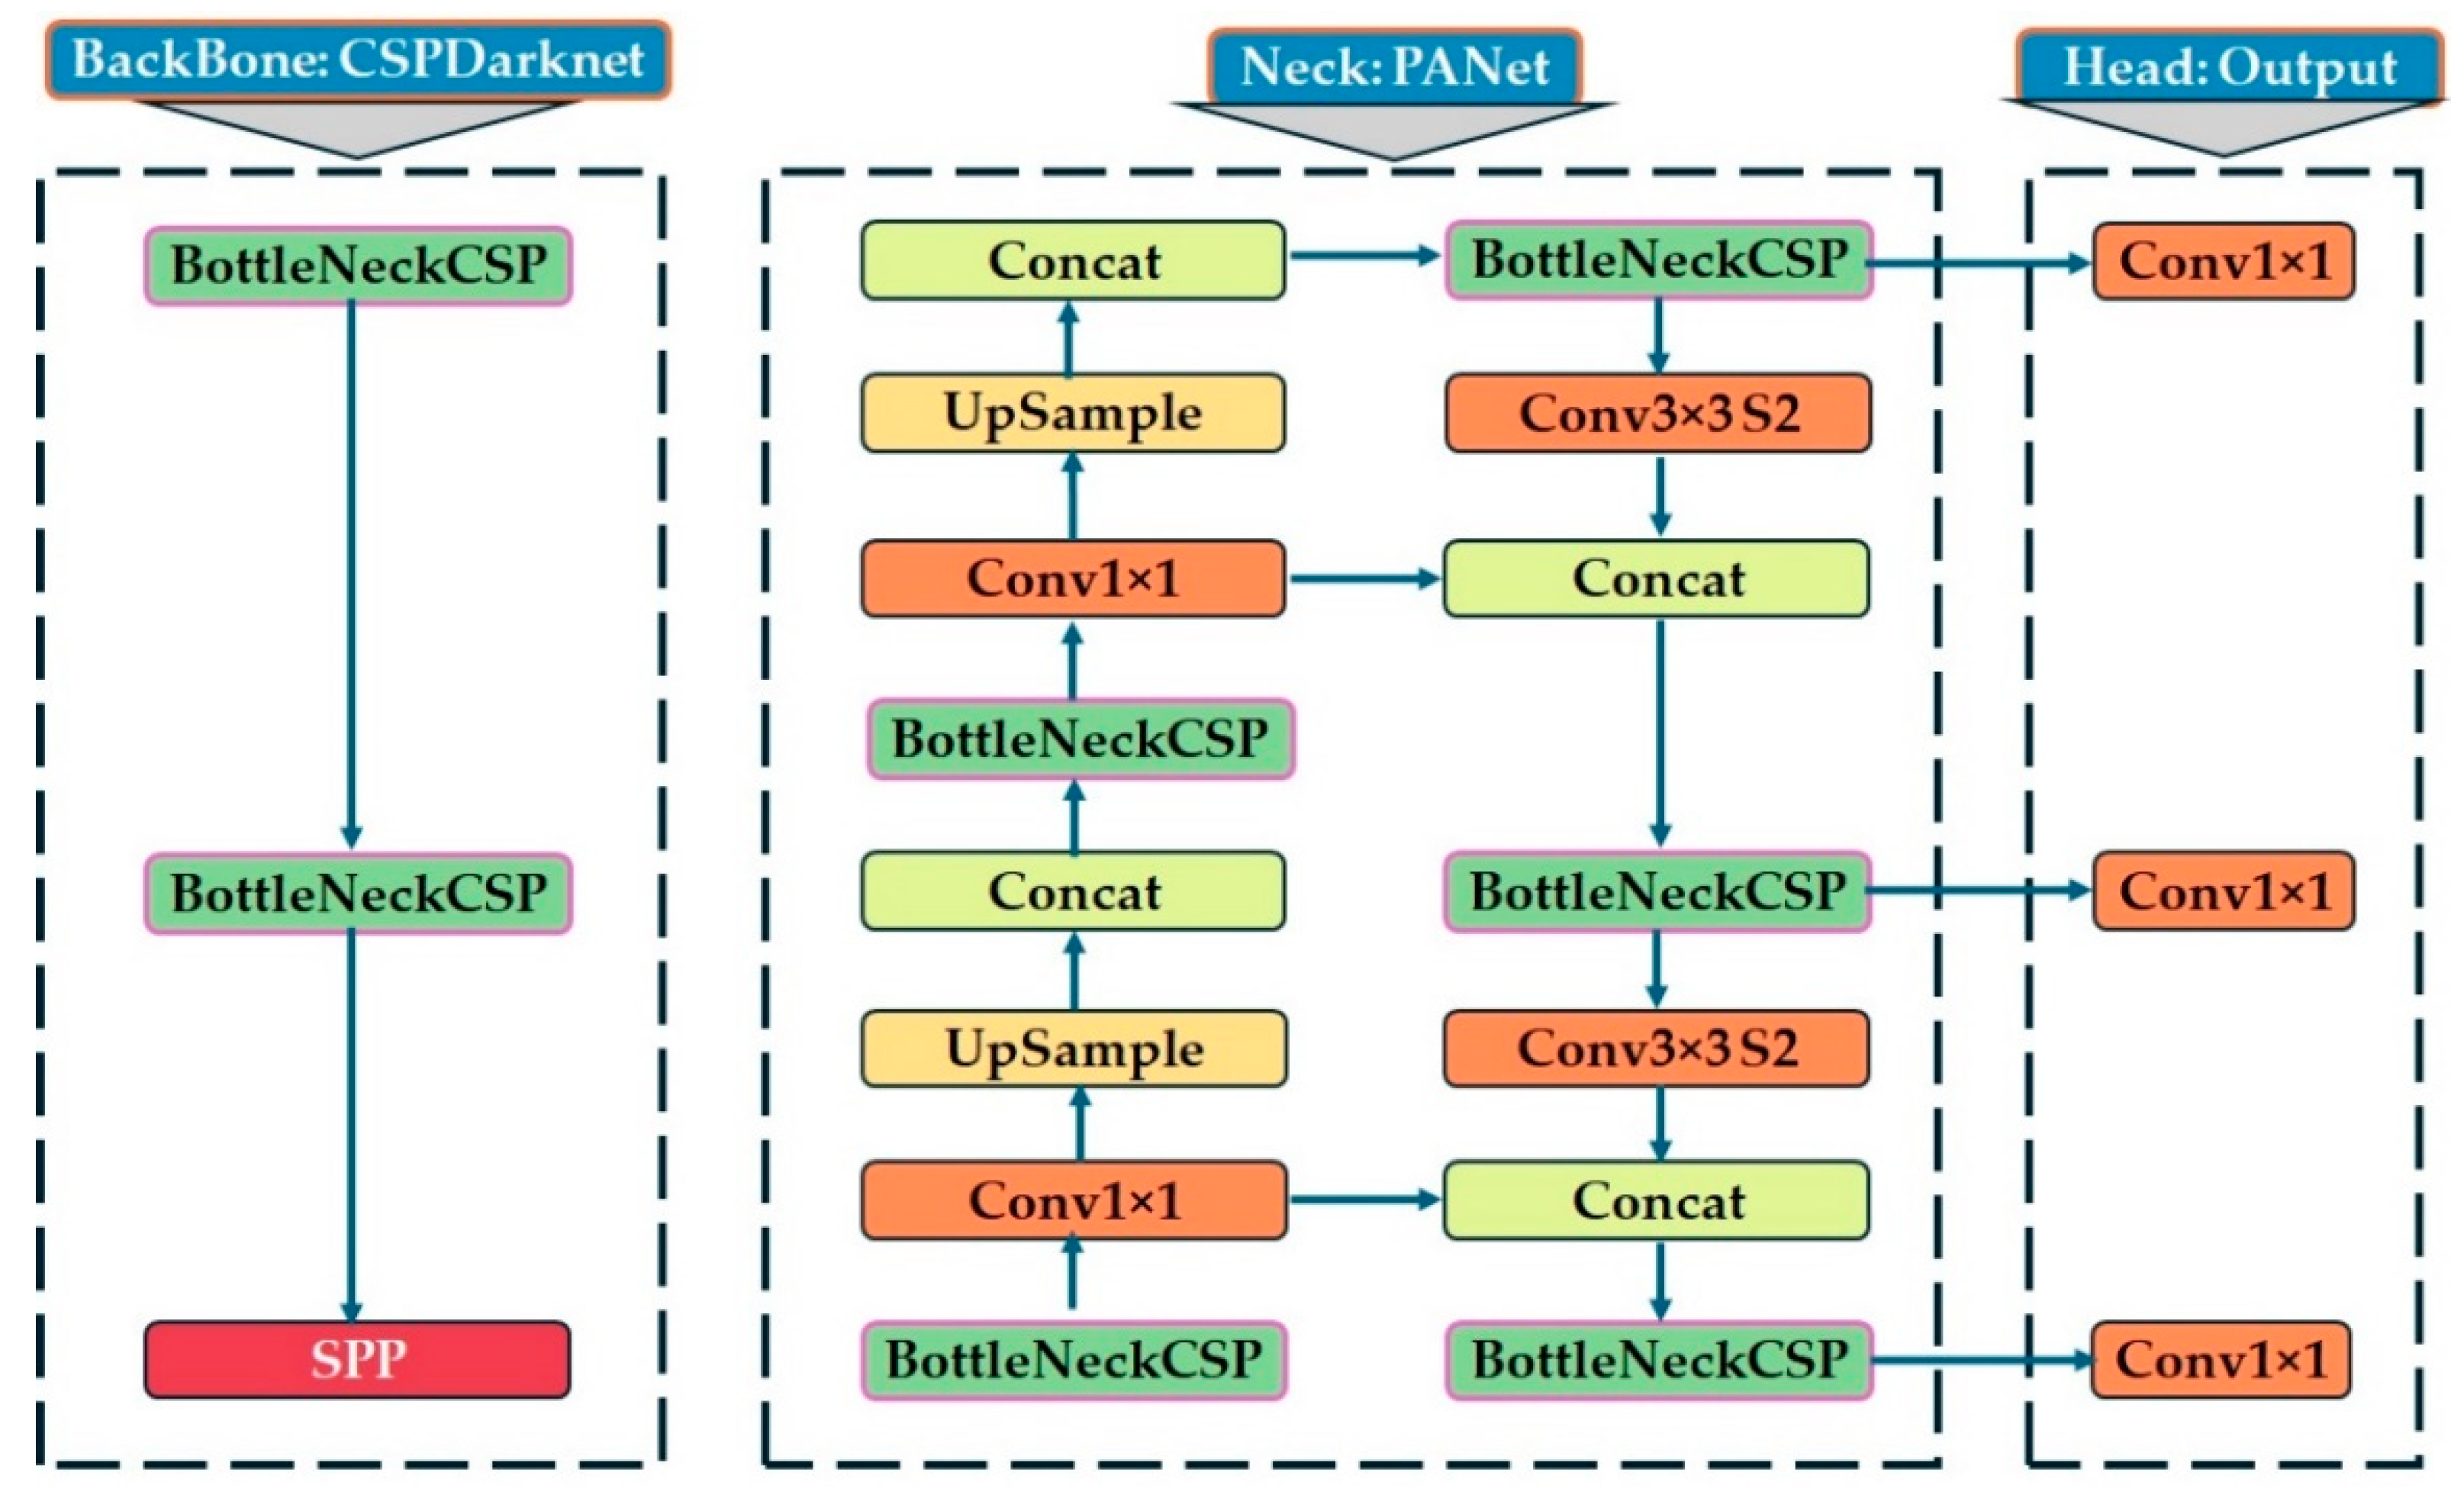
The data acquisition and point cloud (PCD) pre-processing pipeline integrated LiDAR data collection, pre-processing, segmentation, and object detection based on deep learning using the YOLOv5 algorithm, as shown in Figure 4. In the first section of Figure 4 (left side). The pre-processing pipeline began with LiDAR data acquisition in the PCAP format to capture the spatial structure of the orchard, followed by conversion to the PCD format for compatibility with point cloud pre-processing tools. The raw point cloud data were organized into data frames, each representing 3D information captured from specific viewpoints. Targeted frames containing apple trees, water tanks, and other relevant objects were screened and selected to ensure comprehensive spatial coverage. These frames were then loaded and downsampled using voxel grid filtering to reduce the point density while maintaining the essential structural features. A voxel grid filter with a resolution of 0.01 m was applied to downsample point cloud data. This resolution was empirically chosen to retain the fine geometric features while reducing redundant points for efficient processing. Denoising of points was performed by applying outlier removal techniques that deviated from their local neighborhood, and random sample consensus (RANSAC) plane fitting was used to remove ground points and isolate aboveground objects. The density-based spatial clustering of applications with noise (DBSCAN) segmented the remaining non-ground points to extract plant regions, which were stored as the target object dataset. The DBSCAN parameters used in this study were epsilon (ε) of 0.5 and minPts (minimum samples) of 10, selected empirically from initial testing on the two selected orchard rows. Although the dataset consisted of only two rows, these values were tuned by visually inspecting the clustering results in the (x, y) plane after downsampling and radius outlier removal. The selected parameters reliably distinguished the tree-row clusters without merging adjacent structures or producing excessive noise. This tuning ensured consistency in the tree segmentation throughout the pre-processing. A ground sampling step further refined the data by focusing on the most representative point. Finally, the pre-processed 3D PCD data were converted into PNG images to enable 2D object detection in subsequent training.
To address the presence of dynamic objects (e.g., people and windblown vegetation), frames exhibiting irregular point cloud patterns or abrupt density fluctuations were screened and excluded during the pre-processing step. Furthermore, dynamic objects, such as people appearing during scanning, were manually labeled under a distinct ‘others’ class to ensure that they were not misclassified and maintained model reliability. Each PNG image was annotated with bounding boxes and class labels (e.g., trees, water tanks, and others), as shown in the second section of Figure 4 (right side). The annotated dataset was then divided into two subsets, allocating 80% for training and 20% for validation to facilitate supervised learning. To ensure compatibility with the YOLOv5 model, the dataset was formatted using the COCO structure. Subsequently, YOLOv5 was trained for 100 iterations using the annotated images. Finally, the trained model was evaluated for object detection accuracy using metrics such as precision, recall, mAP@0.5, and mAP@0.5:0.95, allowing for a thorough performance evaluation of the detection.

3.4. YOLOv5 Model

YOLOv5 [57], developed in 2020 by Ultralytics, represents an advancement of PyTorch (ver. v7.0) in the YOLO architecture. To improve anchor box optimization, it incorporates the AutoAnchor module, which utilizes a genetic algorithm and k-means clustering [58]. Built on an enhanced CSPDarknet53 backbone, YOLOv5 integrates a layer of fast spatial pyramid pooling (SPPF) to improve computational efficiency. Training stability and performance can be further enhanced using mosaic and mixing techniques [59]. The YOLOv5 model architecture was used to detect trees and other object classes in an apple orchard using the YOLOv5 algorithm and LiDAR PCD data, as presented in Figure 5. YOLOv5 is a cutting-edge model designed for high-performance object detection tasks [60], which has advanced from YOLOv1 to YOLOv4 through continuous improvements, achieving top performance on two object detection datasets, including Pascal visual object classes (Pascal VOC) [61] and Microsoft common objects in context (COCO) [62]. The architecture consists of three main components: the backbone (CSPDarknet), neck (PANet), and head (output convolutional layer). The backbone is responsible for feature extraction using a cross-stage partial network (CSPNet) [63], which mitigates redundant gradient information in deep networks, integrates gradient transitions into the feature map, and ultimately reduces computational complexity, parameters, and floating-point operations per second (FLOPS). These enhancements ensure a high inference speed and accuracy while maintaining a compact model size, making YOLOv5 well-suited for plant and object detection in agricultural applications.
The neck (PANet) facilitates feature fusion by implementing a path aggregation network (PANet) [64]. Additionally, the spatial pyramid pooling (SPP) module expands the receptive field, enabling the detection of objects at multiple scales. The PANet neck facilitates feature fusion by upsampling and concatenating features from deeper layers, thereby preserving spatial information and improving small-object detection. This structure follows top-down and bottom-up pathways, ensuring efficient information flow across different feature scales. Key operations in the neck module include Conv1×1 layers for channel reduction, upsample layers for resolution enhancement, and concatenation functions (Concat) for multi-scale feature aggregation. The detection head is responsible for predicting the bounding boxes, object confidence scores, and class probabilities. It generates three different feature map sizes with three different spatial resolutions for multi-scale object detection, ensuring that the model can accurately detect small, medium, and large objects in the apple orchard. Prediction refinement was performed using BottleNeckCSP layers, followed by Conv1×1 layers for final output generation. YOLOv5 uses an anchor-based detection approach, predicting bounding boxes relative to predefined anchor boxes, and further improves detection precision. Additionally, the spatial pyramid pooling (SPP) module expands the open field, enabling the model to effectively scan objects of variable sizes. The integration of the cross-stage partial network (CSPDarknet), path aggregation network (PANet), and spatial pyramid pooling (SPP) modules ensures that YOLOv5 can efficiently detect vegetation and other objects in the orchard, even in complex environments with varying object scales and background textures. These combined components enable accurate object detection, making YOLOv5 highly effective for the detection of apple trees and other existing objects obtained through object classification in an apple orchard using PNG-format images converted from LiDAR point cloud data.
The YOLOv5 object detection framework formulates the detection task as a regression problem, predicting the bounding box coordinates, object confidence scores, and class probabilities simultaneously for each grid cell over the input image [65,66,67]. The total loss function used during training is a weighted sum of three components.
L t = λ b · L b + λ o · L o + λ c · L c
To calculate the bounding box loss, complete intersection over union (CIoU) for bounding box regression is used in YOLOv5 approaches.
L b = 1 C I o U ( b , b ^ )
C I o U = I o U p a 2 ( b , b ^ ) l 2 r i
The objectness score indicates whether an object exists in a predicted box, as shown in Equation (4).
L o = B C E ( p o , p ^ o )
YOLOv5 uses one-hot encoded class vectors and applies BCE loss for multi-label classification.
L c = c = 1 c B C E ( p c , p ^ c )
where L t , L b , L o , L c , and λ indicates the total loss function, bounding box regression loss, objectness loss, classification loss, and weighting factors, respectively, for balancing the loss components. b and b ^ represent the predicted and ground-truth box, respectively. Pa, l, r, i refers to the Euclidean distance between the center points and diagonal length of the smallest enclosing box, measures aspect ratio similarity, and balances the influence of r. po indicates the predicted objectness score and p ^ o { 0,1 } is the ground truth. C, p c ,   a n d   p ^ c refers to the number of object classes, predicted probability for class C, and ground-truth label (0 or 1), respectively.

3.5. Model Performance Matrices

YOLOv5 model object detection performance was evaluated using standard classification metrics, such as accuracy, precision (P), recall (R), mean average precision (mAP), and F1-score. Precision quantifies the proportion of identified objects relevant to the total number of predicted objects, while recall measures the percentage of correctly identified objects out of the total number of ground truth instances. The mAP evaluates the detection accuracy of the model by calculating the average precision across all categories, considering predictions with an intersection over union (IoU) greater than 50% to be correct detections. A higher mAP value indicates improved detection performance and higher prediction reliability. These metrics are calculated using Equations (6)–(10) [18,68,69].
A c c u r a c y = T P + T N T P + T N + F P + F N
P = T P + T N T P + F P
R = T P + T N T P + F N
F 1 - s c o r e = 2 × P × R P + R
m A P = 1 n k = 1 n A P k
where TP is the number of true positives, TN is the number of true negatives, FP is the number of false positives, FN is the number of false negatives, APk is the average precision (AP) for class k, and n represents the number of thresholds used to calculate the mAP.

3.6. Dataset Preparation and Training Process

To prepare a training dataset for the YOLOv5 algorithm, 1500 PNG format images were utilized, the objects were labeled using bounding boxes, and the data were organized in the correct format that specifies the image paths, class labels, and train/validation splits. The process involved an open-source online annotation platform [70] to manually draw bounding boxes around each object for labeling images to streamline the labeling and export the data in the required YOLOv5 model-compatible format. All annotations were completed by a single trained annotator to ensure consistency and eliminate inter-annotator variability. A subset of annotated images was visually reviewed to verify the label accuracy and box alignment. This procedure helped maintain annotation quality and consistency throughout the training dataset. After annotation, a unique class label was assigned to each object type that needed to be detected. The data were split into training (80%) and validation (20%) datasets for the model, which follows a widely accepted practice in deep-learning-based object detection studies. This split ensures that the model has sufficient data to learn generalizable features while retaining a meaningful portion to evaluate the performance of unseen data. The 50:50 split was not adopted in this study, as reducing the training set to 50% (750 images) could limit the ability of the model to learn robust feature representations, particularly in a relatively small dataset of 1500 images. A smaller training set may lead to underfitting, reduced classification accuracy, and unstable performance across all classes [71].
The COCO annotation format uses a single JSON file containing image metadata, category definitions, and bounding box annotations with absolute coordinates (x, y, width, height) [62]. It supports detailed object detection and segmentation tasks across large datasets. In contrast, the YOLO format assigns each image a .txt file containing class ID and normalized bounding box values, which are expressed in a normalized format relative to the image dimensions, such as x c e n t e r i m a g e w i d t h , y c e n t e r i m a g e h e i g h t , b o x w i d t h i m a g e w i d t h , b o x h e i g h t i m a g e h e i g h t , This normalization allows for consistent annotations across varying input resolutions, enhancing model scalability and efficiency [6]. An extra file is required to map the class IDs to the class names. Figure 6 shows the overall dataset preparation for the training, validation, and object detection procedures followed in this study.
Figure 7a shows a bar chart representing the total number of labeled instances across the entire dataset (training and validation). Trees had over 2000 instances, water tanks had around 1000 instances, and other object instances had around 500. The total number of instances was around 3500 labeled objects across all images, creating a class imbalance. This may lead to higher accuracy for trees but more errors in the other categories because highly imbalanced datasets present significant challenges, as most learning algorithms tend to favor the majority class, often leading to poor performance in minority classes [72]. The scatter plots show the object size distribution. Most of the detected objects had consistent widths and heights, which helped the model to learn the object features effectively. In Figure 7b, the left scatter plot shows a common placement pattern, while the right scatter plot in Figure 7c confirms that most bounding boxes are similar in size.
The model was trained using a set of manually annotated data containing images with ground-truth bounding boxes and class labels for three object categories: trees (label 0, red), water tanks (label 1, salmon color box), and others (label 2, orange color box). Annotations were formatted for YOLOv5 and included in the corresponding. txt file of each image. The pre-processing involved image resizing, contrast and brightness adjustments, and object scale normalization. Data augmentation, like cropping and flipping, was applied to enhance generalization and reduce overfitting. The model optimizes the performance through classification, objectness, and bounding box regression losses by comparing the predictions with the ground truth. Figure 8 shows the annotated dataset used for supervised training, which enabled YOLOv5 to learn spatial and visual patterns under varying field conditions, including occlusions.
The validation dataset is crucial for assessing the YOLOv5 model performance in object detection, contributing to accuracy and robustness. The performance was evaluated over the training and validation datasets. Figure 9 shows the dataset for object detection using the YOLOv5 model through training and validation. The pre-processed images were formatted to align with the input requirements of YOLOv5 to ensure consistency with the training data. Extracted from point cloud data, such as those obtained through LiDAR sensing, the dataset contained color-coded objects representing trees, water tanks, and others. The bounding boxes and ground truth labels of the dataset allowed for the direct measurement of performance through precision, recall, F1-score, and mean average precision (mAP). As a structured benchmark, it ensured evaluation, which helped to identify misclassifications and detection performance.

4. Results

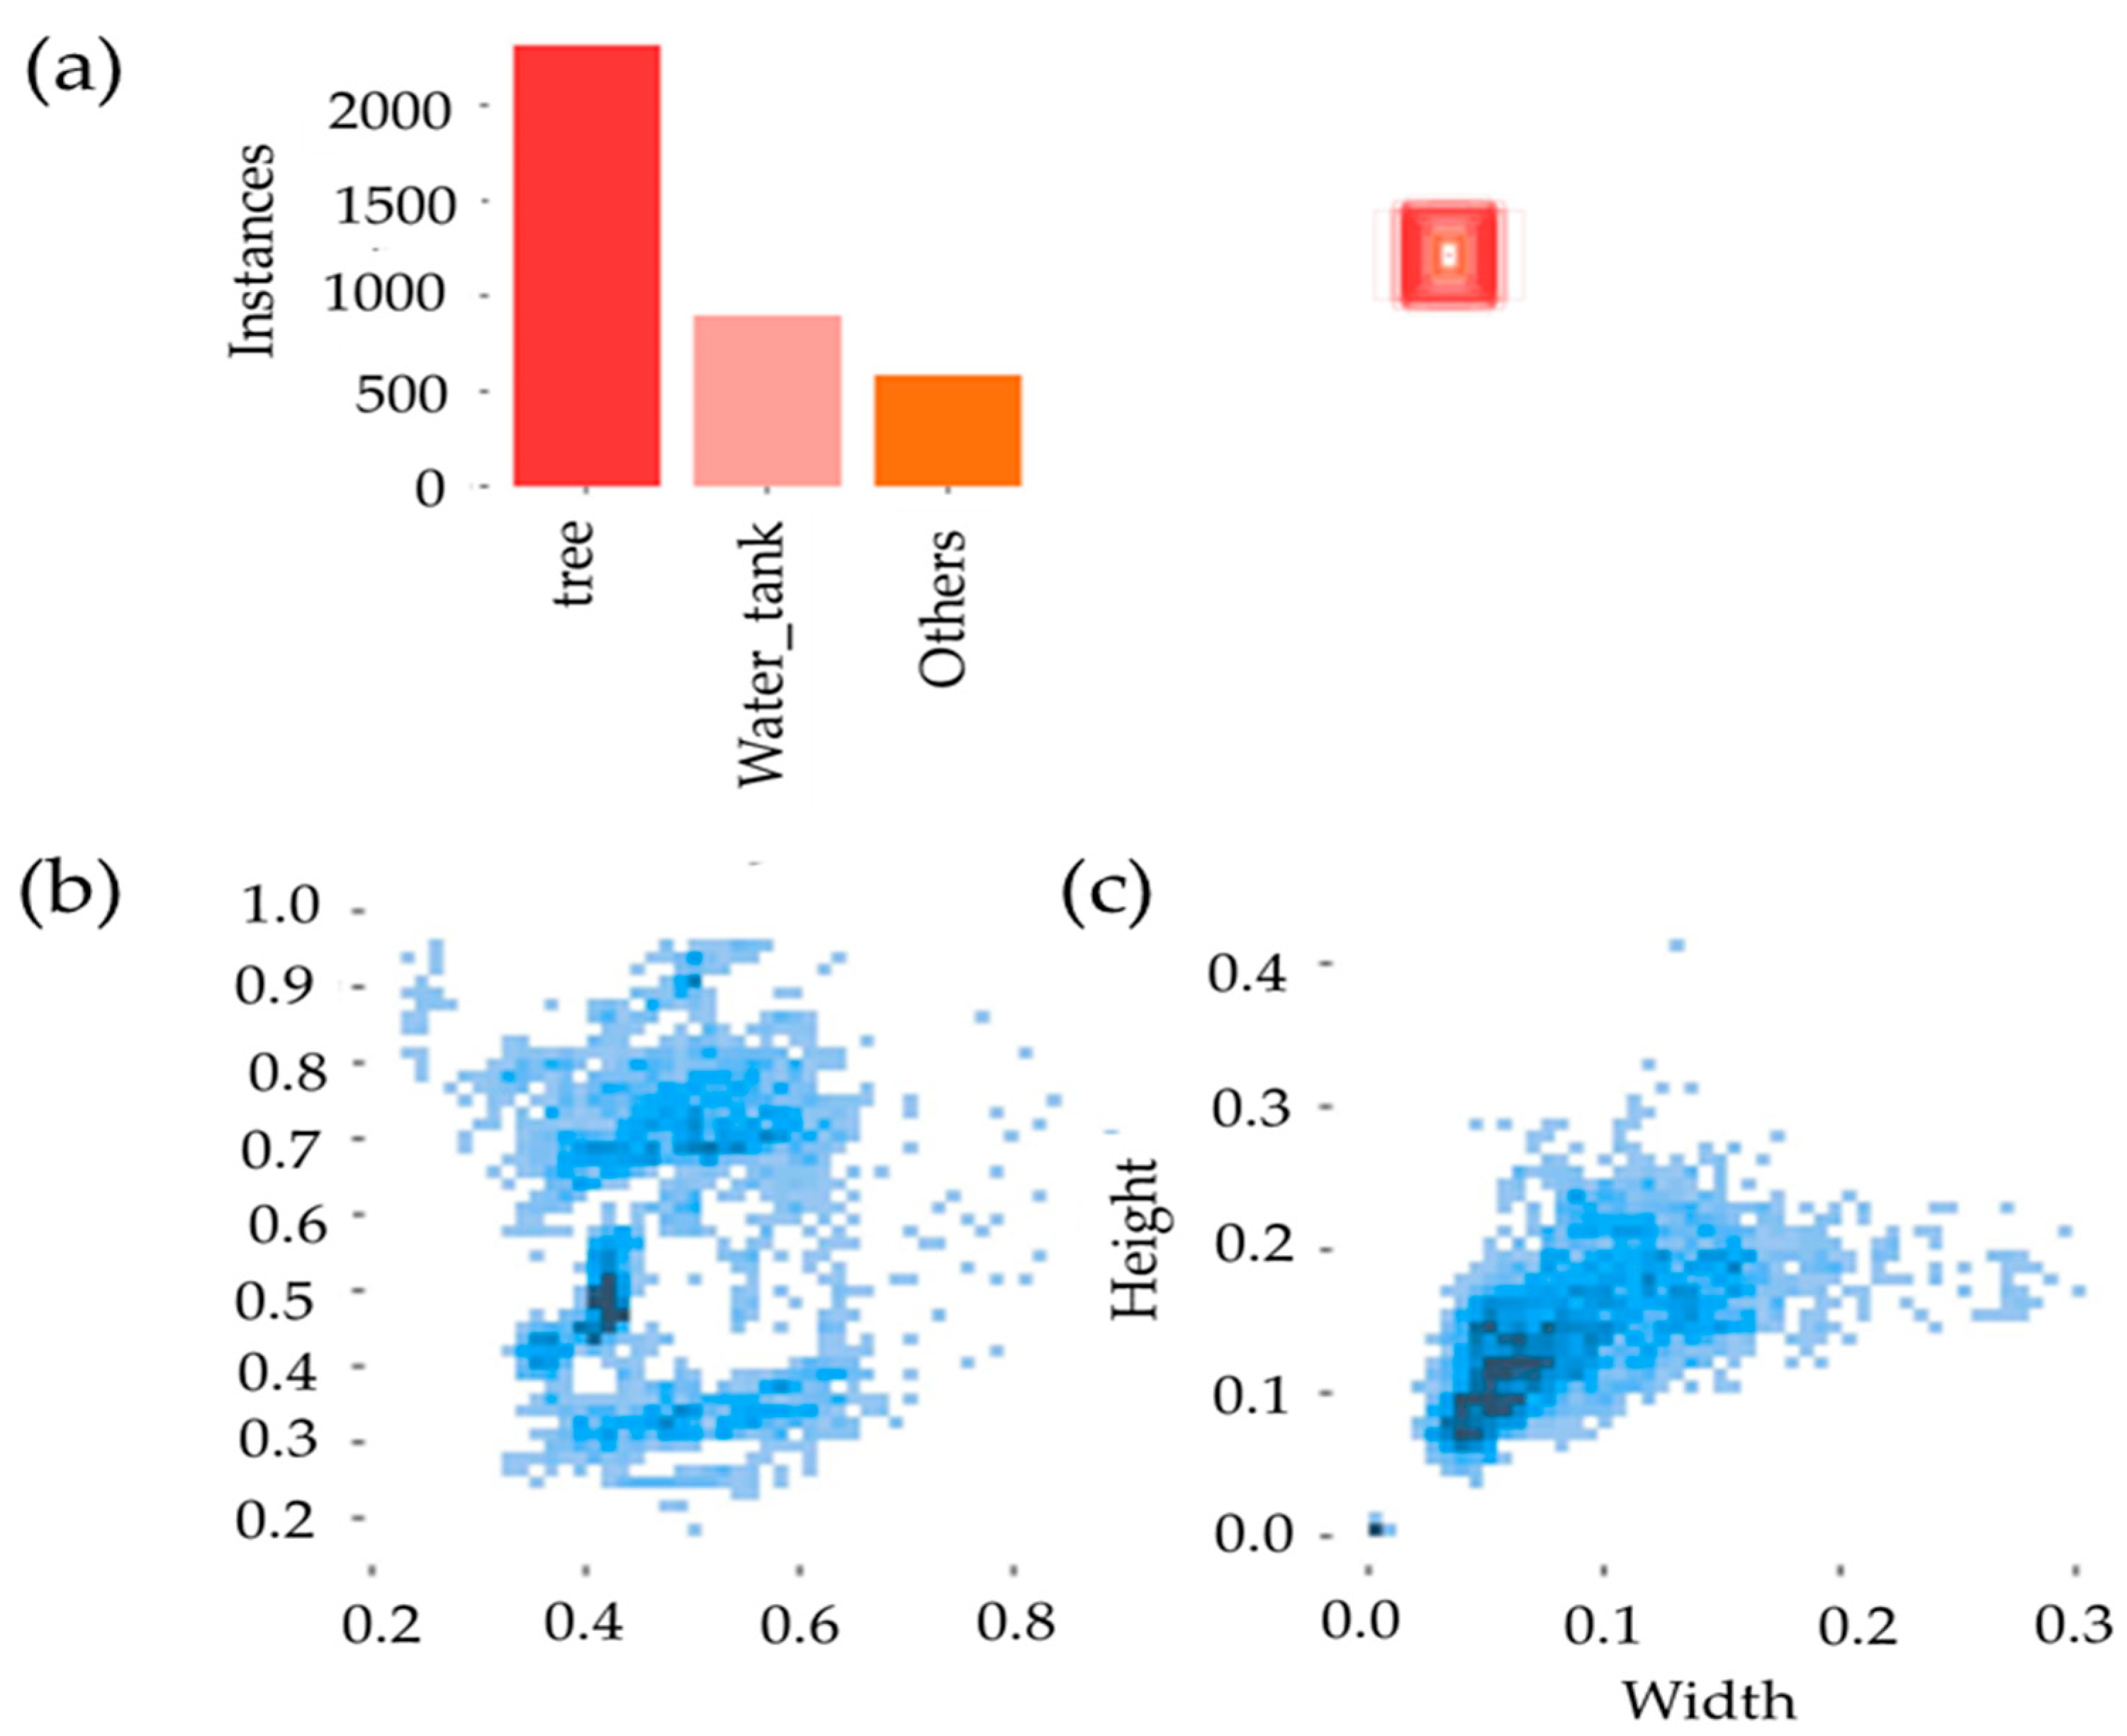
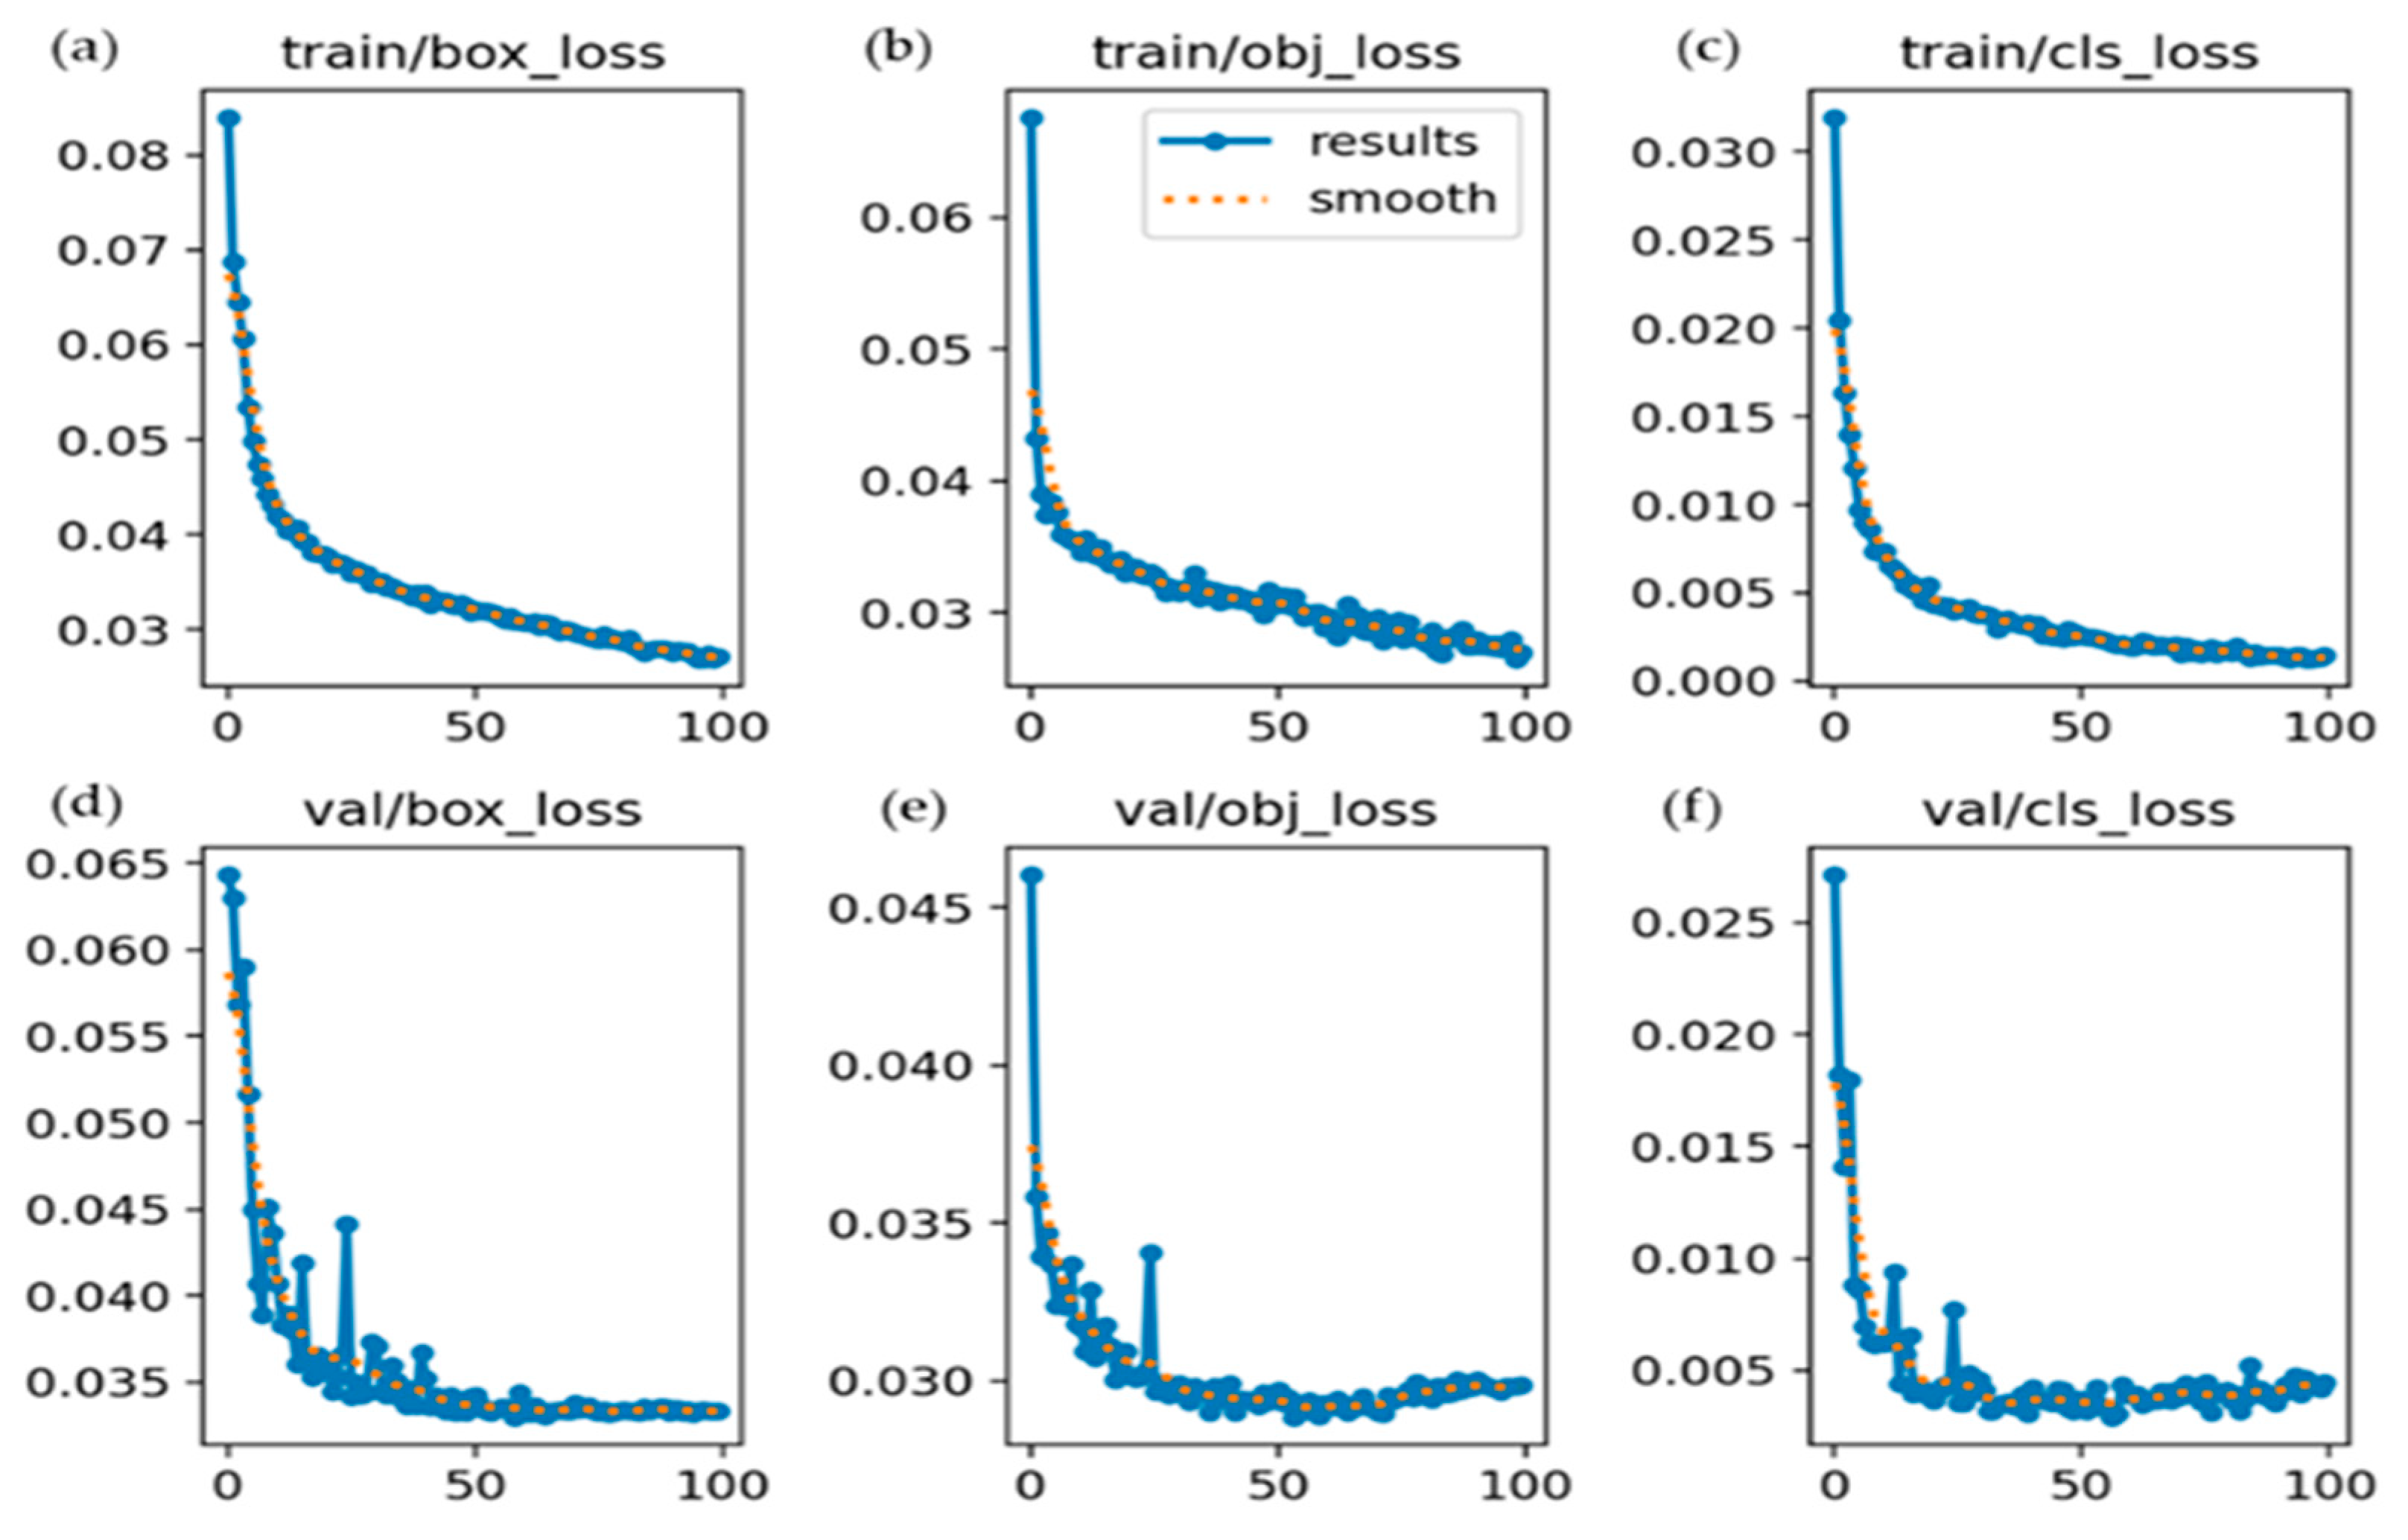
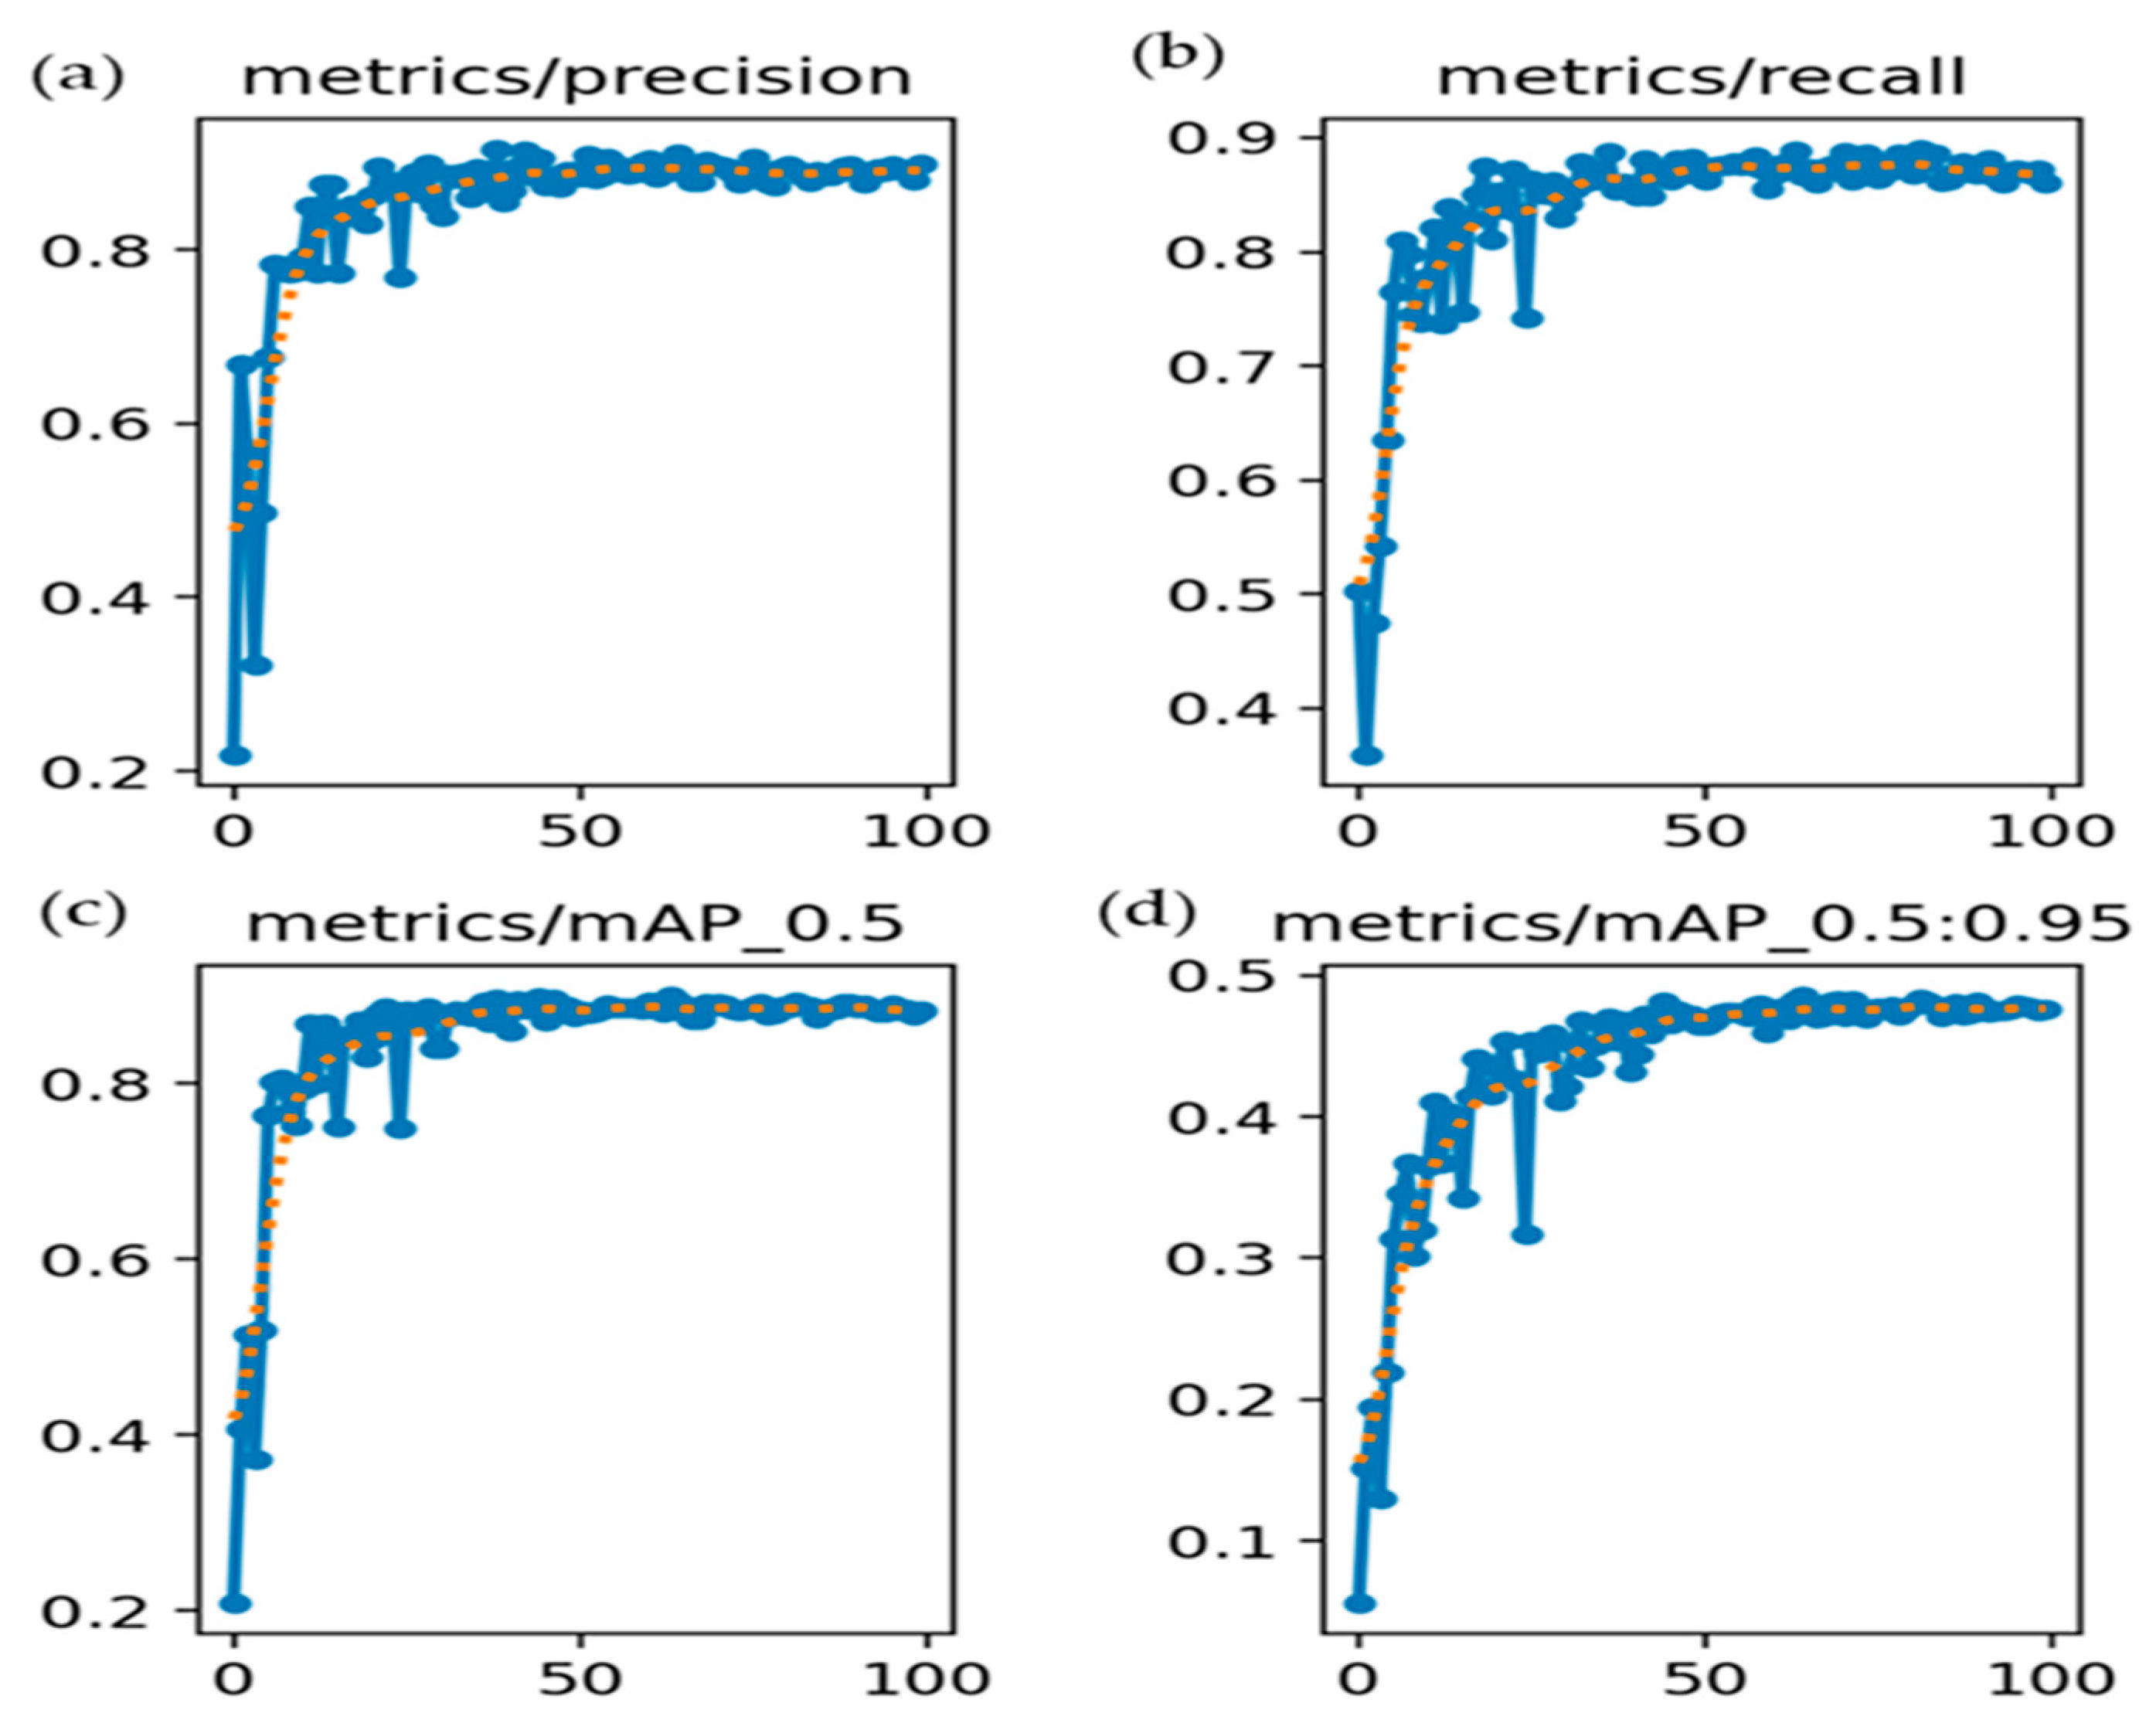
4.1. Training Outputs on Key Performance Indicators

Table 2 illustrates the main performance indicators of the YOLOv5 model at 100 epochs, summarizing both the training loss values and the validation performance metrics. The key metrics included graphical processing unit (GPU) memory usage, loss values, dataset size, and accuracy measures. The training progress summary indicates that 100 epochs were performed to train the model. In loss functions, the loss values indicate how well the model learns. Box loss (0.025) measures the error in predicted bounding box coordinates where a lower value indicates better localization of objects. The objectness loss (obj_loss) (0.028) quantified the confidence in object detection, where a lower value indicated that the model was better at distinguishing objects from the background. Additionally, the classification loss (cls_loss = 0.001) indicated how well the model classified the detected objects into their correct categories. The very low classification loss suggested that the model accurately identified the object classes. Table 2 also provides dataset information regarding parameters such as size, images, and instances. Size (1216 × 1216) indicates the resolution of the input image used for training, whereas a larger size typically improves accuracy but requires more computational power.
The 300 images represented the total number of images utilized for validation, while 949 instances indicated the total number of labeled objects across those validation images. The final model performance is summarized in Table 2, showing high precision (90.3%) and recall (87.1%), indicating accurate detection with a balanced rate of false positives and negatives. A strong mAP@50 of 89.2% was achieved by the model, reflecting reliable object detection at a 50% IoU threshold. A low classification loss (0.001) further supported the effectiveness of the model. However, the lower mAP@50–95 score (47.8%) suggests reduced accuracy with stricter localization requirements. Overall, the model demonstrated robust performance, although further improvements, such as parameter tuning, dataset expansion, or higher input resolution, may enhance detection under more challenging conditions. The loss progression curves for both the training and validation of the YOLOv5 model across all 100 epochs are depicted in Figure 10. The figure shows that all loss components decreased steadily and converged smoothly, indicating stable model optimization and minimal risk of overfitting. The alignment between the training and validation losses suggests a good generalization performance across the dataset.
Figure 11 illustrates the evolution of four key evaluation metrics, namely P, R, mAP@0.5, and mAP@0.5:0.95, over the course of 100 training epochs for the YOLOv5 model. As shown in Figure 11a, the precision curve exhibited early instability, followed by a rapid ascent, ultimately plateauing near 0.90. This reflects the increasing ability of the model to minimize false positives and generate reliable detections. In Figure 11b, recall improves markedly from an initial value of approximately 0.35 to nearly 0.90, indicating enhanced sensitivity and a reduction in false negatives as the training progresses. The mAP@0.5 curve in Figure 11c shows a consistent upward trend, reaching approximately 0.90, which signifies effective object localization and classification at a 50% Intersection over Union (IoU) threshold. In contrast, the mAP@0.5:0.95 curve in Figure 11d increased more gradually and converged around 0.48. This metric, which is more stringent, highlights the moderate performance of the model in achieving precise localization across a range of IoU thresholds. Collectively, these trends suggest that the model underwent stable optimization and achieved a strong generalization performance. However, the relatively lower mAP@0.5:0.95 underscores the need for further refinement in bounding box regression or anchor box tuning to enhance the localization precision under stricter evaluation criteria. However, some scattered points suggest misclassification or variations in object size. Adjusting the anchor boxes or using data augmentation may help improve performance.

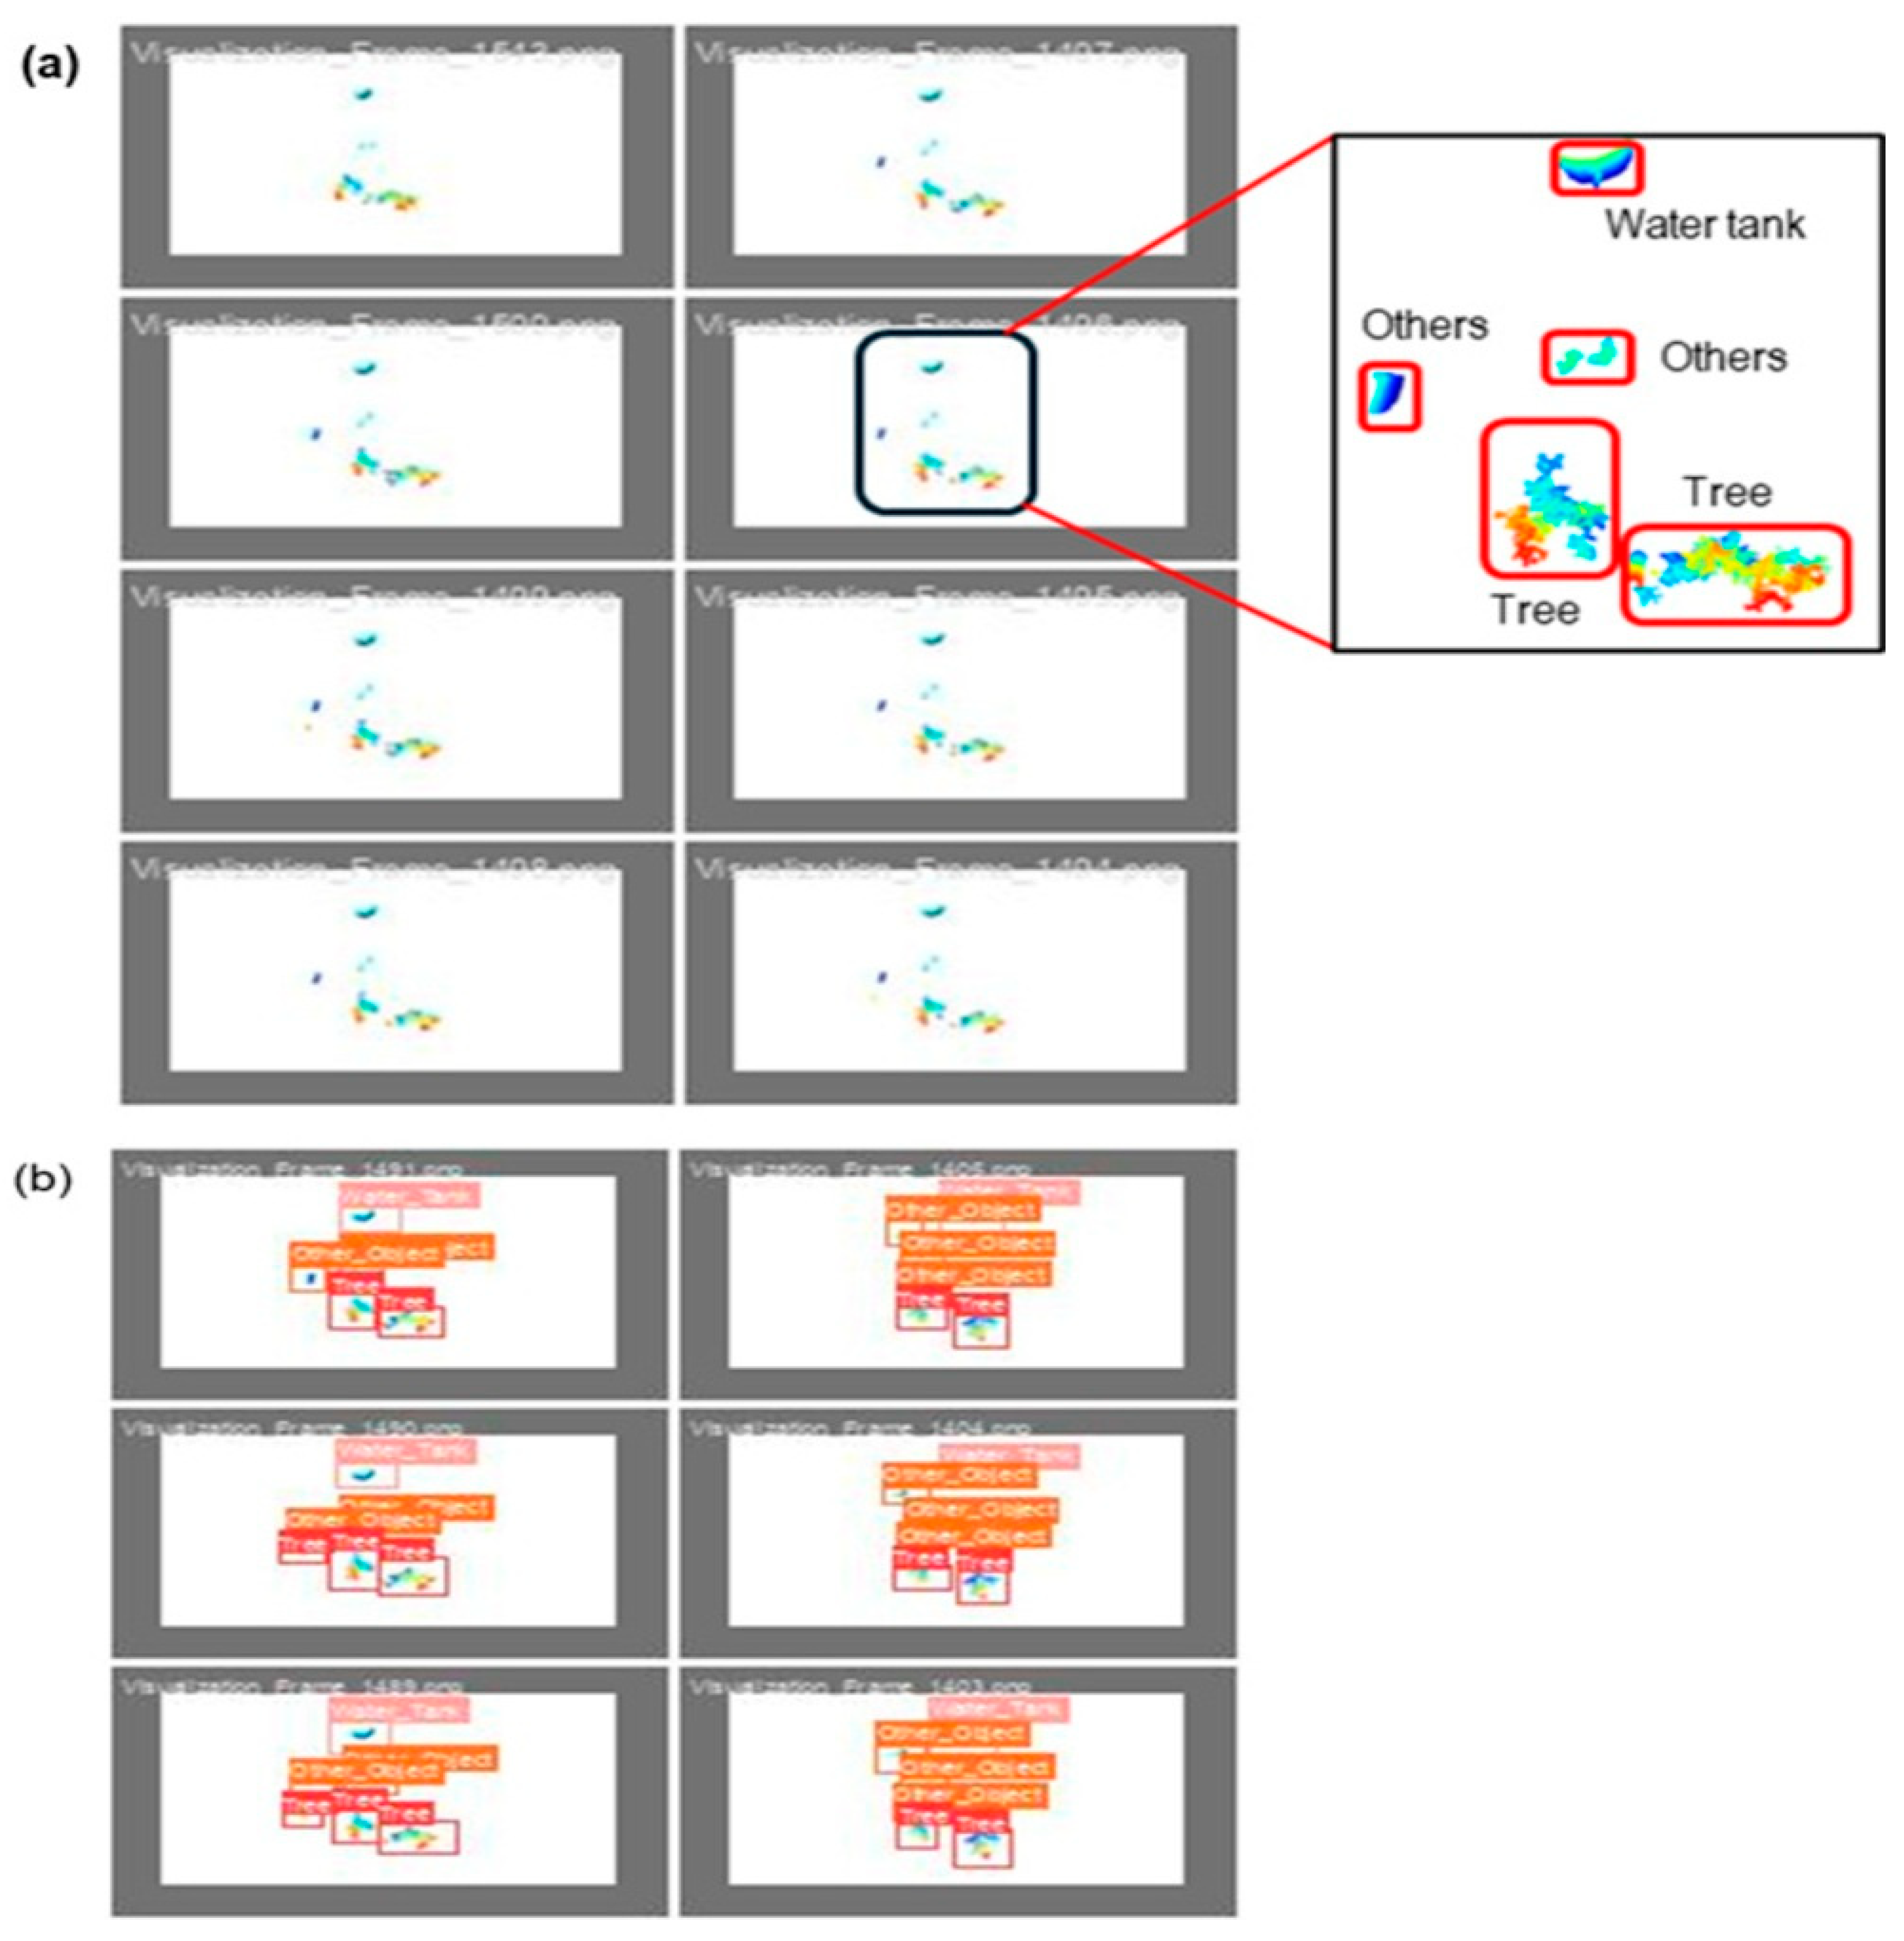
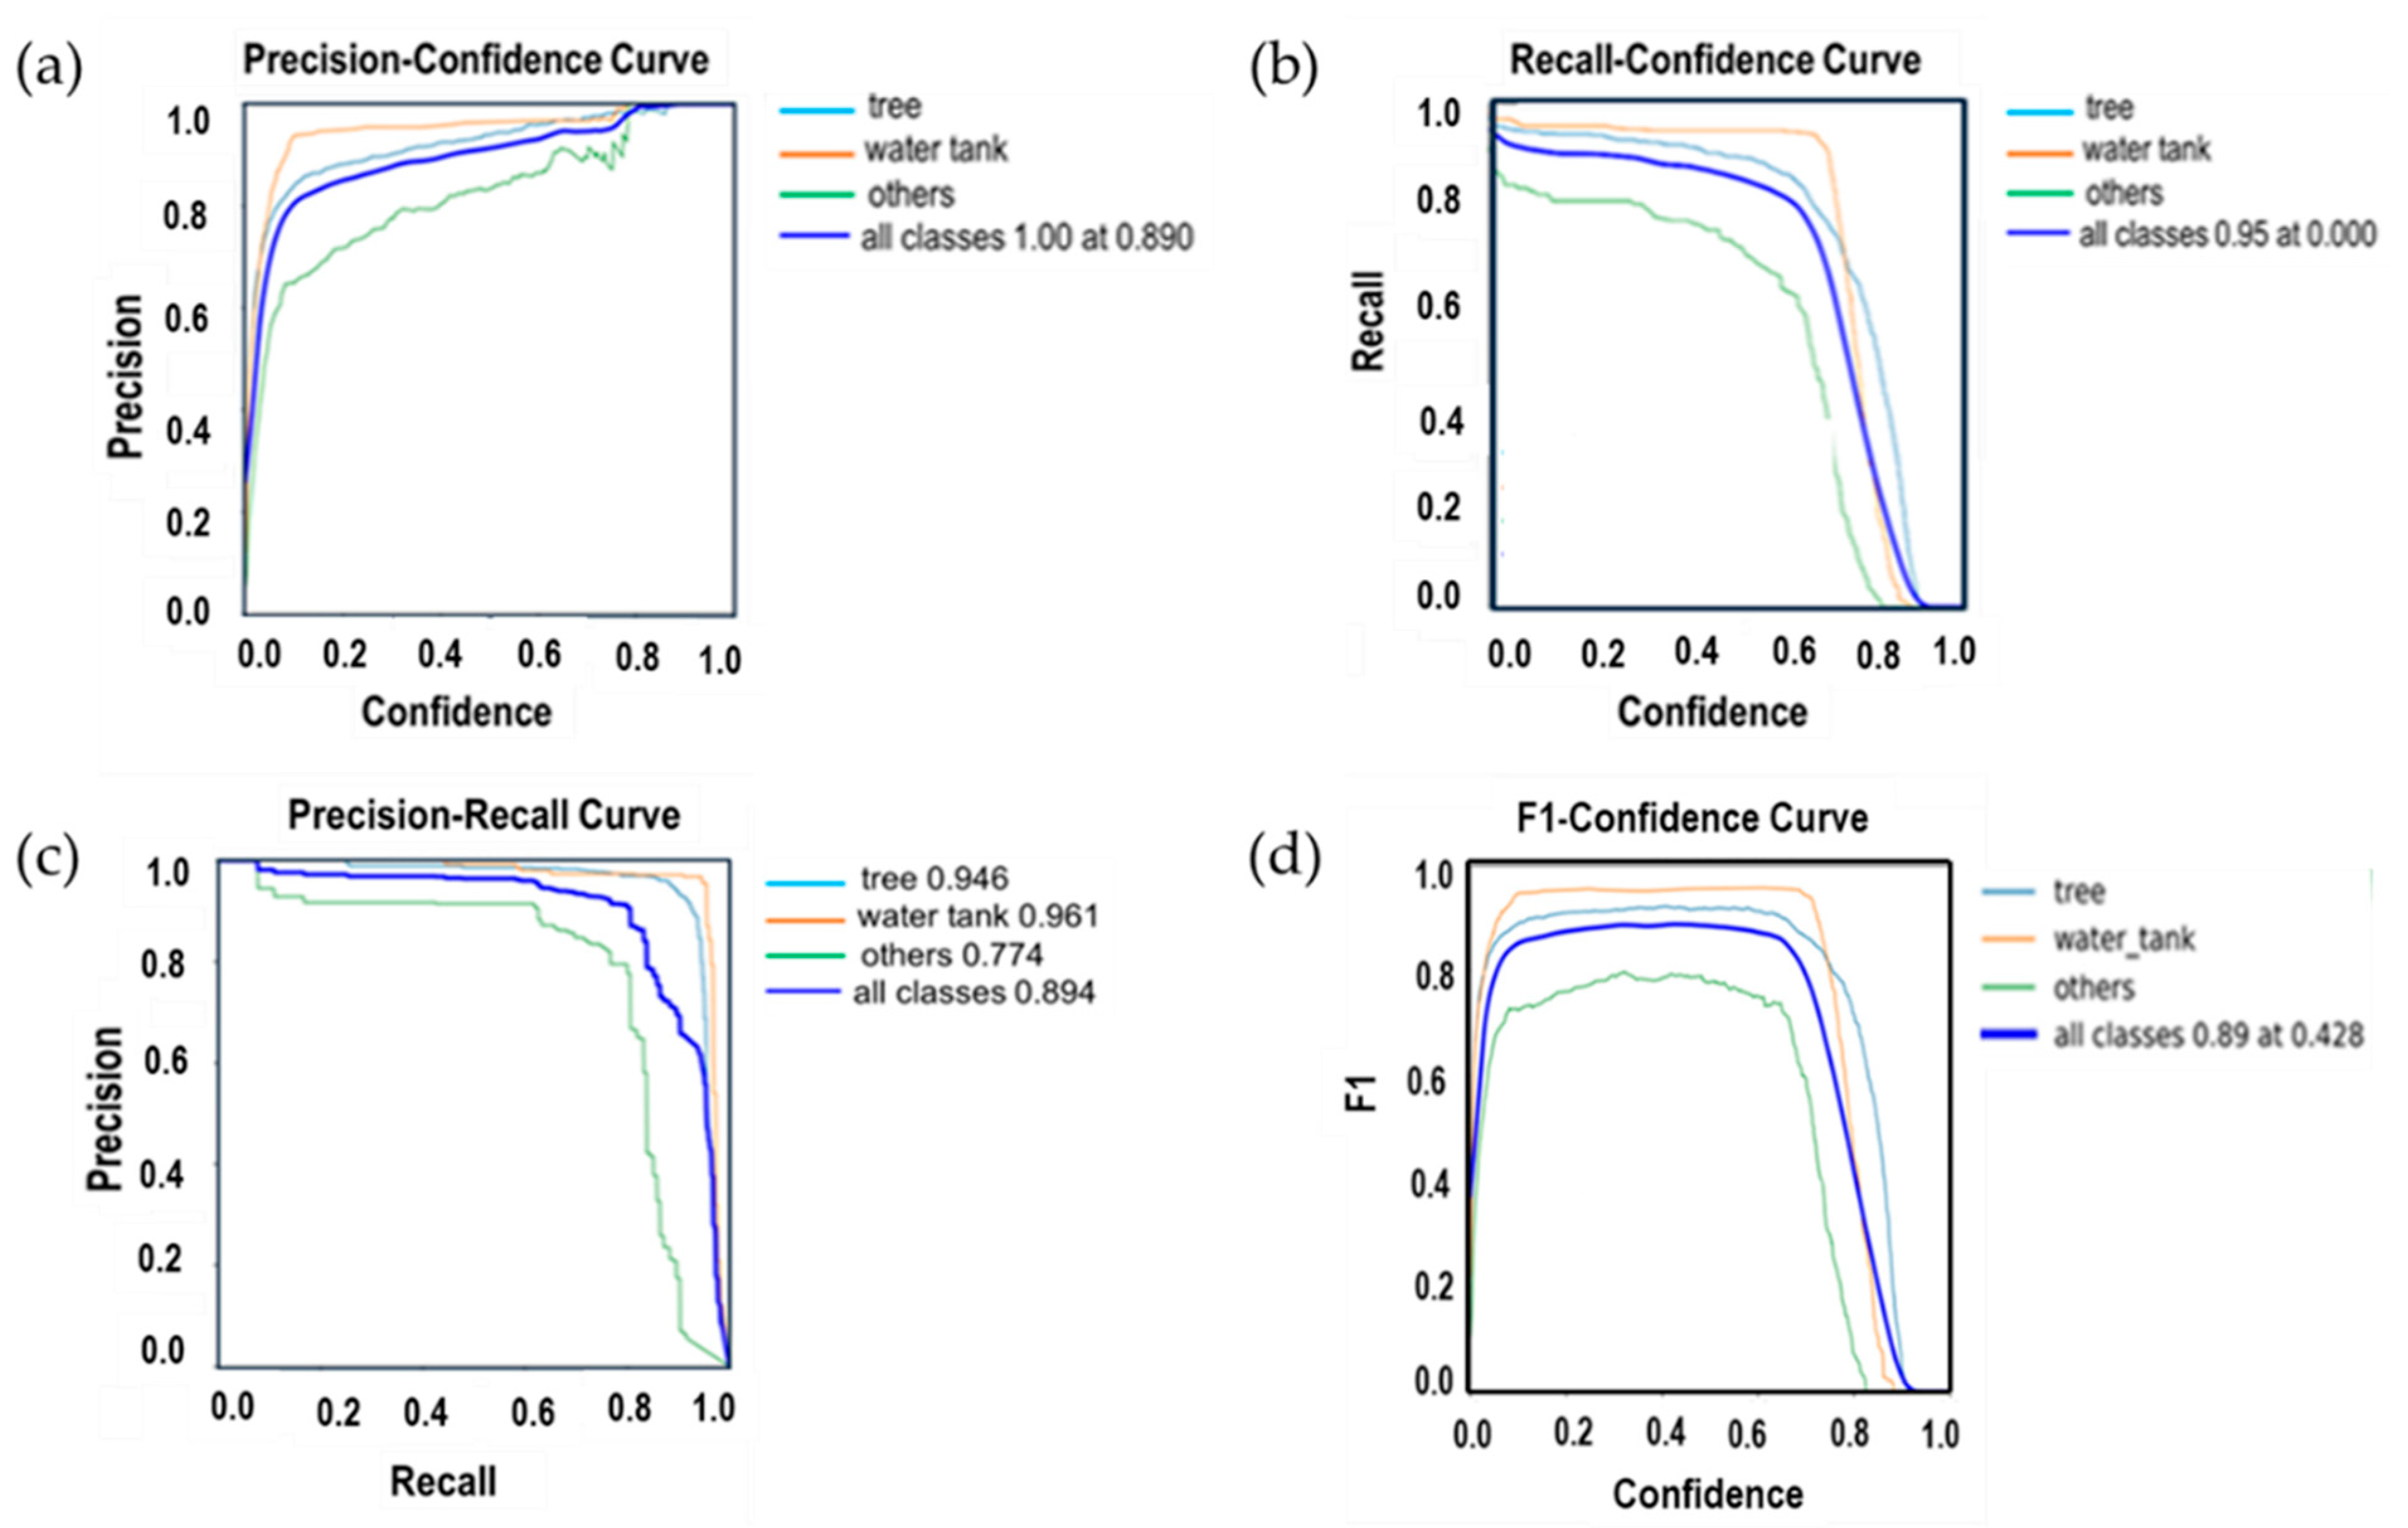
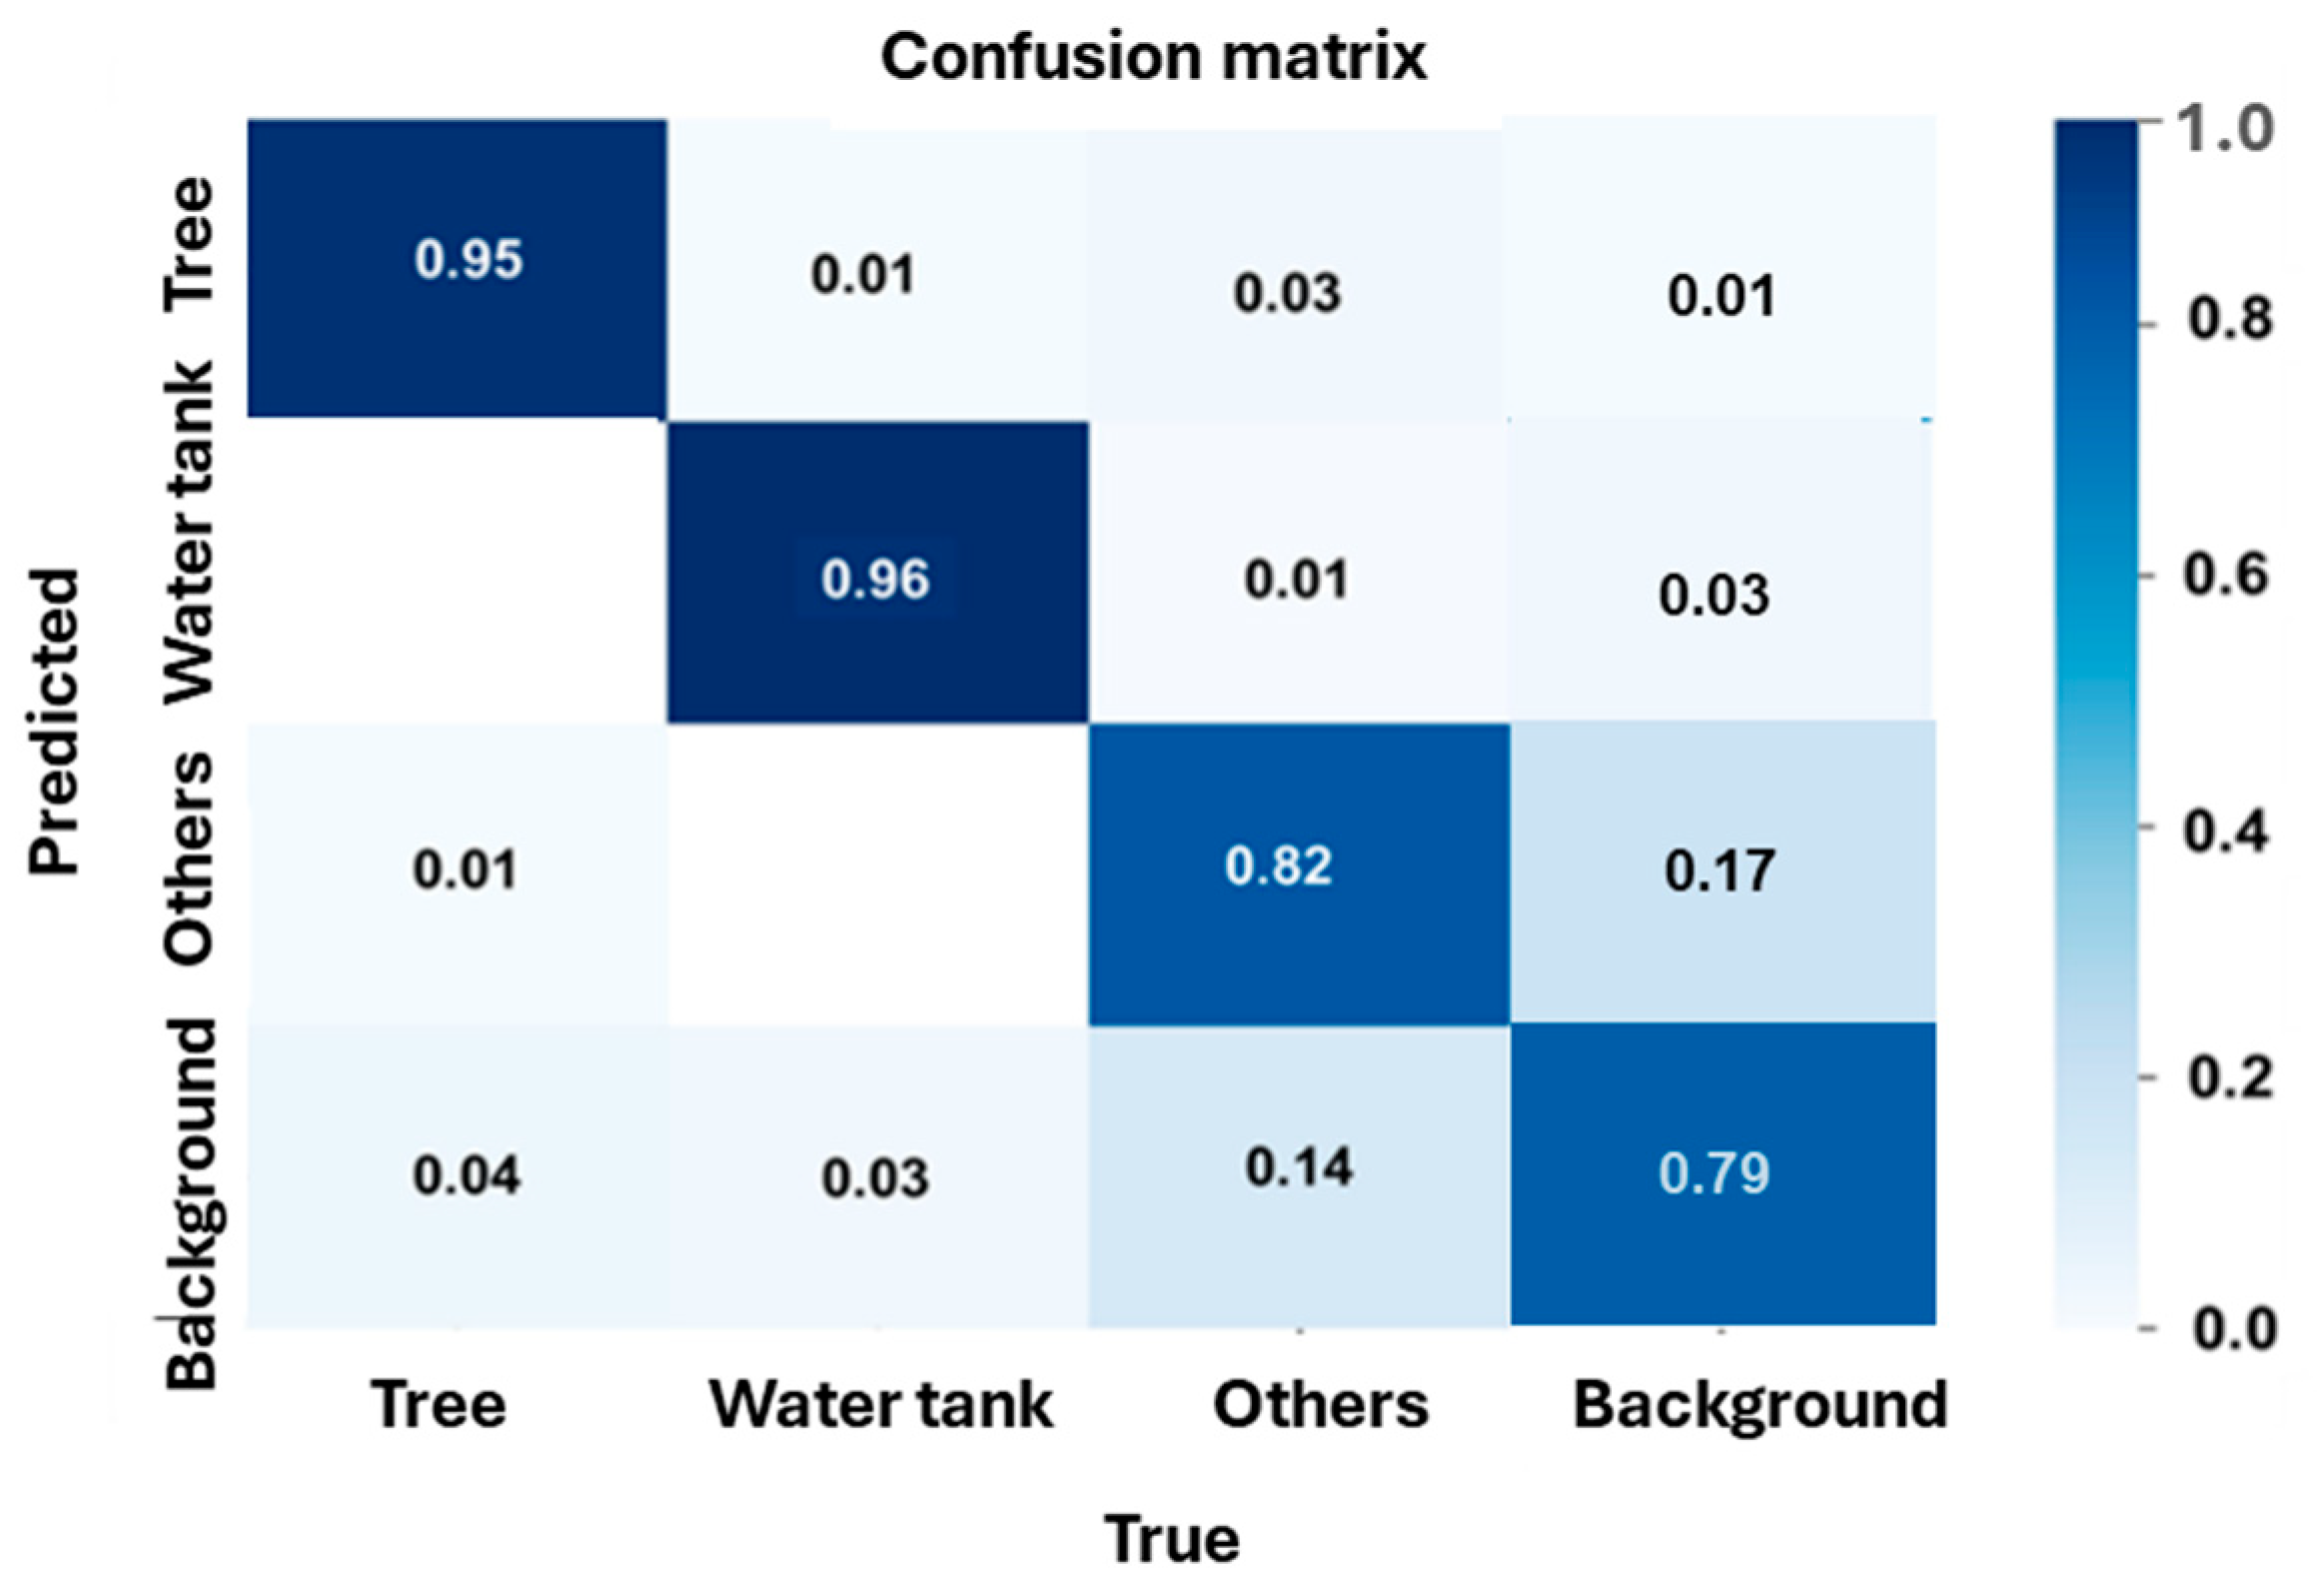
4.2. Object Detection Performance

The detection performance curves shown in Figure 12 demonstrate that the model performed best in classes with consistent shapes and distinct visual features. The water tank class showed the highest accuracy across all metrics, likely due to the uniform structure, minimal occlusion, and clear contrast with the background, which allowed the model to learn stable and separable features. The tree class also achieved high performance, benefiting from sufficient training samples and predictable patterns in appearance. In contrast, the “others” class exhibited lower and more unstable scores, mainly due to high visual variability, background similarity, and inconsistent labeling. These conditions introduce ambiguity in feature representation, making it difficult for the model to generalize. The performance drop at higher confidence thresholds further indicates that the model becomes less certain when filtering ambiguous detections, particularly for less-defined categories. The observed results suggest that inter-class confusion, annotation noise, and class imbalance remain key challenges affecting model performance, especially in complex orchard environments.
The confusion matrix, as shown in Figure 13, provides a detailed evaluation of the classification performance across different object categories, which achieved an overall accuracy of 89% (mAP@50) with a class loss of 0.001. The model exhibited a high detection accuracy for water tanks (96%), with 1% misclassified as trees and 3% as background, demonstrating strong detection accuracy in distinguishing this class. Similarly, trees were correctly identified with 95% accuracy, with 1% misclassified as other objects and 4% as the background, indicating reliable detection. However, the class defined as “others” showed a lower classification accuracy of 82%, with 3% misclassified as trees, 1% as water tanks, and 14% as background, highlighting the challenge of distinguishing these objects due to their similarity with background elements. Additionally, some background regions were misclassified as trees (4%), water tanks (3%), and others (14%). These findings aligned with the high detection accuracy where trees (95%) and water tanks (96%) were achieved, while the “others” class presented a higher misclassification rate of 18% (3% misclassified as trees, 1% as water tanks, and 14% as background). The confusion matrix shows that the model performed well in detecting clearly defined objects, such as trees and water tanks, with high accuracy due to their distinct shapes and consistent features. In contrast, the “others” class has a lower accuracy because it includes various objects with visual heterogeneity, making it harder for the model to learn clear patterns. Many of these objects also resemble the background elements, leading to misclassifications. Background areas were sometimes predicted as objects due to visual similarity or labeling issues. Although the overall class loss was low, these results suggested that the model struggled with classes that showed high variability or overlap with the background.
The visualized image represents the obtained validation results for the apple tree detection model, as shown in Figure 14, where the labels 0, 1, and 2 correspond to the tree, water tank, and other existing objects in the apple orchard, respectively. Each sub-image in the grid demonstrates the prediction model compared to the ground truth annotations within the validation batch. The validation results demonstrated that the model effectively detected trees (label 0, red bounding boxes) with 95% accuracy and water tanks (label 1, salmon-colored bounding boxes) with 96% accuracy, with most instances correctly classified. The other category (label 2, yellow bounding boxes) was also detected in 82% of the cases, indicating the model’s capacity to differentiate between object categories. However, certain objects, particularly from the other category, were misclassified as trees (3%) due to background interference, as highlighted in the image annotation. Some water tanks (1%) are also misclassified as trees and 3% as background, likely due to occlusion or insufficient distinguishing features. The model struggled with misclassifying background elements as trees (4%), suggesting semantic similarities between the background textures and tree features. Additionally, the “others” class exhibited a misclassification rate of 18% (3% as trees, 1% as water tanks, and 14% as background), consistent with previous findings from the confusion matrix. These trends align with prior quantitative results, confirming that trees (95%) and water tanks (96%) maintain a high detection accuracy, whereas the other category (82%) shows a higher misclassification rate of 18%. The background was misclassified as trees in 4% of the cases. This suggests issues with the data quality or feature learning. Improving the dataset or using better feature extraction techniques could enhance the detection performance.

5. Discussion

5.1. Implications for Theory

The theoretical implications of this study lie in the contribution of the YOLOv5 model, integrated with LiDAR data, to advancing object detection research in structured natural environments. By analyzing the training behavior, detection metrics, and model limitations, this study offers insights into the algorithmic performance under real-world variabilities, such as occlusion, class imbalance, and object scale. The following results and observations support these contributions to the theoretical understanding of deep-learning-based detection in agricultural contexts.
The training and validation results indicated that the YOLOv5 model effectively detected apple trees, water tanks, and others in apple orchards using LiDAR PCD data. The YOLOv5 algorithm was applied for tomato key point detection and bounding box generation. The PCD pre-processing module consisted of PCD segmentation, downsampling of voxels, removal of outlier, color clustering, and sphere fitting using RANSAC) algorithm, and key point indexing [72]. The RANSAC plane fitting method was applied to remove ground points based on geometric continuity and planarity in the lower z-range of a point cloud. Although the orchard site was relatively flat with minimal elevation variation, a dry run was performed during pre-processing on several sample frames to visually inspect the plane fitting results. This ensured that the RANSAC parameters did not mistakenly exclude non-ground structures such as lower branches or tree trunks. The distance threshold of the algorithm and plane normal constraints were tuned to preserve the vertical vegetation while effectively filtering the ground-level points. The experimental results showed that the YOLO model acquired a bounding box of mAP 92.9%, which is comparable to the mAP obtained in this study [73]. The results demonstrated that the model successfully learned to detect and distinguish objects with a high level of accuracy, achieving a balanced performance between incorrect detections and missed targets. The training performance metrics demonstrated consistent improvements in precision, recall, and mAP over successive epochs. The precision reached 90%, recall improved significantly from 30% to 90%, and mAP@50 increased from 30% to 90%, indicating strong classification and localization capabilities. However, the mAP@50:95 curve plateaued at around 80%, suggesting that the model performance varied across the thresholds of different IoUs, and further improvement in object localization was still needed.
The object detection evaluation using different performance curves confirmed that the model achieved a high detection accuracy for trees and water tanks. The other classes exhibited higher variabilities and lower precisions. The YOLOv5 model was applied to detect fruit tree trunks, persons, and supporting elements in a natural orchard environment and achieved mAP values of 97.1% [74], which was higher than the mAP values of 89.2% in this study. This misclassification pattern suggests that background similarities and overlapping features contributed to the difficulty of the model in correctly distinguishing specific objects. The validation results further confirmed these trends, showing that trees and water tanks were accurately detected in most instances, while the “others” class exhibited a higher misclassification rate (18%). Background misclassification as trees (4%) suggested the presence of visually similar features between background elements and tree structures, reinforcing the need to improve dataset quality and feature extraction techniques. The misclassification of water tanks (1%) as trees and 3% as background could be attributed to occlusion or insufficient distinguishing features. Converting 3D point cloud data to 2D PNG images simplifies the object detection pipeline. This transformation can result in the loss of depth indications and occlusion information. In this study, no explicit quantitative measurements of depth or occlusion loss were performed during projection. However, care was taken during pre-processing to maintain spatial consistency by selecting representative viewpoints that minimized severe occlusion and retained the canopy structure and object boundaries.
Additionally, to overcome the impact of depth loss, multiple image samples were included from different angles, and sed PNG images of high resolution were derived from carefully filtered and downsampled 3D point clouds. This helped save the discriminative features in the 2D format for reliable object detection. The findings suggest that the YOLOv5 model performed effectively in detecting plants and objects in the apple orchard, with high classification accuracy for trees and water tanks. However, the lower accuracy in detecting the other classes indicates that additional refinement could improve the detection performance. Future improvements could include fine-tuning hyperparameters to optimize detection at higher IoU thresholds, increasing dataset diversity to better represent varying object appearances, enhancing feature extraction through additional contextual information, and using a larger input image size to capture more object details and improve localization accuracy.
The training results of the YOLOv5 model showed no clear signs of overfitting. Both loss curves for training and validation, including the loss of box, objectness, and classification, exhibited similar decreasing trends and converged smoothly without divergence throughout the 100 training epochs. Furthermore, the performance metrics on the validation set, including P of 0.90, R value of 0.87, mAP@0.5 of 0.89, and mAP@0.5:0.95 of 0.48, remained consistently high, which indicates that the model could be generalized well with unseen data. The consistency between the training and validation metrics indicated that the model captured meaningful object features without overfitting or learning from noise in the training data. The YOLOv5 model exhibited strong detection performance for identifying apple trees and other objects in the orchard using LiDAR point cloud data. However, several challenges and limitations have been observed. These include class imbalance, similarity between objects and backgrounds, occlusion, and difficulties in accurate object localization. The other classes exhibited a lower classification accuracy of 82% and a higher misclassification rate (18%). This was likely due to the lack of distinctive features in these objects, which caused confusion with tree structures and background textures, resulting in both false detections and missed instances. Additionally, 4% of the background areas were misclassified as trees, likely due to similarities in textures, such as vegetation, suggesting that enhanced feature extraction techniques could improve the model performance. Occlusion also posed a challenge, with 1% of water tanks misclassified as trees and 3% as background, likely due to partial coverage by tree branches or orchard infrastructure, which made detection difficult. Furthermore, sensitivity to object scale variations affected localization accuracy, as evidenced by the drop in performance at higher IoU thresholds (mAP@50–95 of 47.8% compared to mAP@50 of 89.2%), indicating that smaller or distant objects were not captured effectively within the multi-scale feature maps. The class imbalance in the dataset, with trees (~2000 instances) being more frequently represented than water tanks (~1000 instances) and others (~500 instances), impacted the accuracy of the underrepresented classes. Additionally, the training image size influenced the detection performance, where higher resolutions improved localization but increased computational demands, whereas smaller resolutions reduced details, affecting detection quality.
Although the overall classification loss was remarkably low (0.001), the confusion matrix revealed an 18% misclassification rate in the “others” category. This discrepancy can be attributed to class imbalance, where the “others” class had substantially fewer labeled instances compared to dominant classes such as “tree” and “water tank.” As a result, the learning algorithm may have prioritized the dominant classes during optimization, leading to skewed loss minimization that did not reflect the performance of the minority class. To partially address this, weighted loss functions were applied during training; however, the intra-class variability and visual ambiguity within the “others” class remained challenging. Future enhancements may include more balanced class sampling, advanced augmentation for underrepresented classes, or the redefinition of ambiguous categories to reduce overlap and improve generalization.

5.2. Implications for Practice

From an application standpoint, this study demonstrates how LiDAR point cloud data can be effectively integrated into 2D object detection frameworks for real-world agricultural monitoring. These findings provide practical insights into the deployment of YOLOv5 for orchard management tasks and inform future system development for autonomous fruit monitoring, object recognition, and spatial analysis.
Sun et al. [75] applied an enhanced YOLOv5s model to detect and count peach blossoms across three morphological categories. Their approach achieved a higher average precision than commonly used object detection methods, effectively identifying buds, fully opened flowers, and fallen petals with accuracies of 87.5%, 89.8%, and 93.3%, respectively. Furthermore, the final mAP value for flower recognition reached 90.2%, which met the requirements for monitoring the peach tree flowering quantity and was similar to the mAP values obtained in this study. According to the findings, future work could improve performance by increasing dataset diversity by including more varied samples of other classes and occluded objects, adjusting object segmentation techniques to reduce background misclassification, and applying advanced augmentation techniques such as random occlusions and synthetic data generation to balance the dataset. Fine-tuning of YOLOv5 hyperparameters, such as confidence thresholds and non-max suppression (NMS), may be applied for better detection at higher IoU levels. It may also explore alternative architectures, such as YOLOv8 or hybrid models (e.g., transformer-based object detection), for improved accuracy. Despite its limitations, the YOLOv5 model demonstrated high accuracy and reliability in detecting apple trees and orchard-related objects. However, dataset optimization could further enhance performance, particularly in detecting small or ambiguous objects with greater accuracy.
Peng et al. [76] modified the YOLOv5 model for Lichi detection and compared their finding with several object detectors like SSD, CenterNet, YOLOv3, YOLOv4, and YOLOv7. To confirm the performance of the YOLOv5 model used in this study, the data results were compared with the accuracy of other detection models. Figure 15 shows a comparison of the values of P, R, F1-Score, and mAP for various detection models of diversified objects and the study findings. Figure 15 compares the performances of the various object detection models. The YOLOv5 version used in this study outperformed SSD, CenterNet, and earlier YOLO versions in terms of P, R, F1-score, and mAP. This strong performance was attributed to the data preparation approach of this study, which converted LiDAR point clouds into 2D PNG format images, allowing YOLOv5 to be trained without architectural changes. However, this study lacks statistical comparisons with previous works, which would better highlight its advantages. The lower performance in the ‘others’ class is likely due to class imbalance and visual ambiguity, suggesting the necessity for augmentation or class redefinition. Additionally, while the training curves show stable convergence, the gap between mAP@0.5 and mAP@0.5:0.95 identifies potential localization issues, possibly due to bounding box regression limitations or anchor box constraints.
The results of several studies shown in Figure 16 illustrate the average precision (AP) performance of various object detection algorithms on the COCO dataset, distinguishing between one-stage and two-stage detectors. Overall, two-stage detectors, such as Cascade R-CNN [77], PANet [78], and Grid R-CNN [79], consistently outperform one-stage models, achieving AP scores above 40%. Notably, Cascade R-CNN [76] and PANet [77] delivered the highest accuracy, exceeding 42%, reflecting their strong localization and classification capabilities. In contrast, one-stage detectors, such as SSD [25] and YOLOv3 [22], demonstrate competitive but generally lower AP scores, typically ranging between 30% and 34%. Among one-stage models, RetinaNet [27] and RefineDet [28] stand out, approaching the lower boundary of two-stage detector performance. This visual comparison highlights the trade-off between detection speed and accuracy, where two-stage models offer superior precision at the expense of computational complexity, while one-stage models provide faster inference with slightly reduced accuracy, which is an important consideration for real-time applications in resource-constrained environments.
To validate the effectiveness of the proposed YOLOv5 object detection model for apple orchard environments, the results of this study were compared with those of Sun et al. [75] and Peng et al. [76], as both studies applied YOLOv5 variants in agricultural contexts using comparable evaluation metrics. Sun et al. [75] study implemented an enhanced YOLOv5s model to detect three morphological types of peach flowers, making this another relevant application of YOLOv5 in orchard environments. Their dataset and detection challenge (buds, flowers, and falling flowers) provide a parallel to the class variability in this study, especially in detecting small and visually ambiguous orchard elements. They achieved a final mAP of 90.2%, which is close to the mAP obtained in this study, justifying their inclusion for performance benchmarking. Additionally, they offered insights into potential improvements (e.g., dataset balancing, augmentation, and occlusion handling), which were also critical considerations for this study. By comparing the results of this study with those of these two studies, we aim to demonstrate the robustness of this study approach under different orchard environments and detection tasks, such as pear and persimmon fruit orchards, in future studies. The evaluation across consistent metrics and shared challenges, such as object scale variability, annotation complexity, and occlusion, justifies the relevance of these benchmarks. In contrast, Peng et al. [76] applied a modified YOLOv5 model for Lichi fruit detection using UAV-based 2D images, which is similar to the approach used in this study using 2D PNG imagery data converted from PCD data. They conducted quantitative evaluations against multiple mainstream object detection models (SSD, CenterNet, YOLOv3–v7), using the same performance metrics adopted in this study, such as precision, recall, F1-score, and mAP. Their study focused on data pre-processing (2D RGB images) closely aligned with the pre-processed data of this study (2D PNG imagery data converted from point clouds), making the performance comparison contextually relevant. Despite the similarity, their work was conducted on Lichi detection, while this study approach was applied to apple trees and other object detection, allowing for crop benchmarking.
This study particularly lies in an approach to preparing a YOLOv5 compatible dataset from raw LiDAR data in PCAP format. In contrast to prior approaches that apply object detection directly on 3D PCD data, this study presents a detailed pre-processing workflow in Python to transform 3D LiDAR data into 2D PNG image representations. This enabled the YOLOv5 detector to be trained and validated on 2D images derived from LiDAR data, similar to RGB image inputs, without modifying the original model architecture. This conversion bridges the gap between 3D LiDAR data and 2D object identification frameworks, which offers a practical and effective solution for detecting apple trees, water tanks, and other orchard objects for efficient orchard management.
A statistical comparison was performed with the results of existing models, such as YOLOv3, YOLOv4, SSD, and CenterNet, in orchard environments to highlight the competitive performance of the YOLOv5 approach used in this study [76]. Class-level performance disparities, particularly the lower precision and F1-score observed in the ‘others’ object classes, were attributed to class imbalance and the visual ambiguity of miscellaneous objects. Future improvements may include the redefinition of classes, class-weighted loss functions, and advanced augmentation techniques [80]. Analysis of the learning behavior showed rapid convergence and stable precision and recall, with no signs of overfitting, supported by consistently decreasing classification and objectness losses. The gap between mAP@50 (89.2%) and mAP@50:95 (47.8%) was discussed in relation to the bounding box regression accuracy and the sensitivity of the model to strict IoU thresholds, which might be improved through anchor box optimization or more precise localization strategies. Additionally, the field applicability of the LiDAR and YOLOv5 approach e was promising, with potential deployment on autonomous platforms for tree monitoring and yield estimation. Future research should focus on implementing transformer architectures (e.g., Swin-T, DETR), focal loss for class imbalance, and data-efficient techniques, such as mosaic augmentation and semi-supervised learning, to further enhance model robustness and reduce annotation burden.
Regarding the use of visual transformers, this study acknowledges the advancements in transformer-oriented models, particularly their superiority in capturing long-range dependencies and context across images [81]. However, current visual transformer architectures are generally more computationally intensive, require larger datasets for effective training, and are not yet optimized for deployment on resource-limited devices, such as UAVs or edge-computing units used in orchards. In contrast, YOLOv5 offers a lightweight architecture with efficient performance and has demonstrated robust results in object detection tasks in orchard using relatively small datasets. Although hybrid and ensemble methods may improve accuracy by leveraging multiple architectures, they typically introduce higher computational complexity and inference time, which may not be feasible in low-latency agricultural applications [81,82]. Nonetheless, future work could explore models using transformers and hybrid systems to investigate their potential benefits under real-world agricultural conditions, especially as computational resources in field robotics continue to improve.

5.3. Implications for Economic Benefit

The integration of YOLOv5 object detection with LiDAR data presents significant economic advantages for precision agriculture, particularly in orchard management. By enabling the automated detection and localization of orchard components, such as apple trees, water tanks, and other infrastructure, the proposed approach reduces the dependency on manual inspection and labor-intensive monitoring. This automation contributes to lower operational costs and improved efficiency, facilitating timely and data-driven decision-making for key agronomic tasks, including pruning, thinning, yield estimation, and irrigation scheduling. These improvements ultimately enhance resource utilization and productivity, aligning with the goals of sustainable and efficient agricultural practices [11,12,13].
Furthermore, the high detection accuracy and low-latency performance make the YOLOv5 architecture well-suited for real-time deployment on mobile and autonomous platforms, such as ground robots and UAVs [83,84,85,86], without the need for extensive computational resources [87]. This characteristic enhances accessibility and adoption potential, particularly for small- and medium-scale growers who may face economic barriers to adopting more complex or resource-intensive systems. Additionally, the pre-processing pipeline developed in this study converts 3D LiDAR point clouds into 2D image representations compatible with standard 2D object detectors. It offers a cost-effective and scalable alternative to the more computationally demanding 3D object detection frameworks.
By improving object detection accuracy and reducing classification errors, especially for critical orchard elements, the approach minimizes costly errors, such as the misidentification of trees. This can disrupt farm operations. Therefore, the findings of this study support the development of economically viable, scalable, and field-adaptable technologies. This advances smart orchard management with implications for increased profitability, reduced input waste, and broader technological adoption in the agricultural sector.

5.4. Scalability and Cross-Crop Applicability

The proposed CNN-based apple detection scheme, implemented using YOLOv5 and 2D projections of LiDAR point cloud data, is inherently scalable and transferable to the detection of other fruit types, such as oranges, pears, and peaches. This scalability is primarily due to the general purpose of the YOLOv5 architecture, which can learn class-specific features from annotated data regardless of the object category.
To adapt the approach for another fruit orchard object detection, the same pre-processing pipeline might be applied to LiDAR data collected in a different orchard. The model can be retrained or fine-tuned using a new set of labeled images representing the target fruit trees. However, variations in canopy structure may require dataset augmentation and potential hyperparameter tuning. Nonetheless, the modular design and robustness of the current scheme support its broader application to various fruit trees.

6. Conclusions

The YOLOv5 detector was successfully trained on LiDAR PCD data to detect apple trees and other objects with high accuracy and low classification loss. The study results demonstrated the efficiency of the YOLOv5 detector for detecting apple trees and other orchard objects using LiDAR. It achieved high accuracy and a reliable performance. The model achieved a mAP of 89.2%, with a high classification accuracy for trees of 95% and water tanks of 96%, while the other categories exhibited a lower accuracy of 82%. It also highlights the challenges in recognizing ambiguous objects. The evaluation of precision-recall, confidence curves, and the confusion matrix further confirmed the object detection efficiency with a low classification loss (0.001) and achieved a well-balanced performance with a precision of 90.3% and a recall of 87.1%. Limitations such as class imbalance, background interference, occlusion effects, and sensitivity to small-scale objects were observed in the detection performance at higher IoU thresholds of 47.8% for mAP@50–95. Apple detection using the proposed CNN-based scheme, implemented using YOLOv5 and 2D projections of LiDAR point cloud data, is inherently scalable and transferable to the detection of other fruit types, such as oranges, pears, and peaches. Future improvements, including dataset augmentation, feature extraction refinements, and hyperparameter tuning, could enhance the accuracy of the model, particularly in the misclassification of object classes. These results highlight the potential of YOLOv5 for orchard monitoring and precision agricultural applications, particularly in the field of orchard management.

Author Contributions

Conceptualization, M.R.K. and S.-O.C.; methodology, M.R.K. and S.-O.C.; validation, M.R.K., M.N.R., S.A., K.-H.L. and J.S.; formal analysis, M.R.K., M.N.R. and S.A.; investigation, J.S. and S.-O.C.; resources, S.-O.C.; data curation, M.R.K., M.N.R., S.A., K.-H.L. and J.S.; writing—original draft preparation, M.R.K.; writing—review and editing, M.R.K., M.N.R., K.-H.L., J.S. and S.-O.C.; visualization, M.R.K., S.A., K.-H.L. and J.S.; supervision, S.-O.C.; project administration, S.-O.C.; funding acquisition, S.-O.C. All authors have read and agreed to the published version of the manuscript.

Funding

This work was supported by Korea Institute of Planning and Evaluation for Technology in Food, Agriculture and Forestry (IPET), through Open Field Smart Agriculture Technology Short-term Advancement Program, funded by Ministry of Agriculture, Food and Rural Affairs (MAFRA) (Project No. RS-2022-IP322029), Republic of Korea.

Institutional Review Board Statement

Not applicable.

Informed Consent Statement

Informed consent was obtained from all subjects involved in the study.

Data Availability Statement

Data are contained within the article.

Conflicts of Interest

Author Joonjea Sung was employed by the company FYD Company Ltd., Suwon 16676, Republic of Korea. The remaining authors declare that the research was conducted in the absence of any commercial or financial relationships that could be construed as potential conflicts of interest.

References

  1. Tlais, A.Z.A.; Fiorino, G.M.; Polo, A.; Filannino, P.; Di Cagno, R. High-value compounds in fruit, vegetable and cereal byproducts: An overview of potential sustainable reuse and exploitation. Molecules 2020, 25, 2987. [Google Scholar] [CrossRef] [PubMed]
  2. Behailu, A.; Kebede, J. A study on the causes of apple (malus domestica) fruit loss at Chencha woreda of Gamo gofa zone, southern Ethiopia. J. Stored Prod. Postharvest Res. 2018, 9, 72–77. [Google Scholar]
  3. Fetena, S.; Shara, S.; Anjulo, A.; Gulie, G.; Woldesenbet, F.; Yilma, B. Survey on apple production and variety identification in Chencha District of Gamo Gofa Zone, Southern Ethiopia. J. Agric. Food Technol. 2014, 4, 7–15. [Google Scholar]
  4. Ntakyo, P.R.; Mugisha, J.; Elepu, G. Socio-economic factors affecting apple production in South-Western Uganda. Afr. Crop Sci. J. 2013, 21, 311–321. [Google Scholar]
  5. Desmarescaux, M.; Kaddah, W.; Alfalou, A.; Badoc, I. SiamYOLOv8: A rapid conditional detection framework for one-shot object detection. Appl. Intell. 2025, 55, 609. [Google Scholar] [CrossRef]
  6. Huang, Y.; Qian, Y.; Wei, H.; Lu, Y.; Ling, B.; Qin, Y. A survey of deep learning-based object detection methods in crop counting. Comput. Electron. Agric. 2023, 215, 108425. [Google Scholar]
  7. Kang, S.; Hu, Z.; Liu, L.; Zhang, K.; Cao, Z. Object detection YOLO algorithms and their industrial applications: Overview and comparative analysis. Electronics 2025, 14, 1104. [Google Scholar] [CrossRef]
  8. Liu, R.; Yang, B.; Zio, E.; Chen, X. Artificial intelligence for fault diagnosis of rotating machinery: A review. Mech. Syst. Signal Process. 2018, 108, 33–47. [Google Scholar] [CrossRef]
  9. Gautam, D.; Mawardi, Z.; Elliott, L.; Loewensteiner, D.; Whiteside, T.; Brooks, S. Detection of invasive species (Siam Weed) using drone-based imaging and YOLO deep learning model. Remote Sens. 2025, 17, 120. [Google Scholar] [CrossRef]
  10. Liu, G. Surface defect detection methods based on deep learning: A brief review. In Proceedings of the 2020 2nd International Conference on Information Technology and Computer Application (ITCA), Guangzhou, China, 18–20 December 2020; pp. 200–203. [Google Scholar]
  11. Hassan, M.U.; Ullah, M.; Iqbal, J. Towards autonomy in agriculture: Design and prototyping of a robotic vehicle with seed selector. In Proceedings of the 2016 2nd International Conference on Robotics and Artificial Intelligence (ICRAI), Rawalpindi, Pakistan, 1–2 November 2016; pp. 37–44. [Google Scholar]
  12. Karim, M.R.; Ahmed, S.; Reza, M.N.; Lee, K.H.; Jin, H.; Ali, M.; Sung, J.; Chung, S.O. A review on stereo vision for feature characterization of upland crops and orchard fruit trees. Precis. Agric. Sci. Technol. 2024, 6, 104–122. [Google Scholar]
  13. Bicamumakuba, E.; Habineza, E.; Lee, K.H.; Chung, S.O. Sensor technologies for remote monitoring of automated orchard irrigation: A review. Precis. Agric. Sci. Technol. 2024, 6, 81–95. [Google Scholar]
  14. Ariza-Sentís, M.; Vélez, S.; Martínez-Peña, R.; Baja, H.; Valente, J. Object detection and tracking in precision farming: A systematic review. Comput. Electron. Agric. 2024, 219, 108757. [Google Scholar] [CrossRef]
  15. Badgujar, C.M.; Poulose, A.; Gan, H. Agricultural object detection with You Only Look Once (YOLO) algorithm: A bibliometric and systematic literature review. Comput. Electron. Agric. 2024, 223, 109090. [Google Scholar] [CrossRef]
  16. Aslan, M.F.; Sabanci, K.; Aslan, B. Artificial intelligence techniques in crop yield estimation based on Sentinel-2 data: A comprehensive survey. Sustainability 2024, 16, 8277. [Google Scholar] [CrossRef]
  17. Padilla, R.; Passos, W.L.; Dias, T.L.; Netto, S.L.; Da Silva, E.A. A comparative analysis of object detection metrics with a companion open-source toolkit. Electronics 2021, 10, 279. [Google Scholar] [CrossRef]
  18. Hu, T.; Wang, W.; Gu, J.; Xia, Z.; Zhang, J.; Wang, B. Research on apple object detection and localization method based on improved YOLOX and RGB-D images. Agronomy 2023, 13, 1816. [Google Scholar] [CrossRef]
  19. Liu, L.; Ouyang, W.; Wang, X.; Fieguth, P.; Chen, J.; Liu, X.; Pietikäinen, M. Deep learning for generic object detection: A survey. Int. J. Comput. Vis. 2020, 128, 261–318. [Google Scholar] [CrossRef]
  20. Redmon, J.; Divvala, S.; Girshick, R.; Farhadi, A. You Only Look Once: Unified, real-time object detection. In Proceedings of the 2016 IEEE Conference on Computer Vision and Pattern Recognition (CVPR), Las Vegas, NV, USA, 27–30 June 2016; pp. 779–788. [Google Scholar]
  21. Redmon, J.; Farhadi, A. YOLO9000: Better, faster, stronger. In Proceedings of the 2017 IEEE Conference on Computer Vision and Pattern Recognition (CVPR), Honolulu, HI, USA, 21–26 July 2017. [Google Scholar]
  22. Redmon, J.; Farhadi, A. YOLOv3: An incremental improvement. arXiv 2018, arXiv:1804.02767. [Google Scholar]
  23. Bochkovskiy, A.; Wang, C.Y.; Liao, H.Y.M. YOLOv4: Optimal speed and accuracy of object detection. arXiv 2020, arXiv:2004.10934. [Google Scholar]
  24. Yan, X.; Shen, B.; Li, H. Small objects detection method for UAVs aerial image based on YOLOv5s. In Proceedings of the 2023 IEEE 6th International Conference on Electronic Information and Communication Technology (ICEICT), Qingdao, China, 21–24 July 2023; pp. 61–66. [Google Scholar]
  25. Liu, W.; Anguelov, D.; Erhan, D.; Szegedy, C.; Reed, S.; Fu, C.Y.; Berg, A.C. SSD: Single shot multibox detector. In Proceedings of the Computer Vision–ECCV 2016: 14th European Conference, Amsterdam, The Netherlands, 11–14 October 2016; Springer International Publishing: Berlin/Heidelberg, Germany, 2015. [Google Scholar]
  26. Fu, C.Y.; Liu, W.; Ranga, A.; Tyagi, A.; Berg, A.C. DSSD: Deconvolutional single shot detector. arXiv 2017, arXiv:1701.06659. [Google Scholar]
  27. Lin, T.Y.; Goyal, P.; Girshick, R.; He, K.; Dollar, P. Focal Loss for dense object detection. IEEE Trans. Pattern Anal. Mach. Intell. 2020, 42, 318–327. [Google Scholar] [CrossRef]
  28. Zhang, S.; Wen, L.; Bian, X.; Lei, Z.; Li, S.Z. Single-shot refinement neural network for object detection. In Proceedings of the IEEE Conference on Computer Vision and Pattern Recognition, Honolulu, HI, USA, 21–26 July 2017. [Google Scholar]
  29. Girshick, R.; Donahue, J.; Darrell, T.; Malik, J. Rich feature hierarchies for accurate object detection and semantic segmentation. In Proceedings of the IEEE Conference on Computer Vision and Pattern Recognition, Portland, OR, USA, 23–28 June 2013. [Google Scholar]
  30. Girshick, R. Fast R-CNN. In Proceedings of the IEEE International Conference on Computer Vision, Santiago, Chile, 7–13 December 2015. [Google Scholar]
  31. Jeong, K.S.; Go, S.H.; Jo, W.K.; Park, J.H. Simplified image analysis for early detection of missing and low-vigor cabbage plants using UAV RGB imagery and deep learning. Korean J. Agric. Sci. 2025, 52, 51–65. [Google Scholar] [CrossRef]
  32. Ren, S.; He, K.; Girshick, R.; Sun, J. Faster R-CNN: Towards real-time object detection with region proposal networks. IEEE Trans. Pattern Anal. Mach. Intell. 2016, 39, 1137–1149. [Google Scholar] [CrossRef]
  33. He, K.; Gkioxari, G.; Dollár, P.; Girshick, R. Mask R-CNN. In Proceedings of the IEEE International Conference on Computer Vision, Venice, Italy, 22–29 October 2017. [Google Scholar]
  34. Martins, N.A.B.; Cruz, L.A.d.S.; Lopes, F. Impact of LiDAR point cloud compression on 3D object detection evaluated on the KITTI dataset. Eurasip J. Image Video Process. 2024, 2024, 15. [Google Scholar] [CrossRef]
  35. Murthy, C.B.; Hashmi, M.F.; Bokde, N.D.; Geem, Z.W. Investigations of object detection in images/videos using various deep learning techniques and embedded platforms—A comprehensive review. Appl. Sci. 2020, 10, 3280. [Google Scholar] [CrossRef]
  36. Ansari, M.A.; Crampton, A.; Parkinson, S. A layer-wise surface deformation defect detection by convolutional neural networks in laser powder-bed fusion images. Materials 2022, 15, 7166. [Google Scholar] [CrossRef] [PubMed]
  37. Hussain, M. Yolov1 to v8: Unveiling each variant—A comprehensive review of yolo. IEEE 2024, 12, 42816–42833. [Google Scholar] [CrossRef]
  38. Zahid, A.; Hussain, M.; Hill, R.; Al-Aqrabi, H. Lightweight convolutional network for automated photovoltaic defect detection. In Proceedings of the 2023 9th International Conference on Information Technology Trends (ITT), Dubai, United Arab Emirates, 24–25 May 2023; pp. 133–138. [Google Scholar]
  39. Hussain, M. When, where, and which?: Navigating the intersection of computer vision and generative ai for strategic business integration. IEEE 2023, 11, 127202–127215. [Google Scholar] [CrossRef]
  40. Hussain, M.; Khanam, R. In-depth review of yolov1 to yolov10 variants for enhanced photovoltaic defect detection. Solar 2024, 4, 351–386. [Google Scholar] [CrossRef]
  41. Hussain, M. Yolo-v5 variant selection algorithm coupled with representative augmentations for modelling production-based variance in automated lightweight pallet racking inspection. Big Data Cogn. Comput. 2023, 7, 120. [Google Scholar] [CrossRef]
  42. Jocher, G.; Kwon, Y.; guigarfr; perry0418; Veitch-Michaelis, J.; Ttayu; Suess, D.; Baltacı, F.; Bianconi, G.; IlyaOvodov; et al. ultralytics/yolov3: v9.5.0-YOLOv5 v5.0 Release Compatibility Update for YOLOv3, Published 12 April 2021. Available online: https://zenodo.org/records/4681234 (accessed on 24 May 2025).
  43. Malavazi, F.B.P.; Guyonneau, R.; Fasquel, J.B.; Lagrange, S.; Mercier, F. LiDAR-only based navigation algorithm for an autonomous agricultural robot. Comput. Electron. Agric. 2018, 154, 71–79. [Google Scholar] [CrossRef]
  44. Gu, C.; Zhai, C.; Wang, X.; Wang, S. CMPC: An innovative LiDAR-based method to estimate tree canopy meshing-profile volumes for orchard target-oriented spray. Sensors 2021, 21, 4252. [Google Scholar] [CrossRef] [PubMed]
  45. Kolb, A.; Meaclem, C.; Chen, X.Q.; Parker, R.; Milne, B. Tree trunk detection system using LiDAR for a semi-autonomous tree felling robot. In Proceedings of the 2015 IEEE 10th Conference on Industrial Electronics and Applications (ICIEA), Auckland, New Zealand, 15–17 June 2015; pp. 84–89. [Google Scholar]
  46. Chen, X.; Wang, S.; Zhang, B.; Liang, L. Multi-feature fusion tree trunk detection and orchard mobile robot localization using camera/ultrasonic sensors. Comput. Electron. Agric. 2018, 147, 91–108. [Google Scholar] [CrossRef]
  47. Vodacek, A.; Hoffman, M.J.; Chen, B.; Uzkent, B. Feature matching with an adaptive optical sensor in a ground target tracking system. IEEE Sens. J. 2015, 15, 510–519. [Google Scholar]
  48. Zhang, X.; Karkee, M.; Zhang, Q.; Whiting, M.D. Computer vision-based tree trunk and branch identification and shaking points detection in dense-foliage canopy for automated harvesting of apples. J. Field Robot. 2021, 58, 476–493. [Google Scholar] [CrossRef]
  49. Wang, L.; Lan, Y.; Zhang, Y.; Zhang, H.; Tahir, M.N.; Ou, S.; Liu, X.; Chen, P. Applications and prospects of agricultural unmanned aerial vehicle obstacle avoidance technology in China. Sensors 2019, 19, 642. [Google Scholar] [CrossRef] [PubMed]
  50. Shalal, N.; Low, T.; Mccarthy, C.; Hancock, N. A preliminary evaluation of vision and laser sensing for tree trunk detection and orchard mapping. In Proceedings of the Australasian Conference on Robotics and Automation (ACRA 2013), Sydney, NSW, Australia, 2–4 December 2013; pp. 80–89. [Google Scholar]
  51. Freitas, G.; Hamner, B.; Bergerman, M.; Singh, S. A practical obstacle detection system for autonomous orchard vehicles. In Proceedings of the IEEE/RSJ International Conference on Intelligent Robots and Systems, Algarve, Portugal, 7–12 October 2012; pp. 3391–3398. [Google Scholar]
  52. Bietresato, M.; Carabin, G.; Vidoni, R.; Gasparetto, A.; Mazzetto, F. Evaluation of a LiDAR-based 3D-stereoscopic vision system for crop-monitoring applications. Comput. Electron. Agric. 2016, 124, 1–13. [Google Scholar] [CrossRef]
  53. Kamilaris, A.; Prenafeta-Boldu, F.X. Deep learning in agriculture: A survey. Comput. Electron. Agric. 2018, 147, 70–90. [Google Scholar] [CrossRef]
  54. Li, Y.; Li, M.; Qi, J.; Zhou, D.; Liu, K. Detection of typical obstacles in orchards based on deep convolutional neural network. Comput. Electron. Agric. 2021, 181, 105932. [Google Scholar] [CrossRef]
  55. Wang, Z.; Li, P.; Cui, Y.; Lei, S.; Kang, Z. Automatic detection of individual trees in forests based on airborne LiDAR data with a tree region-based convolutional neural network (RCNN). Remote Sens. 2023, 15, 1024. [Google Scholar] [CrossRef]
  56. Zulkifli, Z.M.; Hashim, F.H.; Raj, T.; Huddin, A.B. A rapid and non-destructive technique in determining the ripeness of oil palm fresh fruit bunch (FFB). J. Kejuruter. 2018, 30, 93–101. [Google Scholar]
  57. Jocher, G.; Chaurasia, A.; Stoken, A.; Borovec, J.; Kwon, Y.; Michael, K.; Fang, J.; Yifu, Z.; Wong, C.; Montes, D.; et al. ultralytics/yolov5: v7. 0-YOLOv5 SOTA Realtime Instance Segmentation; Zenodo: Geneva, Switzerland, 2022. [Google Scholar] [CrossRef]
  58. Terven, J.; Córdova-Esparza, D.M.; Romero-González, J.A. A comprehensive review of YOLO architectures in computer vision: From yolov1 to yolov8 and yolo-nas. Mach. Learn. Knowl. Extr. 2023, 5, 1680–1716. [Google Scholar] [CrossRef]
  59. Zhang, H.; Cisse, M.; Dauphin, Y.N.; Lopez-Paz, D. mixup: Beyond empirical risk minimization. arXiv 2018, arXiv:1710.09412. Available online: http://arxiv.org/abs/1710.09412 (accessed on 24 May 2025).
  60. Xu, R.; Lin, H.; Lu, K.; Cao, L.; Liu, Y. A forest fire detection system based on ensemble learning. Forests 2021, 12, 217. [Google Scholar] [CrossRef]
  61. Everingham, M.; Eslami, S.A.; Van Gool, L.; Williams, C.K.; Winn, J.; Zisserman, A. The pascal visual object classes challenge: A retrospective. Int. J. Comput. Vis. 2015, 111, 98–136. [Google Scholar] [CrossRef]
  62. Lin, T.Y.; Maire, M.; Belongie, S.; Hays, J.; Perona, P.; Ramanan, D.; Dollár, P.; Zitnick, C.L. Microsoft coco: Common objects in context. In Proceedings of the 13th European Conference on Computer Vision (ECCV 2014), Zurich, Switzerland, 6–12 September 2014; pp. 740–755. [Google Scholar]
  63. Wang, C.Y.; Mark Liao, H.Y.; Wu, Y.H.; Chen, P.Y.; Hsieh, J.W.; Yeh, I.H. CSPNet: A new backbone that can enhance learning capability of CNN. In Proceedings of the IEEE/CVF Conference on Computer Vision and Pattern Recognition (CVPR 2020), Washington, DC, USA, 14–19 June 2020; pp. 390–391. [Google Scholar]
  64. Koirala, A.; Walsh, K.B.; Wang, Z.; McCarthy, C. Deep learning-method overview and review of use for fruit detection and yield estimation. Comput. Electron. Agric. 2019, 162, 219–234. [Google Scholar] [CrossRef]
  65. Khanam, R.; Hussain, M. What is YOLOv5: A deep look into the internal features of the popular object detector. arXiv 2024, arXiv:2407.20892. [Google Scholar]
  66. Zheng, Z.; Wang, P.; Liu, W.; Li, J.; Ye, R.; Ren, D. Distance-IoU loss: Faster and better learning for bounding box regression. In Proceedings of the AAAI Conference on Artificial Intelligence, New York, NY, USA, 7–12 February 2020; pp. 12993–13000. [Google Scholar]
  67. Yang, G.; Wang, J.; Nie, Z.; Yang, H.; Yu, S. A lightweight YOLOv8 tomato detection algorithm combining feature enhancement and attention. Agronomy 2023, 13, 1824. [Google Scholar] [CrossRef]
  68. Shao, H.; Li, X.; Wang, F.; Sun, L.; Wang, C.; Hu, Y. Feasibility study on fruit parameter estimation based on hyperspectral LiDAR point cloud. J. Food Meas. Charact. 2024, 18, 7185–7197. [Google Scholar] [CrossRef]
  69. Wang, K.; Liew, J.H.; Zou, Y.; Zhou, D.; Feng, J. Panet: Few-shot image semantic segmentation with prototype alignment. In Proceedings of the IEEE International Conference on Computer Vision (ICCV 2019), Seoul, Korea, 20–26 October 2019; pp. 9197–9206. [Google Scholar]
  70. Make Sense AI. Available online: https://www.makesense.ai/ (accessed on 24 May 2025).
  71. Kawulok, M.; Ma’ckowski, M. YOLO-type neural networks in the process of adapting mathematical Graphs to the Needs of the Blind. Appl. Sci. 2024, 14, 11829. [Google Scholar] [CrossRef]
  72. Johnson, J.M.; Khoshgoftaar, T.M. Survey on deep learning with class imbalance. J. Big Data 2019, 6, 27. [Google Scholar] [CrossRef]
  73. Du, X.; Meng, Z.; Ma, Z.; Lu, W.; Cheng, H. Tomato 3D pose detection algorithm based on keypoint detection and point cloud processing. Comput. Electron. Agric. 2023, 212, 108056. [Google Scholar] [CrossRef]
  74. Zhang, J.; Tian, M.; Yang, Z.; Li, J.; Zhao, L. An improved target detection method based on YOLOv5 in natural orchard environments. Comput. Electron. Agric. 2024, 219, 108780. [Google Scholar] [CrossRef]
  75. Sun, L.; Yao, J.; Cao, H.; Chen, H.; Teng, G. Improved YOLOv5 network for detection of peach blossom quantity. Agriculture 2024, 14, 126. [Google Scholar] [CrossRef]
  76. Peng, H.; Li, Z.; Zou, X.; Wang, H.; Xiong, J. Research on Litchi image detection in orchard using UAV based on improved YOLOv5. Expert Syst. Appl. 2025, 263, 125828. [Google Scholar] [CrossRef]
  77. Cai, Z.; Vasconcelos, N. Cascade R-CNN: Delving into high quality object detection. In Proceedings of the IEEE Conference on Computer Vision and Pattern Recognition, Salt Lake City, UT, USA, 18–23 June 2018; pp. 6154–6162. [Google Scholar]
  78. Liu, S.; Qi, L.; Qin, H.; Shi, J.; Jia, J. Path aggregation network for instance segmentation. In Proceedings of the IEEE Conference on Computer Vision and Pattern Recognition, Salt Lake City, UT, USA, 18–23 June 2018; pp. 8759–8768. [Google Scholar]
  79. Lu, X.; Li, B.; Yue, Y.; Li, Q.; Yan, J. Grid R-CNN. In Proceedings of the IEEE/CVF conference on computer vision and pattern recognition, Long Beach, CA, USA, 15–20 June 2019; pp. 7363–7372. [Google Scholar]
  80. Crasto, N. Class imbalance in object detection: An experimental diagnosis and study of mitigation strategies. arXiv 2024, arXiv:2403.07113. [Google Scholar]
  81. Gezawa, A.S.; Liu, C.; Junejo, N.U.R.; Chiroma, H. The applications of 3D input data and scalability element by transformer based methods: A review. Arch. Comput. Methods Eng. 2024, 31, 4129–4147. [Google Scholar] [CrossRef]
  82. Jia, J.; Liang, W.; Liang, Y. A review of hybrid and ensemble in deep learning for natural language processing. arXiv 2023, arXiv:2312.05589. [Google Scholar]
  83. Kulik, S.; Shtanko, A. Experiments with neural net object detection system YOLO on small training datasets for intelligent robotics. In Advanced Technologies in Robotics and Intelligent Systems: Proceedings of ITR 2019; Springer: Berlin/Heidelberg, Germany, 2020; pp. 157–162. [Google Scholar]
  84. DosReis, D.H.; Welfer, D.; De Souza Leite Cuadros, M.A.; Gamarra, D.F.T. Mobile robot navigation using an object recognition software with RGBD images and the YOLO algorithm. Appl. Artif. Intell. 2019, 33, 1290–1305. [Google Scholar] [CrossRef]
  85. Sahin, O.; Ozer, S. Yolodrone: Improved Yolo architecture for object detection in drone images. In Proceedings of the 2021 44th International Conference on Telecommunications and Signal Processing (TSP), Brno, Czech Republic, 26–28 July 2021; pp. 361–365. [Google Scholar]
  86. Chen, C.; Zheng, Z.; Xu, T.; Guo, S.; Feng, S.; Yao, W.; Lan, Y. YOLO-Based UAV Technology: A Review of the Research and Its Applications. Drones 2023, 7, 190. [Google Scholar] [CrossRef]
  87. Dilmi, W.; ElFerik, S.; Ouerdane, F.; Khaldi, M.K.; Saif, A.-W.A. Technical aspects of deploying UAV and ground robots for intelligent logistics using YOLO on embedded systems. Sensors 2025, 25, 2572. [Google Scholar] [CrossRef]
Figure 1. The data collection site in an apple orchard for object detection.
Electronics 14 02545 g001
Figure 2. Sensor integration for data collection in an apple orchard for this study.
Electronics 14 02545 g002
Figure 3. Data acquisition using a handheld LiDAR setup in an apple orchard.
Electronics 14 02545 g003
Figure 4. Data pre-processing and deep learning (Yolov5) workflow for apple orchard object detection using LiDAR.
Electronics 14 02545 g004
Figure 5. YOLOv5 model architecture used for the detection of plants and other existing objects in the apple orchard.
Electronics 14 02545 g005
Figure 6. The preprocessing of LiDAR data for annotation using an open-source annotation tool. (a) Annotation of dataset for training and validation, (b) data training and validation by model run, (c) object detection.
Electronics 14 02545 g006
Figure 7. Information on the dataset: (a) category with quantity (the red square small image represents a visual icon used for class labeling), (b) object size distribution, (c) location distribution of category.
Electronics 14 02545 g007
Figure 8. Data training using pre-processed and manually annotated data.
Electronics 14 02545 g008
Figure 9. Pre-processed validation dataset used in the experiment for validation of the YOLOv5 model during apple tree detection: (a) divided dataset for validation, and (b) data validation with the prepared dataset.
Electronics 14 02545 g009
Figure 10. Training and validation loss curves of the YOLOv5 model using 100 epochs. The top row displays (a) the training loss for bounding box regression, (b) objectness prediction, and (c) classification. The bottom row shows the corresponding validation losses: (d) validation loss for bounding box regression, (e) objectness prediction, and (f) classification.
Electronics 14 02545 g010
Figure 11. Training performance metrics: (a) P_curve, (b) R_curve, (c) mAP@50 curve, and (d) mAP@50:95 curve. Blue lines with dots represents actual validation metric values recorded at each epoch which are the raw metric outputs (P, R, mAP) evaluated on the validation dataset. Orange dashed line represents smoothed trend line of the corresponding metric which helps to visualize the general learning progression by reducing noise and emphasizing the trend.
Electronics 14 02545 g011
Figure 12. Performance metrics after training image data converted from LiDAR point cloud data using the YOLOv5 algorithm belong to apple trees and other existing objects in the apple orchard. (a) P-confidence curve; (b) R-confidence curve; (c) P-R curve; and (d) F1-confidence curves.
Electronics 14 02545 g012
Figure 13. Analysis of the confusion matrix in a detailed evaluation for the classification performance of the model for different object categories.
Electronics 14 02545 g013
Figure 14. Validation results obtained for the apple tree detection model, where 0, 1, and 2 labels represent tree, water tank, and other object classes, respectively.
Electronics 14 02545 g014
Figure 15. Evaluation of P, R, F1-Score, and mAP for different object detection models, including the YOLOv5 model used in this study.
Electronics 14 02545 g015
Figure 16. Comparison of average precision (AP) across different object detectors on the COCO dataset.
Electronics 14 02545 g016
Table 1. Technical specifications of the LiDAR sensor used in this study.
ParameterSpecifications
Channels16
Range of measurement Up to 100 m
Range accuracy±3 cm (typical)
HFOV360°
VFOV30° (+15.0° to −15.0°)
Angular Resolution (vertical)2.0°
Angular Resolution (horizontal)0.1–0.4°
Rotation rate5–20 Hz
Wavelength (laser)903 nm
Power (consumption)8 W (typical)
Voltage (operating)9–18 V
Weight~830 g
Temperature (operating)−10 °C to +60 °C
Temperature (storage)−40 °C to +105 °C
Data interface100 Mbps ethernet
Data formatUDP packets with ToF, distance, rotation angles, and synchronized timestamps (µs resolution)
Measurement rate300,000 points/s (single return),
600,000 points/s (dual return)
ToF: Time of Flight; UDP: User Datagram Protocol.
Table 2. Final validation performance of the trained YOLOv5 model after 100 epochs.
EpochsGPU MemoryBox LossObjectness_LossClass LossInstancesSize
100/10012.6 GB0.0250.0280.001961216 × 1216
ClassImagesInstancesPRmAP@0.5mAP@0.5:0.95
All3009490.9030.8710.8920.478
Disclaimer/Publisher’s Note: The statements, opinions and data contained in all publications are solely those of the individual author(s) and contributor(s) and not of MDPI and/or the editor(s). MDPI and/or the editor(s) disclaim responsibility for any injury to people or property resulting from any ideas, methods, instructions or products referred to in the content.

