Abstract
Thangka images contain complex and interconnected elements that often share similar hues. Traditional segmentation algorithms struggle to capture fine details, which renders them poorly adaptable to this characteristic of Thangka images. Additionally, the highly saturated and high-contrast color features in Thangka images can induce issues such as “over-segmentation” or “edge misclassification” during the segmentation process. This paper proposes a semantic segmentation approach that integrates HRNet with a multi-scale convolutional attention mechanism to improve the accuracy of detail segmentation in Thangka imagery. A Coordinate Attention mechanism is integrated into the bottleneck section of HRNet to enhance the model’s perception of spatial and channel information. After feature extraction, a SENet module is appended to improve the model’s ability to adaptively adjust channel weights, whereas the HRNet framework is streamlined to optimize overall network efficiency. Moreover, an atrous convolutional attention mechanism module is used to capture and fuse multi-scale features from the processed feature maps, achieving more precise semantic segmentation. Compared with the original model, the modified model achieves a 32% reduction in parameter volume. Concurrently, the mIoU improves from 80.33% to 84.83% on the Thangka dataset and from 77.04% to 78.58% on the Cityscapes dataset.
1. Introduction
As an intangible cultural heritage, Thangka holds significant value for digital protection, inheritance, and academic research. Characterized by intricate visual elements, including divine figures, ritual implements, headgear, auspicious patterns, complex scene compositions, and rich color palettes, Thangka images exhibit profound complexity and artistic expressiveness [1].
The semantic segmentation of Thangka image elements aims to identify and isolate semantically specific elements accurately, enabling digital analysis, preservation, and research on Thangka art. However, traditional semantic segmentation methods perform inadequately on complex Thangka images because of their unique and intricate compositions. Digitized Thangka images often have low resolution, overlapping sophisticated patterns, and blurred edges. Conventional segmentation methods encounter challenges in processing the fine-grained structures of ritual implements (like the ridges of a vajra) and the intricate textures of the principal figure’s attire (such as layered jewelry). These elements require higher-performance and more accurate segmentation algorithms.
Existing works have constructed a headgear annotation dataset (552 pixel-level annotations). However, the annotation coverage of the principal figure’s full-body features and implementation categories is insufficient, which constrains the generalization ability of deep learning models [2]. Existing attention mechanisms (such as SE-Res2Net) focus on single-scale features, making it challenging to capture the multi-scale textures of implements [3]. Dimension-wise convolutions have improved edge precision but have not resolved the issue of multi-scale feature interaction, resulting in problems such as failure to detect small-scale implementations.
In recent years, research on neural network optimization has provided valuable insights into addressing the computational challenges associated with complex image processing. For example, X Wang et al. [4] proposed a method to optimize model efficiency by pruning redundant filters while preserving key features. This approach inspired our lightweight design; however, its focus differs from the semantic segmentation task of Thangka images. Our method combines multi-scale attention convolution with HRNet and removes some redundant convolution operations inherent in the HRNet model, thereby balancing the model’s computational efficiency and segmentation accuracy.
This paper proposes a semantic segmentation method based on HRNet [5] and multi-scale attention convolution to address these problems, with the following improvements:
(1) This paper constructs a new Thangka image dataset that focuses on principal figures and implements it. The images are upsampled by 15% and cropped to 512 × 512 pixels, after which semantic segmentation annotations are performed via the Labelme tool. This dataset, while maintaining the unique aesthetic and cultural features of Thangka, is suitable for semantic segmentation, laying a foundation for subsequent image processing and analysis.
(2) In this paper, a Coordinate Attention [6] mechanism is incorporated into the bottleneck section of HRNet. This incorporation enhances the model’s perception of spatial and channel information, allowing for accurate identification of the principal figure and its practical implementation in Thangka images, thereby resolving occlusion issues. After feature extraction, a SENet module [7] is appended to reinforce key feature channels. Application of the SENet module improves the adaptive regulation of channel weights, enabling effective discrimination among the principal figure, implements, and background, thereby achieving more accurate semantic segmentation.
(3) The HRNet architecture was optimized to be lightweight. Different convolutional kernels were employed in stages 1–4, effectively reducing the number of model parameters and the computational load. This design maintains model performance while being lightweight, ensuring that the mean intersection over union (mIoU) value remains stable or improves, facilitating efficient and precise image processing.
(4) The feature maps from HRNet were processed using Multi-Scale Attention Convolution (MSAC). In Thangka images, elements such as principal figures and implements vary in scale. The multi-scale atrous convolution module within MSAC can capture features at different scales, ensuring accurate segmentation and identification of both large-scale central objects and small-scale details during semantic segmentation. As a result, the segmentation accuracy is improved, and the model’s understanding of complex Thangka images is enhanced.
2. Related Work
Since the advent of Fully Convolutional Networks (FCN) [8] and U-Net [9], deep learning applications in image segmentation have undergone remarkable technological advancements and innovations. HRNet (High-Resolution network) has been a significant model in recent years. The specific model structure is shown in Figure 1. Its unique multi-resolution feature fusion mechanism has enabled it to perform exceptionally well across various segmentation tasks.
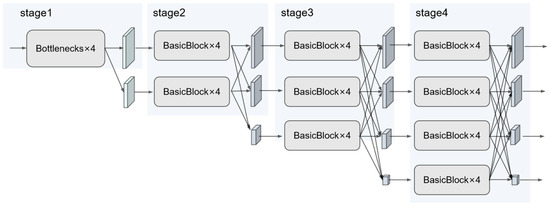
Figure 1.
HRNet architecture diagram [5].
HRNet’s core design philosophy involves maintaining high-resolution features and enabling multi-scale interaction. Traditional models, such as U-Net, lose detailed information due to the successive downsampling and upsampling in their encoder-decoder structures. In contrast, HRNet employs a parallel architecture with multi-resolution subnets. It keeps high-resolution feature streams in all four of its stages. It enhances semantic expression through cross-resolution feature fusion techniques, such as bilinear interpolation combined with convolution [10,11]. HRNet’s multi-stage parallel architecture, whose structure is shown in Figure 2, has subnetworks at different resolutions (e.g., 1/4, 1/8, 1/16, and 1/32) at each stage. These subnetworks exchange information via repeated multi-scale fusion modules [10,12]. Moreover, HRNet’s feature aggregation strategy upsamples low-resolution features to high-resolution features and then adds them element-wise. This element-wise addition operation preserves spatial details while incorporating deep semantics, significantly improving edge and small-object segmentation accuracy in datasets such as Cityscapes and ADE20K [13]. The model’s scalability further enables performance enhancement through subnet branch augmentation or the integration of attention mechanisms for refining complex-scene features.
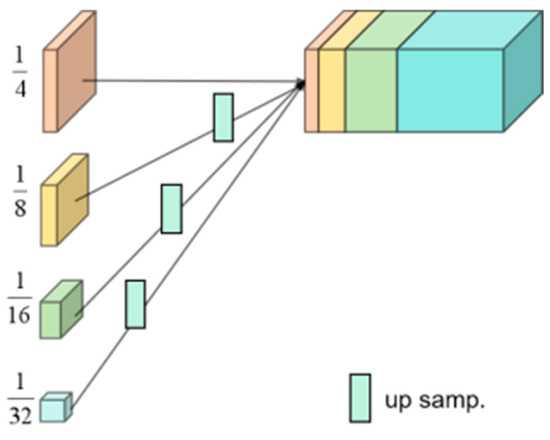
Figure 2.
HRNet upsampling layer diagram [5].
However, HRNet has several limitations. Its parallel multi-resolution architecture results in high computational complexity. Additionally, it has many parameters and a heavy computational load. For example, in the Cityscapes task, the computational complexity of HRNet is O(n), which is greater than that of models such as DeepLabV3+ [14]. Lite-HRNet, a lightweight variant, employs inverted residual blocks to reduce the computational load. However, this leads to an inevitable sacrifice of accuracy [15]. Compared with newer models such as SegNeXt, HRNet lacks a dynamic attention mechanism. Without integrated spatial attention modules, its robustness in the face of complex backgrounds is reduced. For example, the low contrast between lesion areas and normal tissue in medical image segmentation can cause mis-segmentation [16]. Multi-scale feature extraction is vital for achieving high-precision image understanding in computer vision tasks. Objects vary significantly in size, shape, and spatial distribution in natural scenes or complex images such as Thangkas. This makes it difficult for single-scale features to capture such diversity. Multi-scale feature extraction enables models to capture both the global context and local details across different receptive fields, thereby increasing their adaptability to complex scenes [17,18].
3. Methodology
This chapter discusses three key areas of enhancement in detail. The first is integrating attention mechanisms. Second, we look at optimizing HRNet for lightweight applications. Third, we explore the development of the MSAC multi-scale attention mechanism.
3.1. The Introduction of Attention Mechanisms
The HRNet model primarily consists of two basic modules: Bottleneck and BasicBlock. The BasicBlock module, which has a relatively simple design, is often used in the shallow parts of the network. In contrast, the more complex Bottleneck module is more suitable for the deeper layers of the network structure. While the traditional module excels at extracting local features, it is insensitive to spatial positional information. This limitation can lead to blurred edges or inaccurate localization when processing complex and intricate objects in Thangka images.
In recent years, various attention mechanisms have emerged to address similar challenges in computer vision tasks. Wang et al. proposed a graph attention-based approach that represents images as graph structures, where nodes capture local region features and attention mechanisms dynamically model inter-region relationships [19].
Another significant development comes from medical imaging research. Ates et al.’s dual cross-attention mechanism significantly improves segmentation accuracy [20]. This was further advanced by Luo et al.’s CTBANet framework, which combines convolutional transformers with enhanced bidirectional attention to facilitate more efficient information flow across different feature levels [21]. These innovations have demonstrated remarkable performance in segmenting fine-grained anatomical structures.
To address these limitations while leveraging the strengths of existing approaches, our work combines Coordinate Attention (CA) with Squeeze-and-Excitation (SE) mechanisms, specifically optimized for Thangka image characteristics. This hybrid approach inherits the dynamic feature weighting capability from graph-based methods while introducing specialized components for handling Thangka-specific visual patterns.
This study introduces the CA–Bottleneck structure to address this problem. The CA–Bottleneck structure incorporates the CA (Coordinate Attention) module, as depicted in Figure 3. The number of these modules has been reduced to two stacked units. By merging spatial coordinates and channel attention, the CA module can capture both long-range dependencies and local details simultaneously. As a result, it overcomes the issue of insufficient spatial information modeling in traditional methods. In significant object detection, the CA module outperforms SENet and CBAM [22]. It does this by enhancing the feature responses of the target region more precisely, thus reducing false detections [23,24].

Figure 3.
Improved bottleneck structure diagram.
The CA module creates spatial coordinate attention weights through global pooling in two separate directions: horizontally and vertically. Specifically, it averages the feature map in the horizontal and vertical directions to obtain two one-dimensional vectors. These vectors are then combined spatially and sent through a 1 × 1 convolutional layer to decrease the number of channels. Next, the received vector is encoded with spatial information from both the vertical and horizontal directions using batch normalization (BN) and a nonlinear activation function. After encoding, the system divides the feature into two parts. We adjust each part back to the number of channels of the input feature map via a 1 × 1 convolution. Finally, we perform normalization and weighted processing on these feature maps. Then, we apply these weights to each feature channel. This enables the model to locate and focus on the target region accurately.
Moreover, this study incorporates SENet (Squeeze-and-Excitation network). The aim is to optimize the weight allocation among channels further and increase the discriminability of features. SENet adjusts the channel weights to enhance the model’s sensitivity to critical channels. For example, in multi-branch semantic segmentation networks, the low-level feature fusion strategy of SENet enhances the modeling of relationships between channels. As a result, it dramatically improves the segmentation accuracy of ultra-high-definition images [25]. In the original HRNet, all feature channels are assigned equal weights, which limits the model’s ability to prioritize critical information effectively. In contrast, the SENet module analyses the global information for each channel to generate adaptive weights, dynamically adjusting their significance. These improvements result in notable enhancement in the performance of HRNet when processing images with abundant details and complex textures.
3.2. Lightweight Processing of the HRNet Architecture
Owing to its powerful multi-scale feature fusion ability, HRNet architecture is highly suitable for the semantic segmentation of main deities and ritual instruments in Thangka images. However, the large number of parameters and high computational complexity present difficulties for its deployment and efficiency in practical applications. Therefore, this study conducts a lightweight transformation of the HRNet architecture. Mainly, adjusting the number of convolutional layers significantly reduces the model’s parameter count while maintaining or even improving segmentation performance. Figure 4 shows the enhanced HRNet architecture.
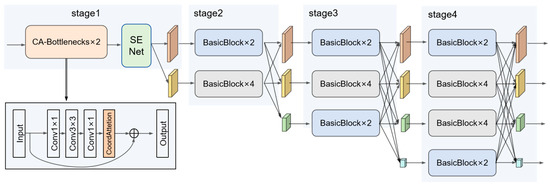
Figure 4.
Enhanced HRNet architecture.
To make the model more lightweight, we adjust the convolutional layers in HRNet. Specifically, we halved the number of CA–Bottlenecks in the first layer and made similar reductions to those in the last layers of stages three and four. These strategic adjustments not only help decrease the computational load, but also prevent overfitting caused by excessive layers. Theoretical analysis and experimental verification both indicate that modifications to the number of convolutional layers have a significant impact on segmentation performance. As shown in Figure 5, different setups of convolutional layers are presented along with their corresponding parameter counts and mIoU values, clearly demonstrating the effectiveness of our lightweight approach.
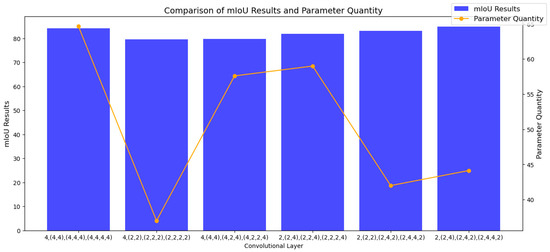
Figure 5.
Parameter quantity and mIoU comparison for various convolutional layer depths.
In practical deployment scenarios, such as on-edge devices with limited computational resources or in real-time segmentation applications, there is a crucial trade-off between model size, speed, and accuracy. A smaller model size (lower parameter quantity) generally leads to faster inference speed, but it may sacrifice accuracy if not properly optimized. Conversely, a larger model might offer higher accuracy, but at the cost of slower speed and more computational resources.
Figure 5 clearly presents a comparison of the mIoU values and parameter quantities for various convolutional layer setups in HRNet-w48. The blue bars represent the mIoU values, which reflect the segmentation accuracy, whereas the orange line indicates the parameter quantity. Each data point corresponds to a specific configuration of a convolutional layer.
As illustrated in Figure 5, by carefully adjusting the number of convolutional layers in HRNet-w48, our proposed model effectively reduces the parameter count from the original 64.657 million to 44.136 million, a 32% decrease. Moreover, the mIoU value increased from 84.22% to 84.83%, demonstrating a notable enhancement in segmentation performance. This finding indicates that our model successfully achieves a better balance between model complexity and accuracy. Several key factors contribute to the improvement in segmentation performance due to the adjustment of the number of convolutional layers:
Reducing Redundant Computations: An excessive number of convolutional layers can give rise to unnecessary computations, thus increasing the complexity of the model. A carefully thought-out reduction in the number of layers helps avoid such redundancy, which in turn increases the model’s computational efficiency.
Optimizing Feature Fusion: By incorporating the CA module and SENet during lightweight processing, the model enhances the dependencies between features and the weight distribution. As a result, we improve the discriminability and fusion effectiveness of the features. This optimization reduces the number of parameters while maintaining and potentially enhancing the segmentation performance.
Avoiding Overfitting: Reducing the number of convolutional layers helps prevent the model from overfitting. This improvement in the model’s generalization ability yields better segmentation results in real-world applications. In summary, the carefully planned adjustment of the convolutional layers in HRNet-w48 significantly reduces the number of model parameters and increases the segmentation performance. It provides a practical and lightweight approach for the semantic segmentation of the principal deities and ritual instruments in Thangka images.
3.3. Establishment of the MSAC Attention Mechanism
As shown in Figure 6, this paper proposes a model based on HRNet that combines the CA module and SENet to create the enhanced LA-HRNet network. First, the input Thangka image is processed by this network to extract features. LA-HRNet generates four feature maps with different resolutions, marked as F_i (recorded as F1, F2, F3, and F4). These feature maps are then input into the Multi-Scale Attention Convolution (MSAC) mechanism. In the MSAC, each feature map is processed using convolutional kernels with different dilation rates, allowing the network to capture various receptive fields.

Figure 6.
Schematic representation of the model’s entire framework.
After that, the features extracted from the three branches are concatenated along the channel dimension, generating a comprehensive feature map F. Mathematically, this final feature map is expressed by Equation (1). This demonstrates the network’s ability to effectively fuse information among the generated feature maps and improve feature representation through attention mechanisms.
In this context, (X) refers to the input feature map, denotes a convolutional kernel, indicates a convolutional kernel with a dilation rate of 6, and signifies a convolutional kernel with a dilation rate of 12. The introduction of spatially dilated convolutions allows expansion of the receptive field without increasing the computational cost, thereby enhancing the model’s perception capabilities across different scales. The feature maps generated through these dilated convolution operations are fused via concatenation techniques, which results in the integration of multi-scale features.
Parallel spatial attention and channel attention can be executed simultaneously on different computational resources, thereby optimizing resource utilization and enhancing the model’s training and inference efficiency. Therefore, we choose to add parallel spatial attention and channel attention after the multi-scale process. The concatenated feature map F undergoes a fusion process involving channel attention and spatial attention mechanisms [26]. Within the channel attention mechanism, global average pooling is initially applied to the multi-scale feature maps, producing a global descriptor for each channel, denoted as Favg. This is followed by processing through two fully connected layers, with ReLU and Sigmoid activation functions employed sequentially. Ultimately, channel weighting is conducted as illustrated in Equations (2) and (3).
In the abovementioned equations, Concat refers to merging different data along the channel dimension, signifies the ReLU activation function, denotes the Sigmoid activation function, FC stands for the fully connected layer, and indicates element-by-element multiplication.
This mechanism is designed to emphasize the key visual attributes of the Buddha statue, such as intricate facial details and hand postures, while appropriately suppressing less critical background information. The spatial attention mechanism begins with global pooling across the entire image, followed by a 1 × 1 convolution, application of the Sigmoid activation function, and finally, application of spatial weights. This process is detailed in Formulas (4) and (5).
The output feature maps produced by the channel attention and spatial attention mechanisms are combined via an element-wise addition operation, as expressed in Formula (6):
The final output of the feature map undergoes dimensionality reduction via a 1 × 1 convolution process.
The spatial attention mechanism enables the model to focus on significant regions within Thangkas, particularly the body of the primary deity and the intricate designs of ritual objects, ensuring precise identification and segmentation of these crucial areas during the segmentation process.
Following the previously described steps, a series of feature maps enhanced by the MSAC is obtained and labeled F1′, F2′, F3′, and F4′. These feature maps are then upscaled to a higher resolution and subjected to further feature compression and linear combination via 1 × 1 convolution. This ensures that the output feature maps from the model match the resolution of the input image, thereby retaining a wealth of detail. In the final step, 1 × 1 convolution is applied to classify each pixel, yielding a semantic segmentation map that identifies the category of each pixel in the image.
4. Experimental Setup and Analysis
This section provides a comprehensive description of the dataset construction and the experimental setup used in our research. Additionally, we describe the comparative experiments and ablation studies conducted to validate our approach.
4.1. Dataset Description
People primarily store Thangka images in museums, temples, or private collections. However, these environments may not provide optimal preservation conditions, leading to degradation, fading, and uneven lighting. Moreover, due to historical factors, some Thangka images have been stored in damp or poorly lit environments, reducing their quality.
These challenges contribute to the limited size of Thangka image datasets and inconsistent image quality. In this study, 323 out of the 7800 collected Thangka images were annotated for training and evaluating the model. Despite the limited dataset size, it covers a range of styles and periods, providing representative examples of Thangka art.
Our research team selected Thangka images featuring familiar ritual implements. These images were designated as the subjects for semantic segmentation research. In Thangka images, although these implements are generally arranged relatively consistently around the central deity, they exhibit a wide variety of shapes, highly intricate designs, and complex edges. This diversity and complexity present a substantial challenge for the model in accurately segmenting these objects.
The final selection identified 12 common ritual implements, including the alms bowl, vajra (dorje), vajra bell (ghanta), wisdom sword (flaming sword), lotus, lotus sutra, kapala (skull cup), eight-spoked dharma wheel, Kartika (ritual chopper), vishvavajra (crossed vajra), Victory Banner (Dhvaja), and Buddhist sutra. We collated the images and selected 323 images as the preliminary dataset for semantic segmentation. We detail the quantitative distribution of these ritual implements across the images in Table 1.

Table 1.
Distribution of the number of ritual implements.
In this research, we took several steps to compile the dataset. These steps are visually depicted in Figure 7.
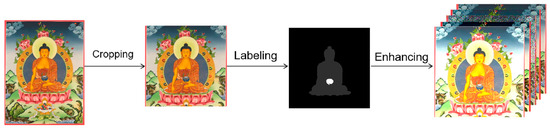
Figure 7.
Dataset processing workflow.
4.1.1. Image Cropping
The collected Thangka images were resized to meet the input specifications of the deep-learning models, so they were resized to 512 × 512 pixels. Thangka artworks feature a unique composition, where central cropping might lead to the loss of critical details, especially those related to the main deity and ritual implements. Therefore, a specialized cropping method was adopted. First, the images were shifted upward by 15%, and then cropping was performed based on this new central point. This approach effectively preserved key elements, particularly the ritual implements surrounding the main deity. After cropping, the LabelMe tool—enhanced with the AI large model SAM [27]—was used to conduct pixel-level semantic annotation of the ritual implements in each Thangka image.
4.1.2. Data Augmentation and Preprocessing
Thangka images often have issues such as uneven lighting, color fading, and image blurriness due to limitations of the preservation environment. These problems restrict the performance of deep learning models in Thangka recognition tasks. To address these issues, considering the unique characteristics of Thangka images, the authors of this study selected five data augmentation strategies. These strategies include brightness adjustment, contrast enhancement, noise injection, saturation transformation, and image sharpening. These methods aim to increase the diversity and richness of the dataset. Moreover, they preserve the artistic characteristics of Thangka images, thereby enhancing the model’s generalization ability and training effect.
During the preprocessing stage of the experiment, traditional operations such as scaling and rotation were still carried out. This ensures that the data meets the input requirements of the deep learning model and maintains data consistency. When performing these preprocessing steps, special attention was given to minimizing negative impacts on the semantic information of the data, ensuring that the model could accurately capture the key features in the data.
The experimental results demonstrate that the proposed method has shown significant improvement in the Thangka image recognition task. This provides technical support for the protection and inheritance of Thangka images. Moreover, it also offers a reference for the processing and analysis of similar historical and cultural images. Figure 8 presents illustrations of the augmented images.

Figure 8.
Image after data enhancement.
4.2. Experimental Setup
We experiment in an environment with an NVIDIA GeForce RTX 3090 graphics card. The environment was supported by the Intel® Math Kernel Library and Python 3.8.10. We used the deep-learning framework PyTorch 1.10.0. For computational acceleration, we used CUDA 11.3 and CuDNN 8.2. We handled image processing with TorchVision 0.11. 1+cu113 and OpenCV 4.10.0. We ran the experiments on an NVIDIA RTX 3090 GPU.
We regulated GPU memory consumption. We adjusted the batch size and optimizer configurations to maintain uniform resource usage. The model used the SGD optimizer with an initial learning rate of 0.01 and a momentum of 0.9 to update the network parameters during training. We applied a range of data augmentation techniques to the dataset. This reflects the intricacies of Thangka images in practical applications. Additionally, we implemented the cross-entropy loss function to improve the segmentation results.
4.3. Experimental Evaluation Criteria
This research used the mIoU and mB-Fscore as evaluation metrics. In semantic segmentation, the mIoU is a crucial indicator for assessing the performance of a model’s segmentation capabilities, as it quantifies the extent of overlap between the predicted and actual segments. The calculation of the IoU is presented in Formula (8).
TPi indicates the number of true positive pixels for category i, referring to the pixels correctly identified as belonging to that category by the model; FPi signifies the number of false positive pixels, which are the pixels incorrectly identified as part of that category; FNi denotes the number of false negative pixels, those that the model should have identified as belonging to the category but failed to. The mIoU is determined by calculating the average IoU values across all categories, as depicted in the Formula (9).
Here, N represents the total number of categories. In the semantic segmentation of Thangka images, accurately and segmenting the central figure and ritual objects in detail is highly important. Since the positions of these objects are relatively stable, the mIoU can effectively mirror the model’s performance in segmenting these targets. The model understands the spatial relationships between the central figure and ritual objects and extracts relevant features. As a result, it shows good segmentation performance, especially when handling the complex edges and shapes of ritual objects.
In this study, in addition to using mIoU as the primary evaluation metric for segmentation performance, we introduced the mB-Fscore as a new evaluation metric to assess the model’s ability to segment object boundaries more comprehensively. The mB-Fscore is the average boundary F-score across all categories, and it effectively reflects the balance between precision and recalls in boundary localization. The calculation process first extracts the boundary regions of the predicted results and the ground truth through dilation operations. Then, it computes the Boundary IoU between the predicted and ground truth boundaries. Finally, it calculates the Boundary F-score for each category based on precision and recall. The final mB-Fscore is the average boundary F-score across all categories. The calculation formulas are as follows:
where represents the total number of categories and denotes the Boundary F-score of the -th category, which is calculated as
where represents the Boundary Intersection over Union for the -th category, calculated as
where is the number of intersecting pixels between the predicted and ground truth boundary regions for the -th category, is the number of union pixels, and is a small constant to prevent division by zero (typically set to ).
4.4. Quantitative Evaluation of Algorithm Performance
4.4.1. Comparison with Baseline Models
In the experimental section, we compared the model proposed in this paper with several classical semantic segmentation models, including CCNet [28], DeepLabV3+ [29], PSPNet [30], Segformer (B4) [31], PIDNet-L [32], and Swin-Transformer [33]. Figure 9 illustrates the specific performance of these different models in the semantic segmentation task of Thangka images.

Figure 9.
Visualization results for the Thangka dataset, where the blue and green areas represent different ritual objects.
The visualization results revealed that CCNet and DeepLabV3+ exhibited blurring when segmenting character edges. This was especially noticeable in areas where hands and ritual objects made contact. Specifically, CCNet cannot distinguish the boundaries between hands and ritual objects. In contrast, the model proposed in this study achieved more accurate segmentation. It delineated the boundaries between ritual objects and hands. The edge handling was smoother and accurately captured the image’s intricate details. PSPNet, Segformer, and HRNet encounter difficulties when segmenting ritual objects. They either produced incomplete shapes or had unclear edges. In contrast, the model presented in this paper accurately segments the shapes of ritual objects. It also performs fine-grained processing of the clothing edges beneath the characters.
Moreover, the model proved more resilient when handling background information. It avoids misclassifying background elements as target regions, demonstrating its ability to preserve details. Table 2 presents the specific results of the comparison models based on the evaluation metrics. Although the method proposed in this paper has achieved significant improvements in overall performance, there are still issues with insufficiently precise edge segmentation in complex regions where the hand contacts the instrument. Additionally, the edge details of the instrument are not adequately processed, and there remains a considerable gap between the segmentation accuracy and the ideal state. In some cases, the presentation of details has not fully met the standards of precise segmentation. These limitations not only indicate the current constraints of the model, but also guide subsequent research efforts.
Table 2.
Comparison of the baseline model results.
Table 2 shows that the model proposed in this paper achieves a better balance among accuracy, speed, and lightness. Compared to PIDNet-L, which is an outstanding lightweight model, although the number of parameters in the model proposed in this paper increases slightly, significant improvements in key indicators are achieved. The mIoU of our model reached 84.83%, which is 10.84% higher than that of PIDNet-L (73.99%). In terms of the new evaluation index, the boundary F-score (mB-Fscore), our model achieves 56.87%, surpassing PIDNet-L’s 40.91% by 15.96 percentage points. This fully demonstrates the marked effectiveness of the lightweight improvements made in this paper, where a small increase in parameters has led to a substantial rise in segmentation accuracy.
Compared with SegFormer-B4, the advantages of our model are even more pronounced. SegFormer-B4 has 62.854 M parameters, whereas our model reduces this by 28%, bringing it down to 44.136 M. Meanwhile, in terms of the mIoU index, our model outperforms SegFormer-B4 by 2.14%, with 84.83% compared with 82.69%. For the boundary F-score, our model leads to an improvement of 3.05%. This indicates that the model proposed in this paper not only has lightweight characteristics, but also surpasses similar models in accuracy, providing a more efficient and precise solution for Thangka image segmentation scenarios.
4.4.2. Ablation Studies
This study carried out ablation experiments to verify the effectiveness of each component on the model’s performance. These experiments investigated the influence of several crucial elements on the model’s performance. We show the model results with the same resource consumption in Table 3. The attention mechanism module combines the CA and SENet components, incorporates the MSAC mechanism, and utilizes the lightweight HRNet-w48 architecture. We present the detailed specific results in Table 3.
Table 3.
Comparison of ablation results.
When only the attention mechanism module was added to the model, the mIoU improved to 83.88%, and the mB-Fscore reached 55.42%. This represents a significant improvement in performance over the baseline model. After the MSAC module was incorporated, the mIoU of the model increased to 83.72%, and the mFscore increased to 54.42%. These improvements are notable compared with those of the baseline model. The MSAC module plays a crucial role in capturing and integrating multi-scale features, enhancing the model’s semantic segmentation accuracy.
However, when we integrate the attention mechanism and MSAC modules into the model architecture, the additional computational cost causes the model inference time to increase from 0.0642 s to 0.0734 s. To address this issue, we further reduce HRNet by removing redundant convolution blocks.
Consequently, the model’s mIoU increased to 84.83%, and the inference time decreased to 0.0574 s. This demonstrates that the model designed in this paper can perform more precise semantic image segmentation and exhibits high computational efficiency.
This study selected the HRNet model as the foundation, primarily to leverage its multi-scale feature fusion capability, thereby improving the mIoU metric, particularly in achieving good performance for complex texture and fine-grained segmentation tasks. However, the current model still has deficiencies in computational efficiency and does not meet the requirements for real-time segmentation. This study aims to optimize the model structure further and implement lightweight improvements while ensuring accurate segmentation. In the future, the focus will be on exploring how to maintain high precision while improving the model’s inference speed to meet the dual requirements of real-time performance and accuracy in practical applications.
This paper also makes a visual comparison of heatmaps. As shown in Figure 10. In this way, it more intuitively shows the feature extraction effects of HRNet under different attention mechanisms. The results show that the original HRNet model has certain limitations in feature extraction. However, the model’s feature extraction ability and recognition accuracy significantly improved after the introduction of the attention mechanism, as shown in Figure 7.
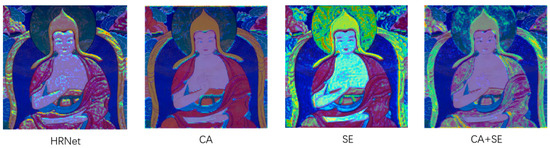
Figure 10.
Heatmaps of different attention mechanisms.
The figure shows that the CA module effectively mitigated background interference by accentuating local features. This allowed the model to concentrate more intently on detailed information within the target area. In contrast, the SE module adjusts the weights of the feature channels. This bolsters the representation capacity of global features, thereby enhancing the overall performance of the model. When the CA and SE modules are employed concurrently, the model can fully exploit the advantages of both local and global features. Consequently, this leads to further enhancement of its performance.
With respect to the attention mechanism, this paper conducted comparative experiments on different attention mechanisms under the same model structure framework, as shown in Table 4.
Table 4.
Comparison results of the mIoU after the addition of different attention mechanisms.
Our attention combination scheme achieves the best results for the mIoU metric. As shown in Table 4, it reached 83.88%, surpassing other attention mechanisms, such as ECA [34], ELA [35], and CBAM [22]. This finding indicates that the attention combination strategy that we designed has obvious advantages in improving the performance of the model.
As shown in Table 4, the lightweight modules ECA and ELA have certain advantages in terms of computational efficiency; however, their feature modelling capabilities are relatively limited, making it challenging for them to capture multi-scale targets in complex scenes effectively. However, although the CBAM performs well in terms of performance, its structure is relatively complex and has a relatively high computational cost, making it unsuitable for lightweight deployment. Therefore, oursATT maintains lightweight characteristics while effectively balancing the modeling of local and global features, achieving higher segmentation accuracy and better overall performance. This demonstrates the superiority of oursATT in image segmentation tasks.
Table 5 presents a comparison of the mIoU values for each category within the dataset created in this study. It compares the HRNet baseline model with the improved model, demonstrating the improvement effect and the extent of enhancement. Specifically, for all small objects belonging to the ritual implementation categories, the mIoU increased from 77.50% to 82.72%. This significant improvement highlights the model’s enhanced ability to segment multi-scale targets in this paper.
Table 5.
Comparison of the mIoUs for all categories in the Thangka dataset between the proposed and baseline models.
As the table shows, the improved model demonstrated a substantial increase in mIoU scores across all categories. Notably, for small target categories such as “Vajra” and “Ghanta”, the mIoU values significantly improve. The mIoU for “Vajra” increased from 67.69% to 75.42%, whereas for “Ghanta” it increased from 70.45% to 78.01%. This finding indicates that the Coordinate Attention mechanism effectively captures fine details within the Thangka images. The SENet module enhances the model’s perception of key features. The robustness of the segmentation was improved by adaptively adjusting the channel weights. The MSAC attention mechanism enhances the model’s perception of the image details. Fusing contextual information from various scales increases segmentation accuracy and robustness. The table shows that large target categories such as the “Victory Banner” (Dhvaja) and “Sutra” are also better segmented in the improved model. The mIoU scores increased from 83.72% and 82.12% to 88.38% and 86.01%, respectively. Although there are some fluctuations in the segmentation results of certain ritual implementations, the overall trend is positive.
In conclusion, the improved HRNet-based method in this study effectively enhances the semantic segmentation performance regarding the principal deities and ritual implements in Thangka images by introducing multiple innovative mechanisms. Whether the targets are large or small, the improved model can yield more accurate and robust recognition outcomes. This offers substantial technical support for the analysis and comprehension of Thangka images.
4.5. Public Dataset Experimental Comparison
This study conducted additional comparative experiments using the publicly available Cityscapes dataset [36]. Cityscapes is a semantic segmentation dataset centered on urban scenes. It contains numerous high-resolution street scene images with an image size of 512 × 1024. The dataset encompasses a wide range of complex urban environments, including vehicles, pedestrians, roads, and buildings. The dataset consisted of 30 labeled categories, 19 of which were used for evaluating semantic segmentation tasks. Due to their extensive annotations and high-resolution images, cityscapes have been widely used to assess the performance of semantic segmentation models, particularly in research related to autonomous driving and understanding urban scenes.
After the HRNet model was improved, it also demonstrated excellent performance on the Cityscapes dataset. By more effectively capturing multi-scale features and enhancing channel information, the improved model achieves higher segmentation accuracy and better detail capture capabilities when dealing with complex urban street scenes, particularly when handling boundaries and small objects. These enhancements enable the model to perform better in the semantic segmentation task on the Cityscapes dataset, as shown in the visualization results in Figure 11.
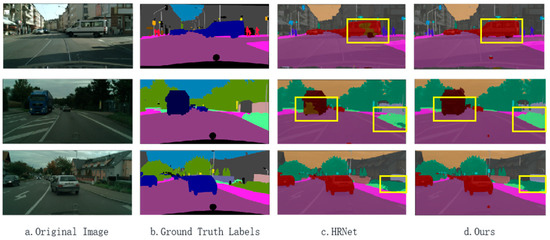
Figure 11.
The Cityscapes dataset results in visualization. Yellow boxes highlight areas where segmentation differences are most noticeable.
The diagram of the baseline model indicates that the HRNet baseline model cannot accurately recognize all objects. In particular, it struggled with distant vehicles and small objects, such as pedestrians and traffic signs, resulting in areas of incorrect classification. Conversely, the improved model is capable of detecting objects more accurately. It can identify all vehicles on the road, encompassing distant cars and large nearby vehicles. The smoother edges of the objects in the improved model make the boundaries of each object more distinct, thereby reducing mislabeling. Moreover, the enhanced model is better at recognizing background elements, such as pedestrians and trees, and offers more comprehensive scene comprehension. Table 6 compares the mIoU, Lrschd, and device of the different models on the Cityscapes dataset. Among them, PSPNet, GCNet [37], and CCNet use data from the mmsegmentation platform [38]. The improved model in this paper also has certain advantages on this dataset.
Table 6.
Publishing the dataset experimental results.
5. Conclusions
This paper proposes a lightweight, enhanced semantic segmentation model for Thangka images, built upon a high-resolution network (HRNet). The segmentation accuracy of the principal deities and ritual implementations was significantly enhanced by integrating the Coordinate Attention mechanism, multi-scale MSAC module, and channel dynamic weighting (SENet).
Compared to the baseline HRNet model, which lacks these integrated mechanisms, the improved scheme reduces the number of parameters by 35% and achieves an mIoU of 79.65% on a self-built Thangka dataset. This dataset comprises 323 annotated images, covering eight major Tibetan Buddhist styles. Additionally, the overfitting problem in small-sample training was effectively alleviated by implementing data augmentation strategies.
We plan future work to focus on breakthroughs in three directions. First, we optimize edge segmentation algorithms for complex contact regions to increase precision in ritual object delineation, particularly when addressing deficiencies in hand-object interactions and fine edge details. Second, we expanded the datasets to include rare patterns of faded or damaged artifacts, improving model generalizability in challenging scenarios. Third, computational efficiency can be enhanced through model optimization or the use of lightweight architectures, enabling the efficient deployment of low-power mobile devices for more accessible digital preservation of cultural heritage.
Author Contributions
Conceptualization, T.W.; methodology, J.W.; software, X.G.; validation, T.D., C.W. and Y.W.; formal analysis, X.G.; investigation, J.W.; resources, T.W.; data curation, T.D., C.W. and Y.W.; writing—original draft preparation, J.W.; writing—review and editing, T.W.; visualization, J.W.; supervision, T.W.; project administration, T.W.; funding acquisition, T.W. All authors have read and agreed to the published version of the manuscript.
Funding
This research was funded by the National Natural Science Foundation of China grant number 62166035, the Fundamental Research Funds for the Central Universities grant number 31920240091, and the Natural Science Foundation of Gansu Province grant number 25JRRA991. And The APC was funded by the National Natural Science Foundation of China grant number 62166035.
Data Availability Statement
Conflicts of Interest
The authors declare no conflict of interest.
References
- Jackson, D.P.; Jackson, J.A. Tibetan Thangka Painting: Methods and Materials; Snow Lion Publications: Ithaca, NY, USA, 1988. [Google Scholar]
- Meng, J.; Hu, W.; Jia, L.; He, G.; Xue, P. A semantic segmentation model for headdresses in Thangka image based on line drawing augmentation and spatial prior knowledge. IEEE Sens. J. 2021, 21, 25161–25170. [Google Scholar] [CrossRef]
- Fu, W.; Liu, Z.; Cai, C.; Xue, Y.; Ren, J. Damage Diagnosis of Frame Structure Based on Convolutional Neural Network with SE-Res2Net Module. Appl. Sci. 2023, 13, 2545. [Google Scholar] [CrossRef]
- Wang, X.; Zheng, Z.; He, Y.; Yan, F.; Zeng, Z.; Yang, Y. Progressive local filter pruning for image retrieval acceleration. IEEE Trans. Multimed. 2023, 25, 9597–9607. [Google Scholar] [CrossRef]
- Sun, K.; Xiao, B.; Liu, D.; Wang, J. Deep high-resolution representation learning for human pose estimation. In Proceedings of the IEEE/CVF Conference on Computer Vision and Pattern Recognition, Long Beach, CA, USA, 15–20 June 2019; pp. 5693–5703. [Google Scholar]
- Hou, Q.; Zhou, D.; Feng, J. Coordinate attention for efficient mobile network design. In Proceedings of the IEEE/CVF Conference on Computer Vision and Pattern Recognition, Nashville, TN, USA, 19–25 June 2021; pp. 13713–13722. [Google Scholar]
- Hu, J.; Shen, L.; Sun, G. Squeeze-and-excitation networks. In Proceedings of the IEEE Conference on Computer Vision and Pattern Recognition, Salt Lake City, UT, USA, 18–22 June 2018; pp. 7132–7141. [Google Scholar]
- Long, J.; Shelhamer, E.; Darrell, T. Fully convolutional networks for semantic segmentation. In Proceedings of the IEEE conference on computer vision and pattern recognition, Boston, MA, USA, 7–12 June 2015; pp. 3431–3440. [Google Scholar]
- Ronneberger, O.; Fischer, P.; Brox, T. U-net: Convolutional networks for biomedical image segmentation. In Proceedings of the Medical Image Computing and Computer-Assisted Intervention–MICCAI 2015: 18th International Conference, Munich, Germany, 5–9 October 2015; Proceedings, Part III 18. pp. 234–241. [Google Scholar]
- Zhou, L.; Wang, R.; Zhang, L. Accurate Robot Arm Attitude Estimation Based on Multi-View Images and Super-Resolution Keypoint Detection Networks. Sensors 2024, 24, 305. [Google Scholar] [CrossRef] [PubMed]
- Zhao, L.; Chen, Z. CRNet: Context feature and refined network for multi-person pose estimation. J. Intell. Syst. 2022, 31, 780–794. [Google Scholar] [CrossRef]
- Liu, M. Multi-scale oriented object detection based on improved RoI Transformer in remote sensing images. J. Appl. Opt. 2023, 44, 13–16. [Google Scholar]
- Sung, C.; Kim, W.; An, J.; Lee, W.; Lim, H.; Myung, H. Contextrast: Contextual contrastive learning for semantic segmentation. In Proceedings of the IEEE/CVF Conference on Computer Vision and Pattern Recognition, Seattle, WA, USA, 17–18 June 2024; pp. 3732–3742. [Google Scholar]
- Chen, L.-C.; Papandreou, G.; Schroff, F.; Adam, H. Rethinking atrous convolution for semantic image segmentation. arXiv 2017, arXiv:1706.05587. [Google Scholar]
- Hou, Q.; Li, K.; Xu, Z. Optimization of ICANet lightweight human pose estimation based on HRNet. J. Phys. Conf. Ser. 2023, 2595, 012005. [Google Scholar] [CrossRef]
- Shi, J.; Ruan, S.; Zhu, Z.; Zhao, M.; An, H.; Xue, X.; Yan, B. Predictive accuracy-based active learning for medical image segmentation. arXiv 2024, arXiv:2405.00452. [Google Scholar]
- Huang, H.; Lan, Y.; Deng, J.; Yang, A.; Deng, X.; Zhang, L.; Wen, S. A semantic labeling approach for accurate weed mapping of high resolution UAV imagery. Sensors 2018, 18, 2113. [Google Scholar] [CrossRef] [PubMed]
- Xie, X.; Xu, L.; LI, X.; Wang, B.; Wan, T. A high-effective multitask surface defect detection method based on CBAM and atrous convolution. J. Adv. Mech. Des. Syst. Manuf. 2022, 16, JAMDSM0063. [Google Scholar] [CrossRef]
- Wang, H.; Liu, J.; Tan, H.; Lou, J.; Liu, X.; Zhou, W.; Liu, H. Blind image quality assessment via adaptive graph attention. IEEE Trans. Circuits Syst. Video Technol. 2024, 34, 10299–10309. [Google Scholar] [CrossRef]
- Ates, G.C.; Mohan, P.; Celik, E. Dual cross-attention for medical image segmentation. Eng. Appl. Artif. Intell. 2023, 126, 107139. [Google Scholar] [CrossRef]
- Luo, S.; Pan, L.; Jian, Y.; Lu, Y.; Luo, S. CTBANet: Convolution transformers and bidirectional attention for medical image segmentation. Alex. Eng. J. 2024, 88, 133–143. [Google Scholar] [CrossRef]
- Woo, S.; Park, J.; Lee, J.-Y.; Kweon, I.S. Cbam: Convolutional block attention module. In Proceedings of the European Conference on Computer Vision (ECCV), Munich, Germany, 8–14 September 2018; pp. 3–19. [Google Scholar]
- Shi, L.; Wang, G.; Mo, L.; Yi, X.; Wu, X.; Wu, P. Automatic segmentation of standing trees from forest images based on deep Learning. Sensors 2022, 22, 6663. [Google Scholar] [CrossRef]
- Wu, Y.; Wu, Y. Application of Split Coordinate Channel Attention Embedding U2Net in Salient Object Detection. Algorithms 2024, 17, 109. [Google Scholar] [CrossRef]
- Yuan, Y.; Cui, J.; Liu, Y.; Wu, B. A Multi-Step Fusion Network for Semantic Segmentation of High-Resolution Aerial Images. Sensors 2023, 23, 5323. [Google Scholar] [CrossRef]
- Yan, G.; Jing, H.; Li, H.; Guo, H.; He, S. Enhancing building segmentation in remote sensing images: Advanced multi-scale boundary refinement with MBR-HRNet. Remote Sens. 2023, 15, 3766. [Google Scholar] [CrossRef]
- Kirillov, A.; Mintun, E.; Ravi, N.; Mao, H.; Rolland, C.; Gustafson, L.; Xiao, T.; Whitehead, S.; Berg, A.C.; Lo, W.-Y. Segment anything. In Proceedings of the IEEE/CVF International Conference on Computer Vision, Paris, France, 2–3 October 2023; pp. 4015–4026. [Google Scholar]
- Huang, Z.; Wang, X.; Huang, L.; Huang, C.; Wei, Y.; Liu, W. Ccnet: Criss-cross attention for semantic segmentation. In Proceedings of the IEEE/CVF International Conference on Computer Vision, Seoul, Republic of Korea, 27 October–2 November 2019; pp. 603–612. [Google Scholar]
- Chen, L.-C.; Zhu, Y.; Papandreou, G.; Schroff, F.; Adam, H. Encoder-decoder with atrous separable convolution for semantic image segmentation. In Proceedings of the European Conference on Computer Vision (ECCV), Munich, Germany, 8–14 September 2018; pp. 801–818. [Google Scholar]
- Zhao, H.; Shi, J.; Qi, X.; Wang, X.; Jia, J. Pyramid scene parsing network. In Proceedings of the IEEE Conference on Computer Vision and Pattern Recognition, Honolulu, HI, USA, 21–26 July 2017; pp. 2881–2890. [Google Scholar]
- Xie, E.; Wang, W.; Yu, Z.; Anandkumar, A.; Alvarez, J.M.; Luo, P. SegFormer: Simple and efficient design for semantic segmentation with transformers. Adv. Neural Inf. Process. Syst. 2021, 34, 12077–12090. [Google Scholar]
- Xu, J.; Xiong, Z.; Bhattacharyya, S.P. PIDNet: A real-time semantic segmentation network inspired by PID controllers. In Proceedings of the IEEE/CVF Conference on Computer Vision and Pattern Recognition, Vancouver, BC, Canada, 18–22 June 2023; pp. 19529–19539. [Google Scholar]
- Liu, Z.; Lin, Y.; Cao, Y.; Hu, H.; Wei, Y.; Zhang, Z.; Lin, S.; Guo, B. Swin transformer: Hierarchical vision transformer using shifted windows. In Proceedings of the IEEE/CVF International Conference on Computer Vision, Montreal, BC, Canada, 11–17 October 2021; pp. 10012–10022. [Google Scholar]
- Wang, Q.; Wu, B.; Zhu, P.; Li, P.; Zuo, W.; Hu, Q. ECA-Net: Efficient channel attention for deep convolutional neural networks. In Proceedings of the IEEE/CVF Conference on Computer Vision and Pattern Recognition, Seattle, WA, USA, 14–19 June 2020; pp. 11534–11542. [Google Scholar]
- Xu, W.; Wan, Y. ELA: Efficient local attention for deep convolutional neural networks. arXiv 2024, arXiv:2403.01123. [Google Scholar]
- Cordts, M.; Omran, M.; Ramos, S.; Rehfeld, T.; Enzweiler, M.; Benenson, R.; Franke, U.; Roth, S.; Schiele, B. The cityscapes dataset for semantic urban scene understanding. In Proceedings of the IEEE Conference on Computer Vision and Pattern Recognition, Las Vegas, NV, USA, 27–30 June 2016; pp. 3213–3223. [Google Scholar]
- Cao, Y.; Xu, J.; Lin, S.; Wei, F.; GCNet, H.H. Non-Local Networks Meet Squeeze-Excitation Networks and Beyond, 2019 IEEE. In Proceedings of the CVF International Conference on Computer Vision Workshop (ICCVW), Seoul, Republic of Korea, 27–28 October 2019; pp. 1971–1980. [Google Scholar]
- Contributors, M. MMSegmentation: OpenMMLab Semantic Segmentation Toolbox and Benchmark. Available online: https://github.com/open-mmlab/mmsegmentation (accessed on 3 April 2024).
Disclaimer/Publisher’s Note: The statements, opinions and data contained in all publications are solely those of the individual author(s) and contributor(s) and not of MDPI and/or the editor(s). MDPI and/or the editor(s) disclaim responsibility for any injury to people or property resulting from any ideas, methods, instructions or products referred to in the content. |
© 2025 by the authors. Licensee MDPI, Basel, Switzerland. This article is an open access article distributed under the terms and conditions of the Creative Commons Attribution (CC BY) license (https://creativecommons.org/licenses/by/4.0/).