1. Introduction
As a fundamental pillar of national energy infrastructure, the electric power industry plays a critical role in industrial, economic, and societal domains, holding strategic importance for the realization of national revitalization objectives [
1]. Field operations in power grids involve high-voltage electrical equipment and complex power systems, where accidents or faults can easily lead to severe consequences such as casualties, equipment damage, and large-scale power outages. Therefore, ensuring the safety of field operations in power grids is essential for protecting human life, maintaining the integrity of equipment, and safeguarding socioeconomic interests [
2]. At present, safety supervision of field operations primarily relies on on-site inspections by professionals or remote video monitoring. For instance, Peng et al. [
3] developed an object detection approach called CORY-Net, which combines contrastive self-supervised learning with the YOLOv5 framework and applied it to intelligent safety surveillance in power grid construction environments. As artificial intelligence continues to evolve, the State Grid Corporation of China is actively promoting the digitalization and intelligent upgrading of the power industry, prioritizing the enhancement of risk prevention and control capabilities and positioning safety assurance as a core development objective [
4]. A large volume of multimodal data has become available in power grid operations, providing a rich resource for analysis and application. However, traditional data analysis techniques are increasingly inadequate in addressing the exponential growth of data volume. There is an urgent need to introduce more intelligent and systematic analytical approaches to achieve a deeper understanding and more effective prevention of violation behaviors.
With the rapid advancement of machine learning and deep learning technologies, it has become feasible to conduct efficient mining and intelligent analysis of the massive data generated by smart grids. Zhou et al. [
5], based on historical data from power companies, conducted an in-depth investigation into the relationship between field operation behaviors and violation incidents, providing data-driven support and theoretical foundations for enhancing safety management in power operation sites. Wang [
6] proposed the MultiDeT model, which adopts a single-encoder, multi-decoder architecture under a multi-task learning framework. The model effectively captures the coupling relationships among various energy loads to achieve joint prediction tasks, demonstrating strong performance in both prediction accuracy and generalization capability. This provides essential technical support for the coordination and management of integrated energy systems. Tan [
7] developed a deep multi-task learning approach with practical application value, integrating multimodal feature extraction and a soft parameter-sharing structure. This approach mitigates the limitations in feature extraction and error accumulation commonly encountered in multi-node load forecasting, thereby improving the overall prediction performance. Zhang [
8] developed a quantitative characterization model for power equipment fault diagnosis, incorporating the number of alarms and their temporal distribution during the fault process as classification features. These features were integrated into a diagnostic framework to enable joint identification of fault types and faulty equipment. The method was validated using both simulation systems and real fault cases, demonstrating high applicability and diagnostic precision. Cao [
9] designed an integrated intelligent early warning system for power grids based on multi-source data fusion. By integrating heterogeneous data sources such as EMS, fault recording systems, OMS, and meteorological monitoring, and applying intelligent algorithms, the system enables real-time monitoring of equipment operating status and efficient warning of defect risks. Sun [
10] addressed safety risks in the power construction process by proposing a safety early warning model based on particle swarm optimization and support vector machines (PSO-SVM). The model improves generalization capability and warning performance through parameter optimization, and experimental results indicate superior performance over traditional SVM models. Ke [
11] introduced a substation intelligent safety perception and early warning approach that integrates multi-dimensional information. By combining key technologies such as sensor-based perception, cloud-edge collaboration, transfer learning, and semantic segmentation, the method achieves intelligent identification and real-time warning of unsafe operation distances, violation behaviors, misoperation, and hazardous gases, thereby enhancing the safety and intelligent management of substation field operations.
Power grid systems encompass not only large volumes of structured data but also extensive unstructured textual information, such as operation records and inspection logs. Efficiently extracting valuable information from such heterogeneous data sources and presenting it in a logically coherent and well-structured manner has become a key challenge in addressing the rapid expansion of domain knowledge within the power sector. As a semantic-level knowledge organization framework, knowledge graphs can represent and analyze real-world concepts and their interactions in a structured format by capturing entities and the semantic relationships among them. This facilitates complex querying and logical reasoning [
12]. Due to their strong capabilities in knowledge representation and management, knowledge graphs have been widely applied in fields such as search engine technologies, financial risk control, and biomedical research [
13], and are increasingly demonstrating substantial potential in power systems—particularly in critical tasks such as intelligent questioning [
14], fault diagnosis [
15], and decision support [
16].
Tang et al. [
17] constructed a knowledge graph for power equipment and proposed an information retrieval method based on graph search strategies, which effectively improved the level of intelligence in the lifecycle management of power assets. Liu et al. [
18] designed a Chinese entity recognition model based on BERT–BiLSTM–CRF, integrating BERT’s contextual semantic representation capability, BiLSTM’s sequential modeling strength, and CRF’s label dependency constraints. This model achieved accurate extraction of fault-related entities and their semantic relations in power equipment and further supported automated fault diagnosis and intelligent question answering by constructing a Neo4j-based knowledge graph system. The approach significantly enhanced the precision of entity recognition in Chinese power-related literature. Addressing the rapidly growing demand for ultra-high-voltage (UHV) infrastructure in power grid development, Hu [
19] proposed a knowledge graph construction method that integrates multi-view graph convolutional networks (GCN) with a Haar convolution pooling mechanism. By jointly aggregating node attribute information and subgraph structural features, the method enabled accurate classification of UHV projects, achieving superior accuracy and generalization performance on both the UHV and NCI-1 datasets. In addition, Y et al. [
20] focused on centralized monitoring and intelligent alerting in smart grid control systems, constructing an accident knowledge graph based on monitoring data. By incorporating grid topology and historical alarm rules into the modeling of entities and relationships, the method enhanced the identification of correlations among alarm events and improved both the efficiency of accident analysis and the reliability of control systems.
Research on on-site construction operation scenarios in the electric power sector remains relatively limited, with existing studies commonly exhibiting limitations such as a narrow range of data types, weak inter-information associations, and insufficient visualization capabilities. To tackle these challenges, this study introduces a knowledge graph-driven approach for modeling and profiling violations in power grid field operations, aiming to enable comprehensive modeling and precise representation of non-compliant behaviors, thereby providing data-driven support for scheduling and planning decisions. For structured data, violation behaviors are statistically analyzed using rule-based methods, and a mutual information algorithm is employed to identify correlations between violations and seven key operational factors: operation entity, task source, operation type, professional category, voltage level, risk level, and working mode. Additionally, stage-wise statistical modeling is conducted at the municipal level to inform regional violation risk assessments. For unstructured textual data, a multi-source embedding-based named entity recognition (NER) model is developed, incorporating domain-specific power lexicon information to enhance the extraction of key entities. High-weight domain terms related to violations are further identified using the TF-IDF algorithm to characterize typical violation behaviors. Based on the extracted entities and relationships, a knowledge graph of field operation violations is constructed, providing a computable and inferable semantic representation of operational scenarios. Finally, visualization techniques are applied to present the structural patterns and distributional features of violations, offering graph-based support for violation risk analysis and dispatch decision-making. Experimental results demonstrate that the proposed method effectively identifies critical features of violation behaviors and provides a structured foundation for intelligent decision support in power grid operation management. The main contributions and innovations of this study are outlined as follows:
- (1)
A knowledge graph is specifically constructed for the field of on-site operation violations in power systems, which focuses on a unique and underexplored domain that involves highly unstructured and safety-critical textual data.
- (2)
A curated power operation vocabulary is used as prior semantic knowledge to enhance the named entity recognition (NER) process, which significantly improves the recognition of key entities (e.g., person, object).
- (3)
It enables power grid personnel to analyze violations, assess potential risks, and derive targeted safety insights, which supports the decision-making in real-world settings and improves the effectiveness of safety management.
2. Construction of a Knowledge Graph for Violations in Power Grid Field Operations
2.1. Framework for Constructing a Knowledge Graph of Violations in Power Grid Field Operations
As a natural language processing technique, knowledge graphs fundamentally aim to model real-world concepts and their interrelations in the form of “entity–relation–entity” triples, thereby constructing a structured semantic network [
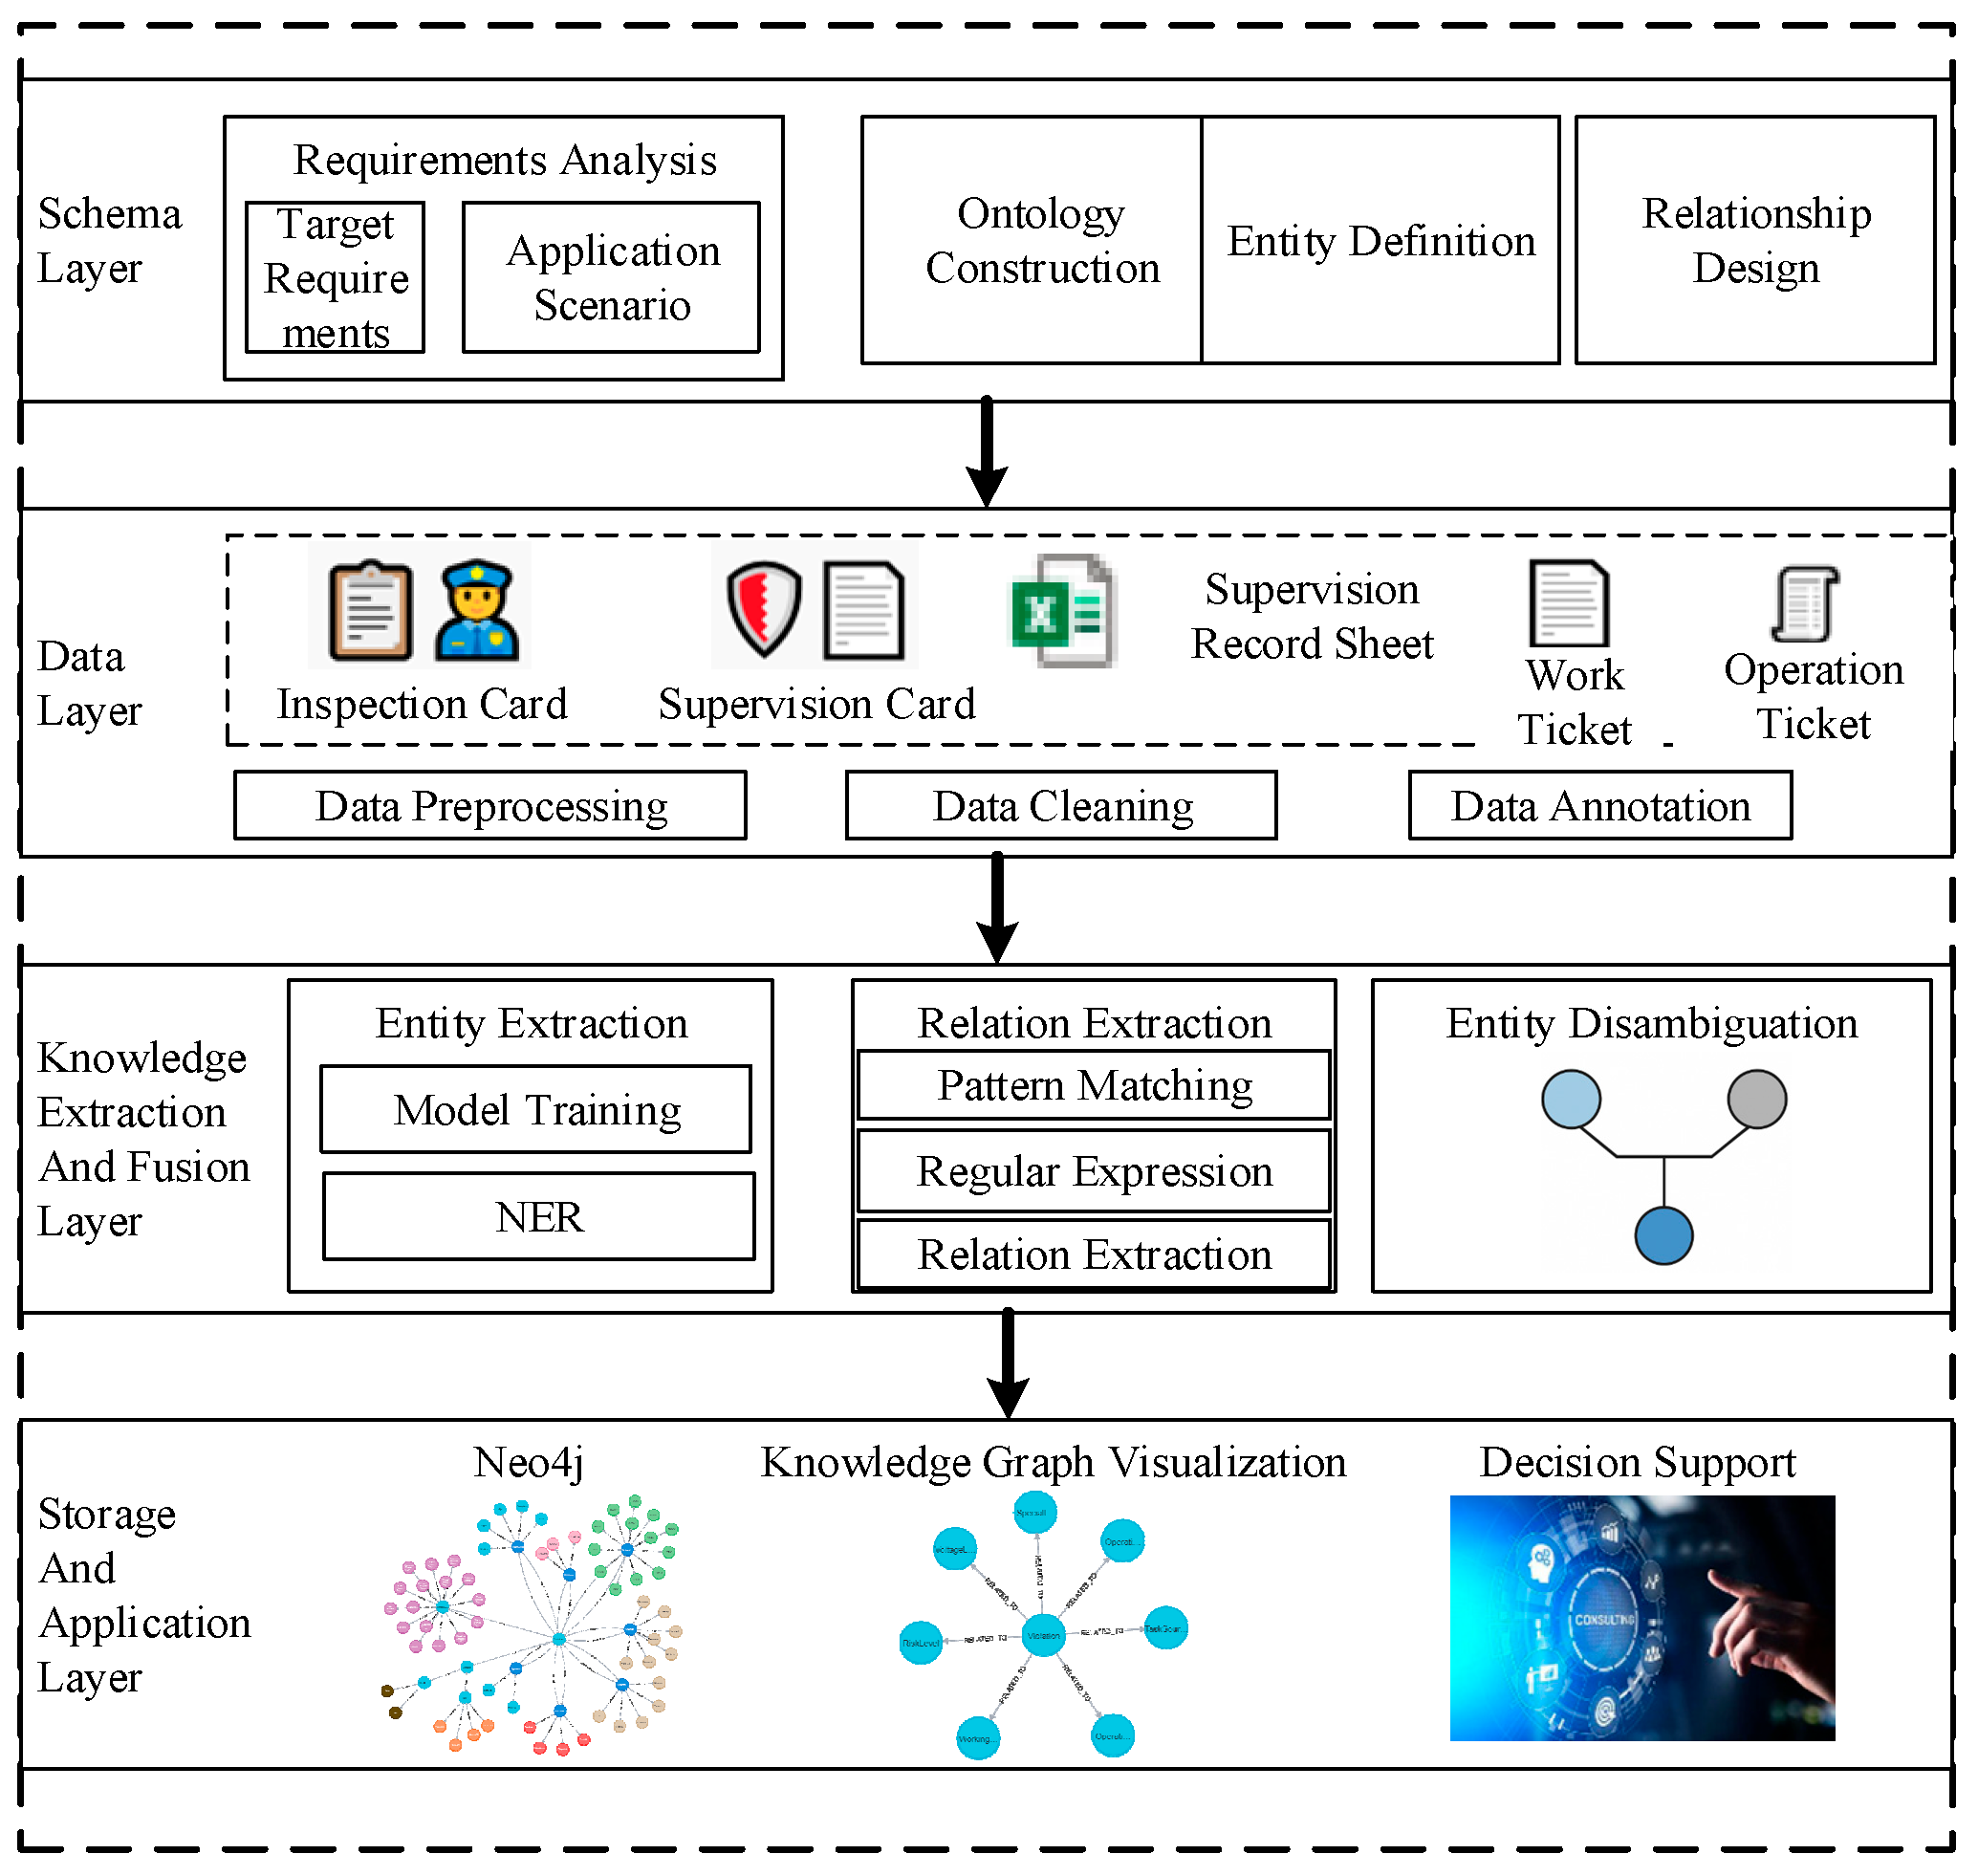
21]. This study employs a top-down design strategy to construct a domain-specific knowledge graph specifically for modeling violation scenarios in power grid field operations. The complete framework is depicted in
Figure 1. This knowledge graph focuses on the in-depth modeling and analysis of on-site violation data associated with power grid personnel and encompasses the entire process from semantic modeling to practical graph-based applications.
Specifically, the schema layer provides a semantically explicit and structurally complete conceptual framework for the knowledge graph through requirement analysis, entity definition, relationship design, and ontology construction. This layer serves as the logical foundation for knowledge graph construction and inference. The data layer primarily relies on historical structured documents related to power grid field operations (e.g., work permits and operation tickets) and violation records (e.g., inspection cards and supervision records), supplemented by general dictionaries and domain-specific power-related lexicons. It supports data cleaning, annotation, and normalization of raw inputs. The knowledge extraction and fusion layer combines rule-based approaches and deep learning techniques to extract key information related to violation behaviors from structured and semi-structured data. Named Entity Recognition (NER) is employed to identify key operational entities in textual data, and semantic relationships between entities are obtained through rule-based extraction or pattern matching methods. These are further integrated and transformed into standardized triples. Finally, the storage and application layers store the extracted triples into a Neo4j graph database, following predefined construction rules and aligning with operational requirements of power grid field scenarios. This enables efficient knowledge visualization and supports decision-making in dispatching-related applications.
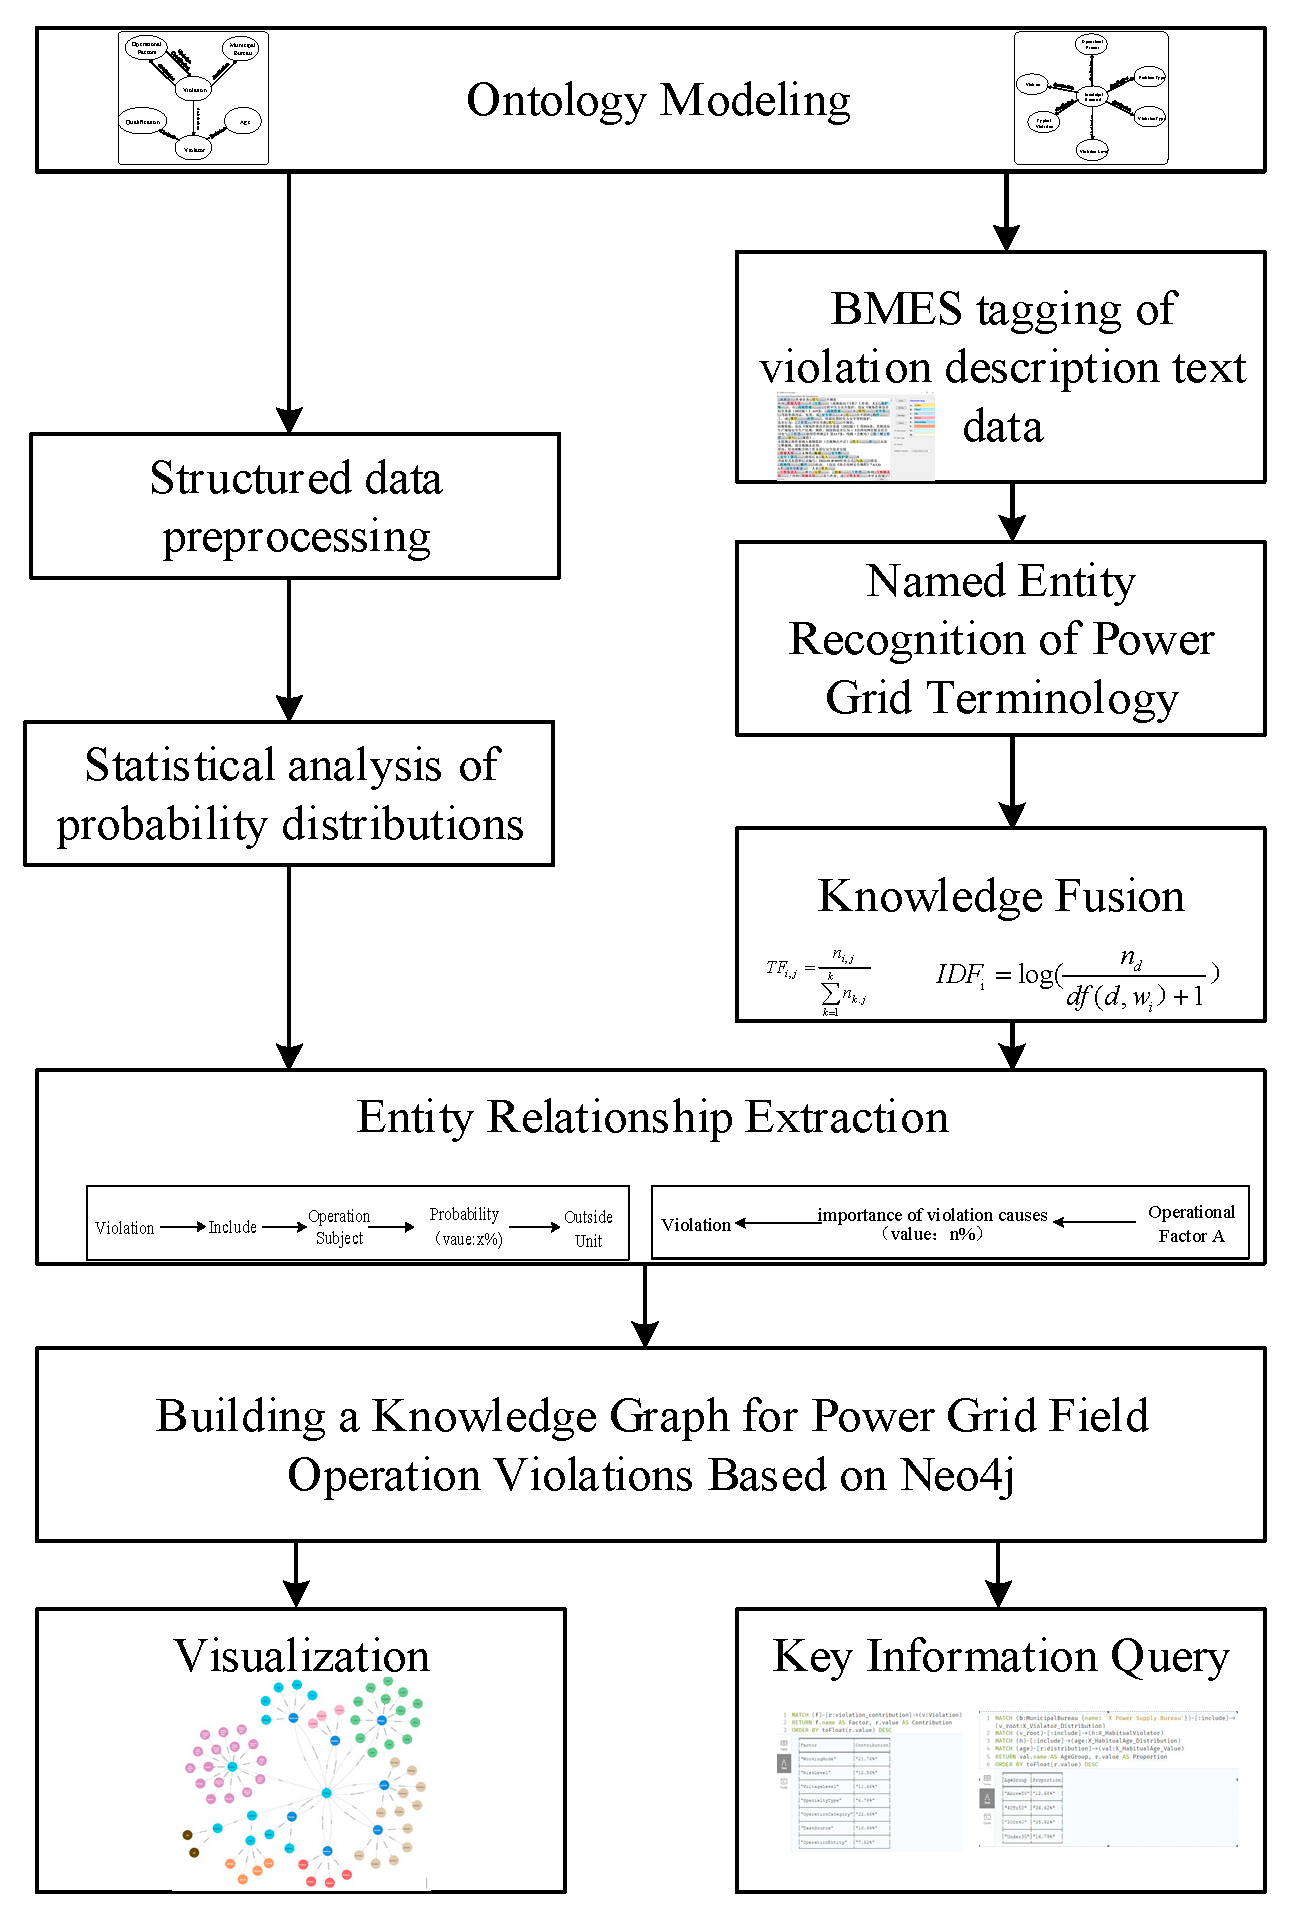
Figure 2 illustrates the overall workflow of the proposed method for constructing a power grid operation knowledge graph. It begins with ontology modeling to define entities and relationships. Then, it processes structured data related to operational factors and unstructured text describing violations. The structured data undergoes preprocessing and statistical analysis to extract the probability distribution of key operational factors. Meanwhile, the violation text data is annotated with BMES tagging, followed by a named entity recognition model that integrates multi-source embeddings to extract power-specific terminology. Subsequently, in knowledge fusion, the TF_IDF algorithm is used to extract key power-specific terms. These results are then used, based on predefined relationships and entities, to extract triples for building a knowledge graph. The knowledge graph for on-site power grid operation violations is constructed in neo4j. The resulting knowledge graph supports downstream applications such as visualization and key information queries, providing a structured and interpretable representation of historical violation patterns for risk analysis and decision support.
2.2. Ontology Modeling
Ontology is a semantic model that formally describes concepts, entities, their attributes, and interrelations in the real world. It is widely utilized in knowledge graph construction and information retrieval [
22]. Within a knowledge graph system, ontology serves as a fundamental component, providing a standardized foundation for unified knowledge modeling and semantic reasoning. The construction of a knowledge ontology involves defining key concepts, specifying relationship types, formulating attribute constraints, and modeling semantic structures such as “entity—relationship—entity” and “entity—relationship—attribute” in a consistent manner.
To address the multi-source and heterogeneous nature of historical data from power grid field operations, as well as its application requirements in violation control, this study designs and develops a domain knowledge ontology model for violation profiling in grid field operations, both at the overall level and at the level of local municipal bureaus. The model is constructed based on the seven-step methodology for ontology development and incorporates the stage-wise distribution characteristics of violation data along with the division of management dimensions. It systematically models grid operation behaviors, with the objective of providing structured semantic support for violation profiling and auxiliary decision-making.
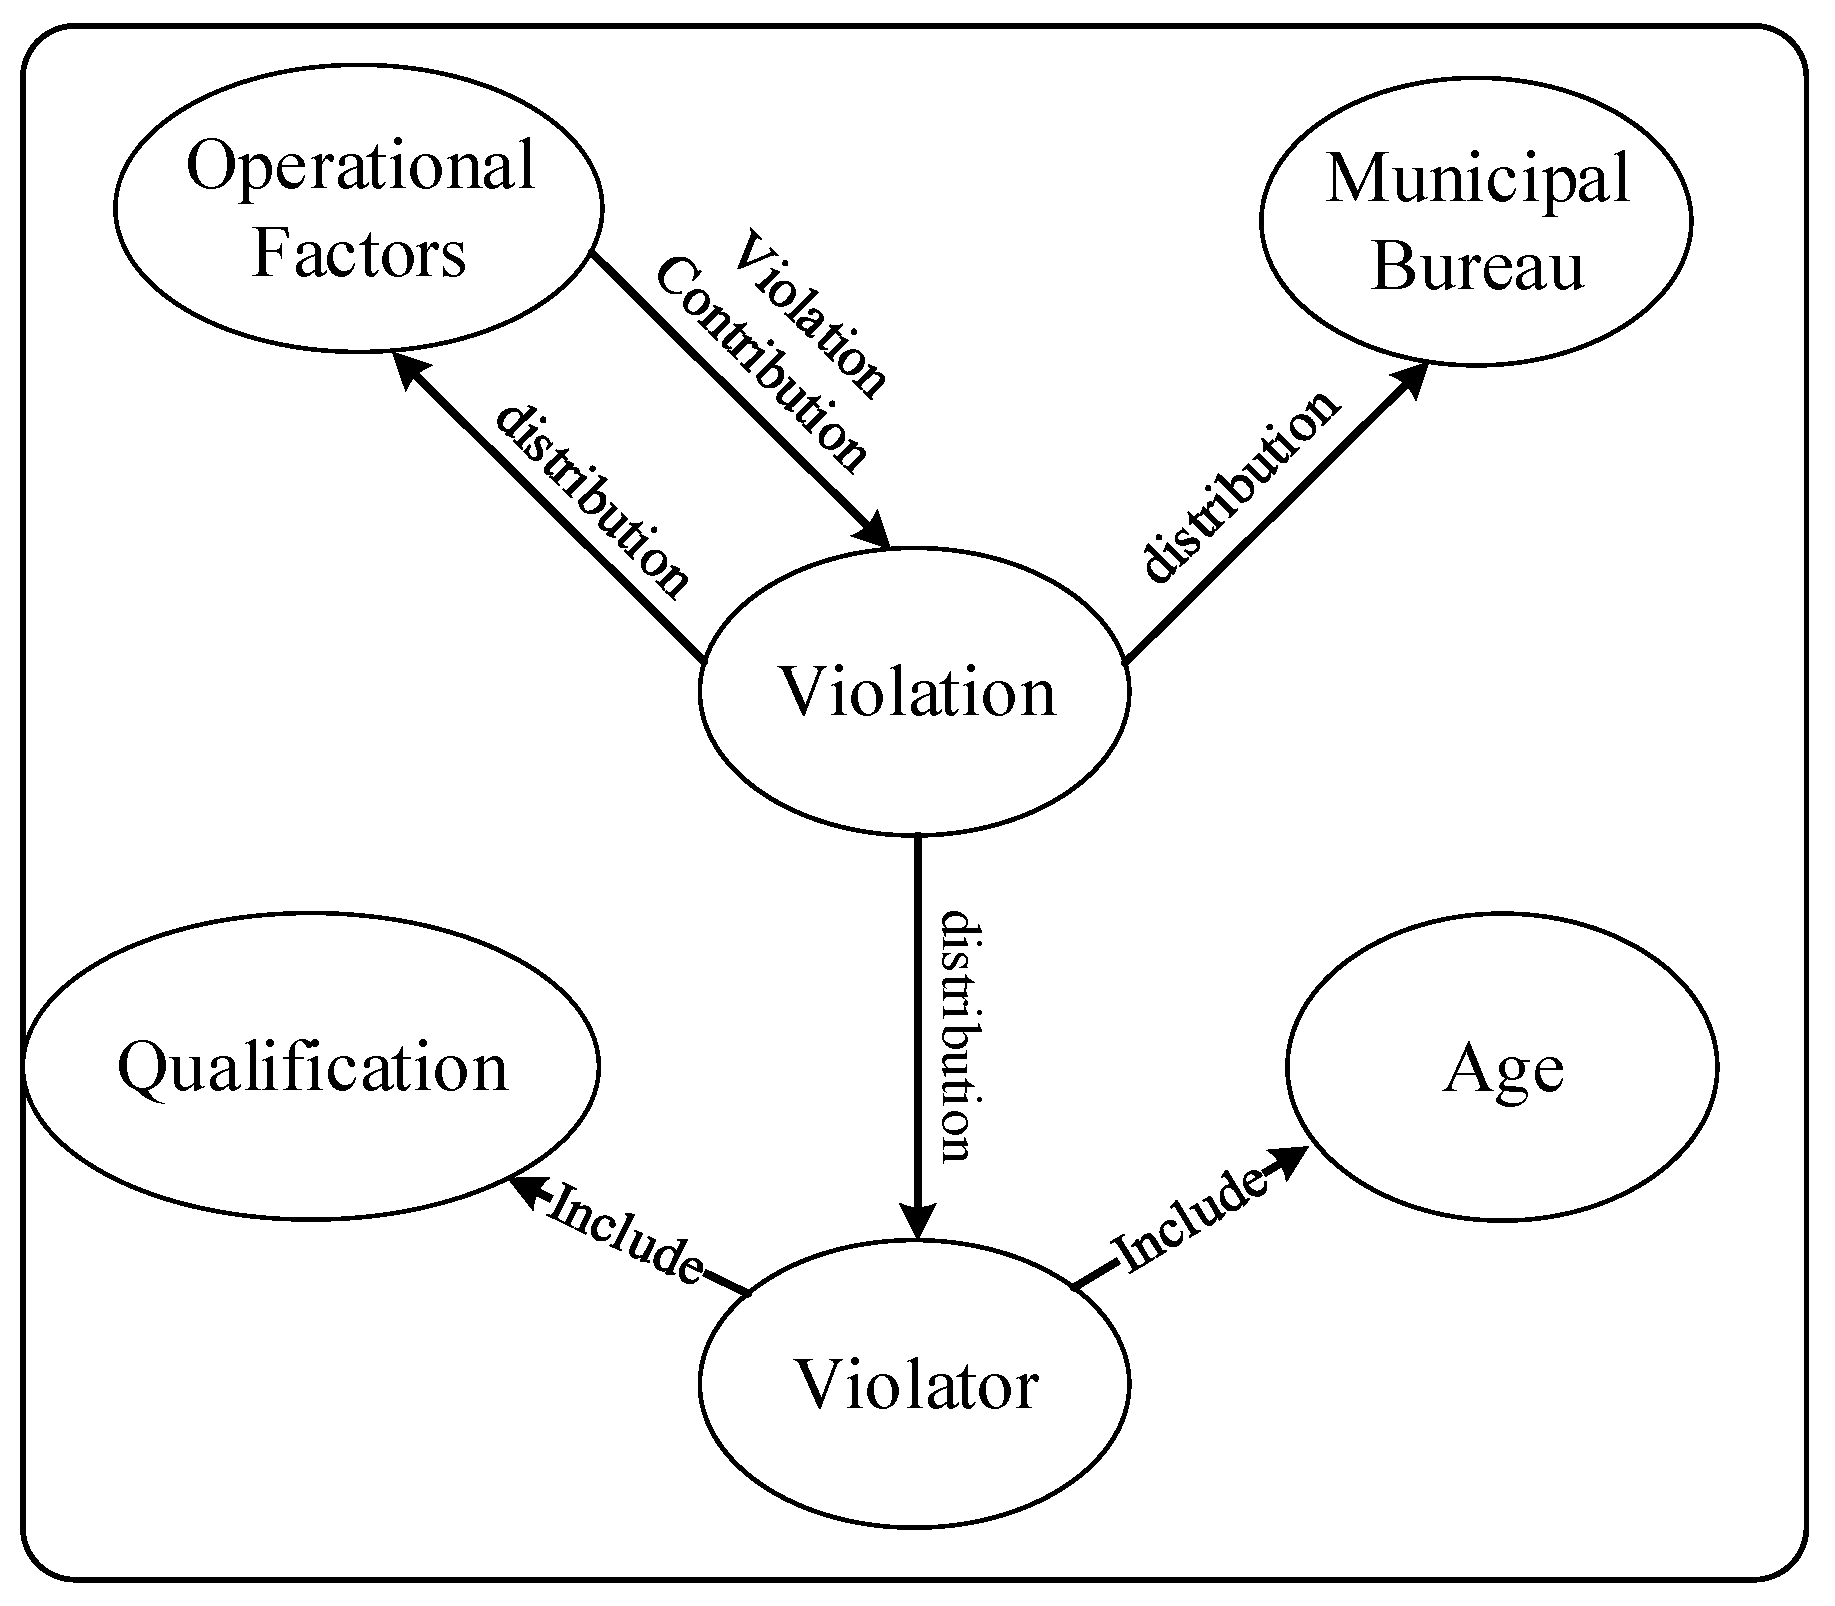
At the overall level, a power grid field operation plan is typically associated with multiple key operational factors, including the operation entity, task source, operation type, specialty type, voltage level, risk level, and working mode. Based on historical violation data, the knowledge ontology is required to support correlation analysis and contribution assessment between each operational factor and violation occurrence. Additionally, it should enable statistical modeling of the probability distribution of violations across factor values, the distribution of violation incidents across local municipal bureaus, and the behavioral characteristics of violators. This facilitates the provision of a quantifiable and interpretable foundation for violation profiling to support dispatch management. As illustrated in
Figure 3, the semantic structure among relevant concepts is explicitly defined and represented through ontology modeling.
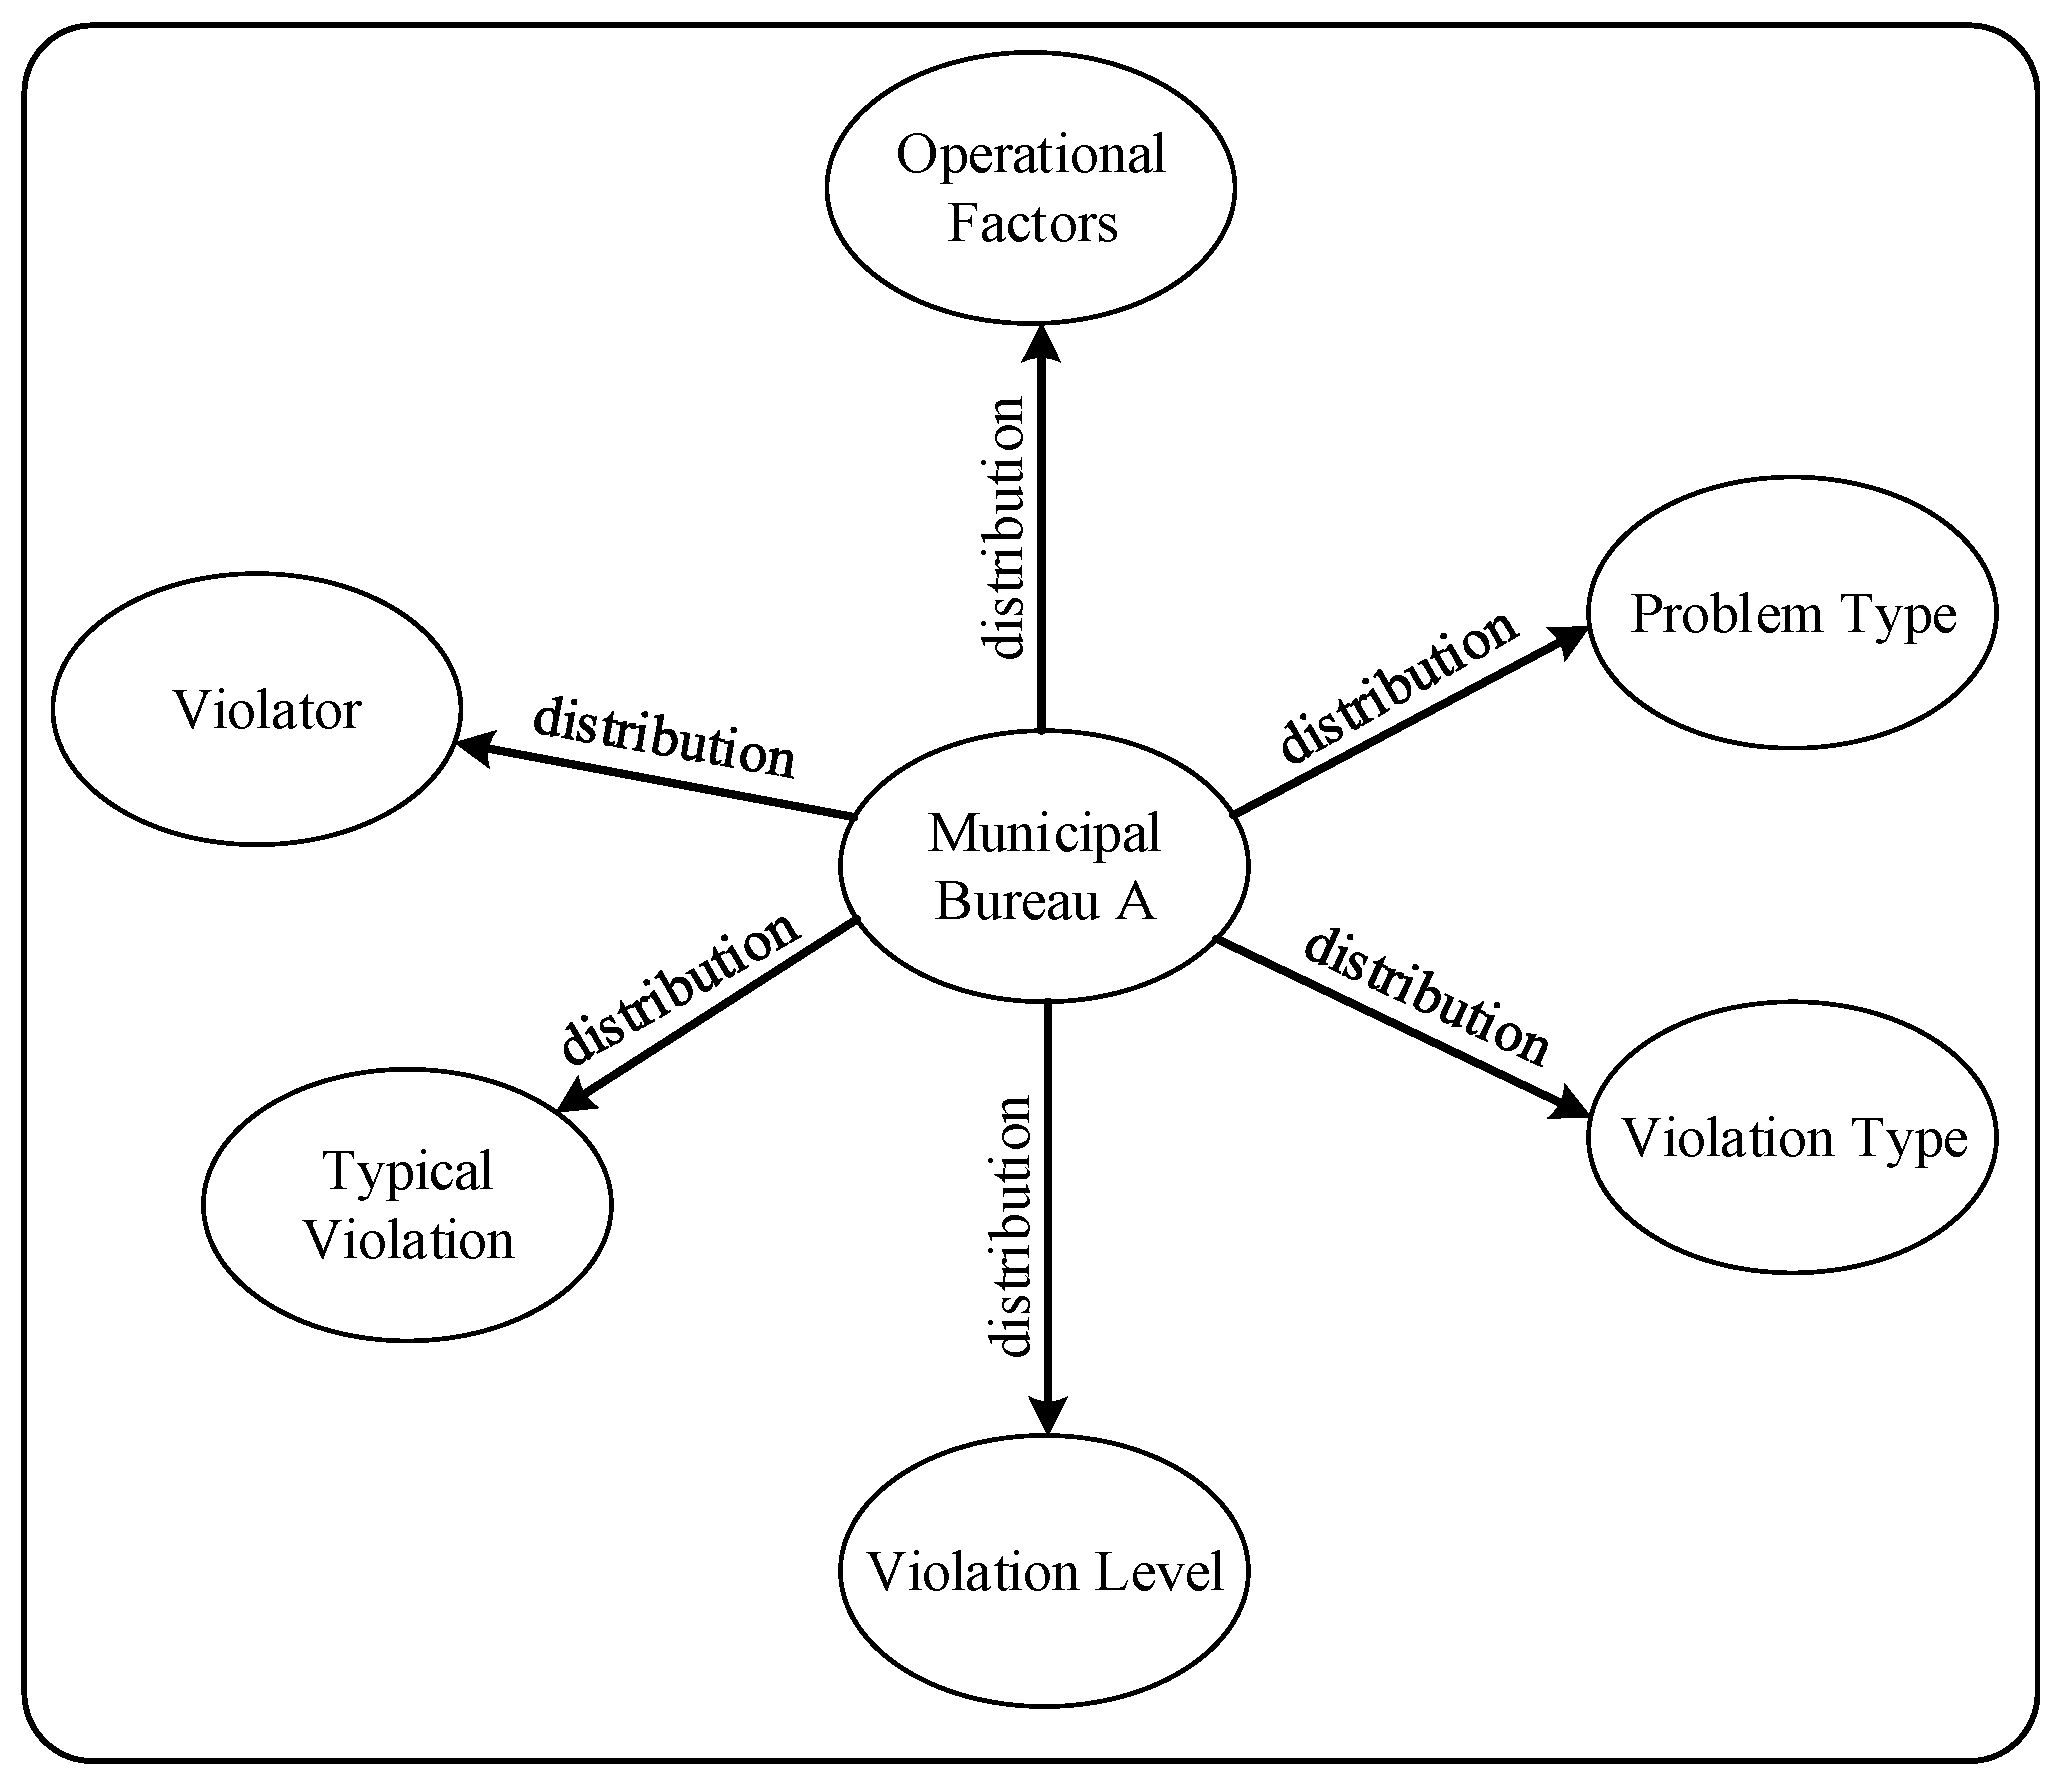
At the level of the local municipal bureau, ontology modeling focuses on capturing the statistical characteristics and behavioral profiles of regional historical violation data. First, the probability distributions of key operational factors—including operation entity, task source, operation category, specialty type, voltage level, risk level, and work mode—are analyzed based on violation samples to reveal the structural features of regional operational risk. Second, the distributions of problem types, violation categories, and violation severity levels (A, B, C, D) are modeled to characterize violation patterns in terms of frequency and severity. Based on this analysis, the five most frequently occurring violation codes in the historical records are identified and labeled as representative non-compliant behaviors.
Finally, drawing on the historical behavioral records of personnel involved in violations, individuals are categorized as either occasional or habitual violators. This classification is based on the frequency of violation occurrences associated with each individual in the dataset. A predefined threshold is applied: if the number of violations attributed to a person exceeds a certain value, the individual is labeled as a habitual violator; otherwise, the person is considered occasional. The corresponding results, as shown in
Figure 4, provide structured and visualized knowledge support for regional violation management and risk mitigation.
2.3. Data Preprocessing
Structured knowledge refers to a form of knowledge representation characterized by clear semantic definitions and standardized data formats, which can be effectively organized and expressed through data structures or models. In the context of violations in power grid field operations, the structured construction of knowledge is based on original field records such as picket cards, inspection cards, inspection record sheets, work tickets, and operation tickets. For these heterogeneous data sources, systematic data cleaning and preprocessing are first conducted, including steps such as completion of missing fields, unification of data formats, elimination of invalid values, and derivation of key features. This processing stage significantly enhances the structural integrity and semantic consistency of the raw data, thereby providing a high-quality and standardized foundation for subsequent knowledge graph construction, statistical modeling, and decision support system development.
Unstructured knowledge refers to information that lacks a clear structure and standardized representation format, making it difficult to organize, classify, or manage directly. Compared with structured knowledge, unstructured knowledge exhibits greater complexity and variability, and its processing and utilization typically require advanced techniques such as artificial intelligence, natural language processing (NLP), and image recognition [
23]. In the domain of power grid field operation violations, unstructured knowledge primarily originates from textual descriptions of violations found in operation records. These texts are semantically rich and expressed in diverse forms, rendering them unsuitable for direct transformation into structured “entity—relationship—entity” triples through conventional approaches. Instead, they must undergo a series of language normalization and information extraction procedures to be converted into computable knowledge representations.
To address this, the following text preprocessing workflow is designed for handling violation-related texts in power grid field operations:
Text Cleaning and Normalization: This step involves the removal of invalid characters and special symbols, as well as the semantic restoration and standardization of non-standard abbreviations, shorthand notations, and semantically ambiguous expressions, in order to improve the uniformity and readability of the text.
Domain Dictionary Construction: To address the challenge of highly specialized terminology in power grid operation scenarios, a domain-specific terminology dictionary for violation behaviors is developed in collaboration with industry experts. This dictionary serves as a corpus resource to support subsequent entity annotation tasks. Specifically, historical violation description texts were collected and processed using jieba word segmentation, followed by term frequency statistics. The top 1500 high-frequency candidate terms were extracted and reviewed in conjunction with domain experts. Based on both their frequency and relevance to power grid operations, a subset of these terms was selected as domain-specific entities, forming the final version of the power domain dictionary.
Named entity recognition (NER) is conducted using the BMES annotation scheme to identify and classify key entities within the text. In this study, five entity types are defined: Person, Object, File, Action, and Surrounding. The specific annotation guidelines for each entity type are detailed in
Table 1.
To guarantee the accuracy and reliability of the annotated dataset during the BMES tagging process, all annotation tasks were carried out by two independent annotators with domain knowledge. After the initial annotation round, the results were compared to identify and review any inconsistencies. Disagreements were resolved through a two-step procedure: the annotators first discussed the disputed cases to reach a consensus, and if no agreement could be reached, the final decision was made by a senior expert in the power grid domain. This process ensured the consistency and accuracy of the final annotated corpus.
The preprocessing system provides a critical foundation for the standardized representation and triple-based extraction of unstructured knowledge, thereby significantly enhancing the usability and structural quality of unstructured textual information in power grid field operation scenarios.
As an illustrative example,
Table 2 presents the labeling results for the phrase “未佩戴安全帽 (Not Wearing a Safety Helmet)”.
2.4. Knowledge Extraction from Violation Description Texts in Grid Field Operations
Entity extraction refers to the identification of entities with explicit semantic types from natural language text. Based on pre-labeled data in the BMES format, entities such as Person, Object, File, Action, and Surrounding are extracted from the text. In power grid field operation violation texts, entity expressions are highly variable and strongly context-dependent, making it difficult for traditional rule-based or shallow learning methods to effectively capture complex semantic relationships and contextual features, which often results in limited extraction accuracy.
To address this challenge, this paper presents a Chinese named entity recognition (NER) model specifically designed for extracting power-related entities from field operation violation texts in the power grid domain, leveraging multi-source embeddings to improve the identification of entity boundaries. The model architecture, depicted in
Figure 5, consists of three functional components:
Multi-source Embedding Fusion Layer: This layer integrates multi-source embedding vectors, including the pre-trained BERT embeddings, character-level, word-level, and domain-specific power lexicon information. It effectively enhances the semantic representation capability of the input and enhances the model’s ability to recognize domain-specific terminology.
Feature Encoding Layer: A deep neural network based on BiLSTM is employed as a context-aware encoder to capture deep semantic features and contextual dependencies within the input sequence.
Label Decoding Layer: A Conditional Random Field (CRF) is used for label sequence modeling, enabling global optimization of entity boundary and type predictions, thereby significantly improving recognition accuracy.
By combining multidimensional semantic representations with context-aware modeling and incorporating structured prior knowledge, the proposed model offers a robust and accurate method for identifying electric power entities in field operation violation descriptions of power grids.
2.4.1. Word-Character Fusion Feature Embedding Layer
Multi-source embedding includes BERT embeddings, single-character embeddings, bi-character embeddings, generic dictionary embeddings, and power domain dictionary embeddings. The dictionary integration approach follows the method proposed by Ma et al. [
24], in which external lexical information is incorporated to enhance the performance of named entity recognition. Besides, this strategy is extended by introducing a power operation domain-specific lexicon that provides specialized semantic cues for the identification of technical terms in violation descriptions. Importantly, this domain lexicon is designed to be flexible and extensible, allowing for incremental updates as new terminology, regional variations, or internal jargon emerge over time or across different power grid units. This adaptability ensures the sustained effectiveness of the NER model in diverse and evolving operational contexts.
BERT Embedding: The BERT pre-trained model can generate dynamic character-level vector representations for input text sequences. An example input sequence, “未佩戴安全帽 (Not Wearing a Safety Helmet)” is illustrated in
Figure 6. Unlike the original BERT architecture, the proposed model feeds the output of BERT into an additional Multi-Head Self-Attention Residual Module to enhance context modeling and extract higher-level semantic features.
Single-character, Bi-character, and Generic Lexicon Embeddings: To capture lexical information at different granularities, this study adopts the same external lexicon used in Lattice-LSTM [
25] to obtain embedding representations at the single-character, bi-character, and word levels. These embeddings complement BERT by incorporating fine-grained lexical cues into the model.
Power Domain Dictionary Embedding: In the data preprocessing stage, a power domain-specific dictionary is constructed using violation description texts from grid field operation records as the training corpus. The Skip-gram algorithm within the Word2Vec framework is employed to train word vectors, resulting in specialized embeddings tailored to the power grid domain. These embeddings enhance the model’s capability to represent domain-specific terminology and improve recognition accuracy in specialized contexts.
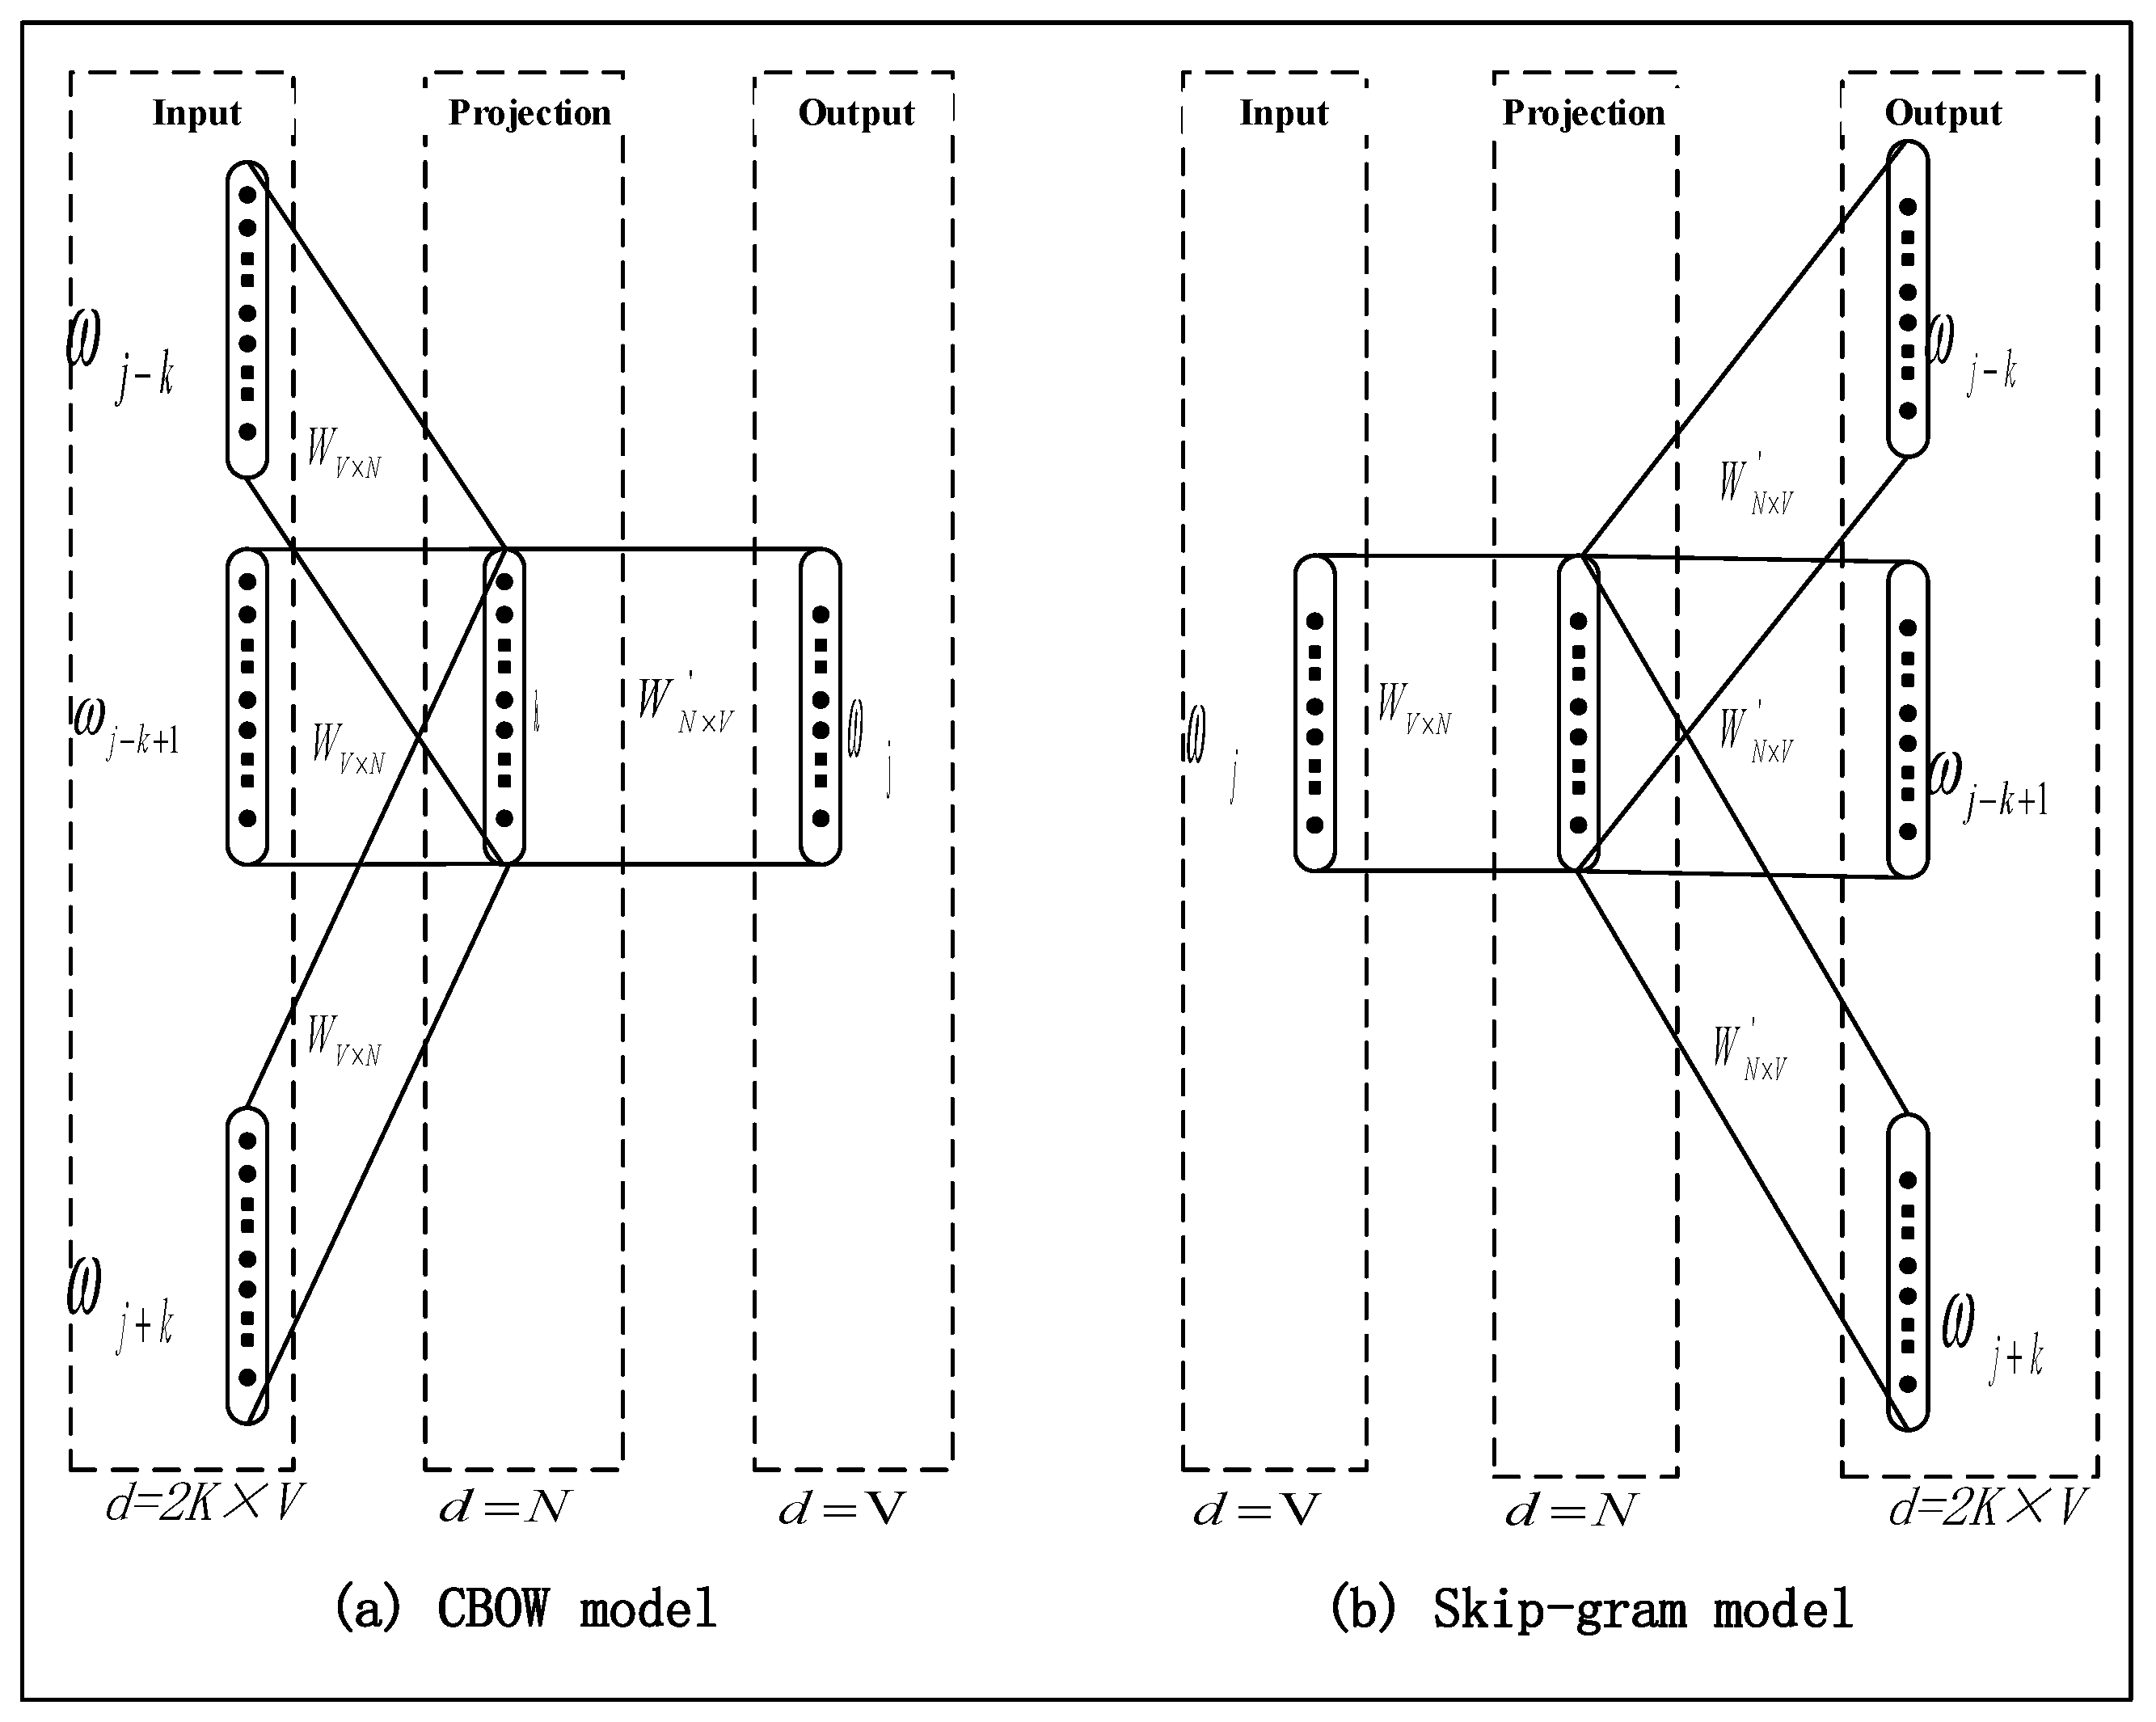
Word2Vec [
26], created by Google in 2013, is an efficient word embedding model widely used in various NLP tasks. It consists of two main architectures: Continuous Bag of Words (CBOW) and Skip-Gram. CBOW predicts the target word from surrounding context, while Skip-Gram does the reverse by predicting context words from a center word.
Figure 7 illustrates the architecture of the Word2Vec model, which comprises an input layer, a projection layer, and an output layer. Trained on large-scale corpora, Word2Vec maps words into a low-dimensional continuous vector space, allowing semantically related words to cluster together. This structure effectively captures the semantic relationships between words.
The Skip-Gram model typically generates more accurate semantic representations than the CBOW model and demonstrates superior performance, especially in handling low-frequency words within small-scale corpora. Therefore, this study adopts Skip-Gram architecture for training word vectors on violation description texts from power grid field operations.
The core objective of the Skip-Gram model is to maximize the conditional probability of context words given a center word. Its optimization objective function is:
Here,
represents the set of all words in the corpus,
denotes the size of the context window, and
is the center word. The fundamental idea of the Skip-Gram model is to predict the probability of the
surrounding context words based on the given center word
. This probability is modeled using the softmax function as follows:
where
is the input vector of the center word (i.e., the column vector from the input matrix),
is the output vector of a context word (i.e., the row vector from the output matrix), and
denotes the vocabulary size. The model parameters are optimized using stochastic gradient descent (SGD).
The four embeddings, namely single-character embedding, bi-character embedding, generic dictionary embedding, and power domain dictionary embedding, are all trained with a dimensionality of 50. The BERT embedding, after processing, yields a 256-dimensional representation. These multi-source embeddings are concatenated and fed into the feature encoding layer as the final input.
2.4.2. Feature Encoding Layer
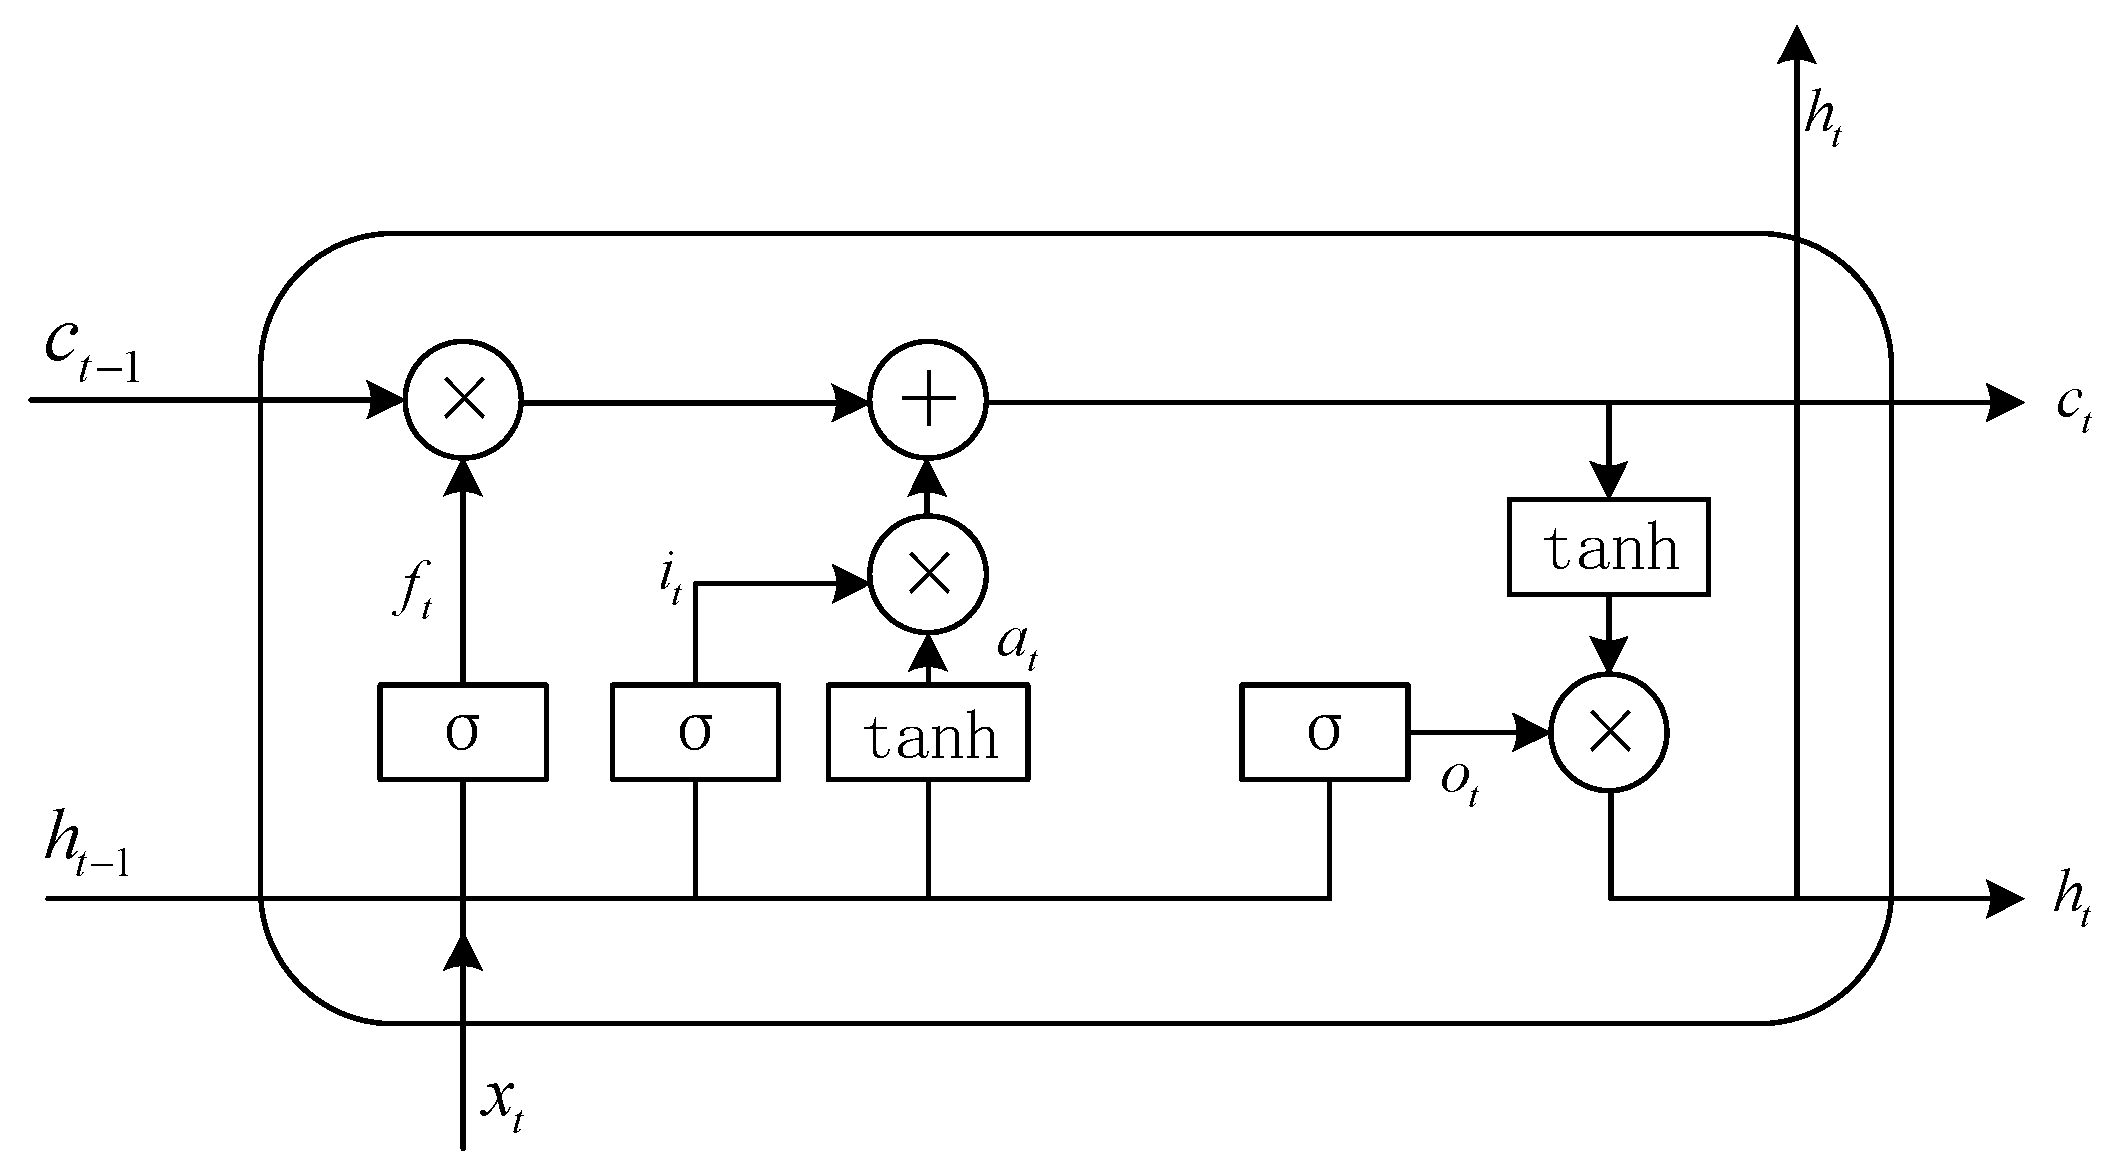
To encode contextual information from input embeddings, this study employs a bidirectional LSTM (BiLSTM) in the feature encoding layer. As a variant of the traditional RNN, LSTM is designed to handle long-range dependencies by regulating information flow through a gating mechanism, thereby alleviating the issues of gradient vanishing and explosion. The unit structure includes three gates: input, forget, and output, as shown in
Figure 8.
The input gate
controls the extent to which new information from the current input is integrated into the cell state. The forget gate
is responsible for filtering out unnecessary components of the previous cell state
. Meanwhile, the output gate
regulates how much of the updated cell state
contributes to the hidden state
. The updated equations for these three gates are provided in Equations (3)–(7).
Here, represent the activation function, weight matrix, bias term, and the input to the current unit, respectively.
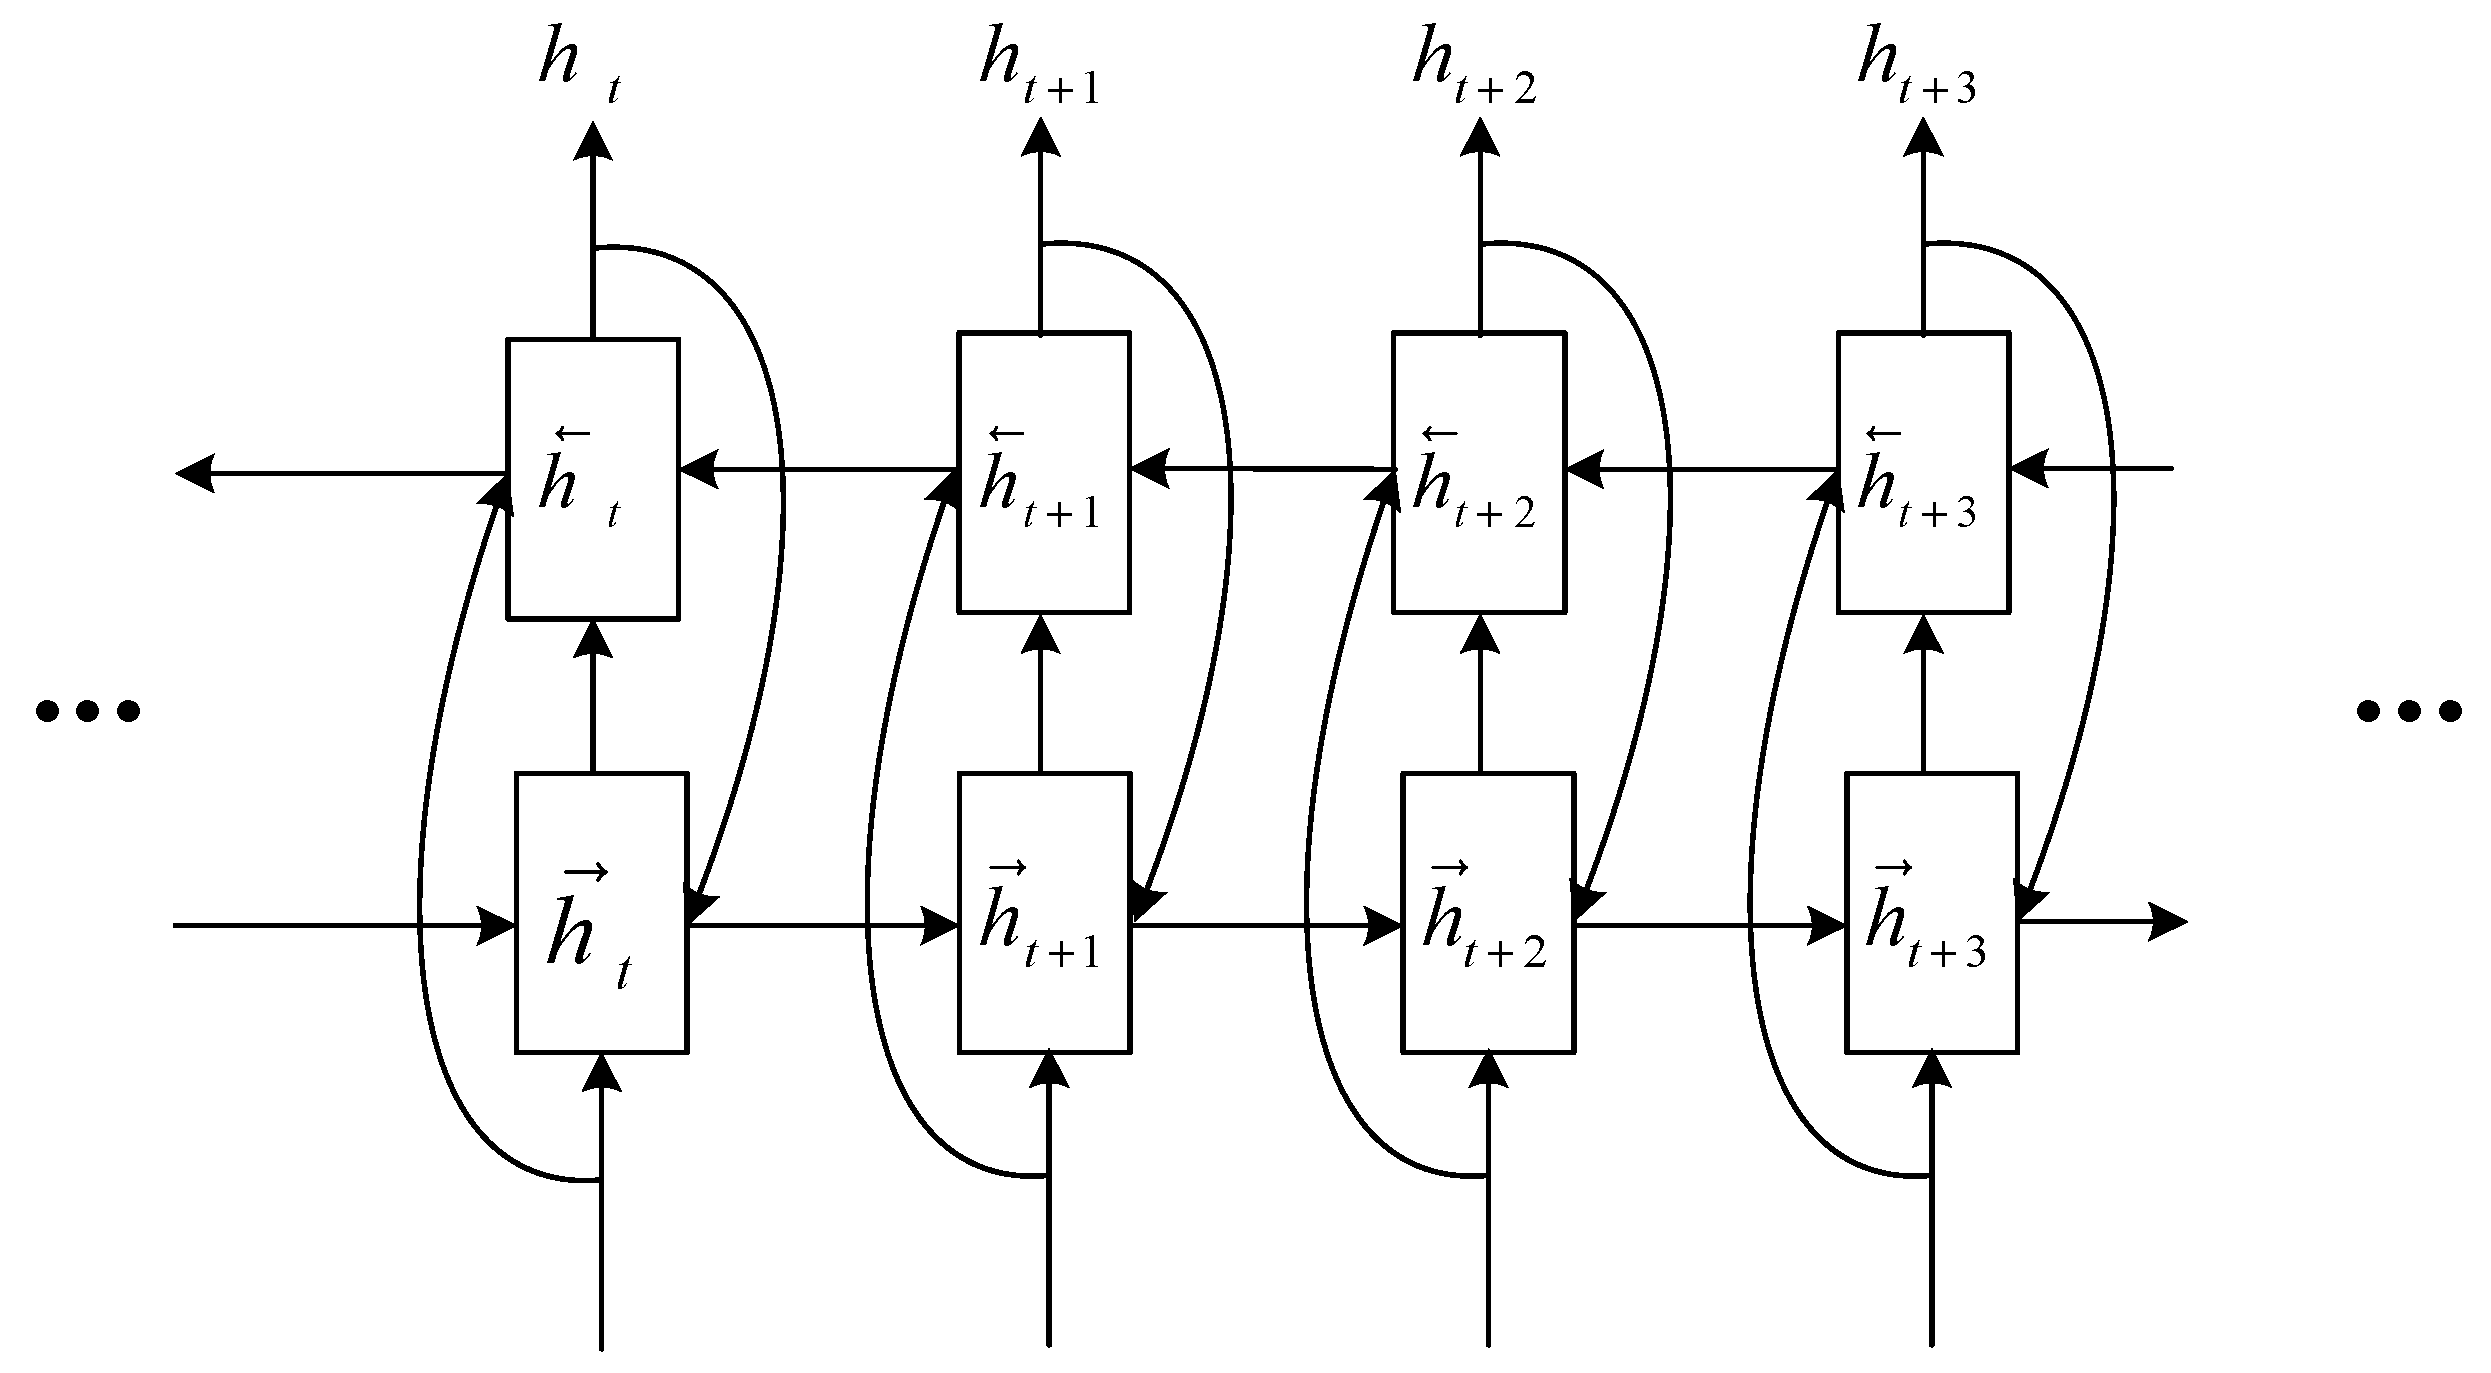
A single-layer LSTM model can only capture unidirectional features of the target word and fails to fully account for contextual information. Therefore, a bidirectional LSTM (BiLSTM) network is adopted in this study.
Figure 9 illustrates the model architecture of BiLSTM.
The BiLSTM layer receives the multi-source embedding outputs and utilizes both forward and backward LSTM networks to compute the forward representation
and the backward representation
of each input character at time step
. Subsequently, the model concatenates the hidden states from both directions to produce the final BiLSTM output
, as defined in Equation (8).
2.4.3. Label Decode Layer
Although the BiLSTM model is capable of generating token-level label predictions, it does not effectively account for the dependencies between adjacent labels in sequence labeling tasks. For instance, under the BMES tagging scheme, a label such as “B-Object” should logically be followed by “M-Object” or “E-Object”, but not by unrelated tags like “S-File” or “O”. Similarly, the initial character in a sequence is typically labeled as “B-” (beginning) or “S-” (single), rather than “M-” (middle) or “E-” (end). These label transition rules imply that BiLSTM outputs alone may violate structural constraints, resulting in invalid sequences. To resolve this limitation, a Conditional Random Field (CRF) [
27] layer is applied on top of the BiLSTM. The CRF models the dependencies between adjacent labels through a learnable transition matrix, which assigns scores to permissible label transitions. By considering the entire label sequence during decoding, the CRF ensures that the final output adheres to the syntactic structure imposed by the BMES scheme, thereby yielding globally optimal and consistent predictions.
To obtain a valid label sequence, the BiLSTM layer generates a score matrix
, where each element
represents the emission score for assigning the
label to the
character
in the input sequence. The scoring function used to evaluate a predicted label sequence for a given input is formulated as:
In this formulation, represents the transition score matrix, where encodes the transition likelihood from label to label . The emission component captures the confidence score of assigning label to the character at position in the input.
The probability of the output label sequence
is computed using the softmax normalization function, as defined below:
Here, denotes the complete set of candidate label sequences, and represents the ground-truth annotation.
To identify the most probable label sequence for a given input
, the Viterbi algorithm is employed to search for the sequence
that maximizes the overall score. Specifically,
corresponds to the label configuration with the highest output probability, and is computed as:
2.5. Knowledge Fusion
After processing unstructured violation description texts from power grid field operations using Named Entity Recognition (NER) techniques, a large number of entity terms are typically extracted. These often exhibit semantic ambiguity, redundancy, or inconsistent formatting [
28]. Among such entities, many synonymous or semantically similar expressions may exist—for example, “梯子 (ladder)” and “扶梯 (step ladder)”, or “围栏 (fence)” and “遮栏 (barrier)”. Without further processing, these terms can result in a proliferation of redundant entities in the knowledge graph, thereby compromising structural accuracy and significantly reducing the efficiency of query and reasoning operations. Therefore, it is necessary to perform knowledge fusion on the extracted entities.
The core objective of knowledge fusion is to unify and standardize different expressions of the same concept. This is achieved through techniques such as entity alignment and synonym merging, ensuring that each normalized entity is assigned a unique identifier, and thus maintaining the consistency and completeness of the knowledge graph structure. Specifically, when the semantic similarity between two extracted entities exceeds a predefined threshold, they are merged and normalized to the entity that has the larger frequency count in the corpus, which improves graph compactness while preserving dominant terminology usage.
In addition, considering the variations in on-site working environments, management practices, and safety cultures across different municipal bureaus, this study further incorporates TF-IDF algorithms to compute the importance weights of entities extracted by the NER model from violation descriptions. High-frequency domain-specific terms that characterize violation behaviors in each region are identified, enabling the construction of representative violation profiles for different municipal bureaus and providing support for subsequent risk analysis and behavior profiling. TF-IDF is computed as follows:
where
denotes the frequency of term
in document
, and the denominator represents the total number of term occurrences in the document, calculated as the sum of frequencies of all terms. Here,
denotes the number of unique terms contained in the document.
IDF formula:
where
refers to the overall size of the document collection and
indicates the count of documents in which the term
appears. To prevent division by zero, the denominator is adjusted by adding 1.
2.6. Entity Relationship Extraction
After completing the named entity recognition of unstructured text data and the statistical analysis of probability distributions in structured data, the semantic associations between entities are further clarified based on the predefined entity-relationship rules defined in the schema layer. Subsequently, a knowledge graph for grid operation violations is constructed. This graph represents various entities and their associated attributes within the grid operation scenario in a structured manner, thereby enhancing the organization and semantic interpretability of the data.
As an illustrative example, the construction result of the knowledge graph corresponding to the probability distribution of “outside unit” under the dimension of “operation subject” at the overall level is presented in
Figure 10. This figure demonstrates the entity’s relational structure and associated weight information within the context of actual operational data.
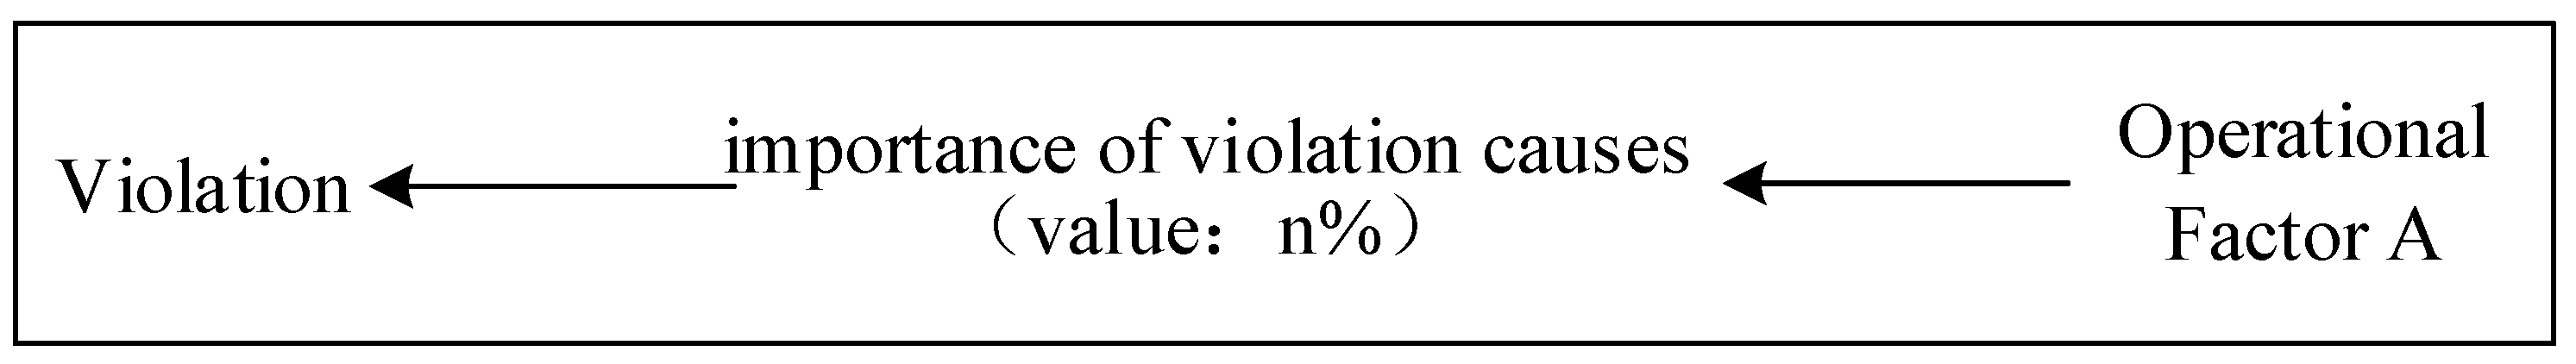
In addition, this study also considers the contribution of operational factors to violation analysis at the overall level. A mutual information–based method [
29] is employed to assess the degree of association between operational factors and violations. The data used for this analysis are derived from the historical on-site operation violation records, specifically from the columns corresponding to operational factors—namely operation entity, task source, operation category, specialty type, voltage level, risk level, and working mode—and the violation label column. All variables involved are discreet.
To quantify the correlation between each operational factor and the occurrence of violations, mutual information is computed. The strength of the association between an operational factor and violation behavior increases with the mutual information value. Mutual information is computed as follows:
Here, X represents the operational factor (e.g., operation entity) and Y denotes the violation status. represents the joint probability distribution over and ; and correspond to the marginal probability distributions of X and Y; and denotes the mutual information of X and Y.
In practical computation, the joint probability distribution
and the marginal probabilities
and
are estimated by counting the co-occurrence frequencies of each operational factor and the violation category in the historical dataset. For example, considering the operational factor “operation entity”, which takes values such as internal unit and external unit, the co-occurrence frequencies between each value and violation status are calculated. Based on these statistics, the mutual information is computed to quantify the contribution of this operational factor to violations. An illustrative example is shown in
Figure 11.
3. Experimental Evaluation and Result Analysis
3.1. Data Introduction and Preprocessing
A complete set of power grid field violation inspection records from the year 2023 was obtained from a power grid company. These records include various types of information, such as operational factors, violation details, municipal bureaus, and violators. Both the textual descriptions of field operation violations and the structured tabular data were processed through a series of preprocessing steps. As a result, a total of 47,980 meaningful violation inspection records were retained.
For the violation description texts, five entity categories were defined based on expert knowledge in the power domain: Action, Object, File, Person, and Surrounding. Entity annotation was then performed accordingly. The YEDDA annotation tool was adopted due to its efficiency in sequence labeling tasks, and the BMES tagging scheme was used for annotating the violation descriptions.
In this tagging scheme, B denotes the beginning of an entity, M and E represent the middle and end of an entity, respectively, while S indicates a single-character entity. The final annotation was independently conducted by two annotators with domain expertise. Any discrepancies were resolved through discussion and re-annotation to ensure consistency and quality of the labeled data.
A total of 32,380 entities were annotated in the electric grid violation dataset. Among them, Action, Object, File, Person, and Surrounding entities account for approximately 32.7%, 30.1%, 12.7%, 10.0%, and 14.5%, respectively. In the experimental validation process, we partitioned the annotated dataset of textual descriptions for field operation violations into training, validation, and test sets, using a 7:2:1 ratio.
3.2. Evaluation Metrics for Chinese NER Model
Named Entity Recognition (NER) is typically evaluated using three key metrics:
Precision,
Recall, and
F1-Score. The
F1-Score, calculated as the harmonic means of precision and recall, provides a balanced evaluation of the model’s overall effectiveness. The formulas for these evaluation metrics are given in Equations (16)–(18):
Here, TP (True Positive) is the count of correctly identified positive samples, FP (False Positive) is the count of negative samples wrongly labeled as positive, and FN (False Negative) is the count of positive samples incorrectly labeled as negative.
Precision, Recall, and F1-Score range from 0 to 1, with values closer to 1 indicating superior model performance.
3.3. Experimental Results of Chinese NER Model
To evaluate the effectiveness of the proposed model, five commonly used named entity recognition models are selected for comparison, i.e., BiLSTM-CRF [
30], LR-CNN [
31], Lattice-LSTM [
25], BERT-CRF [
32], and BERT-BiLSTM-CRF [
33], using BERT-BiLSTM-CRF as the baseline model. To ensure experimental rigor, we set the batch size to 32, aligning with the typical length of violation description texts in the historical power grid field operation records.
To further ensure a fair comparison, all models, including the proposed one, adopt the Adam optimizer with an identical learning rate setting of 0.0001, and the number of training epochs is set to 128. The detailed comparison results are presented in
Table 3.
The proposed model demonstrates superior performance across all three key metrics (Precision, Recall, and F1-score) compared to comparative methods, as shown in
Table 3, highlighting its enhanced accuracy in recognizing entities within power grid violation descriptions. The comparative results between the proposed model and both BiLSTM-CRF and BERT-CRF clearly demonstrate the advantage of utilizing BERT, which excels at capturing deep semantic information from textual data. Furthermore, the comparison between the proposed model and BERT-BiLSTM-CRF indicates that the multi-source embedding layer introduced in this study provides richer semantic representations than using BERT embeddings alone. By incorporating additional lexical and contextual cues, the proposed model is able to extract more informative features and achieve enhanced entity recognition performance. Moreover, the comparison with classical Chinese lexical fusion models such as Lattice-LSTM and LR-CNN further validates the effectiveness of the proposed lexical fusion mechanism and the introduced Multi-Head Self-Attention Residual Module, which jointly contribute to more robust and accurate entity recognition.
To further evaluate the real-world effectiveness of the proposed method, a robust analysis was conducted using raw violation description texts from power grid operation records, without any preprocessing. These texts commonly contain various types of noise, including:
Omissions, such as using incomplete terms like “试验标签 (test label)” instead of the correct “试验合格标签 (qualified test label)”, or “安全技术交底 (safety technical disclosure)” instead of “安全技术交底单 (safety technical disclosure form)”;
Typographical errors, such as “师机 (machine master, incorrect)” for “司机 (driver)”, “安全遮拦 (safety barricade, incorrect)” for “安全遮栏 (safety fence)”, and “实验 (experiment, incorrect)” mistakenly used for “试验 (test)”;
Abbreviations, such as “安措 (abbrev. for safety measures)” for “安全措施 (safety measures)” and “接地 (grounding, abbreviated)” for “接地线 (grounding wire)”.
Such inconsistencies frequently occur in field documentation and can affect the performance of named entity recognition. Therefore, a comparative evaluation between the proposed model and the baseline model is designed to assess their ability to handle noisy inputs.
As shown in
Table 4, the performance of both models declines when evaluated on noisy data, which simulates common real-world issues such as omissions, typographical errors, and abbreviations. The BERT-BiLSTM-CRF model exhibits a notable F1 drop of 5.54%, highlighting its limited robustness in handling such irregularities. In contrast, the proposed model shows a much smaller degradation of only 1.71%, demonstrating superior resilience to input noise.
The robustness can be attributed to the integration of a multi-source lexical embedding mechanism, particularly the inclusion of domain-specific gazetteers. Many noise-affected terms—such as omissions, typographical errors, abbreviations—are explicitly covered in the curated dictionaries. As a result, the proposed model can still identify entity boundaries accurately even when the input text contains inconsistencies or non-standard terminology. This underscores the practical applicability of the method in real-world power grid operation scenarios where data quality cannot always be guaranteed.
To assess cross-domain performance, we extended our evaluation to the general-domain Weibo dataset. The results, presented in
Table 5, show that the model achieves an average improvement of approximately 1% across all three metrics on this dataset. The evaluation results in general domains validate the robustness of the proposed model.
To offer a more comprehensive evaluation of the performance advantages of the proposed model, a statistical significance test was conducted using paired two-tailed t-tests on the F1-scores obtained across multiple runs. The results are summarized in
Table 6.
For the Power Grid Violation Description Dataset (
Table 3), the F1-score improvements of the proposed model over the strongest baselines (e.g., BERT-BiLSTM-CRF) were found to be statistically significant (
p < 0.01). Similarly, for the general Weibo dataset (
Table 6), the improvement in F1-score also reached statistical significance with
p < 0.05. These results indicate that the observed performance gains are unlikely to be due to random variation.
3.4. Knowledge Graph Construction Results
3.4.1. Knowledge Graph Construction Results at the Overall Level
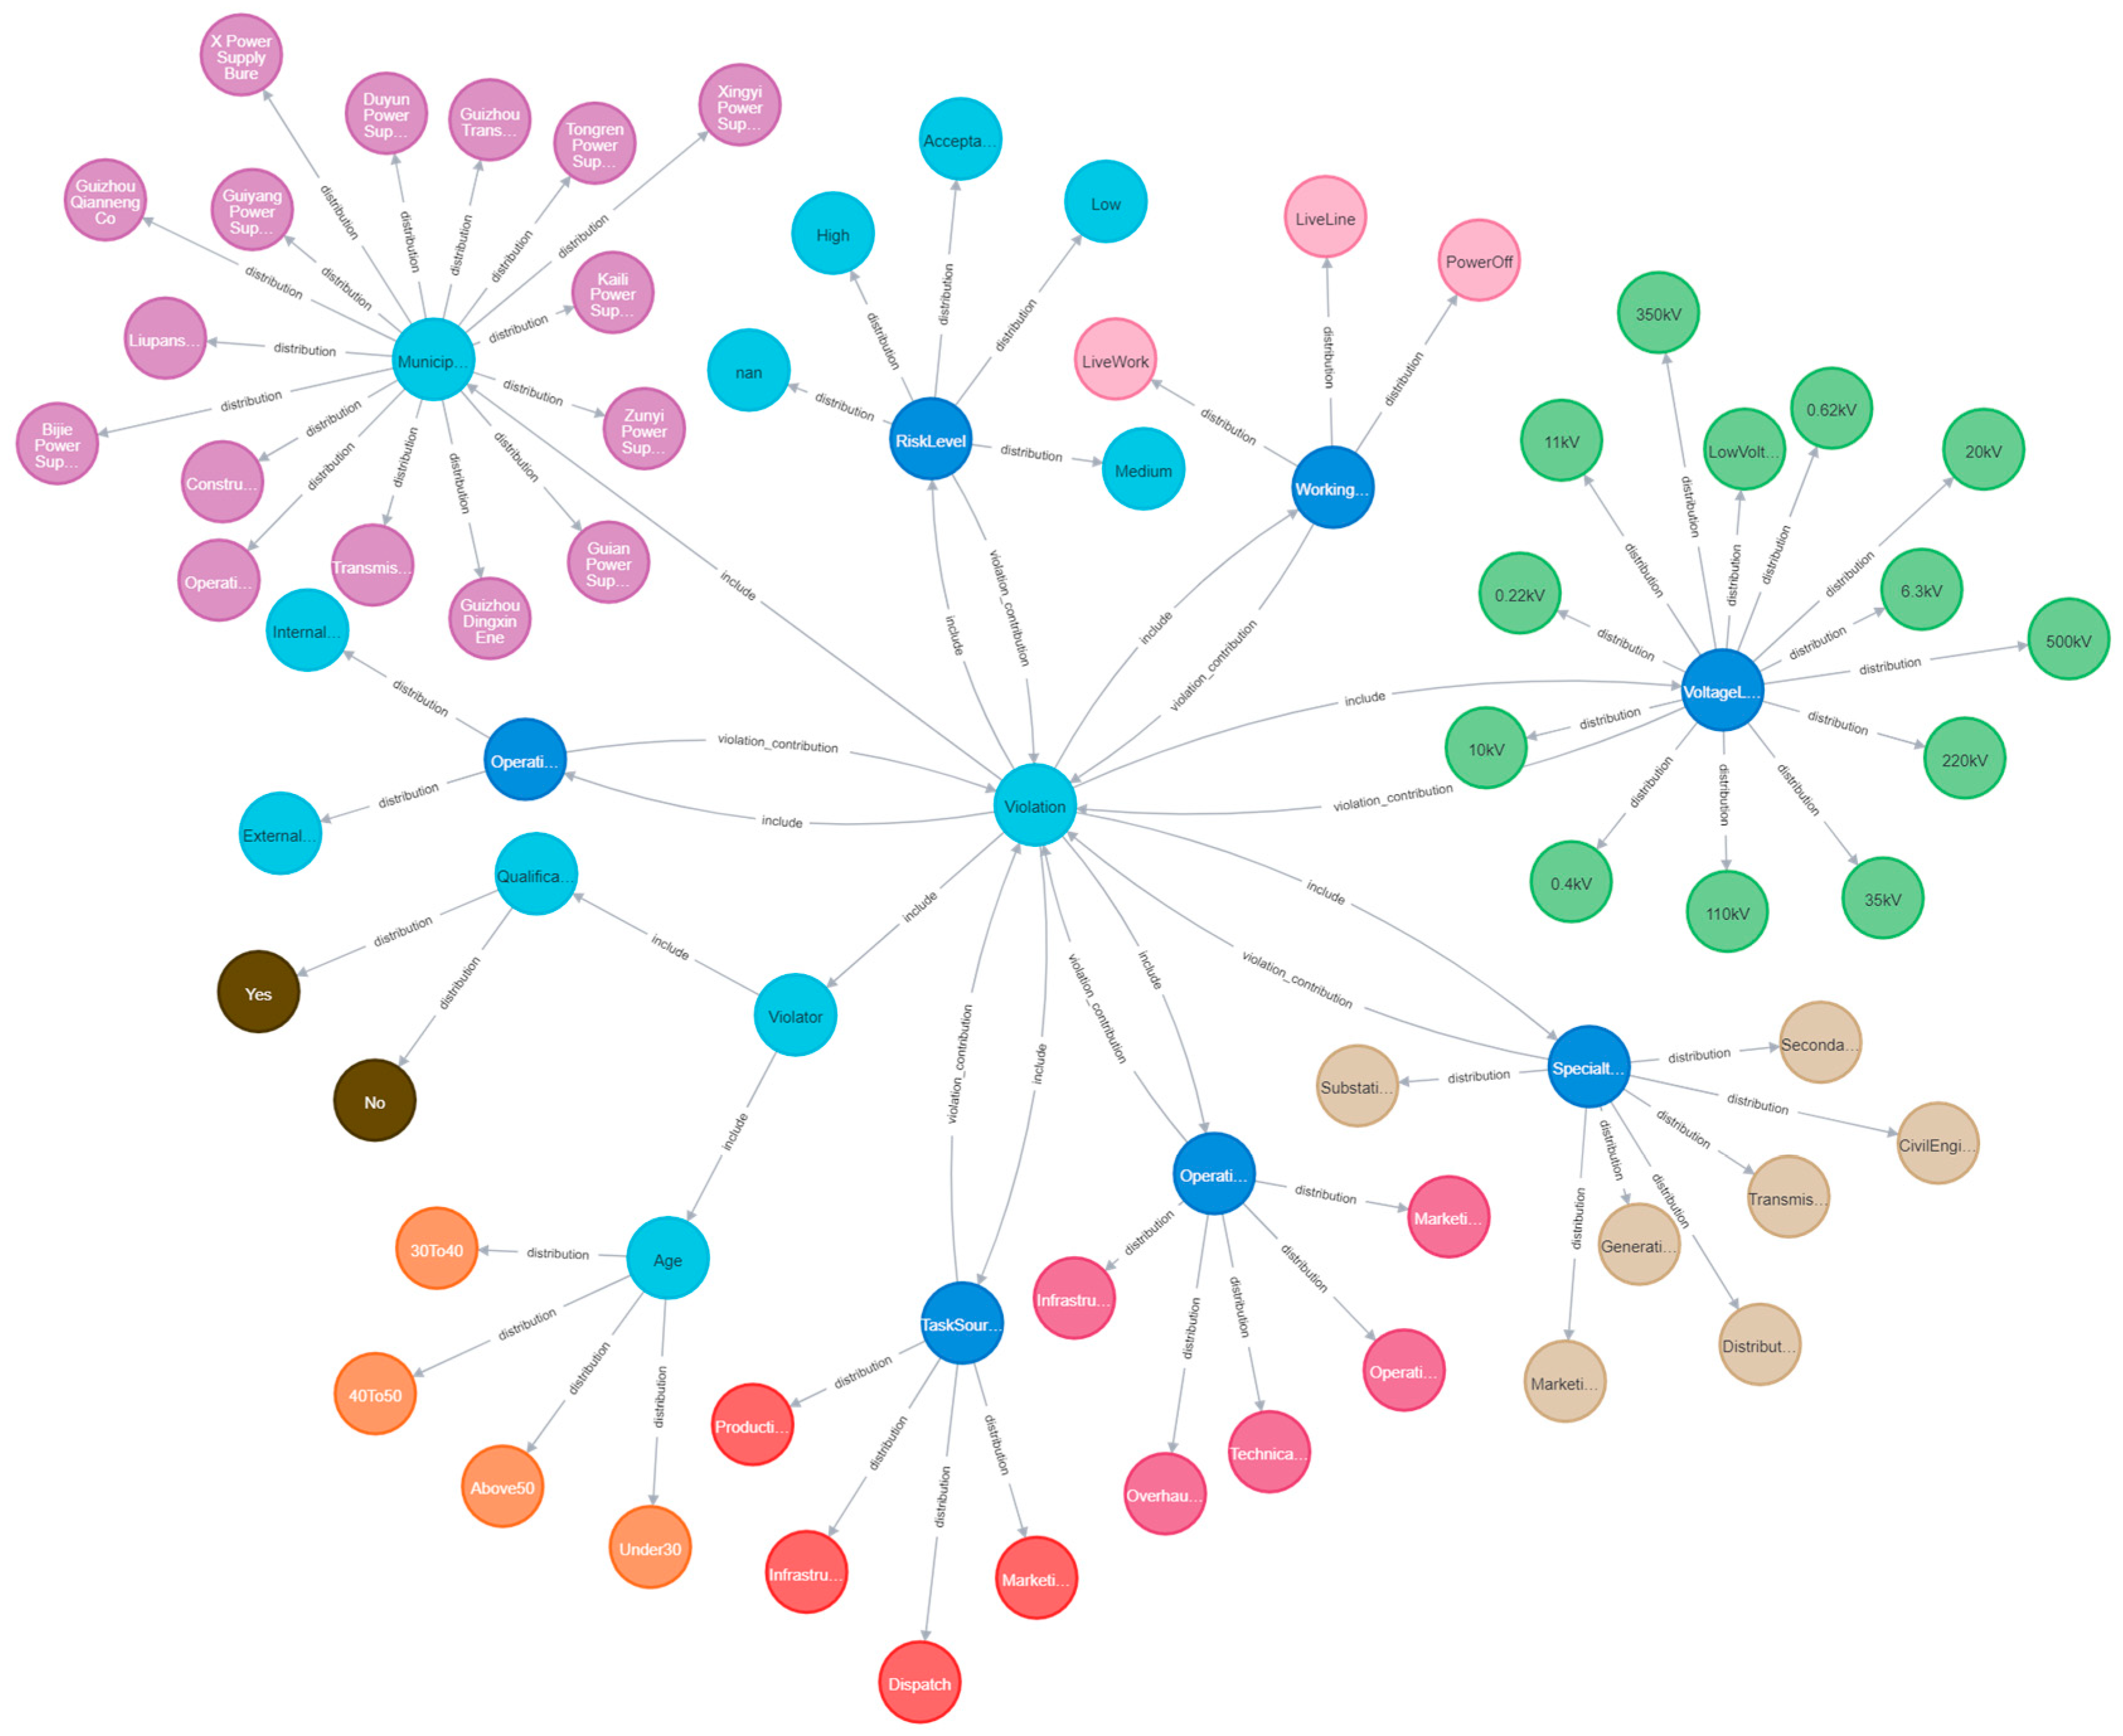
The overall knowledge graph comprises 73 entity nodes and 79 relational edges. Entities are organized according to their semantic functions, with the “violation” node serving as the central risk entity. Surrounding it are seven operational factor nodes: operation entity, task source, operation category, specialty type, voltage level, risk level, and work mode. These factors are linked to 39 corresponding value nodes with explicit labels (e.g., “external unit”, “internal unit”).
To reflect the regional hierarchy, the graph includes one overall-level municipal bureau node and 16 subordinate municipal bureau nodes (e.g., A and B Power Supply Bureau). Additionally, a violator node is introduced and further refined based on qualification (“three types of personnel”) and age range, resulting in a total of eight feature nodes, details can be found in
Table 7.
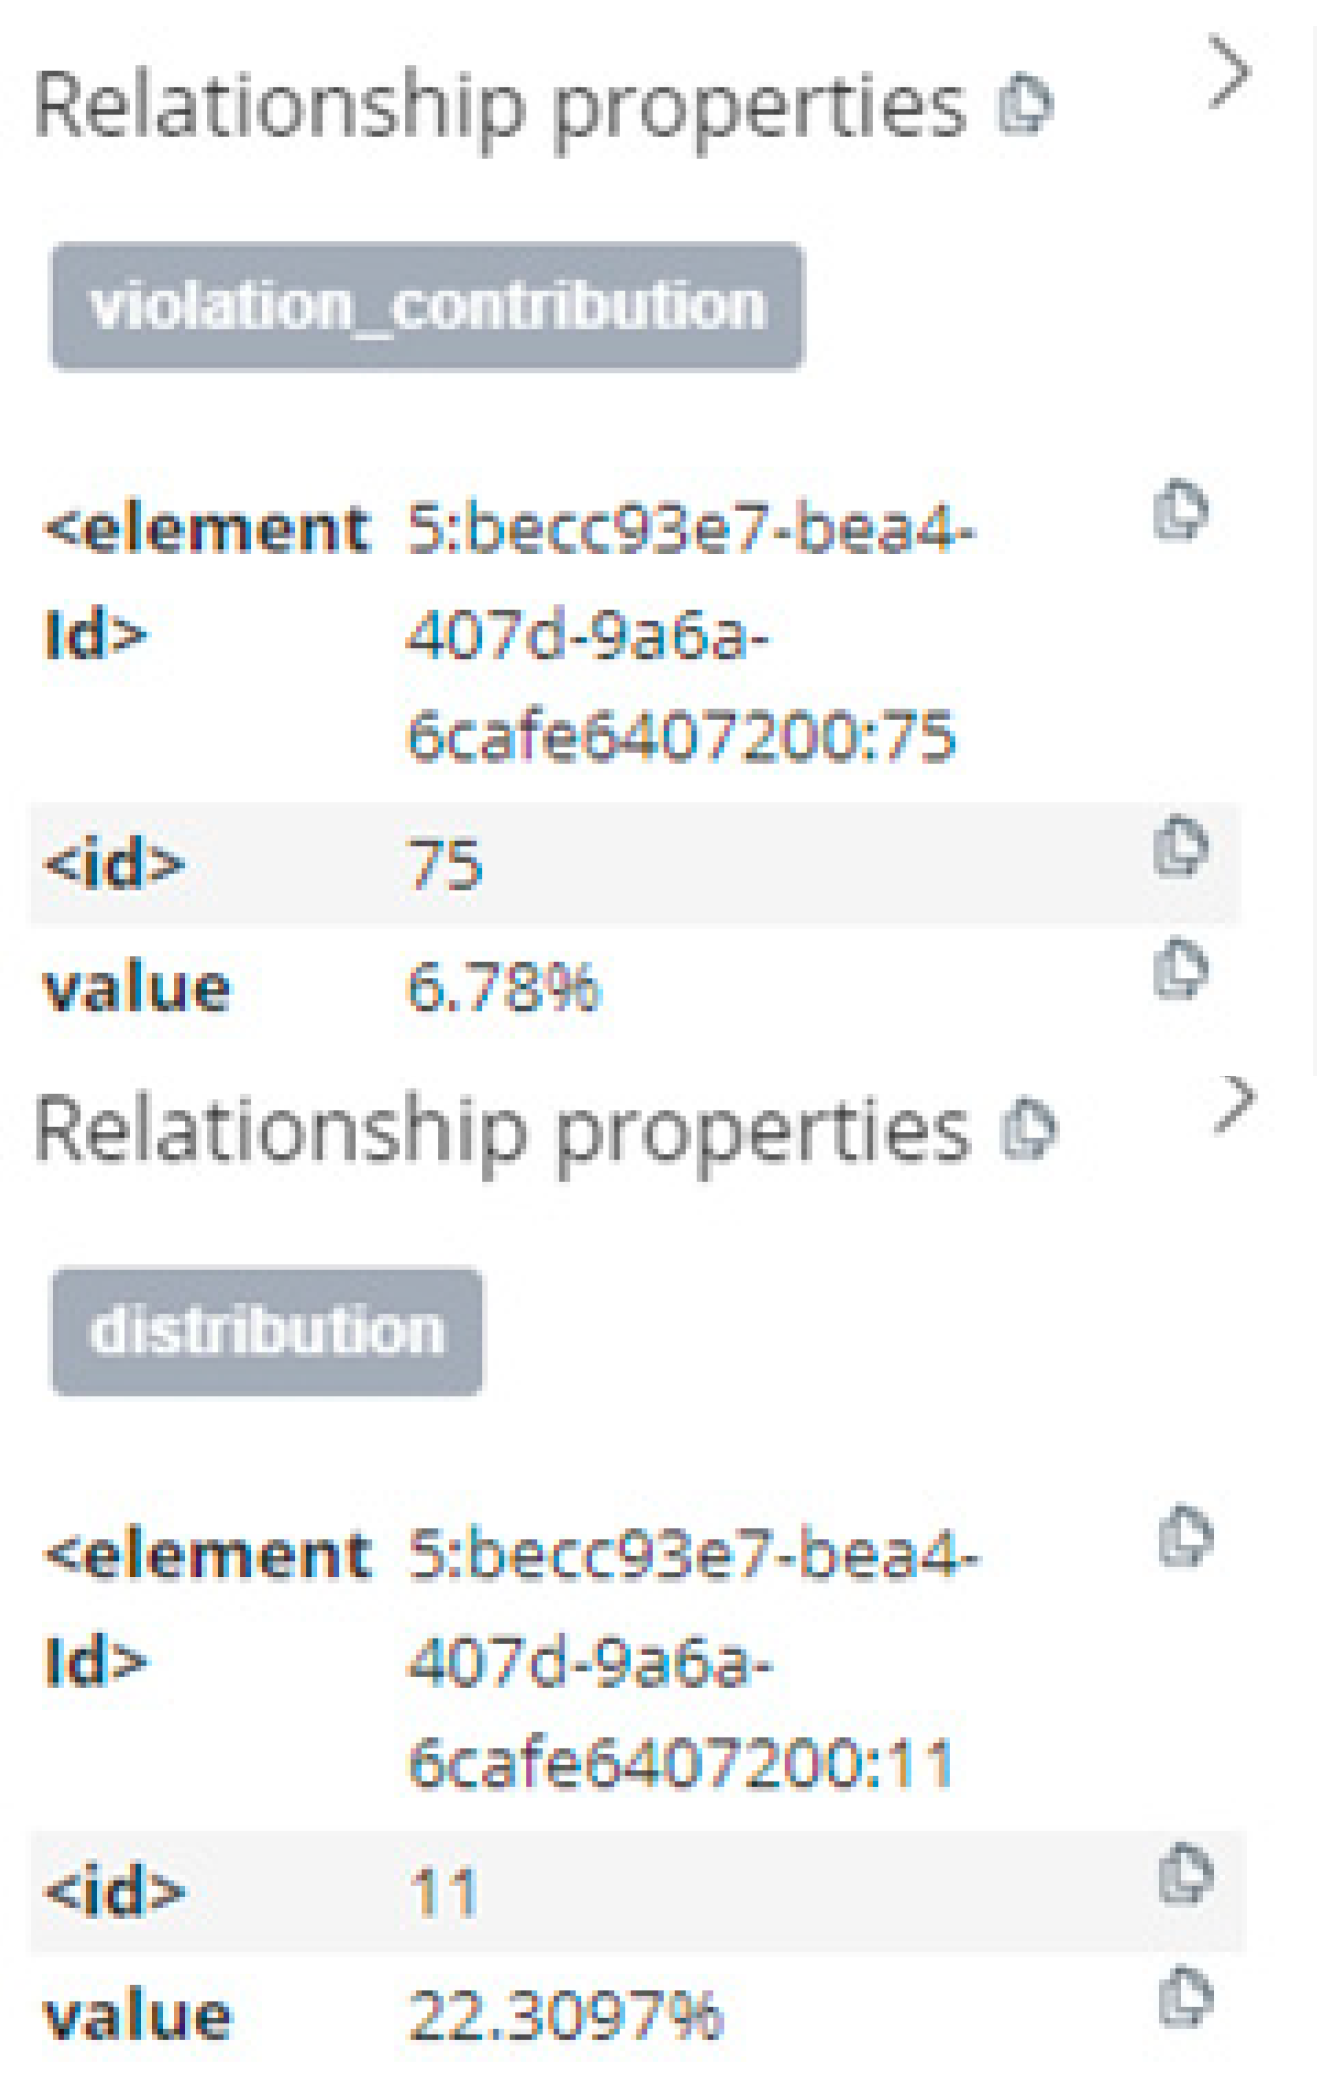
The graph structure contains 8 “include” relationships (violation → factors), 61 “probability distribution” relationships (factors → values), and 7 “violation cause importance” relationships (factors → violation), with importance scores calculated using mutual information.
The entire knowledge graph has been deployed and stored in the Neo4j graph database.
Figure 12 provides a detailed illustration of relationship attributes, where all probability and contribution values are embedded as edge attributes.
Table 8 lists the structure of the overall-level knowledge graph, and the complete visualization is shown in
Figure 13.
3.4.2. Named Entity Recognition for X Power Supply Bureau
From a preprocessed dataset comprising 15,183 historical records from a power grid company, 1328 records corresponding to X Power Supply Bureau were extracted. The unstructured text data describing on-site operational violations from these records were analyzed using the pre-trained multi-source hybrid embedding named entity recognition (NER) model, as detailed in
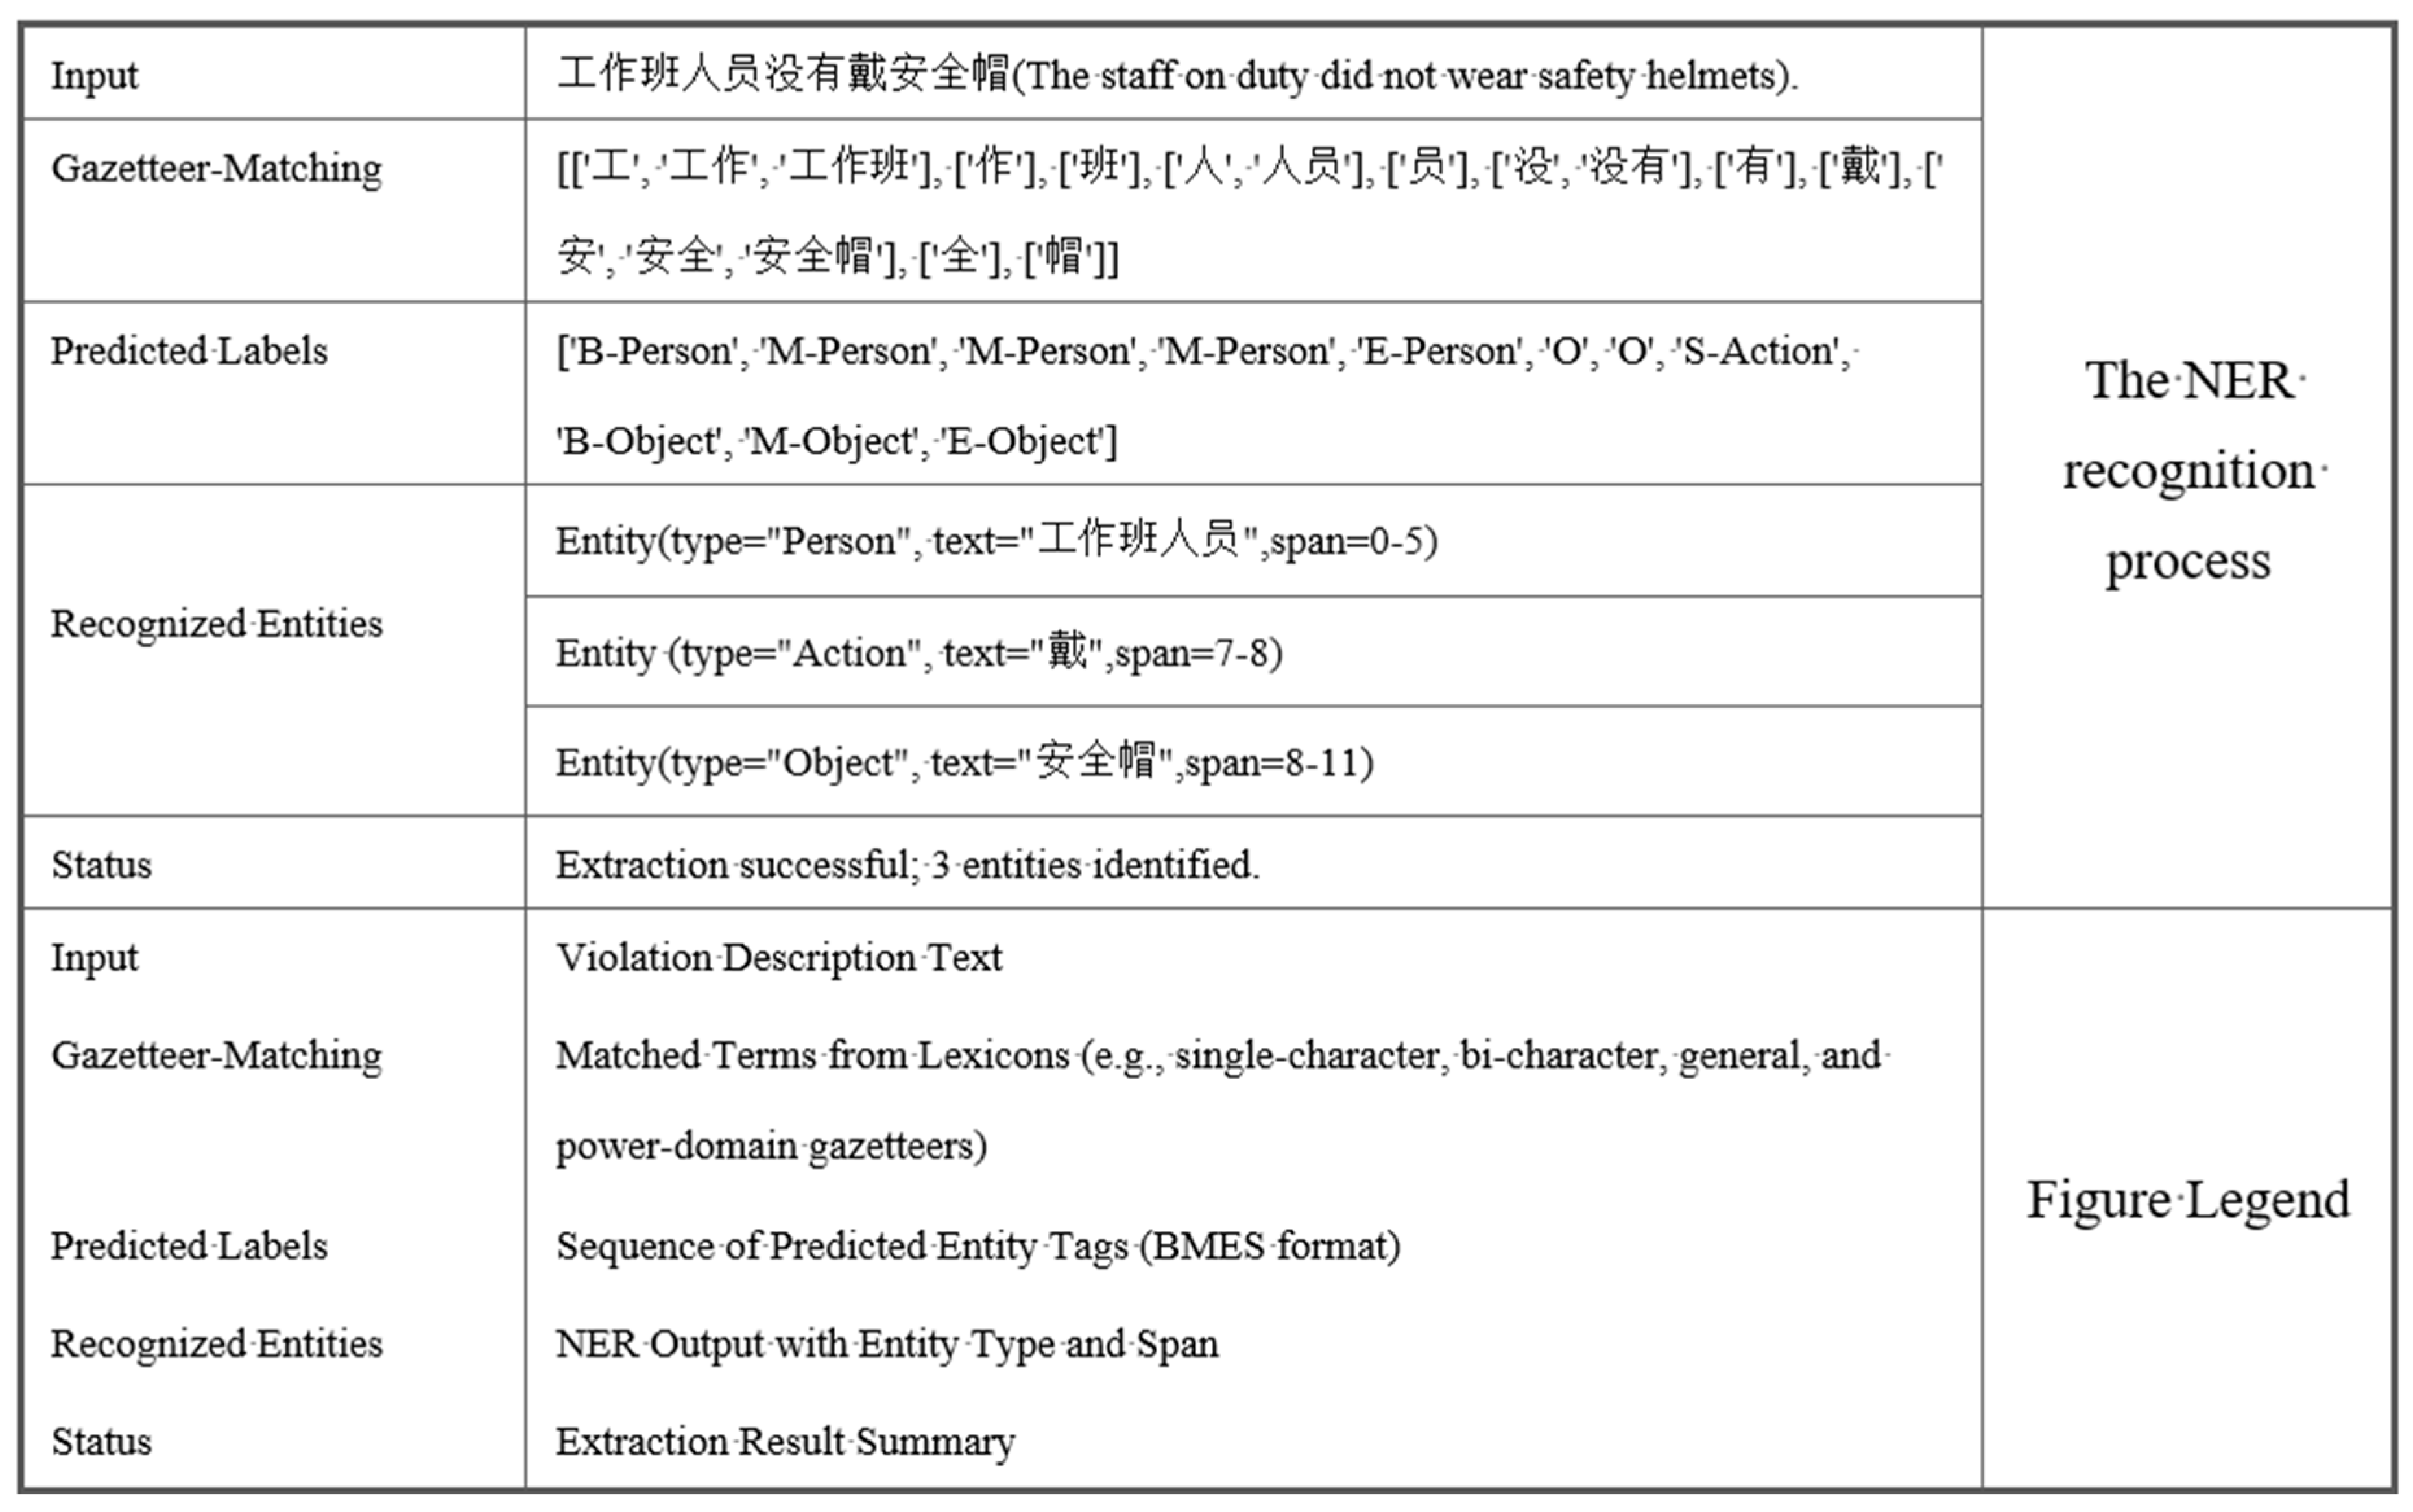
Section 3.3. The model was applied to identify five categories of power-related entities—Person, Action, Object, File, and Surrounding—within the violation description texts. To validate the effectiveness of the proposed model, a specific violation description from the X Power Supply Bureau—“工作班人员没有戴安全帽 (The staff on duty did not wear safety helmets)”—is selected as a case study.
As shown in
Figure 14, the named entity recognition process of the proposed model is demonstrated using the violation description “工作班人员没有戴安全帽 (The staff on duty did not wear safety helmets)”. The Gazetteer-Matching module aligns each character in the input sequence with matched lexical entries from multiple resources. For example, the character “工” matches entries such as “工”, “工作”, and “工作班”; “安” matches “安”, “安全”, and “安全帽”; and “帽” is matched as part of “安全帽”. The complete gazetteer match list for this input includes entries from single-character, bi-character, general lexicon, and power-domain lexicon sources.
Compared with the baseline BERT-BiLSTM-CRF model, which relies solely on contextual embeddings from general-domain corpora, the proposed model integrates multi-source hybrid embeddings, including character-level, bi-character, general lexicon, and power-domain-specific lexicon embeddings. This rich lexical information enables the model to accurately distinguish entity boundaries and identify domain-specific terms. For instance, in this case, the model successfully extracts three entities: “工作班人员” (Person), “戴” (Action), and “安全帽” (Object). This result demonstrates that the combination of domain-specific lexical knowledge with general and fine-grained lexical cues significantly improves recognition performance in technical violation texts.
A comparative analysis with baseline models is presented in
Table 9. Specifically, the baseline model BERT-BiLSTM-CRF identified only [“工作班人员 (the staff on duty)”, “戴 (wear)”] and failed to recognize the critical domain-specific entity “安全帽 (safety helmet)”. In contrast, the proposed model correctly extracted the complete entity sequence, including “工作班人员”, “戴”, and “安全帽”, demonstrating superior capability in handling power grid terminology in real-world violation texts. The baseline model relies solely on BERT, which is pre-trained on general-domain Chinese corpora and captures contextual semantics at a broad level. However, it lacks the capacity to fully recognize specialized terminology specific to the power grid domain, especially in domain-specific contexts. In contrast, the proposed model integrates multi-source hybrid embeddings, including character-level, bi-character, general lexicon, and power-domain lexicon embeddings. The inclusion of power-specific lexical information enhances the model’s ability to accurately identify entity boundaries, even when the context is ambiguous. This contributes to improved named entity recognition performance for specialized texts in the power grid domain.
As shown in
Table 10, the inference time of the proposed model is comparable to that of the baseline model, with only a slight increase in average processing time per sample (0.0729 s vs. 0.0676 s). Despite this minimal overhead, the proposed model achieves significantly better performance in accurately identifying entity boundaries, particularly for domain-specific terminology in power grid violation texts. It demonstrates that the model maintains practical feasibility for deployment in operational monitoring environments while delivering enhanced recognition accuracy.
After completing named entity recognition on all field operation violation description texts associated with X Power Supply Bureau, this study further applies the TF-IDF algorithm to extract the top five high-weight power-related terms that best represent the characteristics of the bureau—namely, “接地线 (grounding wire)”, “填写 (filling in)”, “安全交代 (safety briefing)”, “施工作业票 (work operation permit)”, and “围栏 (barrier)”. These selected terms effectively capture the typical violation patterns in the region and serve as foundational data for subsequent modeling of representative violations in X Power Supply Bureau.
3.4.3. Knowledge Graph Construction Results at the Municipal-Level
Table 11 illustrates the structure of the municipal-level knowledge graph, taking the X Power Supply Bureau as a representative example. A visualization of the field operation violation knowledge graph is provided in
Figure 15, comprising 86 entity nodes and 86 relational edges, and is modeled across three dimensions.
In the operational factors dimension, seven first-level factor nodes (e.g., distributions of operation entities and task sources) and their corresponding value nodes are constructed, totaling 46 nodes. These are connected through 7 including relationships and 39 probability distribution relationships.
In the violation situation dimension, the graph includes four violation factor nodes—problem type, violation type, violation level, and typical violations—linked to 17 value nodes. This includes 4 included relationships and 17 additional connections (12 probability distribution and 5 included relationships) to represent typical behavioral patterns. All probability values are stored as edge attributes, consistent with the overall-level model.
In the violator dimension, the graph refines violator characterization by distinguishing between habitual violators and occasional violators. The municipal-level knowledge graph contains 19 nodes and 19 edges in this dimension; details can be seen in
Table 12.
3.4.4. Key Information Query Under the Support of the Knowledge Graph
Beyond the visualization of on-site power grid operation knowledge graphs at both the overall and city levels, the constructed knowledge graph also enables the querying of critical information. The knowledge graph for on-site power grid operations presented in this invention is constructed based on data collected over a specific period. It transforms textual and structured tabular data into visualized graph data, thereby reflecting the on-site power grid during that period.
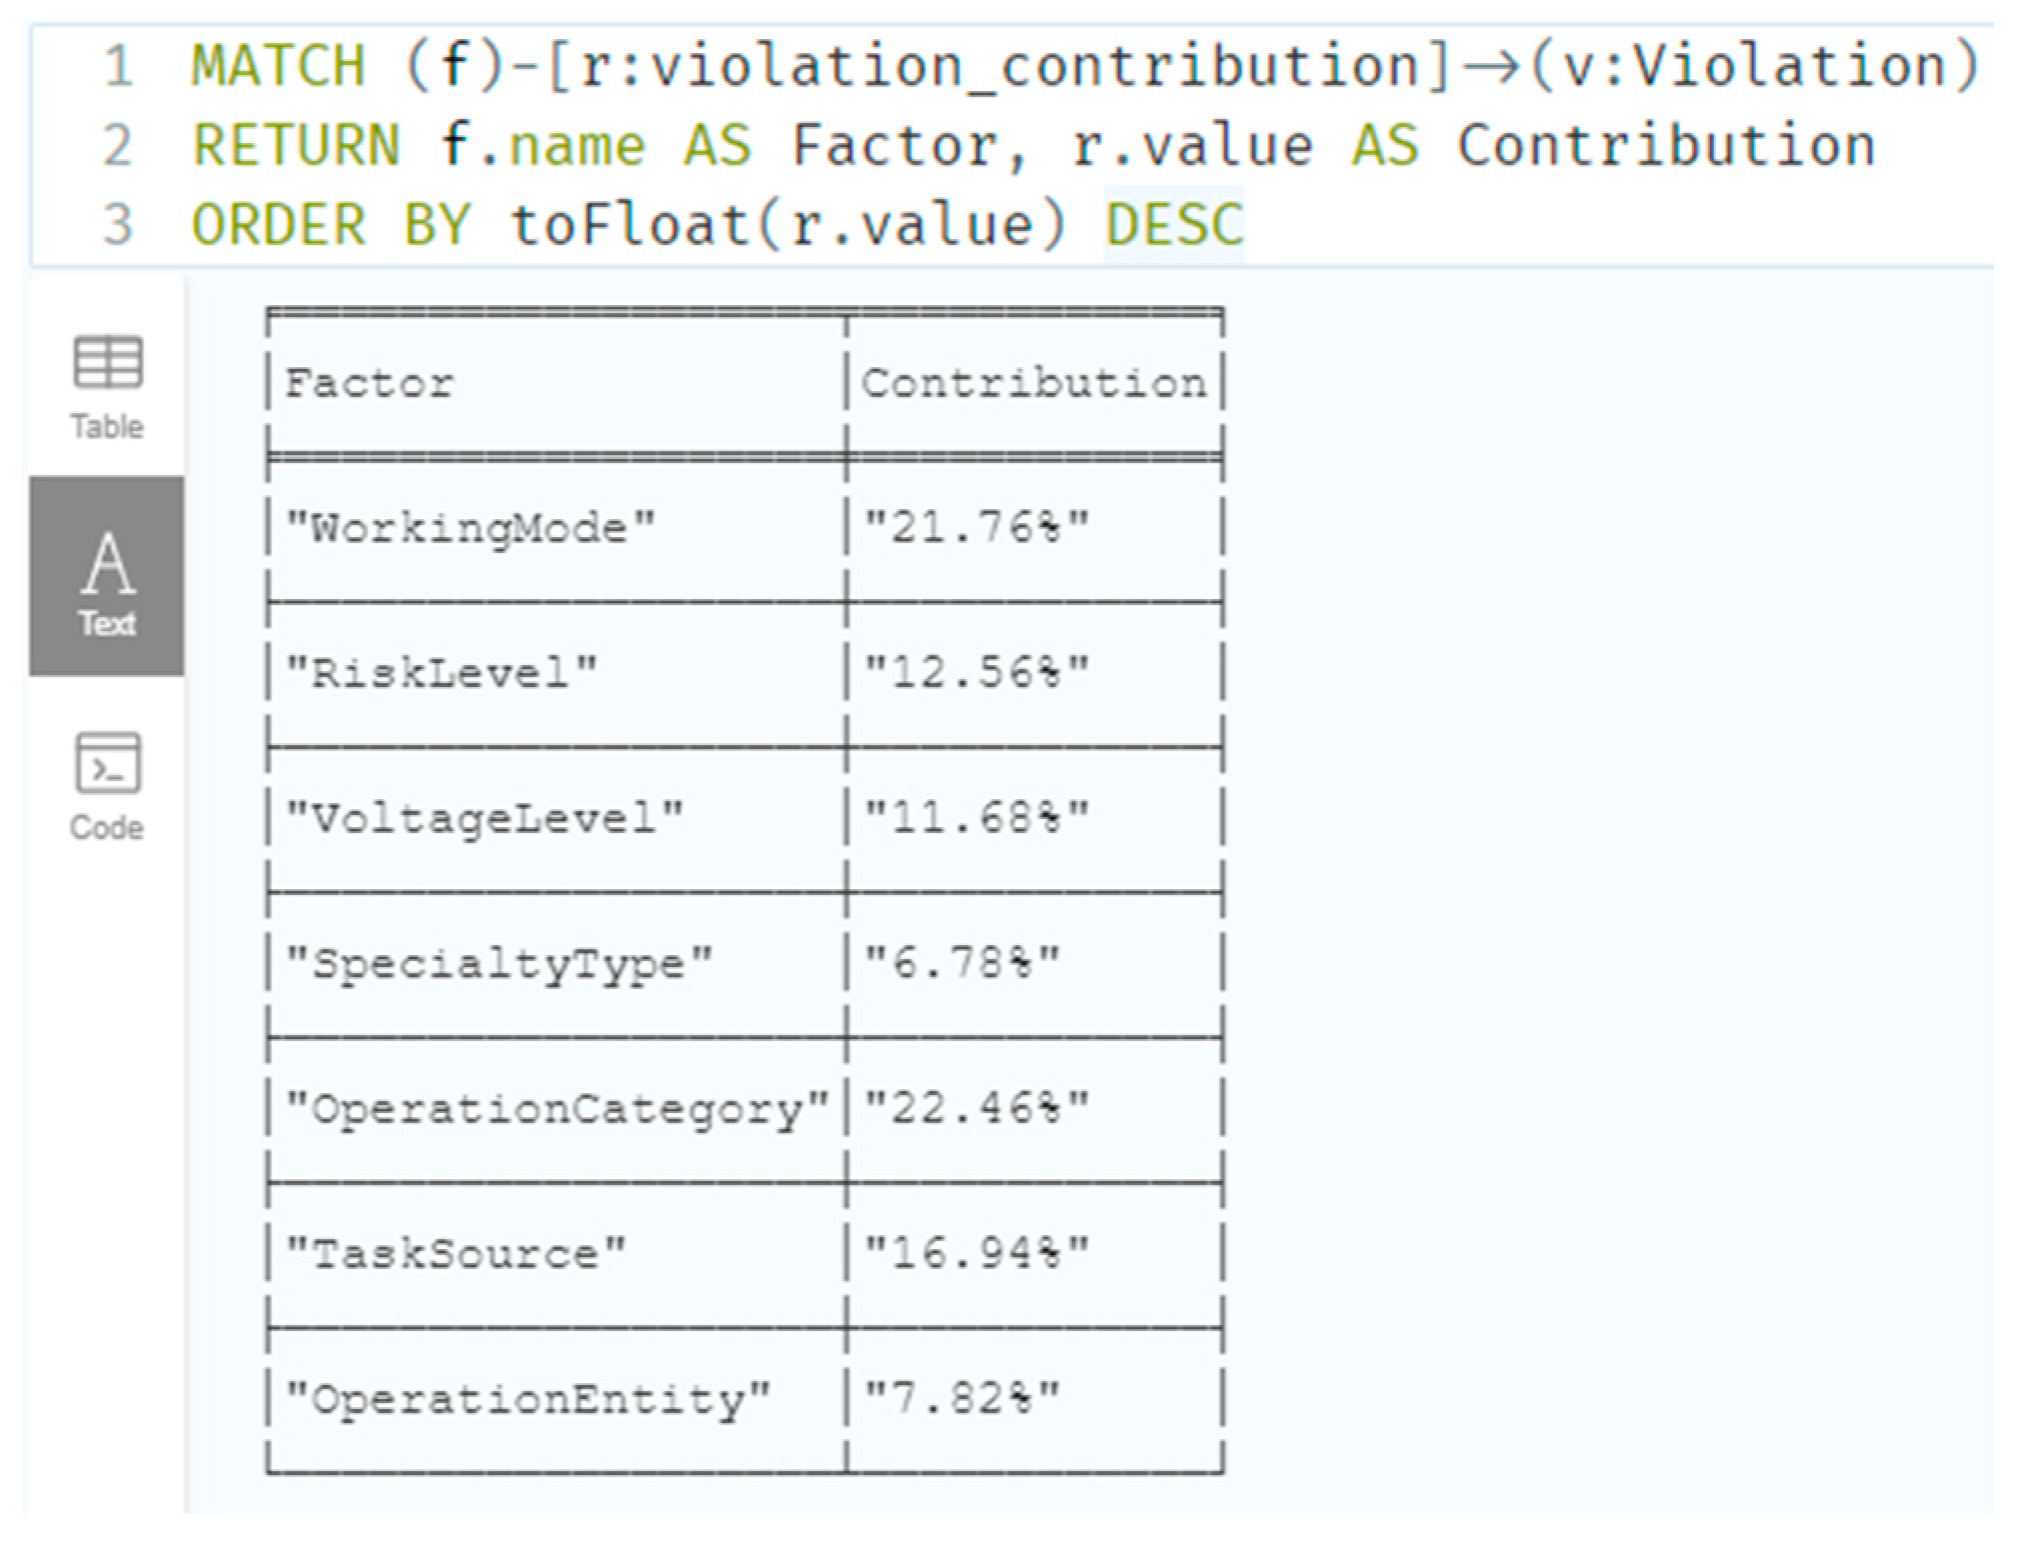
At the overall level, it is possible to query the violation contribution or distribution of operational factors during this period—including Operation Entity, Task Source, Operation Category, Specialty Type, Voltage Level, Risk Level, and Working Mode—as well as the age and qualification status of violators. As shown in
Figure 16, the following Cypher query retrieves the violation contributions of operational factors, sorted in descending order: (
MATCH (f)-[r:violation_contribution]->(v:Violation)
RETURN f.name AS Factor, r.value AS Contribution
ORDER BY toFloat(r.value) DESC
)
Figure 16.
Example chart for querying violation contribution at the overall level.
Figure 16.
Example chart for querying violation contribution at the overall level.
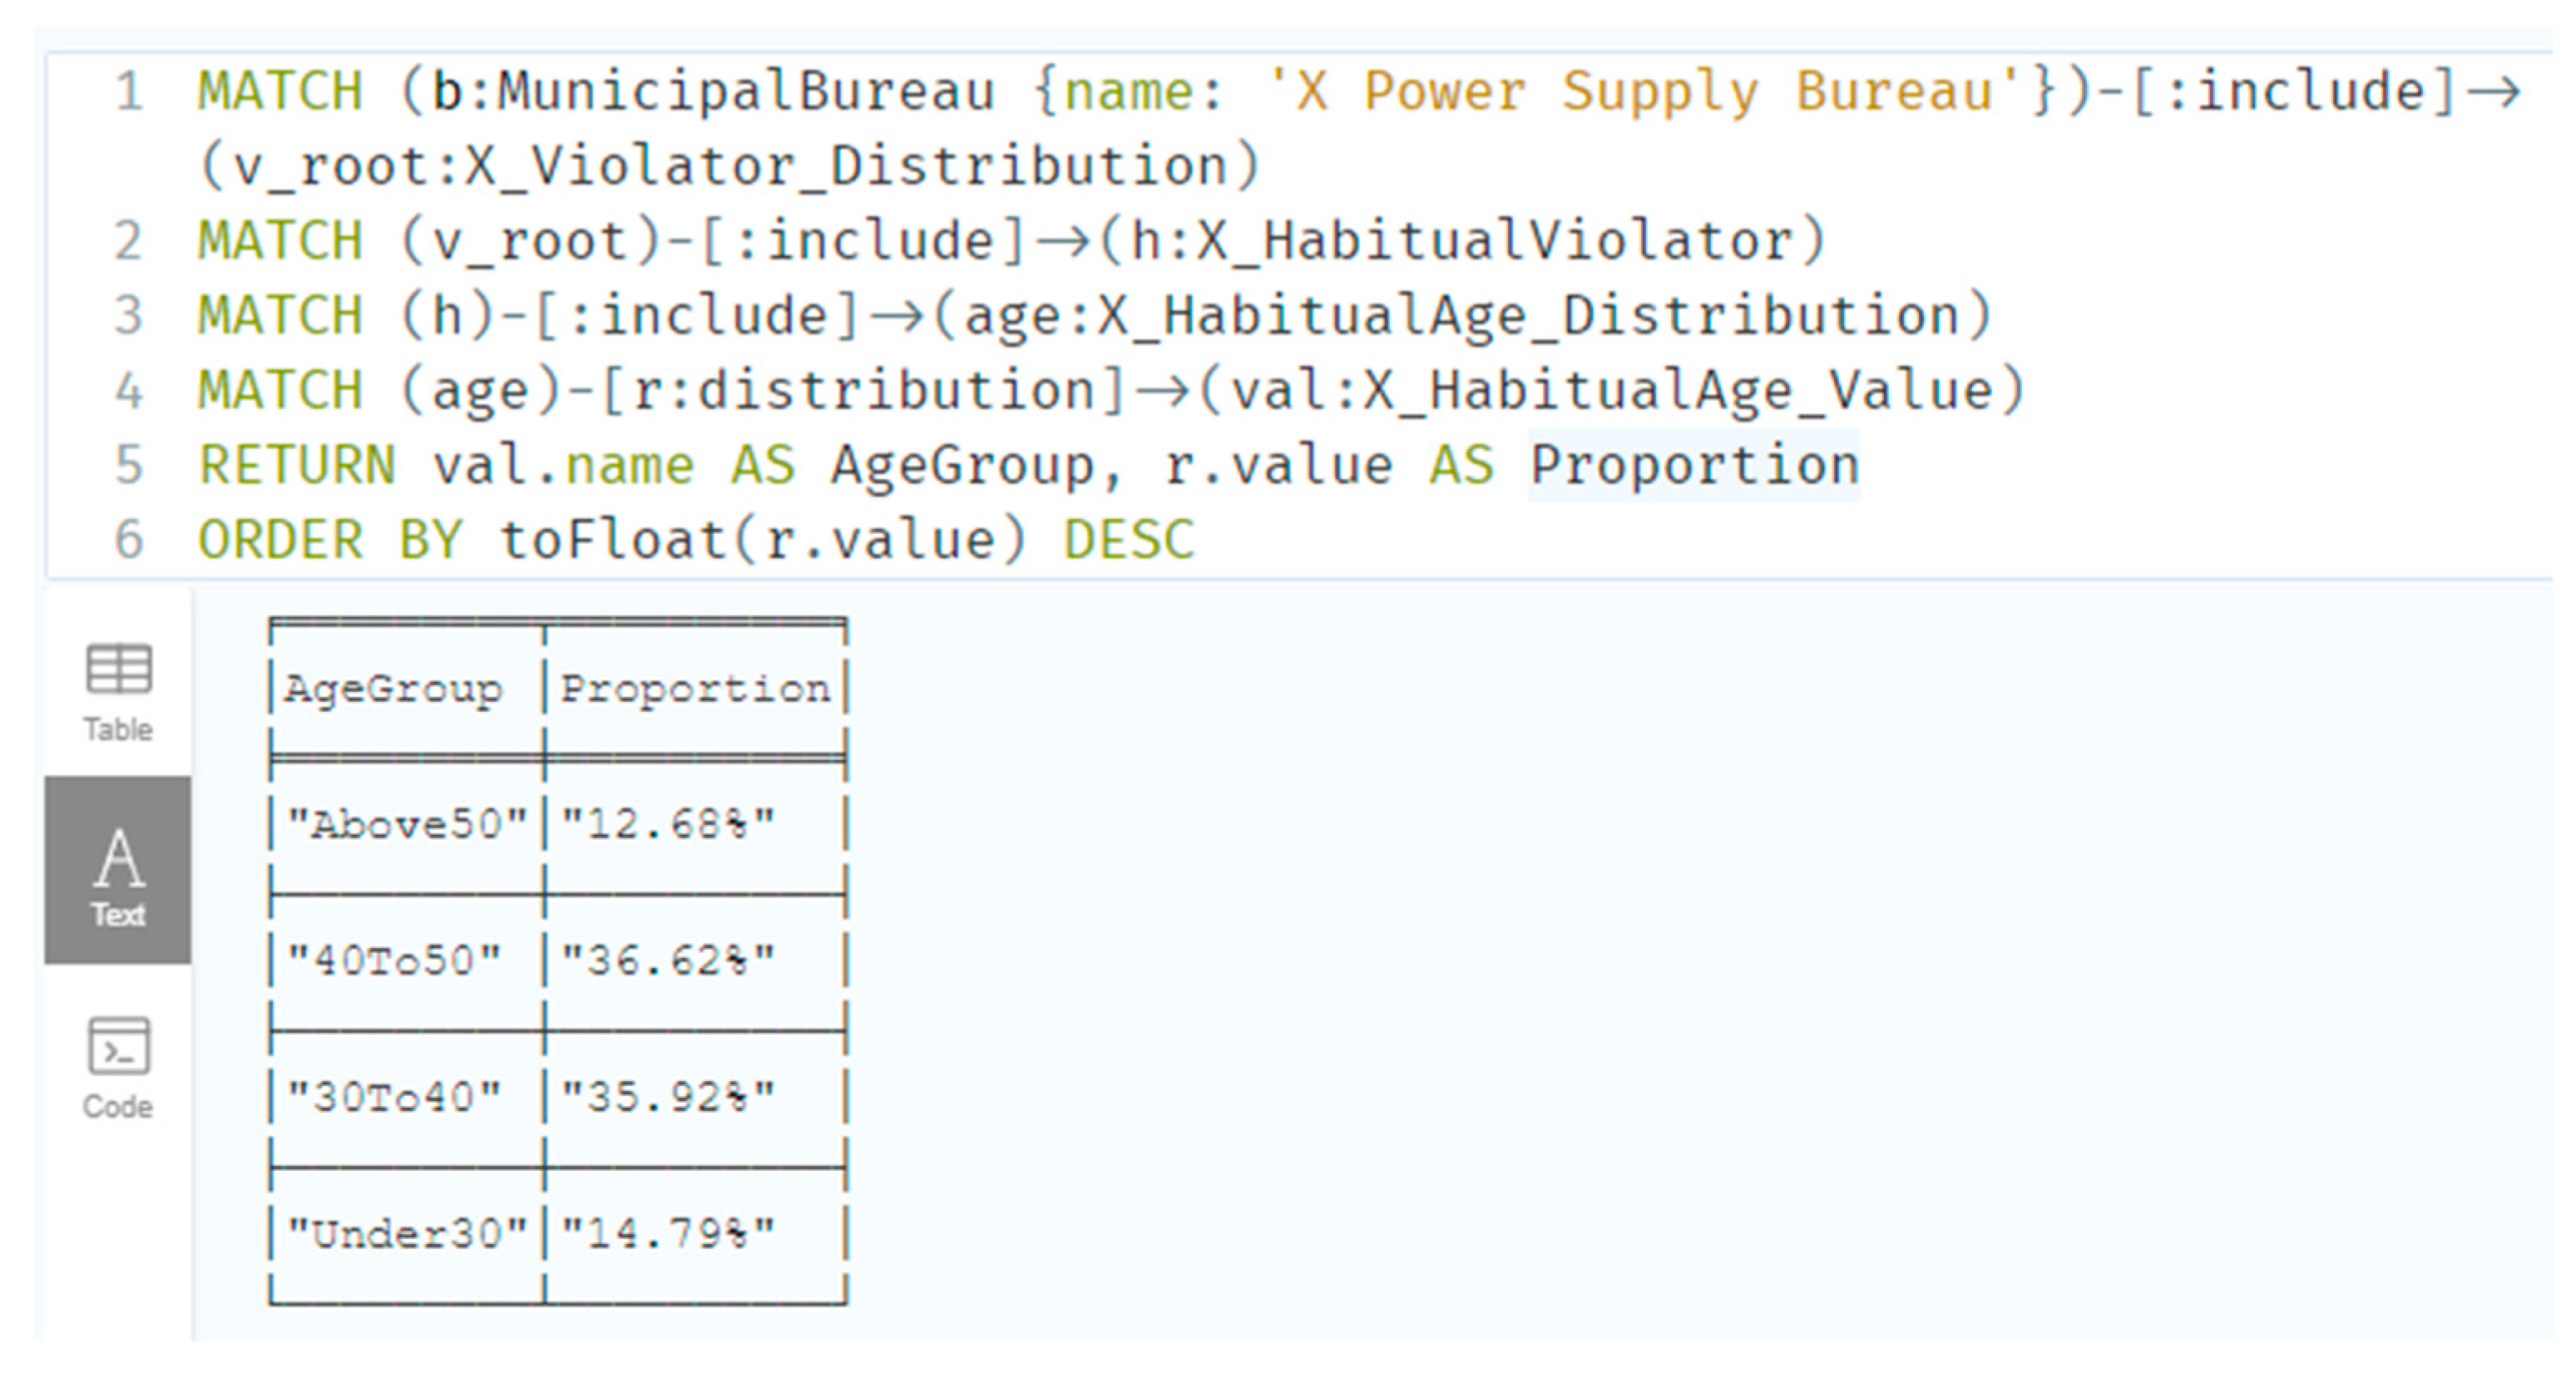
At the municipal bureau level, it is also possible to query the distribution of operational factors during a given period, including Operation Entity, Task Source, Operation Category, Specialty Type, Voltage Level, Risk Level, and Working Mode. In addition, for a specific municipal bureau, the age and qualification distributions of violators under habitual and occasional violations can be retrieved. For instance, the following Cypher query retrieves the age distribution of violators under habitual violations within the X Power Supply Bureau: (
MATCH (b: MunicipalBureau {name: ‘X Power Supply Bureau’})-[:include]-> (v_root:X_Violator_Distribution)
MATCH (v_root)-[:include]->(h:X_HabitualViolator)
MATCH (h)-[:include]->(age:X_HabitualAge_Distribution)
MATCH (age)-[r:distribution]->(val:X_HabitualAge_Value)
RETURN val.name AS AgeGroup, r.value AS Proportion
ORDER BY toFloat(r.value) DESC
)
Figure 17 displays the query result corresponding to the presented example.
4. Conclusions
The focus of this work is analyzing the data traits associated with field operation violations in the power grid domain and designing a knowledge ontology by integrating the experience and requirements of power grid professionals. This ontology is used to guide the extraction and knowledge mapping of historical data related to grid field operation violations. A multi-source embedded Chinese NER model is proposed to address the limitations of classical NER models in handling grid-related textual data. By deeply integrating multiple feature representations, the model innovatively incorporates a domain-specific dictionary constructed from grid field operation text data, which markedly enhances the accuracy of identifying power-related entities in the text of power grid field violations. The Neo4j graph database is utilized to store the knowledge related to grid field operation violations, and a visual knowledge graph is constructed to support grid operation planners and provide safeguards for violation prevention in the power sector. The data types and modalities in the field of power grid operations are rich and diverse. In the future, the integration of large language models will be considered to explore new approaches for handling multimodal data, thereby further enhancing the intelligent and visual representation of domain knowledge.
The proposed method is designed to construct a knowledge graph of on-site power grid operations based on historical violation records. Since such records require a period of accumulation, the current approach focuses on converting existing textual and structured tabular data into visualized graph data, enabling retrospective analysis and key information querying. Therefore, the knowledge graph reflects historical violations over a defined time span and is not intended for real-time processing. It is more suitable for periodic updates, which can be performed at regular intervals to incorporate new violations and reflect evolving patterns.
In terms of scalability, the current system relies on predefined dictionaries and graph query interfaces. Future work will explore the integration of large language models (LLMs) to improve scalability and user interaction. In particular, natural language interfaces will be introduced to enable key information retrieval using plain language queries, removing the need for users to write Cypher or other graph query languages when interacting with the knowledge graph.


