Article

Modelling Key Health Indicators from Sensor Data Using Knowledge Graphs and Fuzzy Logic

by
Aurora Polo-Rodríguez
1,
Isabel Valenzuela López
2,3,
Raquel Diaz
3,
Almudena Rivadeneyra
4,5,
David Gil
6 and
Javier Medina-Quero
1,5,*
1
Department of Computer Engineering, Automatics and Robotics, University of Granada, 18014 Granada, Spain
2
Instituto de Investigación Biosanitaria ibs.Granada, 18012 Granada, Spain
3
Metropolitan Primary Care Health District of Granada, 18013 Granada, Spain
4
Department of Electronics and Computer Technology, University of Granada, 18071 Granada, Spain
5
Research Centre for Information and Communication Technologies (CITIC-UGR), University of Granada, 18014 Granada, Spain
6
Department of Computer Technology and Computation, University of Alicante, 03690 Alicante, Spain
*
Author to whom correspondence should be addressed.
Electronics 2025, 14(12), 2459; https://doi.org/10.3390/electronics14122459
Submission received: 24 April 2025 / Revised: 4 June 2025 / Accepted: 15 June 2025 / Published: 17 June 2025

Abstract

:
This paper describes the modelling of Key Health Indicators (KHI) of frail individuals through non-invasive sensors located in their environment and wearable devices. Primary care professionals defined four indicators for daily health monitoring: sleep patterns, excretion control, physical mobility, and caregiver social interaction. A minimally invasive and low-cost sensing architecture was implemented, combining indoor localisation and physical activity tracking through environmental sensors and wrist-worn wearables. The health outcomes are modelled using a knowledge-based framework that integrates knowledge graphs to represent control variables and their relationships with data streams, and fuzzy logic to linguistically define temporal patterns based on expert criteria. The proposed approach was validated in a real-world case study with an older adult living independently in Granada, Spain. Over several days of deployment, the system successfully generated interpretable daily summaries reflecting relevant behavioural patterns, including rest periods, bathroom usage, activity levels, and caregiver proximity. In addition, supervised machine learning models were trained on the indicators derived from the fuzzy logic system, achieving average accuracy and F1 scores of 93% and 92%, respectively. These results confirm the potential of combining expert-informed semantics with data-driven inference to support continuous, explainable health monitoring in ambient assisted living environments.

Graphical Abstract

1. Introduction

The burgeoning field of ambient assisted living (AAL), driven by the proliferation of non-invasive sensors and wearable devices [1,2], offers unprecedented opportunities to improve the quality of life of vulnerable populations, particularly frail individuals [3]. These technologies enable the continuous monitoring of health parameters, facilitating early detection of potential issues, and promoting proactive care [4]. However, the sheer volume of data generated by these sensor systems requires sophisticated processing techniques to extract meaningful insights. Translating raw sensor data into clinically relevant information remains a significant challenge, as highlighted by recent surveys [5,6,7]. This challenge is further compounded by the need for robust models and knowledge representation structures to enable effective information processing and generate richer, higher-level information from sensors [8].
The effective representation of human activities through semantic models, as extensively explored in previous work [9,10], is a cornerstone of achieving nuanced contextual understanding within AAL environments. This semantic layer allows systems not only to recognise discrete actions, but also to infer higher-level goals, intentions, and complex behavioural patterns over time. This is crucial to provide genuine personalised and proactive support rather than merely reactive alerts.
This paper proposes a novel knowledge-based approach to modelling Key Health Indicators (KHI) [11] for frail individuals by generating linguistic descriptions of relevant information obtained from non-invasive environmental sensors and wearable devices [12]. Specifically, we focus on modelling KHI defined by primary care professionals: correct sleep patterns, excretion control, physical mobility, and caregiver social interaction. Using fuzzy logic (FL) [13] and knowledge graphs (KG) [14], we aim to bridge the gap between raw sensor data and clinically actionable knowledge. In line with the emphasis of the National Institutes of Health on personalised care [15], we develop a system capable of generating interpretable summaries of these KHI. This presents an architecture that automatically syncs with sensor data and provides a user-friendly visualisation to retrieve daily summaries of KHI. Using a case study in real environments, we show how indicators can be used to identify patterns and evaluate user behaviour, potentially leading to the early detection of health deterioration.
The remainder of this paper is organised as follows. Section 1 discusses the existing literature pertinent to our research problem in detail. Section 2 details the knowledge graph (KG) and the FL model used to generate linguistic summaries of the key indicators of health. Section 3 describes the sensor system and data acquisition process with a real-world case study that illustrates the system’s performance. Finally, Section 4 concludes the paper with a summary of the findings and future directions.

Literature Review

Translating semantic insights from AAL environments into practical systems faces significant hurdles, particularly in the development of robust and adaptable user models [16]. A major challenge lies in creating a truly generic user model, one that is adaptable to various individuals with varying routines, preferences, and health statuses, yet sophisticated enough to effectively integrate continuous behavioural modelling and real-time monitoring [17].
On one hand, knowledge-driven methods have been widely proposed to describe daily human activity using sensor data [18,19]. The inherent difficulty of these approaches lies in translating expert knowledge into a computational method that is flexible, interpretable, and rigorous. Among the diverse array of approaches, FL [20] has been recognised as a highly interpretable knowledge model for reasoning and aggregating data under uncertainty [21]. Moreover, the use of protoforms and FL [22,23] has yielded encouraging results in integrating expert knowledge to process sensor data streams in multiple domains. Examples include weather forecasting [24], explainable acoustic data streams [25] or providing linguistic summaries from heart rate streams [6].
On the other hand, data-driven methods have proliferated, relating features of sensor streams to human activity through machine learning approaches [26]. The vast majority of these works have focused on supervised learning, which requires a large data set labelled to classify targeted human behaviours [27]. This requirement poses a significant challenge for the individualised learning of key interest indicators, as it is not agile to collect and label huge datasets for each person and indicator. Furthermore, the need for precise, clinically validated definitions of health indicators introduces another layer of complexity [28]. Simply monitoring activity levels is insufficient for the supervision of health professionals, which requires the need to provide explanations [29]. Translating raw sensor data or recognised activities into meaningful metrics related to well-being, functional capacity, risk assessment, or the progression of specific conditions requires robust definitions grounded in professional clinical expertise [30]. Without such rigorous definitions, the indicators derived may lack clinical relevance or, worse, lead to misinterpretations of a user’s health status.
Beyond cost implications, many state-of-the-art data-driven approaches often culminate in ’black-box’ models [31,32]. Their internal workings can be opaque, making it difficult to understand why a particular prediction or classification (e.g., identifying a specific behaviour or health alert) was made [31]. This inherent lack of transparency and interpretability poses a critical barrier to adoption in healthcare, where trust, accountability, and the ability of healthcare personnel to validate, override, or understand the reasoning of the system are paramount for effective control and intervention [33].
Related specifically to the integration challenges mentioned above regarding the semantic representation of activities [10], the difficulty in creating robust generic user models is further compounded by the practical challenge of ensuring that behavioural modelling and monitoring algorithms consistently and accurately utilise the dynamic input generated by the user model itself, thus closing the loop between semantic understanding and actionable monitoring [34]. In [35], the authors propose an agile linguistic description of the linguistic protoforms computed on the wearable data stream collected by a Fitbit wearable tracker. In this work, we offer an extended version of these linguistic protoforms that integrates temporal and spatial context from both ambient and wearable devices, with these relationships defined through knowledge graphs to establish hierarchical key indicators.
To address knowledge representation requirements, we use KGs, which represent the relationships between linguistic protoforms [6,23] and data streams through linguistically defined indicators [36]. Using the collection and fuzzy processing of sensor data from minimally invasive sensors and wearables, we derive metrics related to home location and physical activity [35]. These metrics are then used to construct knowledge graphs, which represent the relationships between control variables and data streams through linguistically defined indicators. In addition, this interpretable labelling is effectively used to develop lightweight machine learning models, making them ideal for deployment on edge computing nodes [37]. Moreover, we have also explored data-driven approaches to infer KHI, using supervised learning models trained on sensor streams labelled with expert-defined protoforms, as detailed in Section 3.6.

2. Materials and Methods

This section details the methodology employed to model KHI in frail individuals using non-invasive sensors and knowledge graphs. Our objective is to translate raw sensor data into clinically meaningful insights using a knowledge-based approach that integrates KG representation, sensor architecture, and FL modelling. The following subsections elaborate on each of these components.
  • KG Model of KHI: We construct hierarchical knowledge graphs to represent critical health indicators, including sleep patterns, excretion control, physical mobility, and social interaction. In this work, we use the term ’excretion control’ as a general category; however, in clinical practice, it is more common to refer specifically to urinary and faecal control. It is important to note that in patients with incontinence who use absorbent products, data collection through environmental sensors may present limitations that should be considered. These graphs represent indicators as nodes, with edges that define relationships with control variables derived from sensor data. This structured approach allows us to integrate clinical knowledge with quantitative data, providing a comprehensive view of health status.
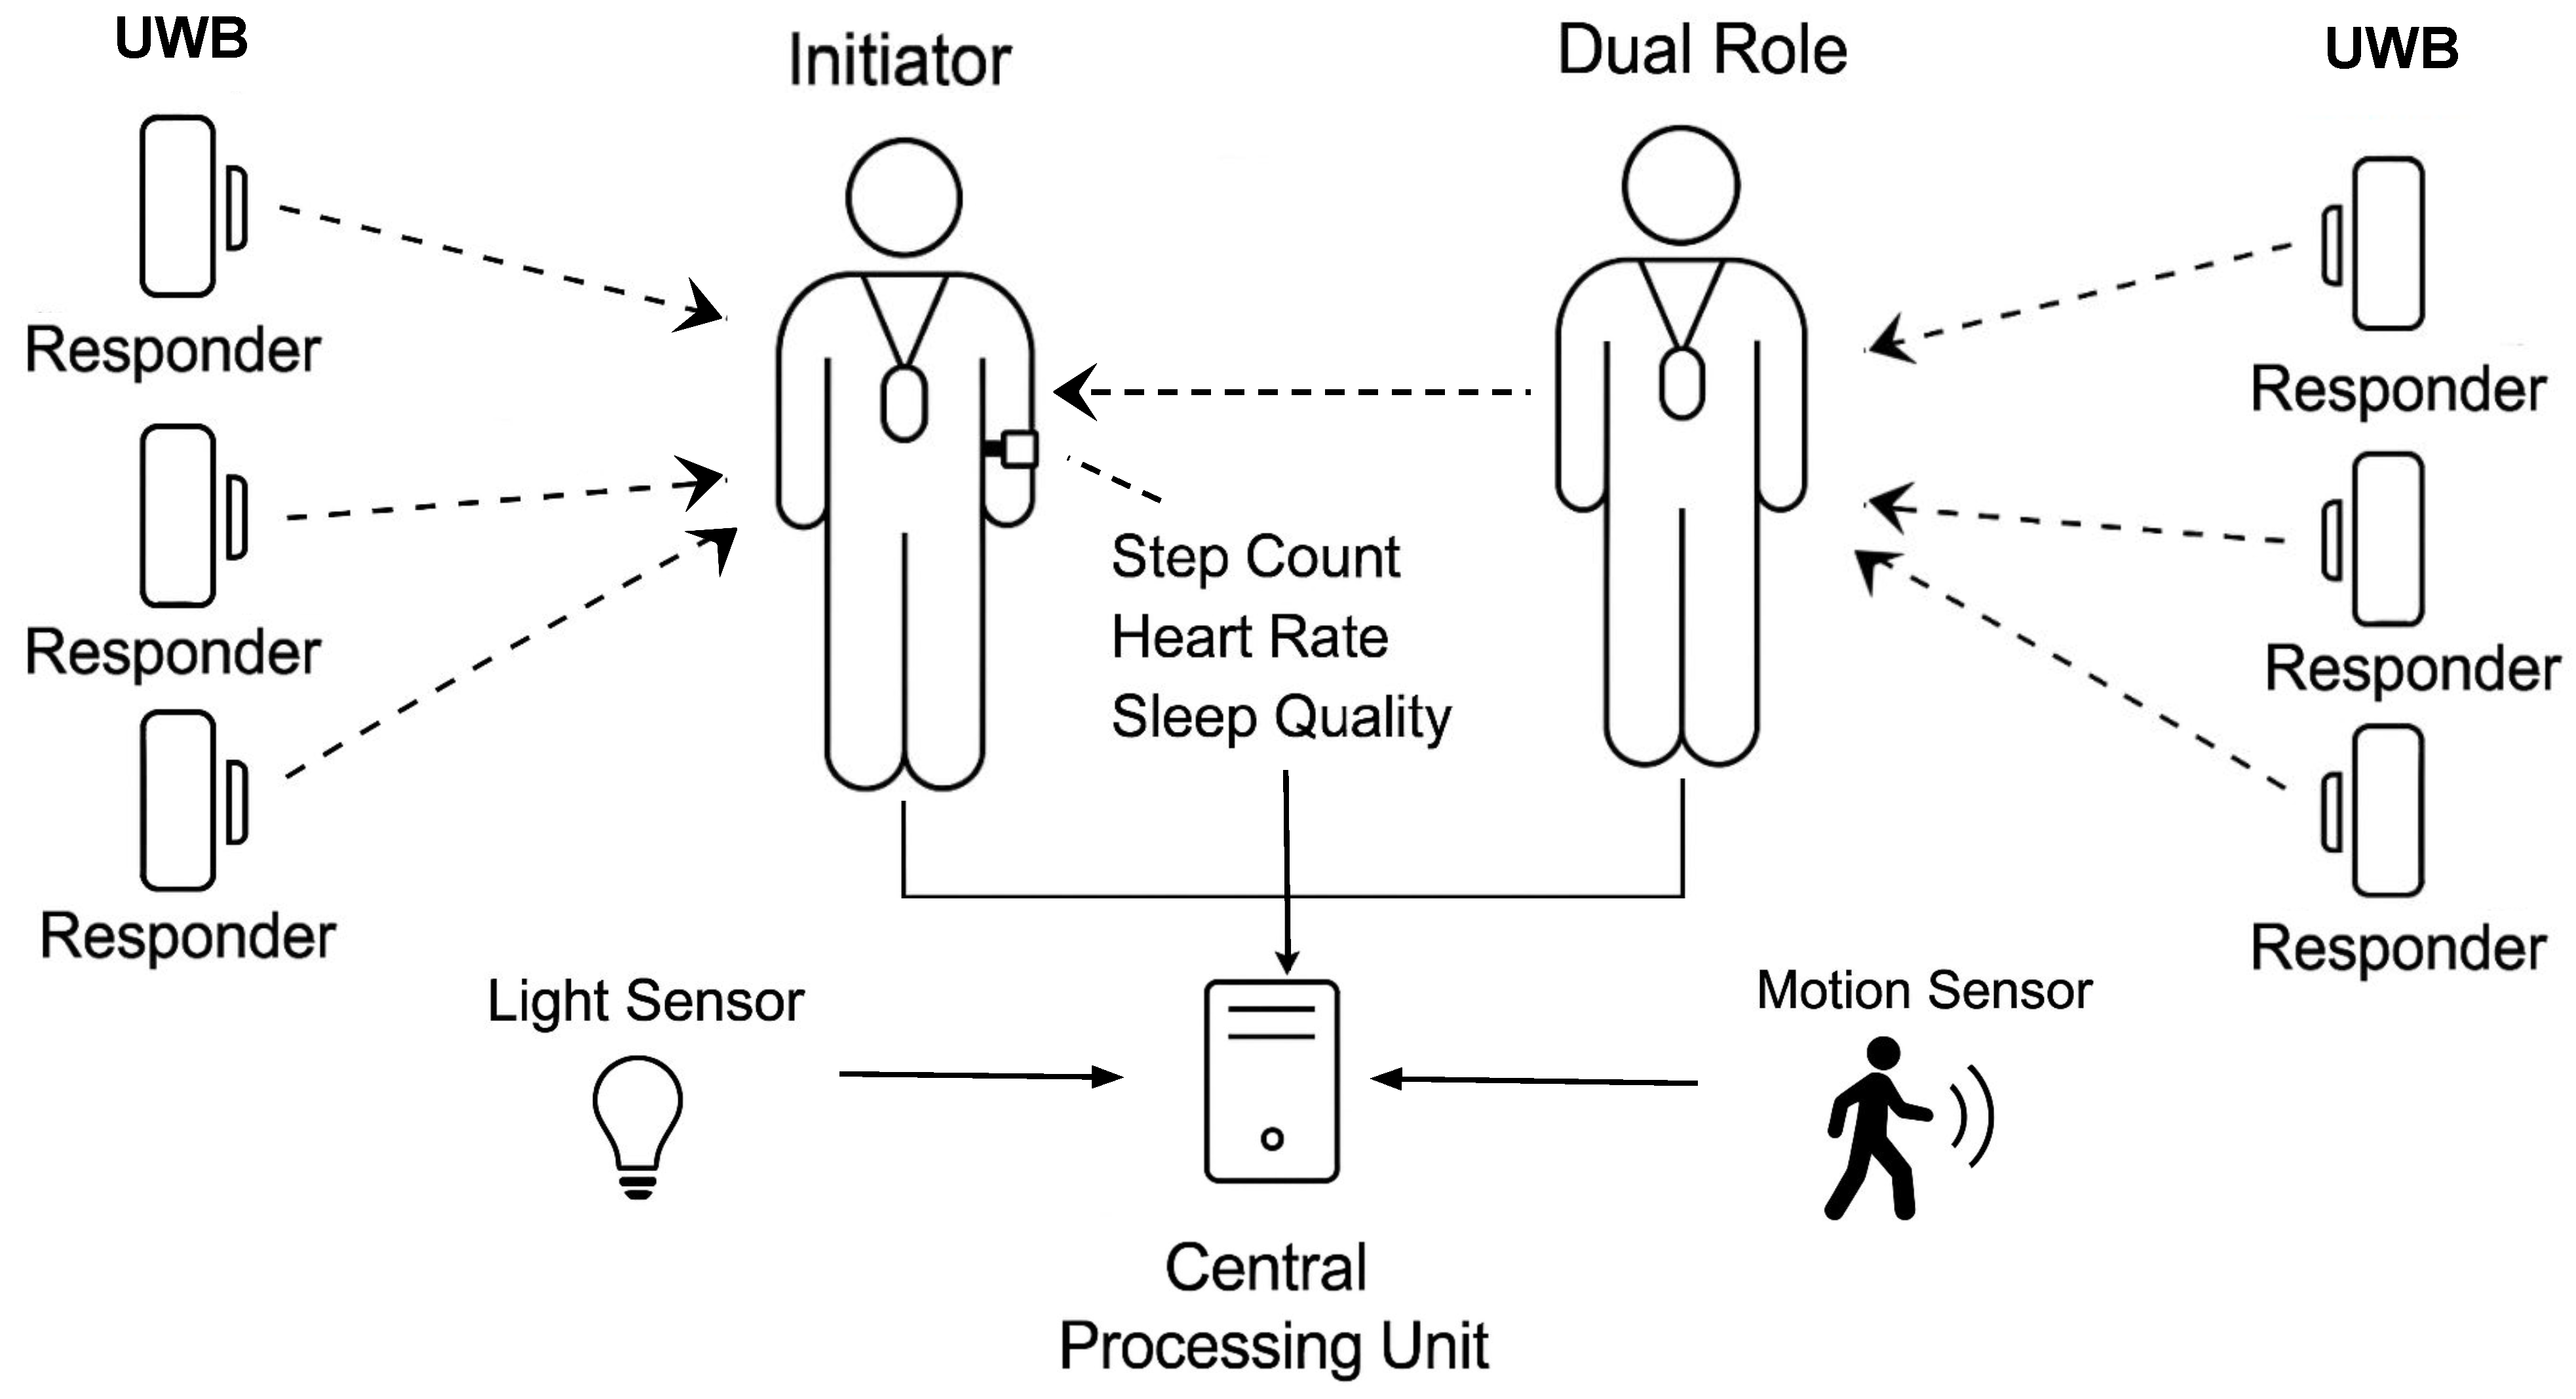
  • Sensor Architecture for Data Acquisition: A minimally invasive sensing architecture is implemented, combining wearable devices and ambient sensors. Wearable devices track physical activity and sleep, while ambient sensors provide indoor localisation and activity data. This integration provides a general view of daily activity patterns while prioritising user comfort and long-term adherence.
  • FL modelling of Linguistic Protoforms: FL bridges the gap between sensor data and clinical language. The temporal and linguistic terms used by healthcare professionals are modelled using membership functions, which allow the system to reason with imprecise and subjective information. This approach ensures that the system’s output is clinically relevant and interpretable.
Figure 1, illustrates the system architecture used for real-time inference of KHI. The diagram shows how data streams collected from wearable devices (e.g., smartwatches) and ambient sensors (e.g., motion detectors, flush sensors, UWB tags) are integrated and processed locally by a fog computing node. This node preprocesses and aggregates sensor data before feeding them into the KG module, which performs FL-based semantic reasoning. The KG inference engine computes the KHI values by combining spatial, temporal, and quantitative characteristics extracted from the sensor input, enabling interpretable and actionable health monitoring.

2.1. Knowledge Graph Representation of Key Health Indicators

This subsection details the application of knowledge graphs as a linguistic model representation for KHI. We take advantage of the inherent flexibility of KGs to capture and reason with the inherent vagueness and uncertainty associated with health data.
In this context, a KG is formally defined as a directed, labelled graph G = ( V , E , L ) , where:
  • V is a set of nodes (vertices) that represent entities or concepts related to health indicators. These entities are not merely static data points but are imbued with linguistic meaning, facilitating human-like reasoning.
  • E is a set of edges that represent the relationships between these entities. Each edge e E is an ordered pair ( v i , v j ) where v i , v j V .
  • L is a set of labels associated with both the nodes and edges, providing semantic context.
The KG represents the semantic structure of health information, enabling the integration of diverse data sources and the representation of complex relationships. Under this approach, nodes/entities within the KG are inherently linked to linguistic protoforms. These protoforms, as abstract linguistic templates that compose semantic structures, enable the representation of health indicators in a way that aligns with natural language understanding. Specifically:
  • Each node/entity is associated with a protoform that captures its underlying semantic structure.
  • These protoforms are instantiated with specific values derived from:
    Terms: Linguistic variables representing ranges or categories of health indicators (e.g. “active mobility”, “adequate sleep time”).
    Temporal Restrictions: Time-based constraints or patterns associated with health indicators (e.g., low physical activity “while daytime”).
    Location Restrictions: Location-based constraints or patterns associated with user activity (e.g., sleep activity levels “in the living room”).
    Quantifiers: Linguistic terms represent relative or absolute quantities, allowing the manipulation of linguistic concepts. They can be modelled under crisp or fuzzy approaches (e.g., “adequate number of excretions”, “most of sleeping time”).
    Data Streams: Composed by the data from ambient and wearable devices collected and the inferred protoforms over time.
  • This connection to protoforms allows the KG to reason with the semantic meaning of health data, not just its numerical values.
Additionally, the relationships (edges) connecting nodes in the KG can be aggregated using both protoforms and fuzzy rules:
  • In fuzzy rules, the relationships between nodes are assigned degrees of membership, reflecting the strength or certainty to the antecedents by means of fuzzy norms (T-norms and Co-norms) to represent conjunctive and disjunctive relationships, respectively.
  • In protoforms, fuzzy quantification and temporal aggregation is composed to address the inherent vagueness of temporal restrictions [23,36]. We employ FL within temporal computing approaches for sensor aggregation, as demonstrated in [38].
  • By applying these operators, the KG can perform fuzzy inference, combining evidence from multiple relationships to derive conclusions about health indicators. This allows for a more robust and flexible representation of complex health patterns.
In Figure 2, we provide an ontological description of this subsection to compose knowledge graphs, coupled with linguistic protoforms and fuzzy rules, which provides a powerful framework for representing and reasoning with KHI.

2.2. Sensor Architecture for Data Acquisition

To collect relevant health-related metrics in a non-intrusive and privacy-preserving manner, we designed a heterogeneous sensor architecture that integrates environmental and wearable sensors. The main goal is to sense indoor location and activity data with minimal disruption to users’ daily routines while preserving contextual integrity and ensuring data confidentiality. Indoor localisation is achieved primarily using Ultra-Wideband (UWB) sensors. These sensors are deployed throughout the living environment in strategically selected locations. The architecture follows a two-way ranging protocol, where fixed anchors act as responders, and user-worn tags function as initiators. In this configuration, the responder nodes periodically send polling requests, and the initiators reply, allowing accurate calculation of distances via time-of-flight. To measure the social proximity between the caregiver and the patient, the tag worn by the caregiver is configured in dual-role mode, allowing it to operate both as an initiator and a responder. In addition to the localisation system, the environment is equipped with motion sensors and light sensors. These sensors are installed in areas of low or no natural light, such as bathrooms or aisles, offering a redundant presence detection mechanism. The presence of motion and light changes in such spaces provides greater confidence in the inference of room occupancy, thus improving the robustness of activity monitoring. In addition, a smartwatch continuously records the heart rate, step count, and sleep quality parameters of the patient. This wearable device contributes fine-grained temporal data on physiological and mobility-related variables.
All sensors are connected to a fog processing node that collects data periodically and stores them locally, ensuring that the raw data remain within the domestic environment. This first local strategy respects privacy concerns and aligns with ethical standards for data protection in health-related contexts. Only aggregated or pre-processed data are later transmitted to higher-level components for semantic modelling using KG and FL. The complete architecture is illustrated in Figure 3, showing the integration of UWB tags, environmental sensors, and smartwatches, along with their data flow to the edge processing unit.
This modular and privacy-conscious system ensures minimally invasive monitoring of daily activities and health-related indicators in frail individuals living in assisted environments. The data acquired through this sensing infrastructure serve as the basis for generating fuzzy linguistic representations of health indicators, discussed in the next section.

2.3. Fuzzy Logic Modelling of Linguistic Protoforms for Sensor Data

In this section, we describe the methodology by which sensor data are transformed into linguistic protoforms for entity representation in the KG. This section subsequently elaborates on the formal definition of sensor streams and the applied fuzzy linguistic approach. A sensor stream s , originating from the sensor s, is represented as a sequence of measurements s = { s 0 , s 1 , , s i , } . Each measurement s i corresponds to a time stamp t i , within the observation interval [ t 0 , t N ] , where Δ denotes a time step.
Using a fuzzy linguistic approach, as detailed in [19], we transform the sensor data stream s into a linguistically interpretable representation by associating fuzzy terms v with sensor measurements. The membership function v ( s i ) ¯ quantifies the degree of membership s v i ¯ [ 0 , 1 ] for each measurement s i relative to the term v. Consequently, given the sensor stream s and a set of linguistic terms v, a fuzzy data stream s v ¯ = { s v 0 ¯ , s v 1 ¯ , , s v i ¯ , } is generated. We propose a definition of spatio-temporal protoform for modelling linguistic templates characterised by the following shape:
[ Q ] V [ T ] [ L ]
where Q, V, and T are linguistic terms that identify a fuzzy data streams and spatio-temporal restrictions:
  • V designates the fuzzy data stream derived from sensor or location sources.
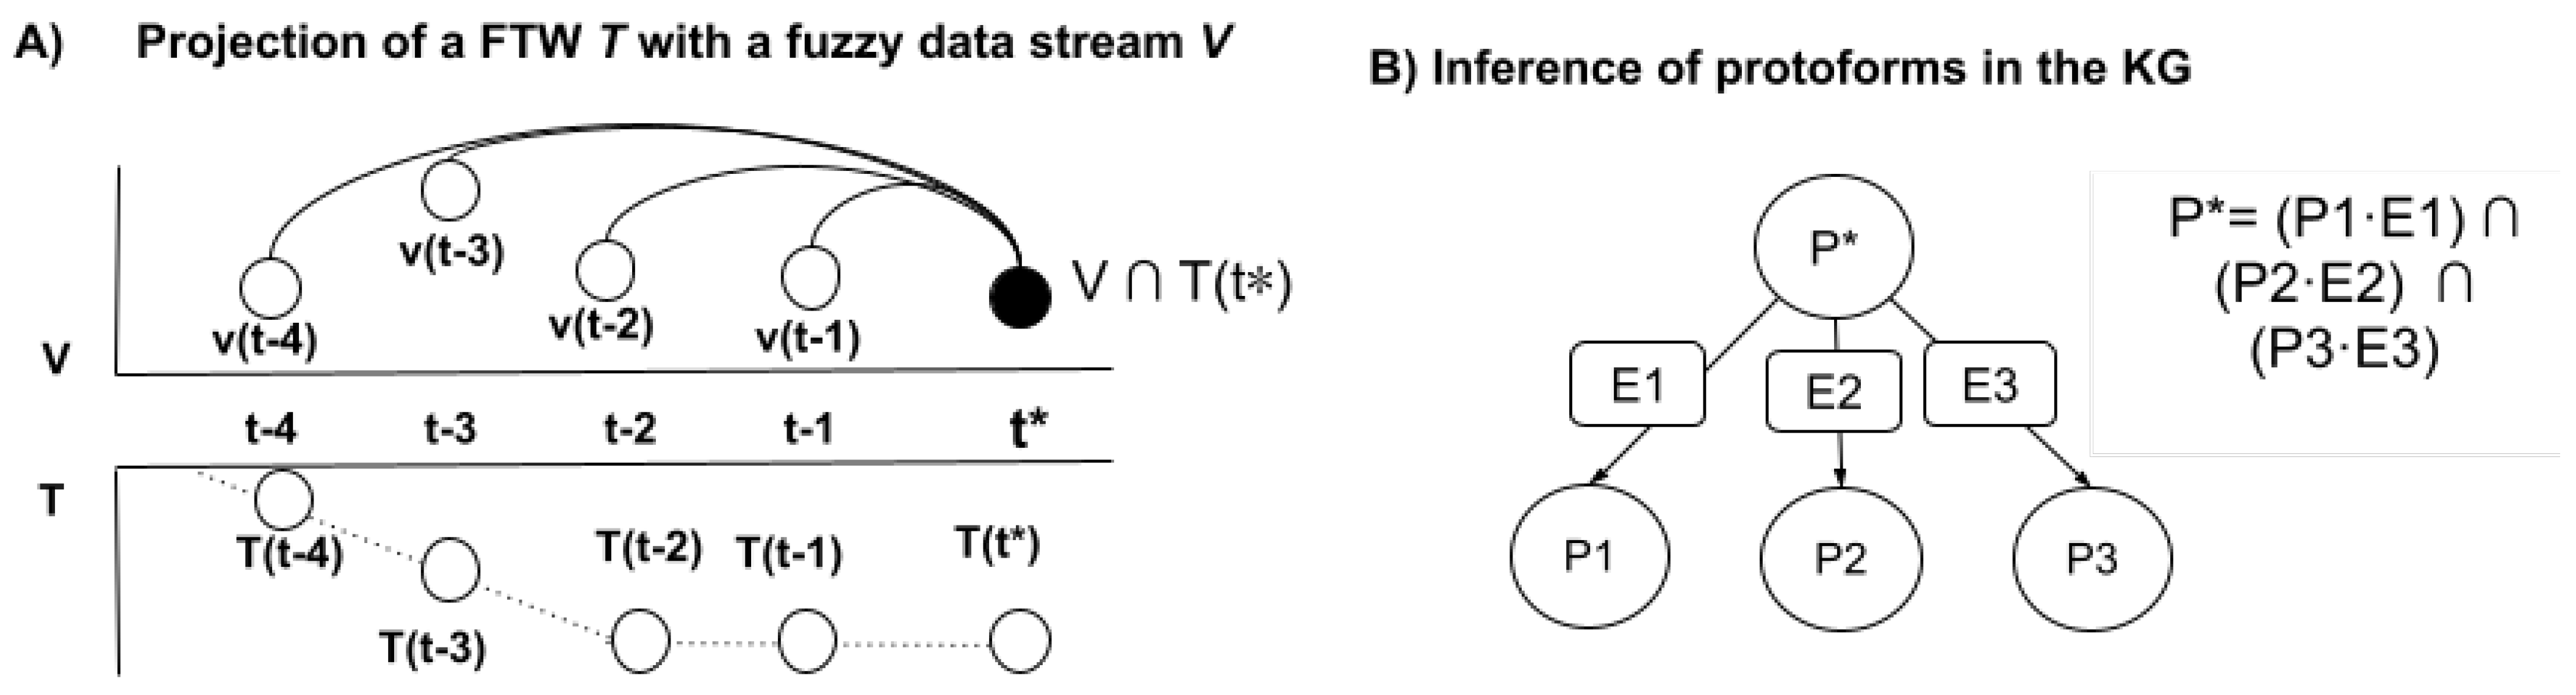
  • T, an optional element, specifies a fuzzy temporal window (FTW) T ¯ , within which the fuzzy data streams s v are aggregated, represented as s v T . The projection of a fuzzy temporal window T with a fuzzy data stream V = s v is achieved through a membership function associated with the FTW, which is derived from the temporal displacement Δ t i * = t * t i , where t * > t i , measuring the interval from a present time t * to the preceding timestamps t i within the data stream. For every timestamp t * , we compute the combined membership degrees of the terms, considering the fuzzy temporal influence, utilising t-norm and co-norm operations:
    V T ( t * ) = ( v i , t i ) V v i ¯ T ¯ ( Δ t i * ) [ 0 , 1 ]
    where V T define the aggregation of the temporal term T and the fuzzy stream V by means of t-norm ∩ for each timestamp and co-norm ∪ for aggregating them. In Figure 4, we describe the projection of an FTW with a fuzzy data stream. The choice of norms (max–min, weighted average = x ¯ w ) is determined by the specific semantic context [38].
    In max–min, the norms are defined as = m i n and = m a x , which are related to existential aggregators where a single value indicates the presence of a single value of V within the fuzzy temporal window T.
    In weighted average = x ¯ w , the norms are defined as = × and = 1 T ¯ ( Δ t i * ) , which are related to the weighted impact of the term V within the fuzzy temporal window T.
  • L, also optional, acts as a location filter to compute the spatial interaction in the environment [12 V T ( t * ) L , = m i n .
  • Q, also optional, acts as a quantifier to filter and modulate the degree of aggregation of Q ¯ ( s v T L ) .
Thus, a protoform P = [ Q ] V [ T ] [ L ] produces a new fuzzy data stream, where the degree of membership P i ¯ = Q ¯ ( V ¯ T ¯ L ¯ ) for each timestamp t i reflects the temporal relevance of the source data stream within the defined temporal window, adjusted by the fuzzy quantifier and the location of the user. Therefore, we observe that the evaluation of terms and indicators within KG entities occurs continuously over time. Next, we employ fuzzy inference rules to dynamically construct and refine the edges within a KG. These rules are crucial for aggregating and interpreting relationships between KG entities by combining fuzzy linguistic protoforms, thereby enabling the creation of novel semantically rich connections. In this framework, an inferred protoform P * is generated based on the relationships between connected protoforms P i * and the edges E i * that link them. This inference process is expressed using the rule structure to compute the degree of the protoform P * :
IF E i * ( P i * ) THEN P * P * = E i * , P i * P * E i * · P 1 *
In Figure 4, we detail how the antecedent E i * describes the relationships between the existing protoforms and their weighted edges P i * , while the consequent generates the inferred protoform P * . Crucially, the aggregation process within the antecedent leverages user-defined fuzzy t-conorms (max, min, dot, or other custom operators) that are tailored to the specific semantic context of each relationship, allowing for flexible and nuanced interpretations of the input data. So, inferred protoforms are derived from the aggregation of lower-level information, such as sensor stream data, and are used to represent higher-level abstractions, such as KHI.

3. Case Study

To validate the proposed sensing architecture and the knowledge-based approach for modelling health indicators, a real-world deployment was carried out at the home of a 95-year-old individual residing in the city of Granada, Spain. The participant was referred through the Health Center of La Caleta in Granada, part of the Andalusian Health Service. Informed consent was obtained from both the patient and the primary caregiver before data collection, following ethical and privacy protocols. The individual presents significant mobility limitations, which require the use of a walker, but retains the ability to move independently within the home. Formal care is provided throughout the day, including night-time hours, with a professional caregiver during the day and an informal caregiver at night. The resident does not prepare meals and spends most of the day in the living room, occasionally moving to the bedroom and bathroom. Other rooms, such as the kitchen or secondary spaces, are rarely visited. The living environment is approximately 90 square metres and has been adapted to facilitate indoor movement and daily routines. Figure 5 shows the home floor plan, indicating the position of the different types of sensors and providing views of the real environment.

3.1. Real-Home Deployment

The sensor deployment was conducted in the participant’s home, covering key areas of activity. A total of six UWB tags (©Estimote) were installed to allow accurate indoor localisation. These were distributed as follows: two in the living room, two in the bedroom, one in the hallway, and one in the bathroom. Two wearable UWB tags were used: one assigned to the patient (configured as initiator) and one to the caregiver (configured in dual role mode, supporting both initiator and responder functionalities) (see Figure 6A).
To complement the localisation data, additional sensors were installed:
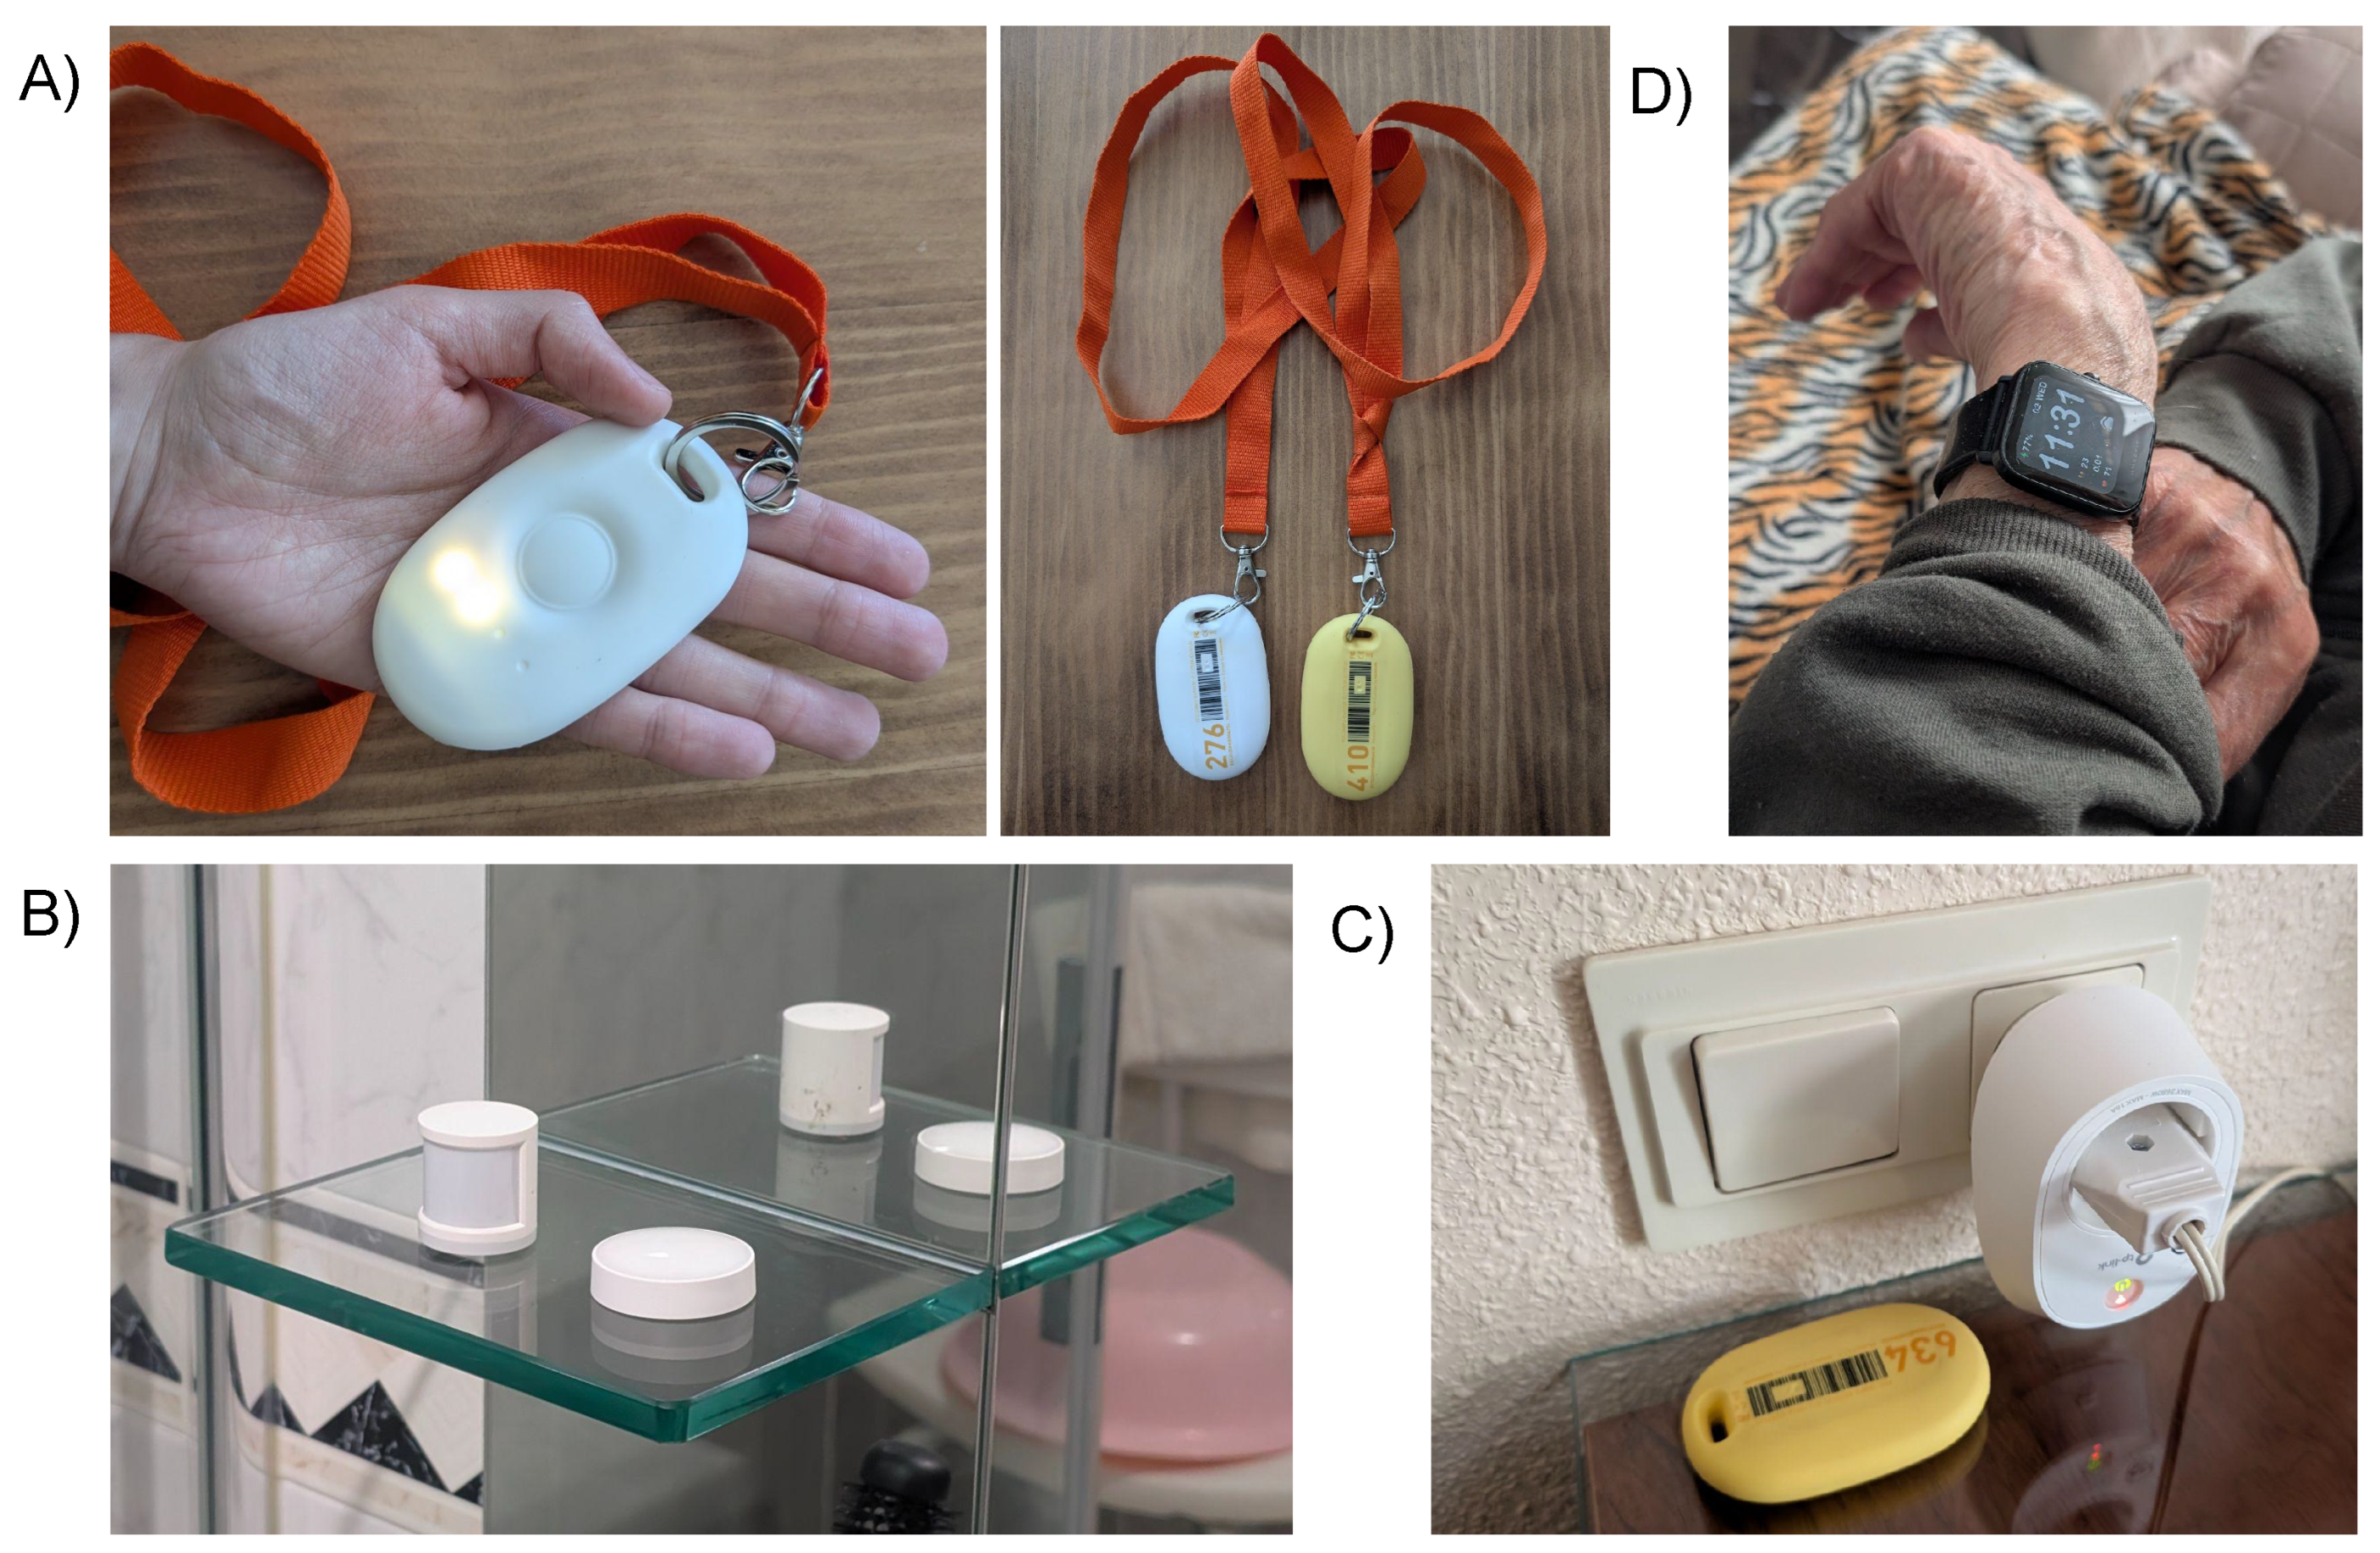
  • A motion sensor and a flush sensor (both Aqara) in the bathroom, providing cross-validation for presence and flush detection (see Figure 6B).
  • A smart plug to monitor energy consumption (TP-Link) in the bedroom lamp (see Figure 6C). Another smart plug in the living room to monitor the use of the TV.
  • The patient wore a smart watch (Amazfit Bip U Pro) (see Figure 6D) that collected physiological and activity-related data, including heart rate, step count, and sleep quality, including periods of deep, normal, and light sleep.
All sensors were connected to a local fog processing unit, implemented on a Raspberry Pi 4 Model B+, which collected and pre-processed heterogeneous data streams. This unit ensured temporal synchronisation, data harmonisation, and local storage, forming a secure and efficient bridge to the higher-level semantic modelling components.

3.2. Fuzzy Inference in KG for Sleep Pattern Evaluation

This section introduces the fuzzy inference model developed to assess the quality of sleep patterns in frail individuals based on sensor-derived signals. The model combines behavioural, spatial, and temporal indicators within a hierarchical fuzzy decision framework that encodes domain knowledge into interpretable health indicators. As illustrated in Figure 7, the conceptual structure is formalised as a fuzzy KG, allowing inference of uncertain and noisy sleep behaviours in real-world contexts.

3.2.1. Input Data Sources

The model processes a set of raw data streams obtained from two main sources: a wearable smartwatch and an in-home UWB positioning system. The smartwatch records the annotations of the sleep stage minute by minute, providing categorical labels that distinguish between light sleep, normal sleep, and deep sleep. These discrete stages are used to generate continuous fuzzy signals that reflect the quality and depth of sleep over time. It is important to note that the sleep stages (light, normal / REM and deep) are categorical values provided directly by the smartwatch. These values are not subject to individual fuzzification; instead, they are used to build fuzzy indicators by aggregating their occurrence over time intervals and applying fuzzy quantifiers. FL is thus applied at the level of temporal inference, not on the original sleep stage labels themselves. In parallel, spatial context is inferred through the UWB-based localisation system, which estimates user position by computing distances between a wearable tag and fixed anchors deployed in the home. A binary categorical stream is generated from these data, indicating whether the individual is located in the bedroom at each minute (1) or not (0). This spatial stream is aligned with the sleep annotations to capture whether the recorded sleep activity occurs in the appropriate environment.

3.2.2. Knowledge Graph

Primary care healthcare professionals defined the KG to formalise key indicators of health. In this section, we detail the dimension of the correct sleep pattern. This model is represented as a hierarchical fuzzy decision structure that captures the clinical semantics of healthy sleep patterns. It integrates the main aspects identified by the medical team: total duration of sleep, continuity and depth of sleep, location of sleep, and temporal alignment with night-time hours. The corresponding logic was encoded as a set of FL operators and rules that map these conditions to a composite health indicator according to Section 2.1. The structure of this model is illustrated in Figure 7, where each node corresponds to a fuzzy condition or aggregated protoform used in the inference process. The structure is composed of the following sub-branches of protoforms:
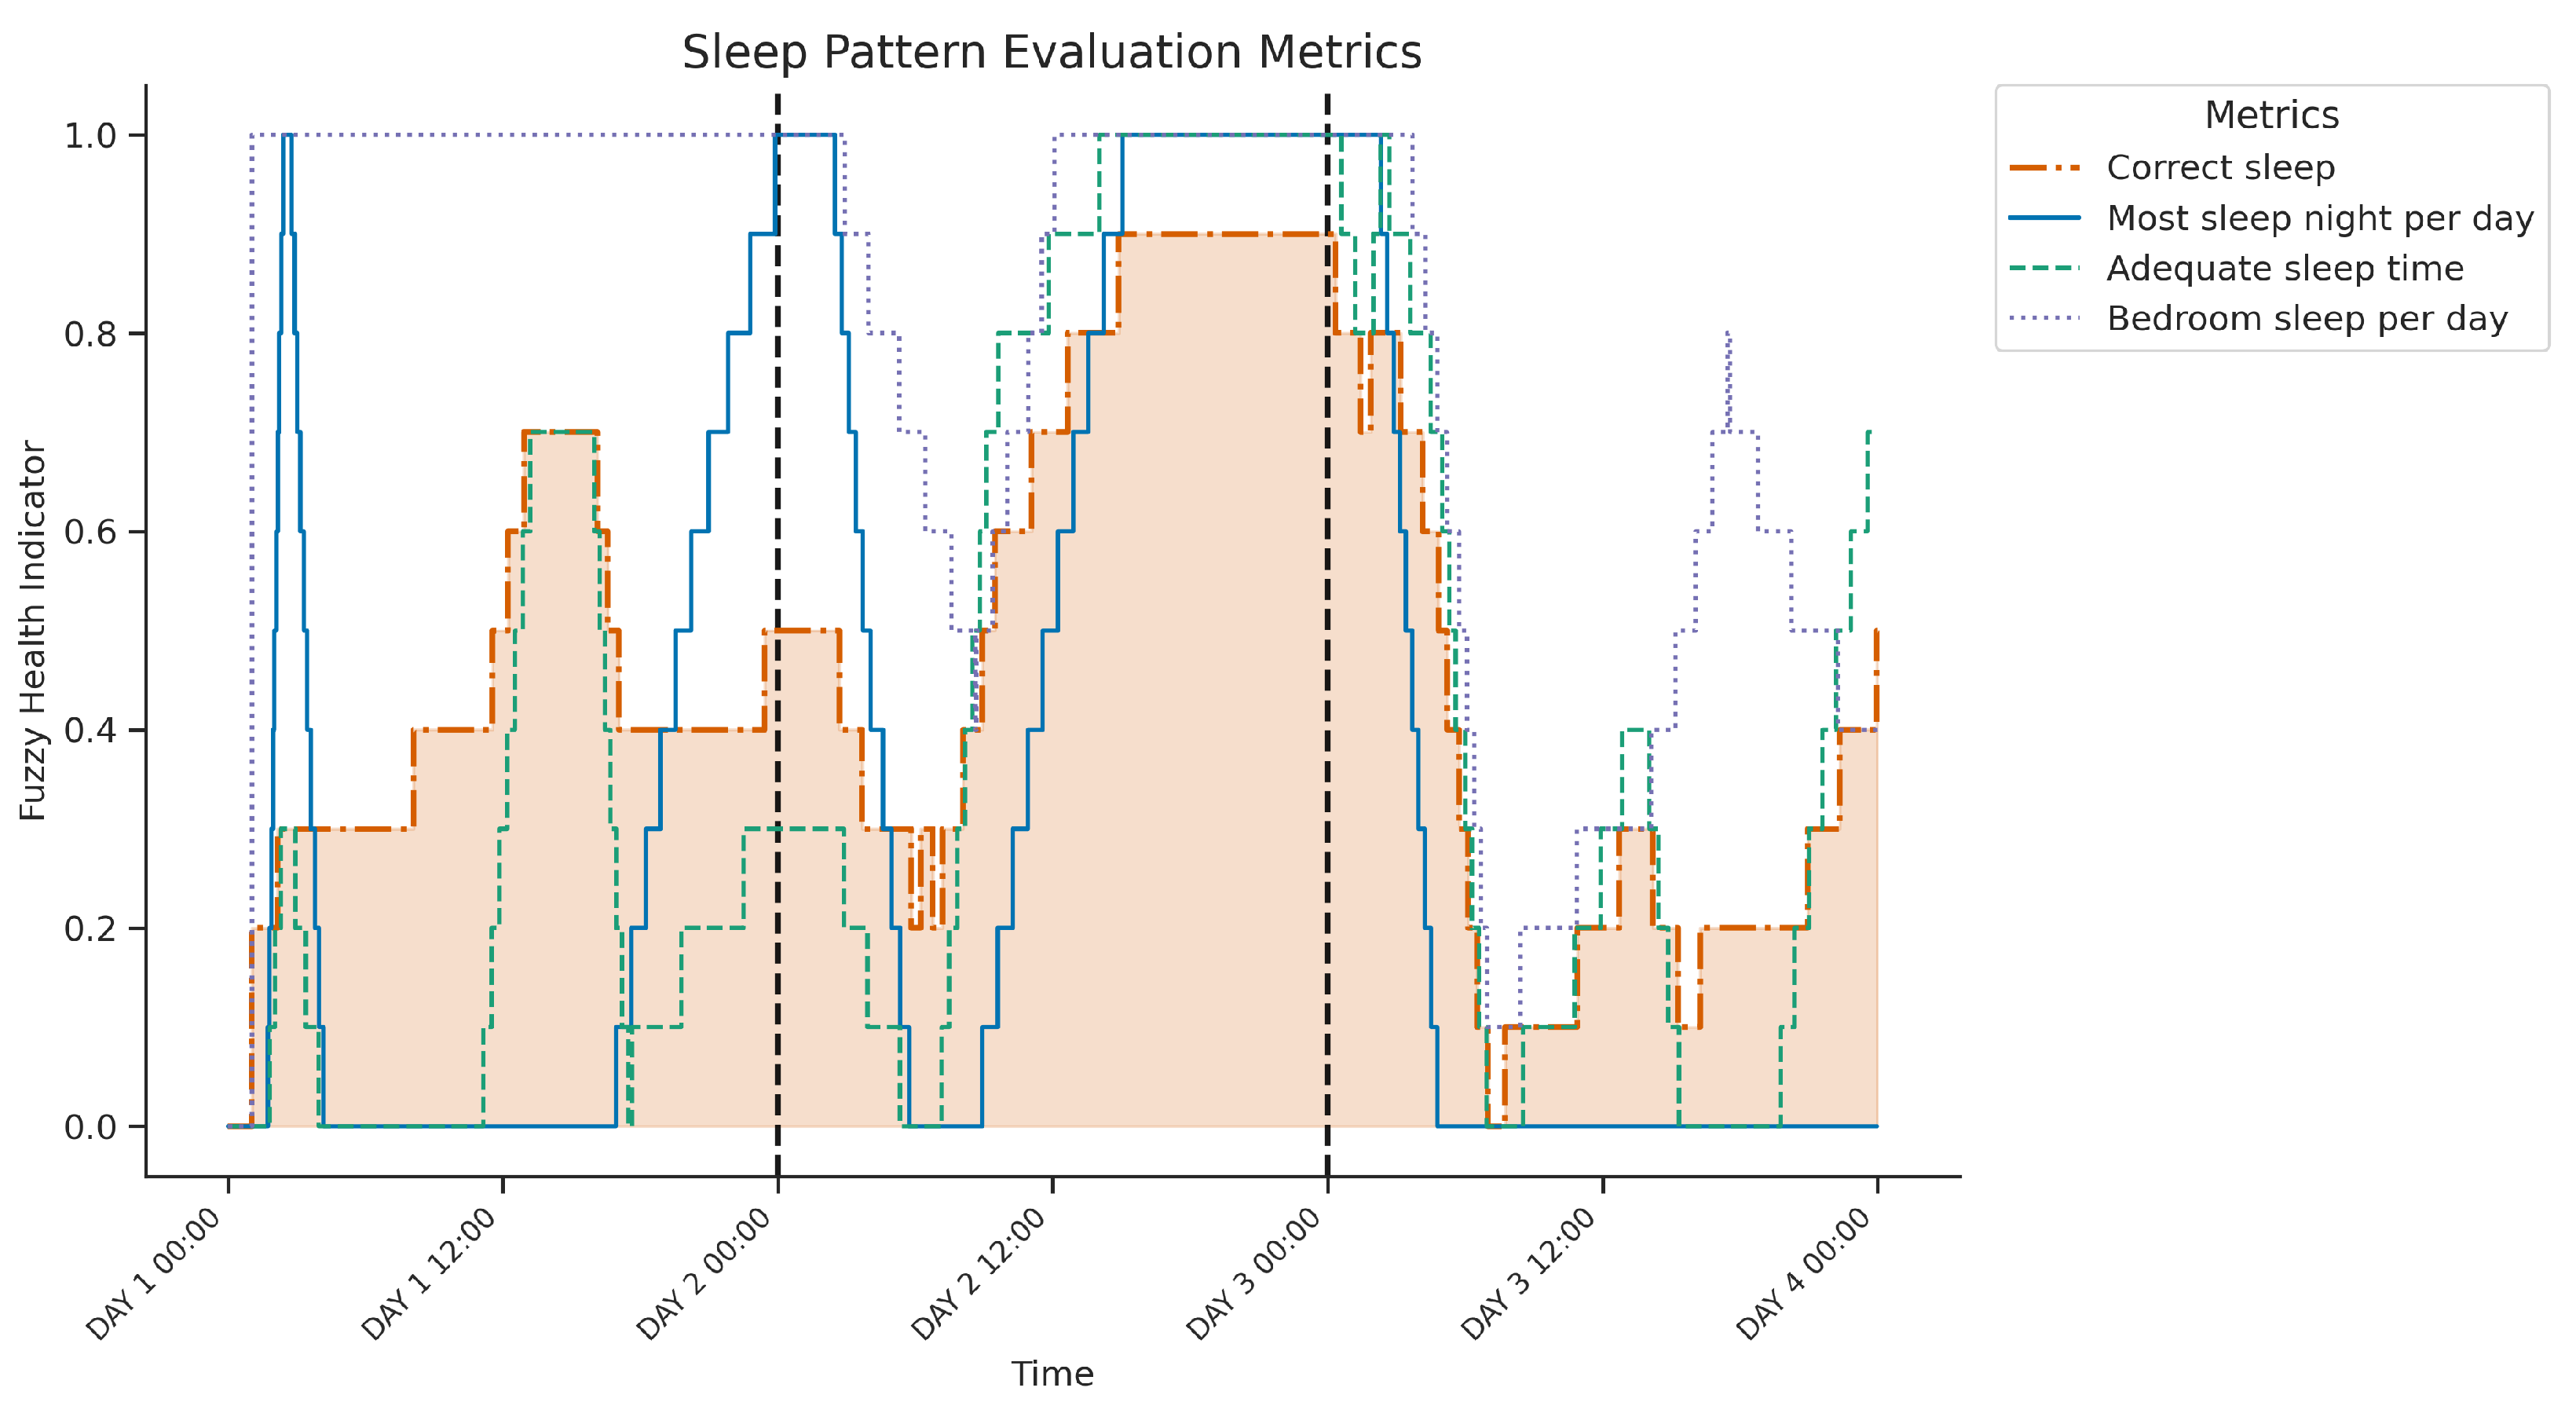
  • +) SA: Adequate sleep time
  • SA1: Most of the sleeping at night. Evaluates whether most of the sleeping time occurs during the night window and combines quantity (Q), temporality (T), and value streams (V).
  • SA2: Sleeping quantity. Assesses if the total sleep time falls between 6 and 8 h per day. Fuzzy weighted by value (V) and time window (T).
  • +) SB: Quality of sleep
  • SB1: Sleeping is normal or deep. Measures if the majority of sleep is spent in normal or deep stages and uses value (V), quantity (Q), and temporal alignment (T)
  • SB2: Sleep in the bedroom Assesses whether sleep occurs predominantly in the bedroom and relies on value (V), localisation (L), and quantity (Q).
The following equations define the fuzzy inference process based on the KG, combining the input data streams to evaluate the adequacy and quality of sleep, producing a composite health indicator for assessing sleep patterns in frail individuals. Please note that the membership degree of fuzzy terms is described by means of trapezoidal functions T ( x ) [ L 1 , L 2 , L 3 , L 4 ]  [12]:
T ( x ) [ L 1 , L 2 , L 3 , L 4 ] = 0 si x < L 1 x L 1 L 2 L 1 si L 1 x < L 2 1 si L 2 x L 3 L 4 x L 4 L 3 si L 3 < x L 4 0 si x > L 4
S A 1 : Q m o s t V s l e e p T n i g h t V s l e e p = d e e p r e m l i g h t , = max Q m o s t = T ( x ) [ 0 , 0.5 , 0.5 , 0.5 ] T n i g h t = T ( t ) [ 00 h , 02 h , 06 h , 08 h ] S A 1 = Q m o s t ( V s l e e p T n i g h t ) , = max min S A 2 : V s l e e p T 6 8 h T 6 8 h = T ( Δ ) [ 5 h , 6 h , 8 h , 9 h ] S A 1 = V s l e e p T 6 8 h , = x ¯ w S B 1 : Q m o s t V d e e p n o r m a l T d a y j V d e e p = d e e p r e m , = max T d a y = T ( Δ ) [ 24 h , 18 h , 12 h , 12 h ] V d e e p n o r m a l = V d e e p T d a y V s l e e p T d a y , = x ¯ w S B 1 = Q m o s t ( V d e e p n o r m a l ) S B 2 : Q m o s t V b e d s l e e p T d a y L b e d = b e d r o o m V b e d = V s l e e p L b e d , = min V b e d s l e e p = V b e d T d a y V s l e e p T d a y , = x ¯ w S B 2 = Q m o s t ( V b e d s l e e p ) S A : IF S A 1 ( W 3 ) AND S A 2 ( W 7 ) THEN V S A T d a y W 3 = 0.3 , W 7 = 0.7 V S A = S A 1 W 3 + S A 2 W 7 S A = V S A T d a y , = x ¯ w S B : IF S B 1 ( W 7 ) AND S B 2 ( W 3 ) THEN V S B W 3 = 0.3 , W 7 = 0.7 S B = V S B = S B 1 W 7 + S B 2 W 3 S A B : IF S A ( W 5 ) AND S B ( W 5 ) THEN V A B W 5 = 0.5 S A B = V A B = S A W 5 + S B W 5

3.2.3. Discussion and Explainability

Figure 8 displays the temporal evolution over three consecutive days of four KHI derived from the fuzzy inference system designed to evaluate sleep patterns. The plot illustrates three intermediate indicators—Most sleep night per day (SA1: evaluate the dominance of sleep at night), adequate sleep time (SA2: assessing 6-8h duration), and Bedroom sleep per day (SB2: assessing sleep location) — in addition to the final composite indicator correct sleep pattern (SAB: combining adequacy and quality of sleep time), highlighted by the shaded area. Clear sleep-wake cycles are evident. A possible daytime sleep period on day 1 probably involved naps outside the bedroom (for example, sofa), indicated by low most sleep nights per day and variable bedroom sleep per day despite increasing correct sleep and adequate sleep time. In contrast, the first two nights show concurrent high values across all metrics, representing consolidated, highly rated “correct” sleep occurring at night, for adequate duration, and primarily within the bedroom. The third night differs significantly; while the sleep timing was appropriate (highest sleep nights per day), the overall correct sleep indicator remained low. This coincides with reduced adequate sleep time and lower or more variable bedroom sleep per day (suggesting periods of sleep outside the bedroom), indicating that insufficient duration and potential non-bedroom sleep contributed to this night’s poor overall rating. The graph thus reveals variability in the assessed sleep quality and location over the three nights, with the third night being less optimal. These insights are particularly valuable for early detection of sleep disturbances, enabling healthcare professionals to monitor not only total sleep duration, but also whether sleep occurs at appropriate times and in appropriate locations, both of which are essential indicators of healthy rest in frail individuals.

3.3. Fuzzy Inference in KG for Excretion Control

This section presents the fuzzy inference model used to assess the regularity and appropriateness of excretion routines. The structure, shown in Figure 9, combines semantic reasoning and FL to model behavioural expectations regarding toileting habits in older adults, with a focus on daytime and night-time patterns.

3.3.1. Input Data Sources

The inference model receives as input a set of raw data streams collected from ambient sensors installed in the bathroom environment. These include a binary signal indicating toilet flush activation, a motion-based presence signal detecting user activity in the space, and a categorical localisation stream that identifies whether the individual is located within the toilet area at each time point. This spatial signal is derived from proximity to the UWB anchors and encoded as a binary value: 1 if the user is detected in the toilet area, and 0 otherwise. These three data streams are fused to form a composite fuzzy data stream, which represents the inferred occurrence of a toileting event within a bounded temporal window based on flush, motion, and location.

3.3.2. Knowledge Graph

The KG was developed in collaboration with healthcare professionals to reflect realistic excretion routines to assess whether the individual demonstrates healthy excretion control patterns. The hierarchical fuzzy structure integrates frequency, timing, and spatial-temporal alignment of behaviour and produces a composite health indicator. The structure consists of:
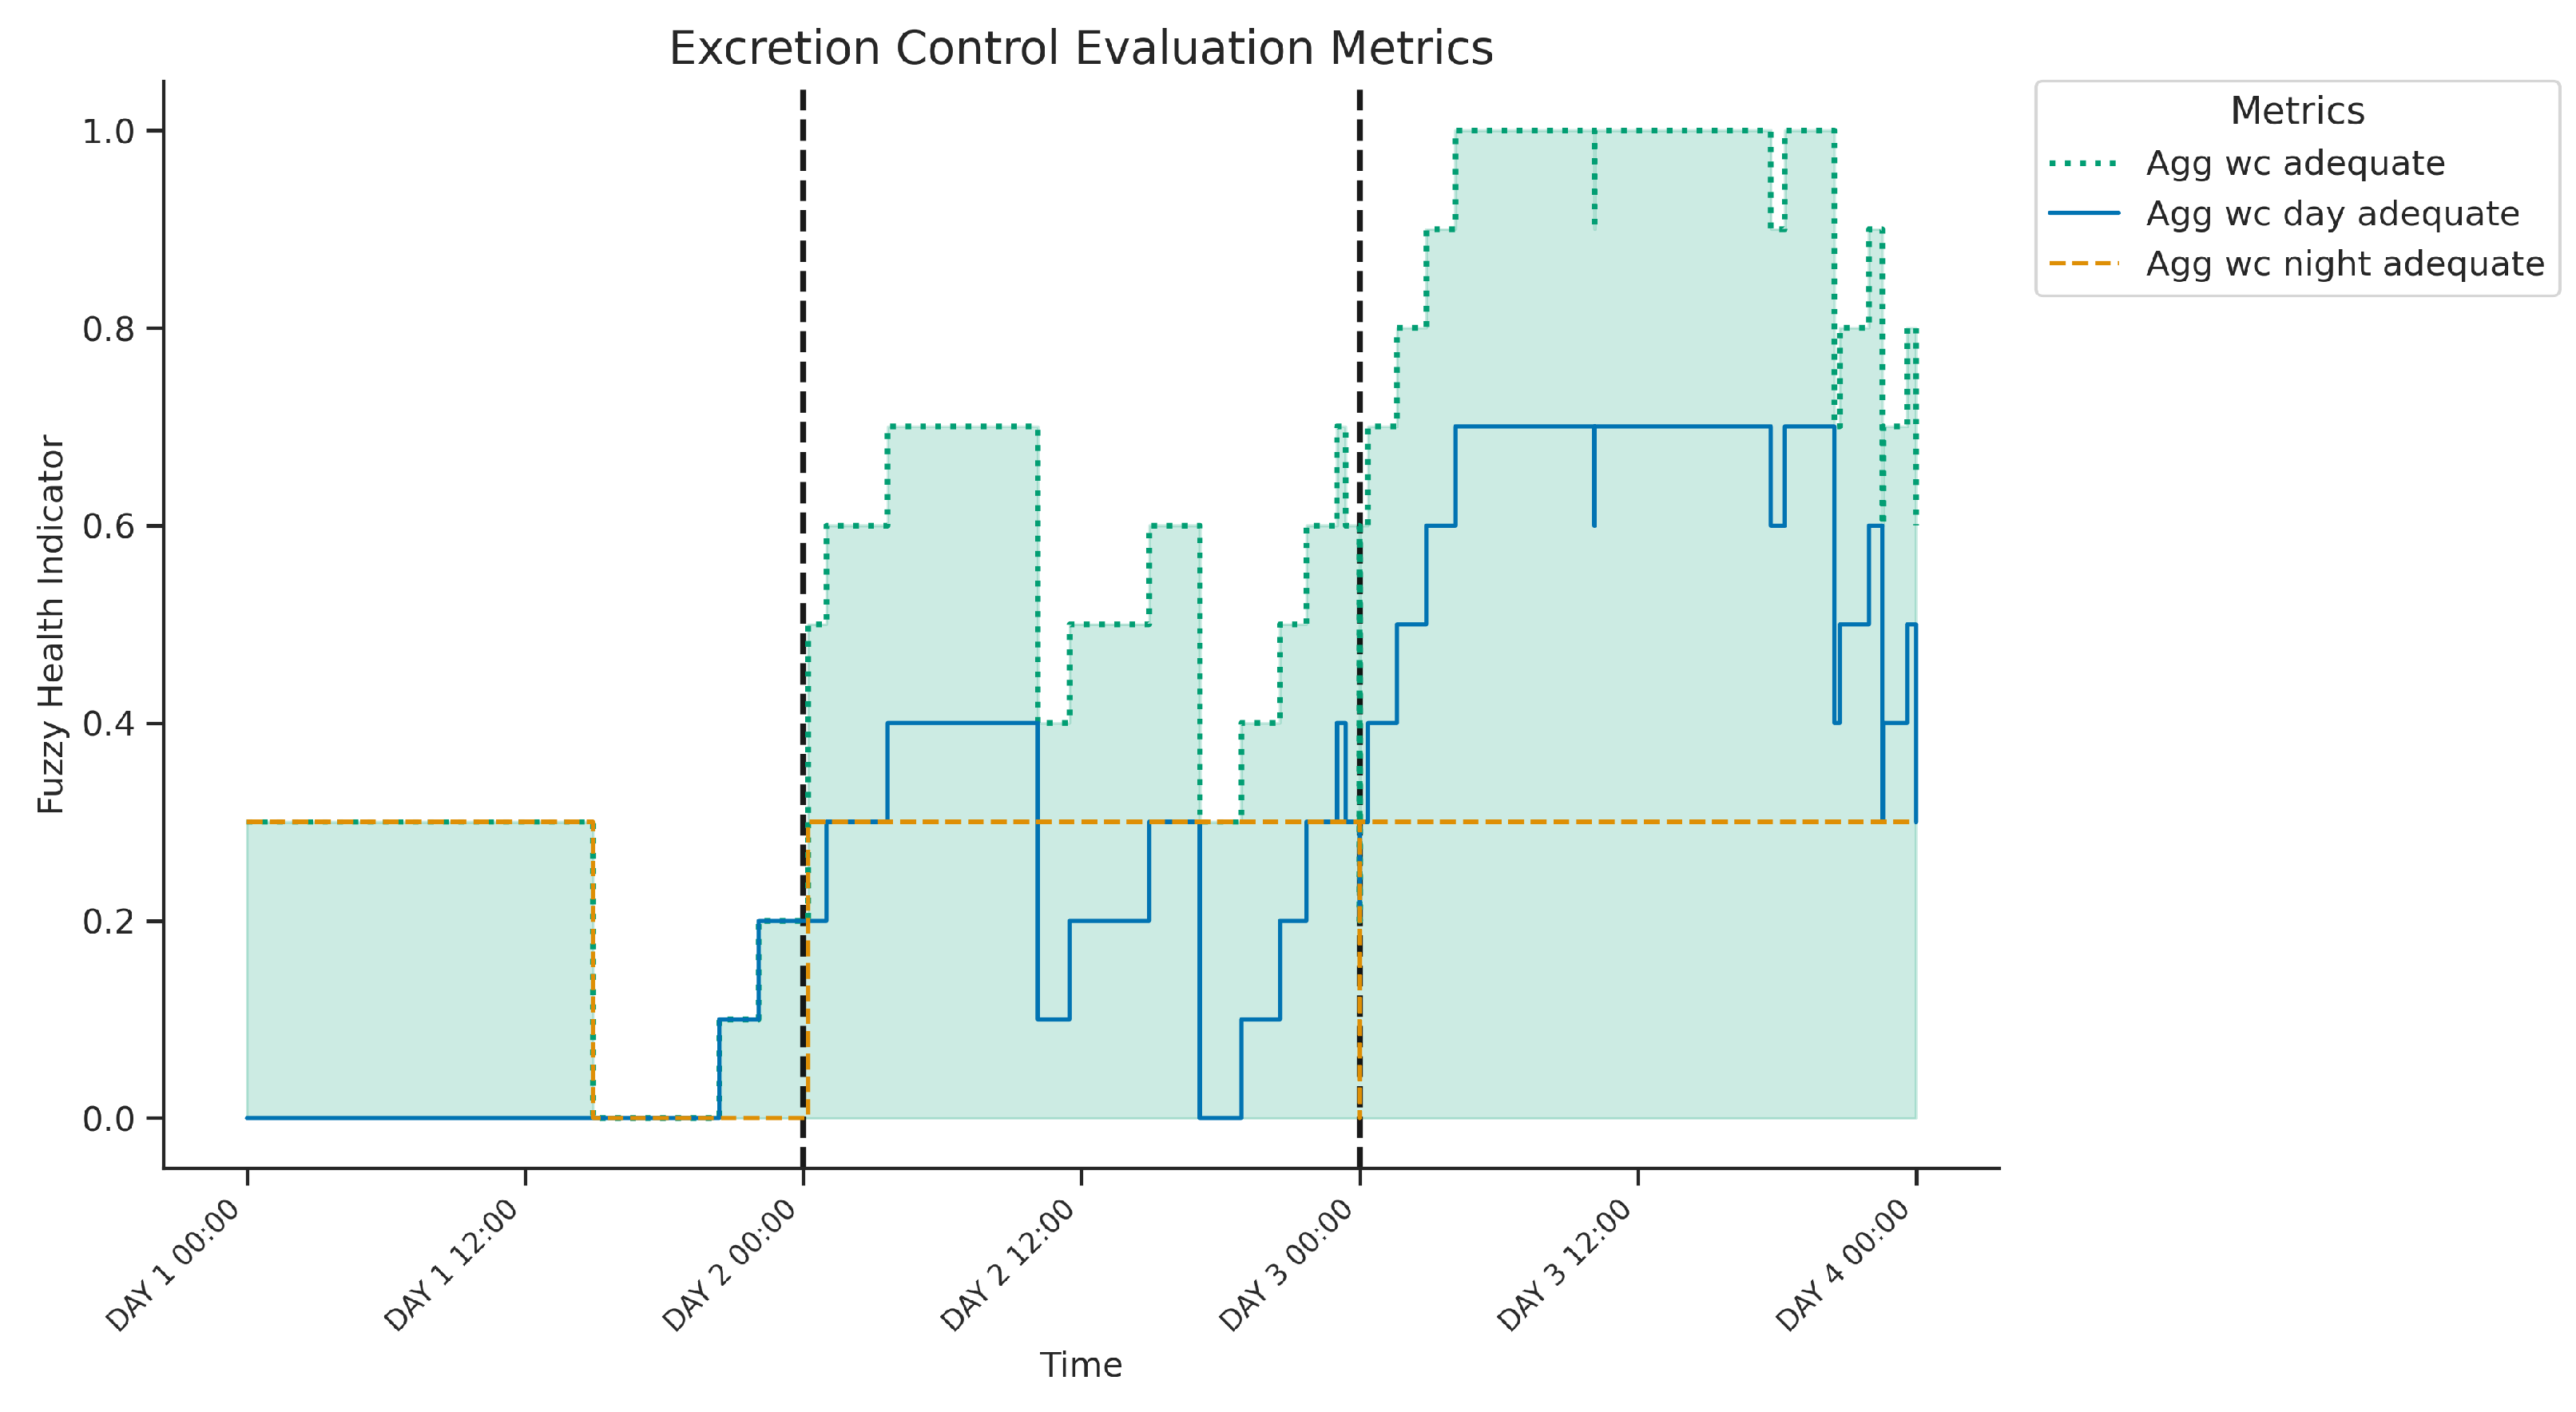
  • +) SA: Daily excretions
  • Captures regularity and frequency of bathroom visits throughout the day aggregating value (V) and time-based frequency (T) over the full day.
  • Defined as healthy when the total number of inferred excretion episodes is between 3 and 5 per day.
  • +) SB: Night excretions
  • Evaluates bathroom visits during the night calculated using a fuzzy combination of value (V) and temporal indicator (T) restricted to night-time hours.
  • Considered healthy if the number of visits ranges between 0 and 2.
  • +) S1: Excretion detection
  • Core detection mechanism combining: flush events, presence in the toilet, and localisation in the toilet room.
  • Fuzzy temporal aggregation is applied over short intervals (2 to 4 min) to infer likely excretion episodes.
  • Outputs a time-aligned indicator that feeds into both the SA and SB branches.
The following equations define the fuzzy inference process based on the KG, combining the input data streams to evaluate the adequacy of excretions producing a composite health indicator for assessing excretion control patterns in frail individuals.
S 1 : V wc detection T 2 4 min L toilet V wc detection = w c m o t i o n , = max V wc toilet = V wc detection L t o i l e t , c a p = min V wc toilet = V wc toilet T 2 4 m i n , c a p = max min T 2 4 m i n = T ( Δ ) [ 4 m i n , 2 m i n , 2 m i n , 4 m i n ] SA : Q between 3 - 8 times | S 1 | T per day | S 1 | T per day , = x ¯ w | V t i m e s | = V T t , V T t - 1 > 0 Q b e t w e e n 3 8 t i m e s = T ( x ) [ 1 , 3 , 5 , 8 ] SB : Q between 0 - 2 times | S 1 | T night Q o v e r n i g h t e x c r e t i o n = | S 1 | T night , = m i n Q b e t w e e n 3 8 t i m e s = T ( x ) [ 1 , 1 , 1 , 3 ] S A B : IF S A ( W 7 ) AND S B ( W 3 ) THEN V A B W 3 = 0.3 , W 7 = 0.7 S A B = V A B = S A W 7 + S B W 3

3.3.3. Discussion and Explainability

Figure 10 presents the three-day temporal evolution of fuzzy health indicators for excretion control: the adequacy of daytime patterns (SA: wc day adequate), night-time patterns (SB: wc night adequate), and an overall composite score (SAB: wc adequate, shaded area). The night-time adequacy indicator remained stable throughout the period, suggesting a consistently appropriate frequency of toilet use during the night (likely 0–2 visits/night). In contrast, daytime adequacy varied significantly. On day 1, the daytime indicator remained at zero, implying an insufficient number of excretion episodes (below the 3–5 target range), resulting in a low overall composite score despite the adequate night-time pattern. However, on days 2 and 3, the daytime indicator progressively increased to high levels, signifying the achievement of the target frequency. This successful daytime routine consequently drove the overall composite score to high levels of adequacy over the last two days. In summary, the figure suggests consistently healthy night-time excretion patterns along with a variable daytime frequency, with insufficient daytime episodes observed only on the first day according to the fuzzy evaluation model. This kind of monitoring can assist in the clinical evaluation of urinary or faecal incontinence patterns, providing objective evidence of irregular routines or nocturnal disorientation that might indicate cognitive decline or functional deterioration.

3.4. Fuzzy Inference in KG for Physical Mobility

This section presents the fuzzy inference model used to assess physical inactivity in daily life, focusing on the behavioural patterns associated with sedentary lifestyles. The fuzzy model, shown in Figure 11, integrates data from movement and localisation sensors to evaluate mobility, walking habits, and time spent outside the home. The semantic structure allows for an interpretable and human-understandable evaluation of the behavioural risks associated with disuse.

3.4.1. Input Data Sources

The model receives input from two primary sensor streams: step count data, captured continuously via a wearable device that detects step-based motion using inertial sensors to construct fuzzy indicators of activity volume and walking sessions, and localisation data, provided by the UWB positioning system, which estimates the user’s real-time position within the home by indicating each minute whether the person is outside the home (1) or indoors (0), based on their distance to fixed anchors placed throughout the residence.

3.4.2. Knowledge Graph

The KG was developed in conjunction with health professionals to identify clinically relevant signs of physical mobility. The KG formalises expectations around mobility and encourages patterns associated with healthy ageing, such as consistent walking and outdoor exposure. The fuzzy inference process aggregates multiple behavioural signals into a single health indicator. The KG structure is composed of the following branches:
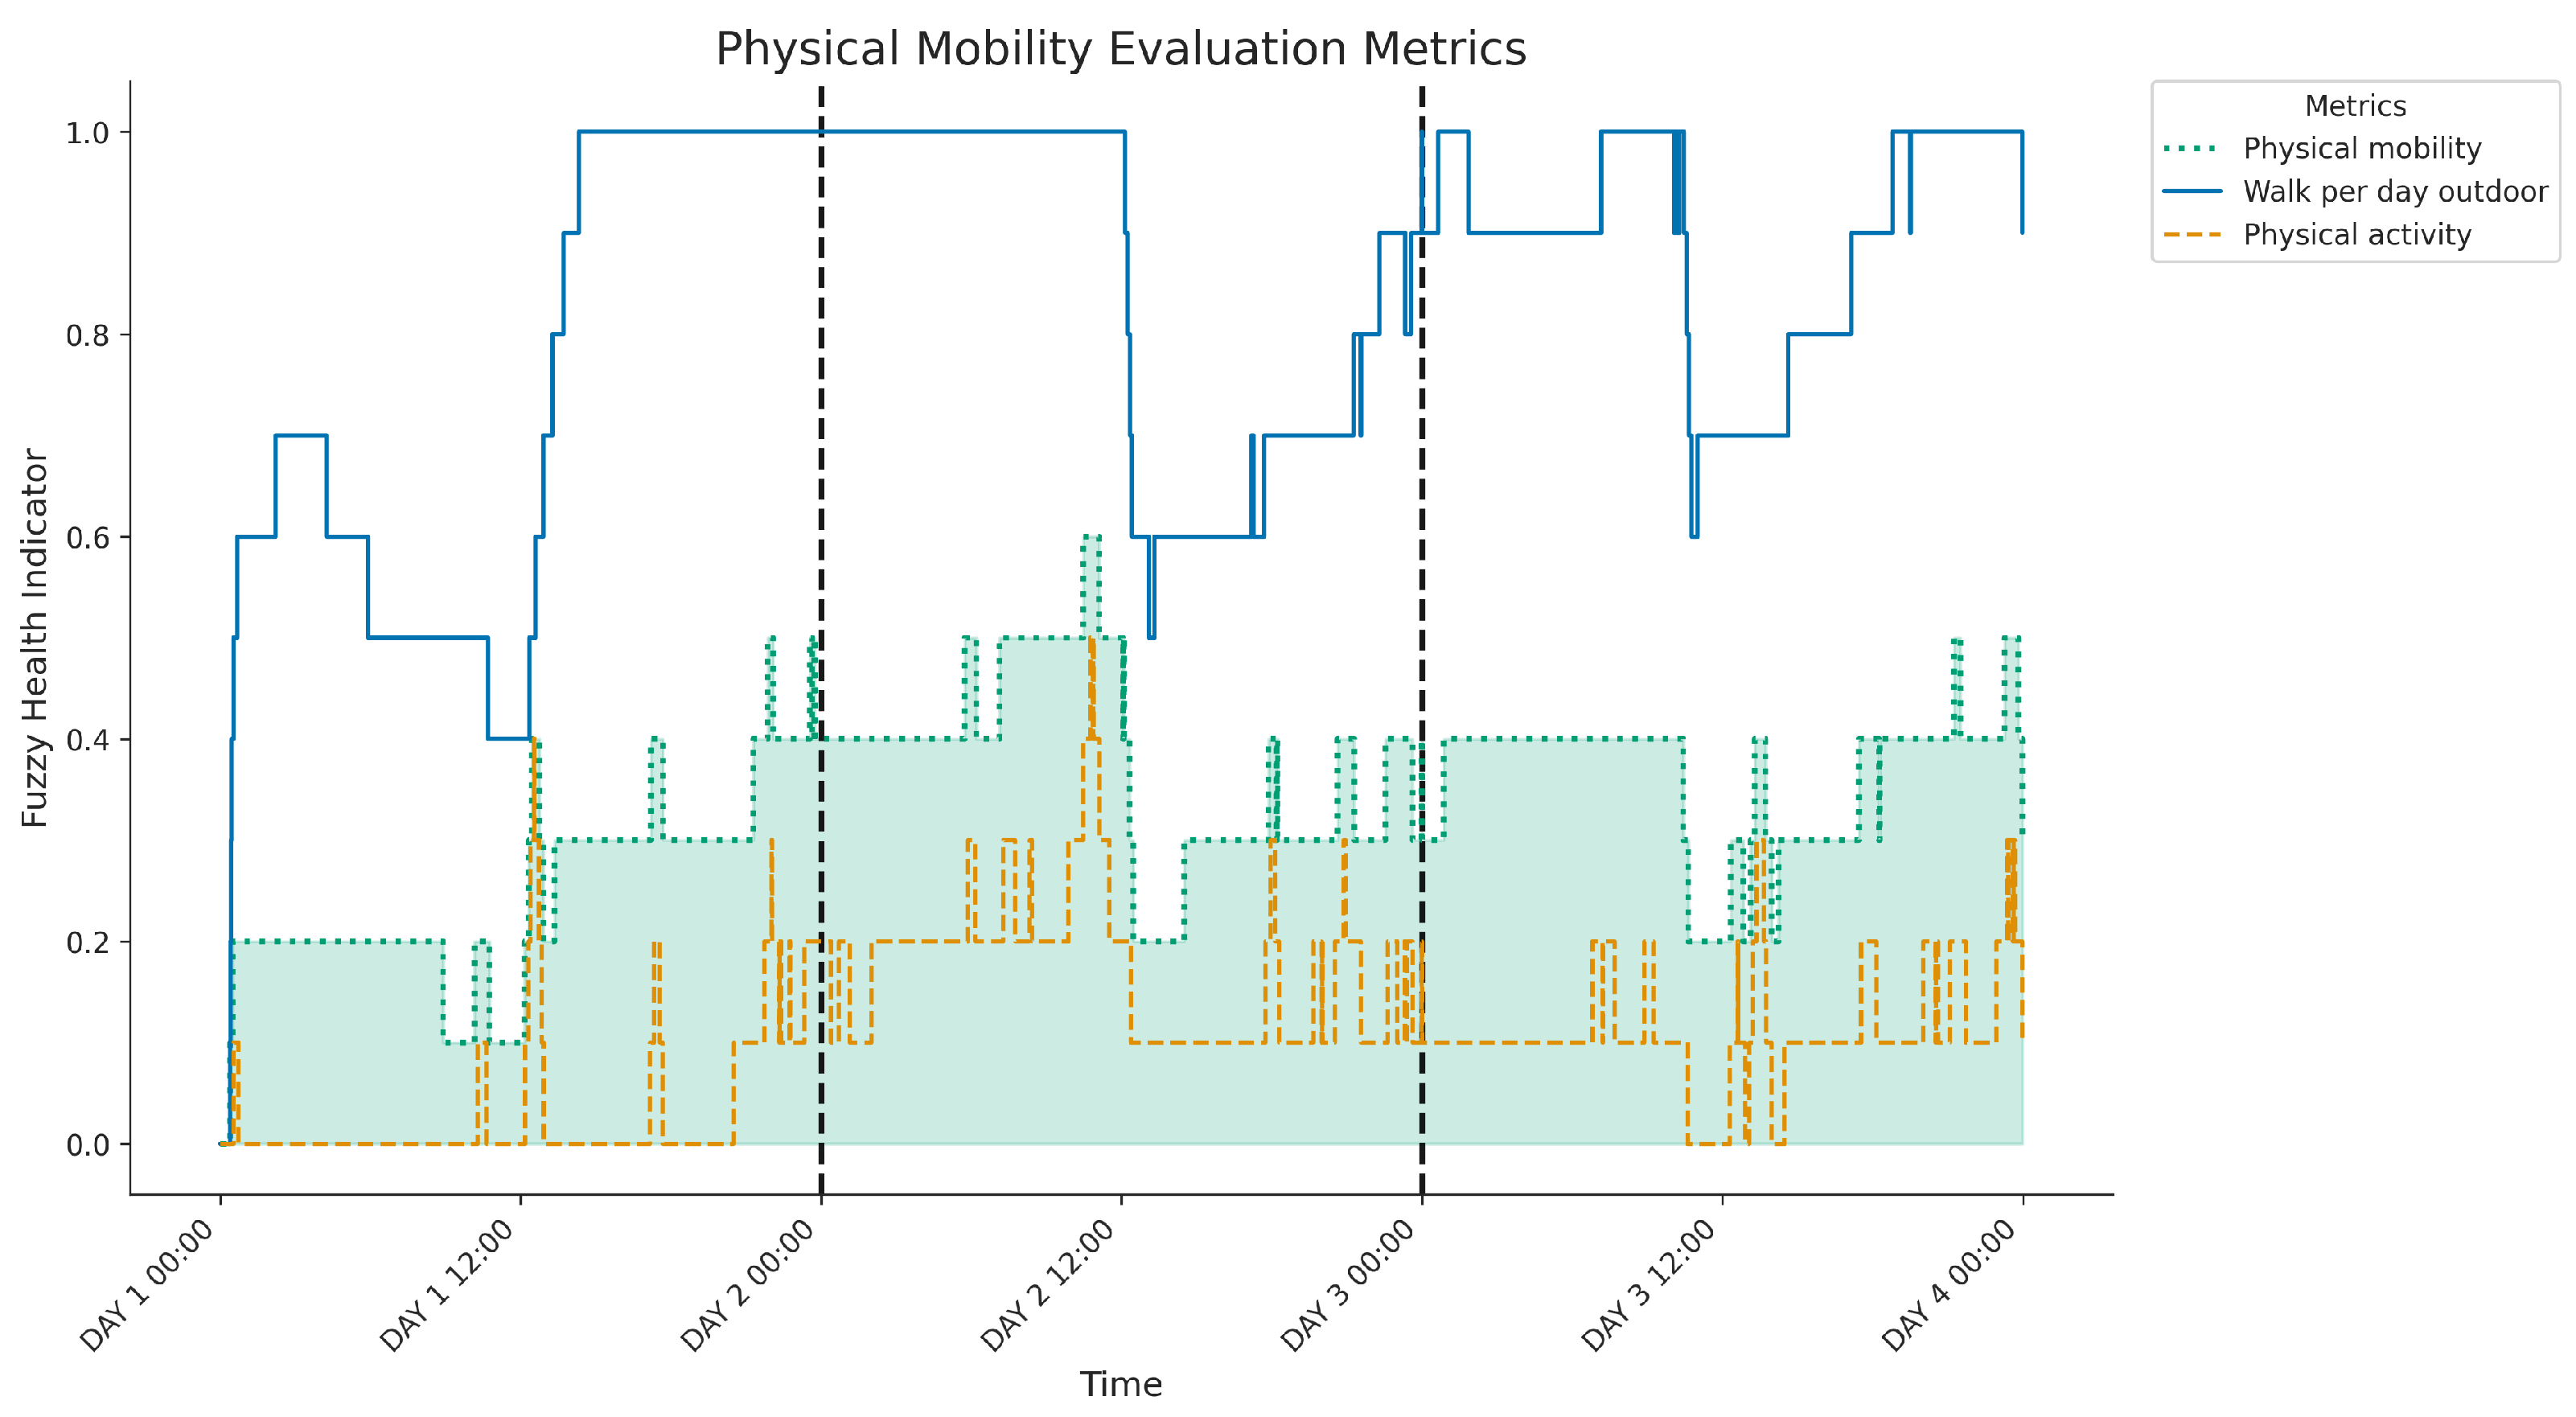
  • +) SA: Physical activity
  • SA1: Active mobility. Assesses whether an adequate number of steps is taken each day and combines quantity (Q), temporality (T), and step count values (V).
  • SA2: Walking consecutive. Evaluates whether walking sessions include at least one sustained period of approximately 30 min. Derived from continuous step activity patterns, weighted by time (T) and value (V).
  • +) SB: Most activity outdoor
  • Checks whether most activity occurs outside the home environment. Using location data (L), step values (V), and quantity (Q) to infer whether physical activity occurs predominantly in outdoor settings.
  • Considered relevant to prevent the sedentary routines commonly associated with indoor confinement.
  • +) SB: Physical mobility
  • Aggregates quantity and location using fuzzy temporal indicators. The model balances beneficial closeness with potential overdependence, providing a complete interpretation of daily caregiver engagement.
The following equations define the fuzzy inference process based on the KG, combining the input data streams to evaluate the adequacy of physical activity, producing a composite health indicator to assess disuse control patterns in frail individuals.
SA 1 : Q adequate number | V s t e p s | T per day | V s t e p s | = V s t e p s T t , V T t - 1 > 0 | V s t e p s | T per day , = x ¯ w Q a d e q u a t e n u m b e r = T ( x ) [ 100 , 400 , 1000 , 2000 s t e p s ] SA 2 : V walk T 30 min V walk = V s t e p s > 0 T 30 m i n = T ( Δ t ) [ 30 m i n , 15 m i n , 15 m i n , 15 m i n ] SB : Q most V r e l a t i o n a c t i v i t y o u t d o o r | T per day L outdoor L outdoor = ! L living ! L bedroom ! L bedroom , = min V relation activity outdoor = V w a l k L o u t d o o r T p e r d a y V w a l k T p e r d a y , = x ¯ w S A : IF S A 1 ( W 5 ) AND S A 2 ( W 5 ) THEN V S A T d a y W 5 = 0.5 V S A = S A 1 W 5 + S A 2 W 5 S A = V S A T d a y , = x ¯ w S A B : IF S A ( W 7 ) AND S B ( W 3 ) THEN V A B W 3 = 0.3 , W 7 = 0.7 S A B = V A B = S A W 7 + S B W 3

3.4.3. Discussion and Explainability

Figure 12 shows the three-day evolution of the physical mobility indicators derived from the fuzzy system, includingphysical activity (SA), walking per day outdoors (SB) and the final physical mobility indicator (SAB, highlighted). A key observation is the consistently moderate to low level of the SA indicator, suggesting insufficient daily steps or sustained walking throughout the period. Although this baseline activity level limits the maximum achievable use control score (SAB), the daily fluctuations observed in SAB are mainly driven by significant variations in SB. Periods of substantial outdoor activity, particularly evident during the afternoons and evenings of day 2 and day 3, correspond to the highest peaks in overall physical mobility. In contrast, times with limited outdoor activity result in lower overall scores, as seen notably during most of day 1. Therefore, the graph indicates that although the general activity volume restricts the overall score, the degree of outdoor engagement significantly modulates the daily assessment of physical mobility. From a clinical perspective, these indicators can support mobility assessments by identifying sedentary behaviours, lack of sustained walking, or low exposure to outdoor environments—all of which are relevant for assessing fall risk, frailty progression, and social isolation.

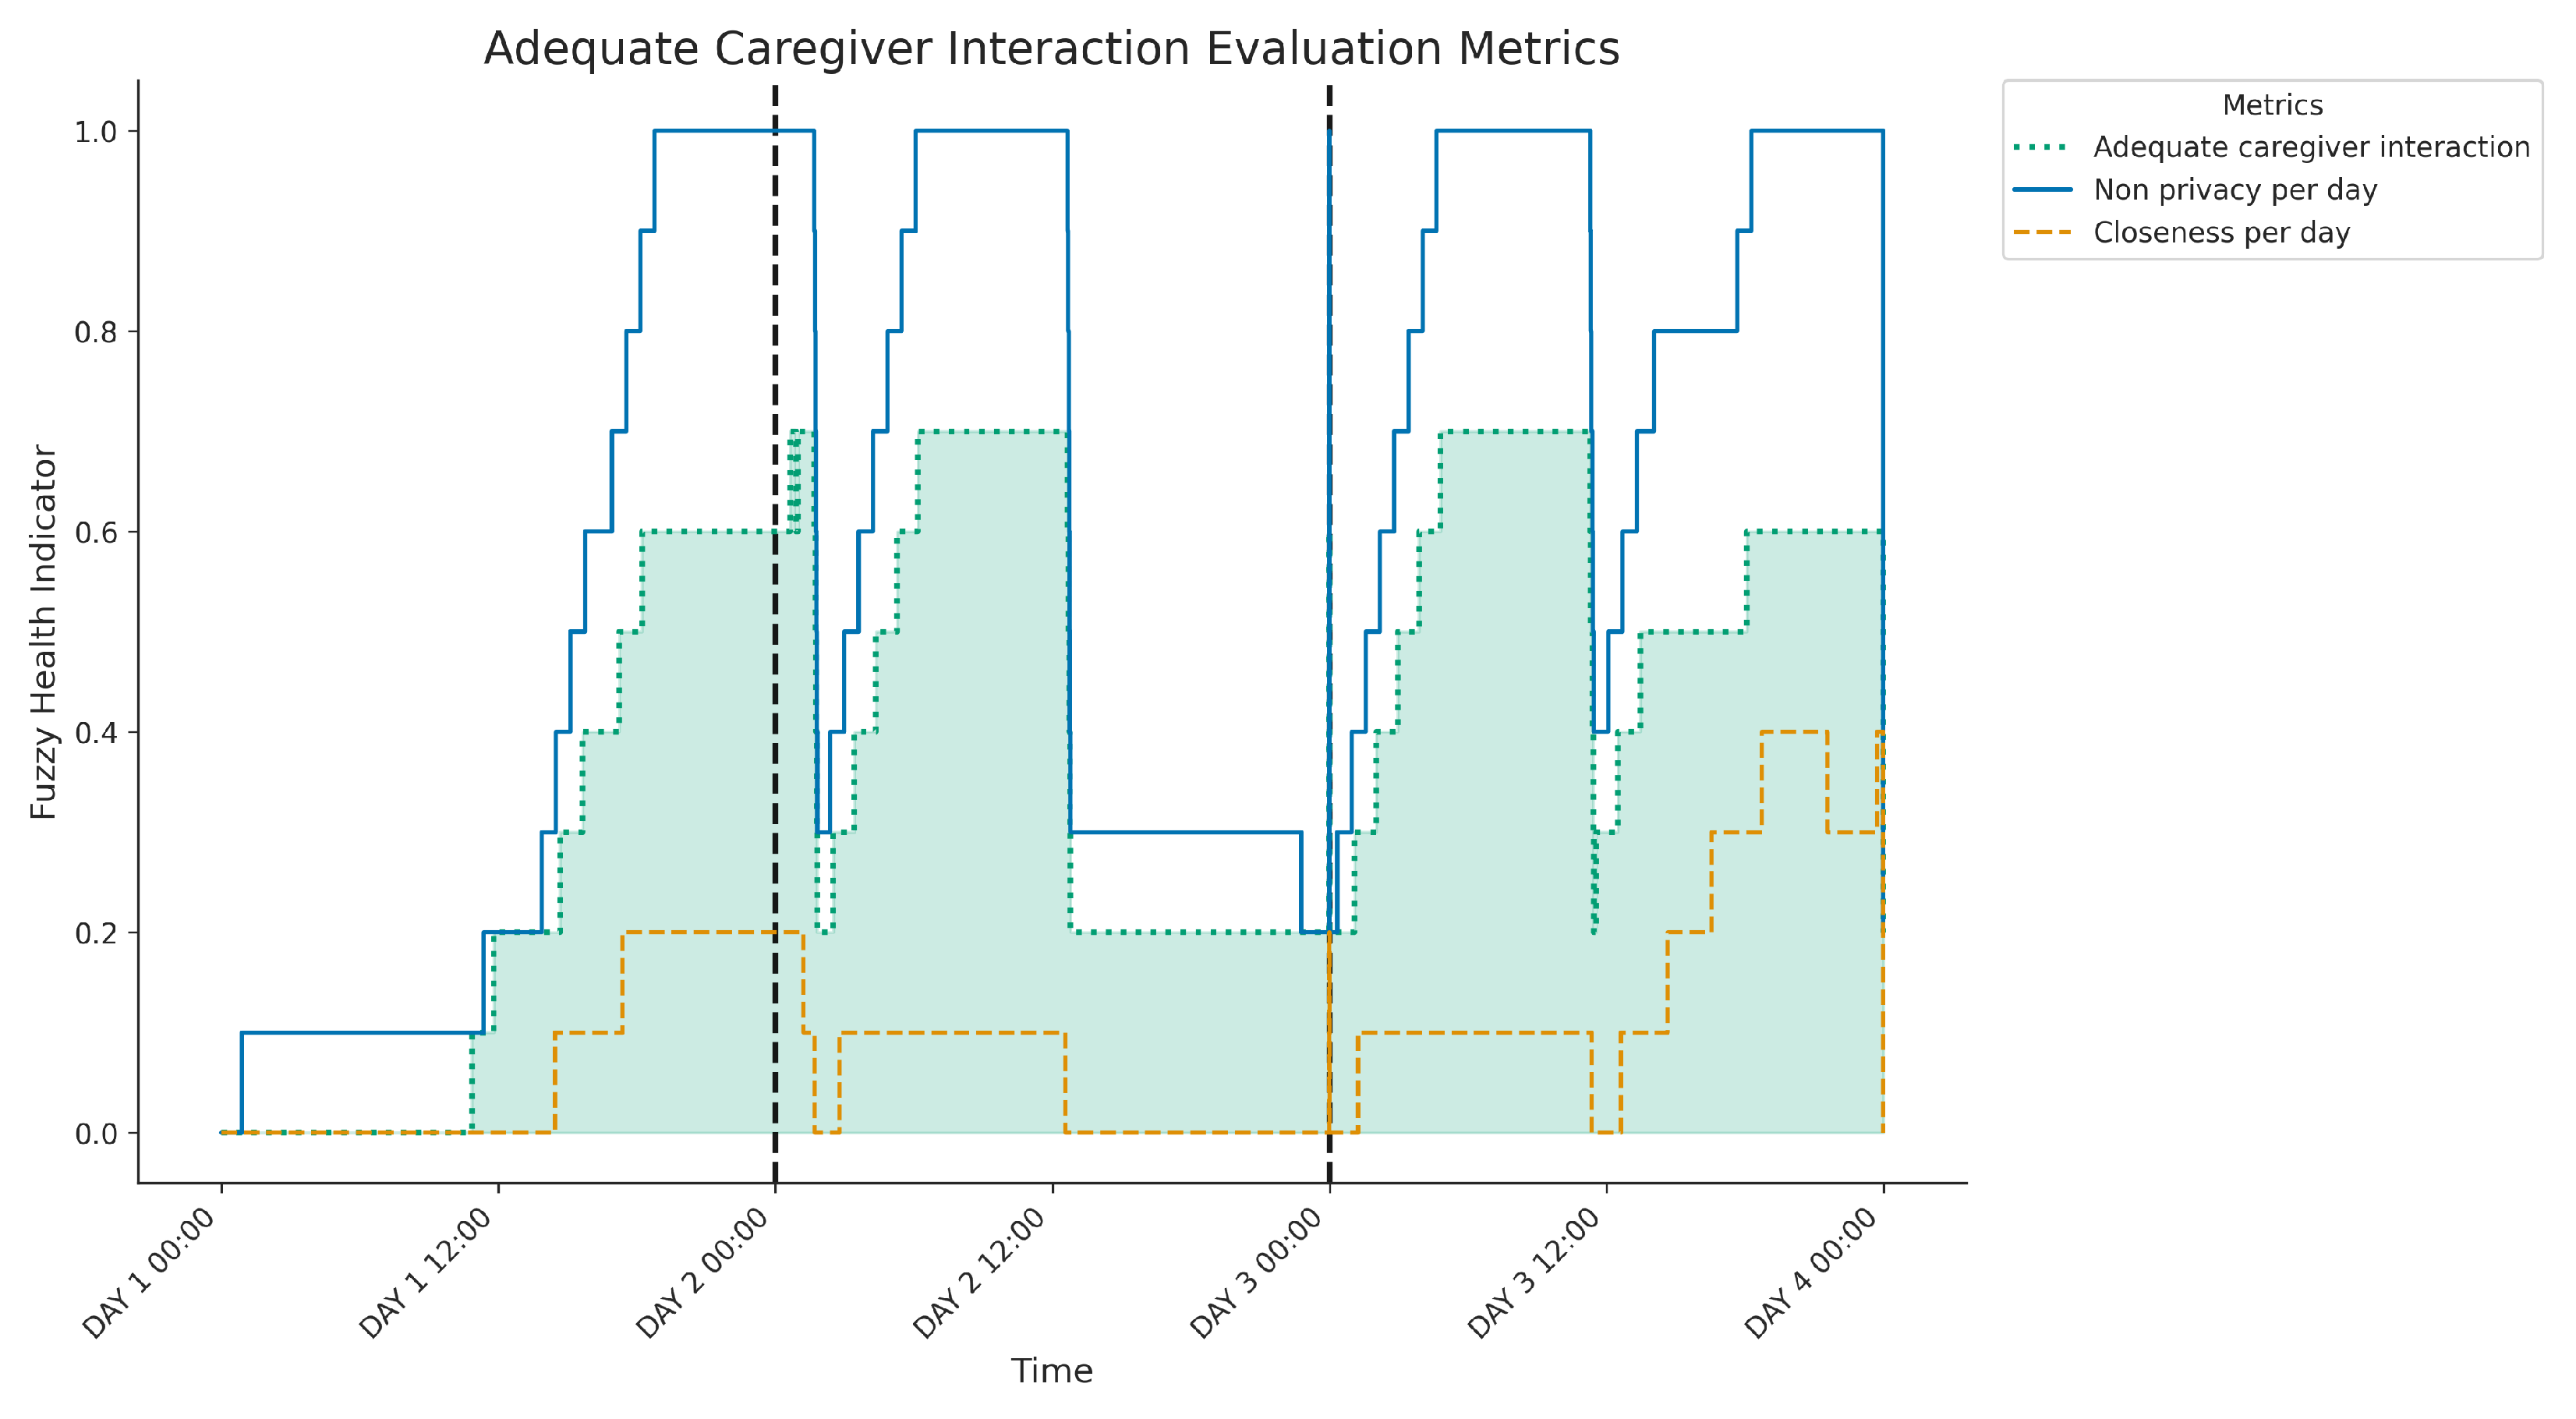
3.5. Fuzzy Inference in KG for Adequate Caregiver Interaction

This section describes a fuzzy inference model designed to assess the presence of a caregiver at home, using spatial–temporal proximity data. The model captures the balance between supportive presence and respect for privacy, which are key components of healthy caregiving dynamics. The structure, shown in Figure 13, integrates social distance and location data to evaluate closeness and autonomy in the interaction between caregiver and patient.
This model enables automatic detection of caregiving styles that promote safety and emotional well-being without compromising autonomy, helping to identify imbalanced patterns such as neglect or over-involvement.

3.5.1. Input Data Sources

The model is based on sensor data collected from the UWB localisation system installed throughout the home, which tracks the positions of both the care recipient and the caregiver via wearable tags. This setup provides minute-by-minute location data for the care recipient as a binary stream per room (presence = 1, absence = 0), as well as continuous distance estimates between the two individuals in metres. These distance readings are used to derive social proximity patterns throughout the day. In addition, motion sensor data in each room indicate local activity levels, supporting the detection of active presence and filtering out spurious readings caused by stationary tags.

3.5.2. Knowledge Graph
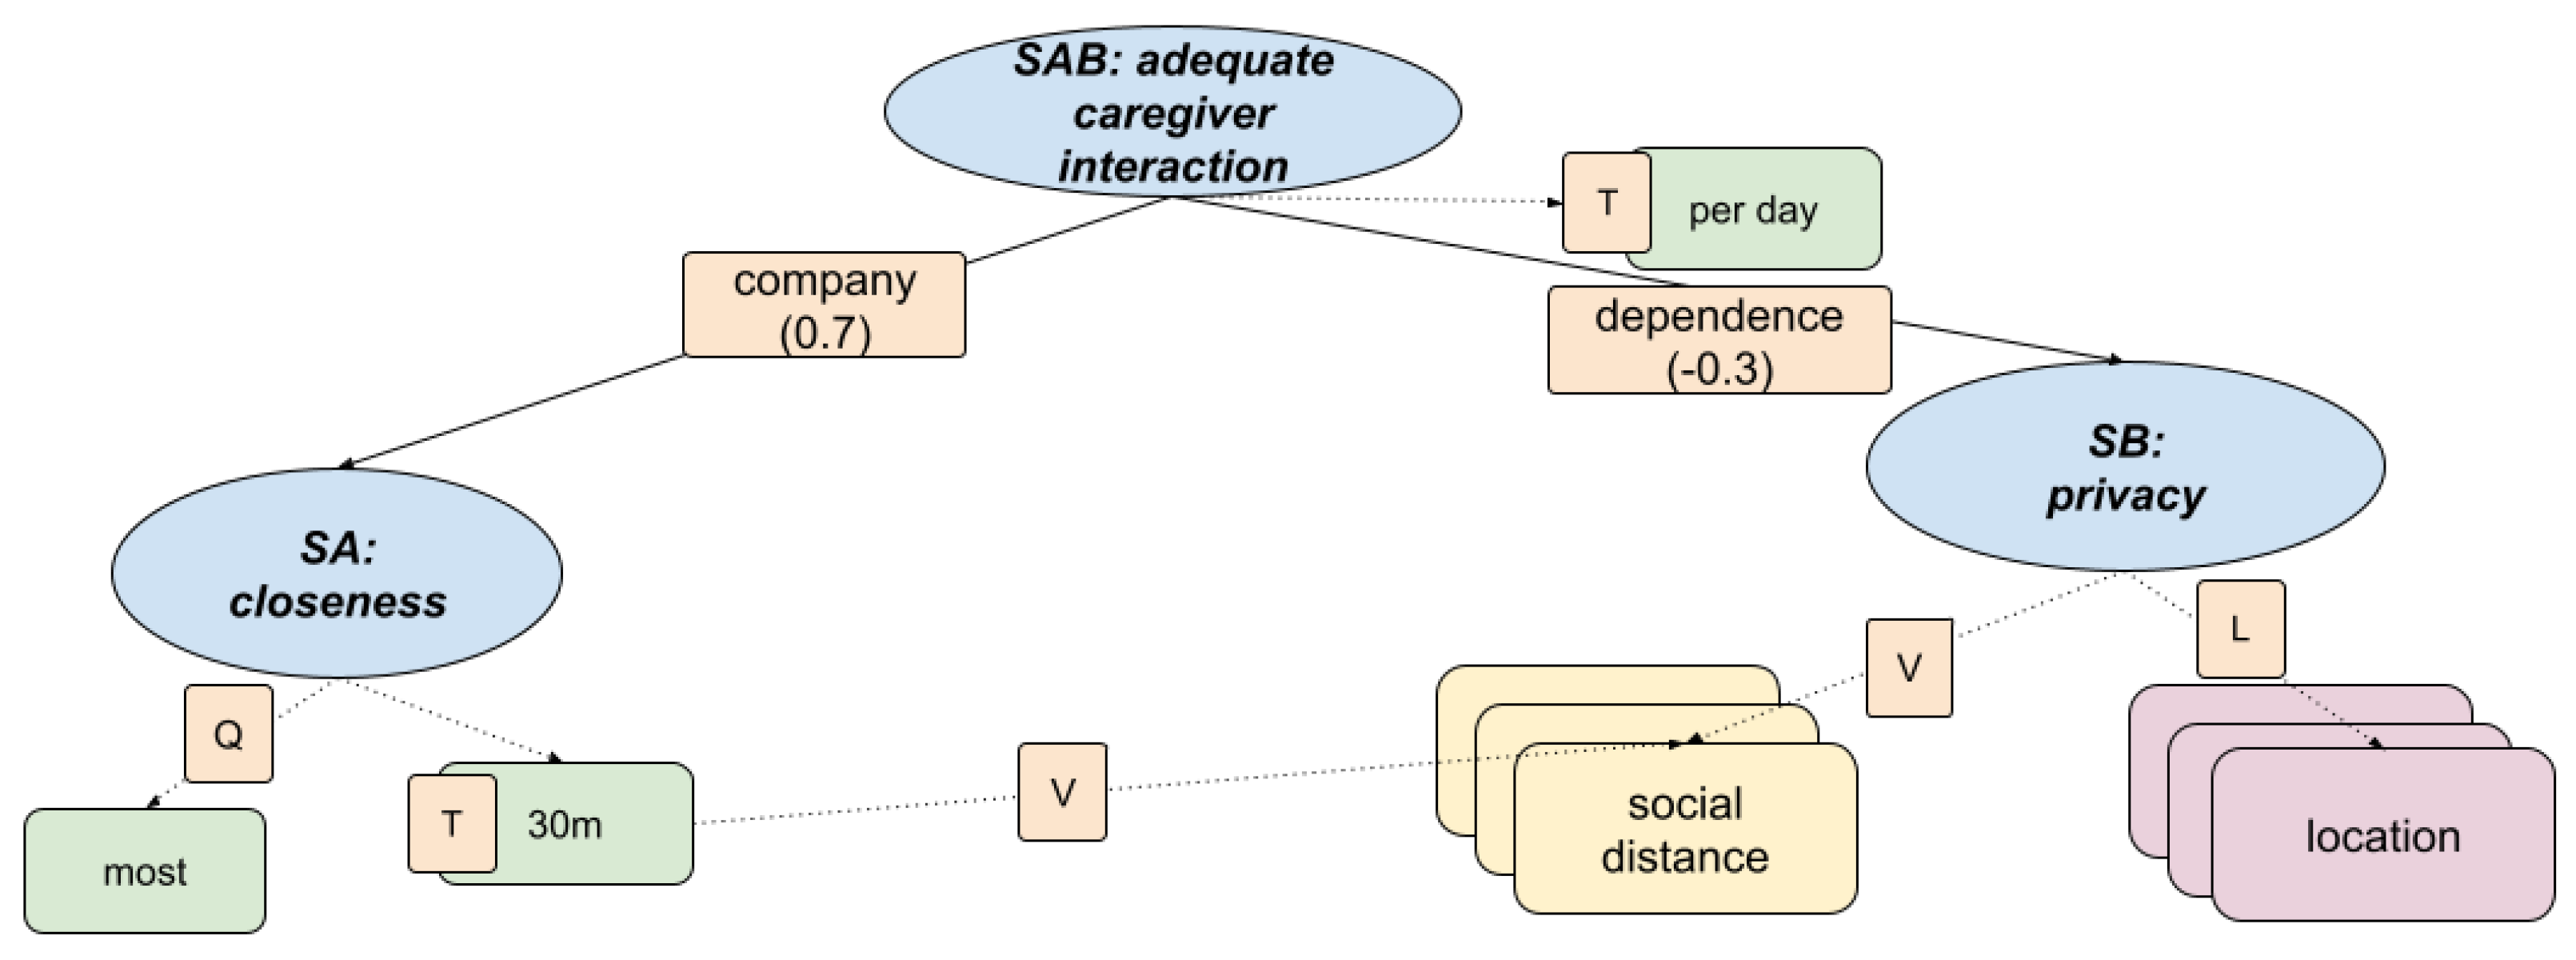
Informed by discussions with care professionals, the fuzzy KG formalises two key aspects of caregiver presence: emotional closeness and respect for personal boundaries. The model outputs an overall adequacy score based on the following hierarchical indicators.
  • +) SA: Closeness
  • The social distance is tracked and compared against a fuzzy threshold (for example, within 1 to 2 metres for at least 30 min/day).
  • Includes temporal coverage (T), quantity of interactions (Q), and value assessment (V) of proximity episodes.
+) SB: Privacy
  • Based on the detection of caregiver presence in specific rooms (e.g., bedroom, bathroom) where autonomy is expected.
  • Uses spatial location (L) and value (V) indicators to assess appropriateness of room-sharing patterns.
+) SAB: Presence of caregiver
  • Aggregates both positive (company) and negative (dependence) contributions using fuzzy temporal indicators. The model balances beneficial closeness with potential over-dependence, providing a complete interpretation of daily caregiver engagement.
The following equations define the fuzzy inference process based on the KG, combining the input data streams to evaluate the caregiver’s presence, producing a composite indicator that reflects both beneficial company and the risk of overdependence in frail individuals.
SA : Q most V c l o s e n e s s T 30 min V c l o s e n e s s = T ( x ) [ 0 , 0 , 0.5 , 2.5 m ] V c l o s e n e s s T 30 min , = x ¯ w SB : V c l o s e n e s s L privacy L p r i v a c y = L w c L b e d r o o m , = max SB : V c l o s e n e s s L privacy , = min S A B : IF S A ( W 7 ) AND S B ( W 3 ) THEN V s A B W 3 = 0.3 , W 7 = 0.7 S A B = V s A B T p e r d a y , = x ¯ w

3.5.3. Discussion and Explainability

Figure 14 shows the three-day evolution of caregiver interaction metrics: Closeness per day (SA branch, assessing proximity), Non-privacy per day (SB branch, assessing proximity within private rooms) and the overall Adequate caregiver interaction caregiver (SAB, highlighted). Both the closeness (SA) and non-privacy (SB) indicators exhibit daily variations, typically increasing from lower morning levels to significantly higher values during the afternoons and evenings; notably, the non-privacy score (SB) reaches very high levels during these peak periods on days 2 and 3, indicating frequent caregiver presence in private rooms during close interactions. The composite Adequate interaction caregiver score (SAB) reflects these combined patterns, achieving its highest values when both the SA and SB indicators are elevated. Analysing daily patterns reveals distinct differences: Day 1 shows moderate levels of combined closeness and co-location in private spaces, primarily during the afternoon and evening. In contrast, Days 2 and 3 show significantly more intense and prolonged periods of such combined interactions during similar times of the day, resulting in considerably higher peaks in the overall interaction caregiver score compared to the first day. This interpretability is particularly useful for detecting unbalanced caregiving dynamics, such as excessive dependency or lack of presence in critical contexts, which can inform interventions to promote autonomy while ensuring safety and emotional support.

3.6. Data-Driven Approaches for Modelling KHI

To complement the knowledge-based modelling approach and extend our comparative analysis, we also explored data-driven methods for the inference of KHI. These approaches leverage the same semantic definitions and protoforms introduced in previous sections to generate labelled datasets. By transforming the fuzzy linguistic output into crisp labels through alpha cuts, we obtained training data suitable for supervised learning. This enabled the application of classical machine learning models, such as K-Nearest Neighbours (KNN), Support Vector Machines (SVM), and Random Forest, to learn patterns directly from sensor streams.
Using these data-driven models, our objective is to evaluate their potential to replicate the computation of the desired KHI, based solely on the patterns learnt from the labelled data. This allows us to quantitatively assess the feasibility and precision of an entirely data-driven approach to derive meaningful health insights. The performance metrics obtained from these models provide a crucial benchmark for comparison with the interpretable knowledge-based methodology presented above. The development of data-driven models to process sensor data and derive KHI is detailed as follows:
  • Temporal windowing: We employed a sliding window approach to aggregate sensor data [39]. This method enabled the capture of both current and preceding sensor values within defined window size (WS), providing a comprehensive context for each point of time. The window size for each protoform is elaborated in further detail in Table 1.
  • Protoform Defuzzification: To enable the training of supervised learning models, the expert-defined protoforms of KHI were defuzzified using alpha-cuts. This transformation converted the fuzzy linguistic descriptions into a quantifiable, typically binary, classification problem for each indicator. The precise alpha-cut values used in this stage are presented in Table 1.
  • Cross-Validation Strategy: For the validation of our models, we implemented a cross-validation strategy of 2-hour-leave-out. This method ensured that the models’ performance was assessed on entirely unseen temporal blocks of data, thus providing a more reliable estimation of their generalisation capabilities.
  • Model Evaluation: The performance of the selected machine learning models, specifically K-Nearest Neighbours (KNN), Support Vector Machines (SVM) and Random Forest (RF), was thoroughly evaluated. Their effectiveness was quantified using established metrics, namely accuracy (ACC) and F1 score. The detailed evaluation results for each model are summarised in Table 1.
The results obtained from the data-driven models confirm the feasibility of inferring KHI directly from sensor data streams with high accuracy. Indicators based on frequent and well-defined behaviours such as excretion detection, deep sleep episodes, or 30 min walking sessions achieved outstanding performance across all classifiers, with F1 scores consistently above 0.95. This reflects the reliability of these patterns in structured temporal windows.
In contrast, more context-sensitive indicators, such as sleep predominantly at night, adequate sleep duration, or caregiver proximity in private areas, exhibited slightly lower but still acceptable performance. These cases highlight the added complexity of modelling behaviours that depend on temporal, spatial, and semantic nuances, which may be more variable between individuals. Despite these differences, overall performance was robust, with average F1 scores greater than 0.90 in the KNN model. This shows that even complex health indicators derived from fuzzy linguistic rules can be approximated effectively through supervised learning, provided that sufficient and well-labelled data are available. Importantly, since all training labels were derived from interpretable protoforms grounded in clinical criteria, the learnt models retain a strong link to expert-defined semantics. This suggests that data-driven approaches can serve not only as predictive tools, but also as scalable alternatives for replicating expert reasoning in constrained settings.
Moreover, the lightweight nature of the evaluated models and their suitability for edge deployment further support their practical utility. Trained classifiers can be integrated into wearable devices and IoT platforms to enable inference on the device, real-time inference, enhance privacy, and responsiveness in ambient assisted living scenarios. In summary, these findings reinforce the value of combining symbolic and statistical approaches: while knowledge-based models ensure interpretability and alignment with clinical reasoning, data-driven methods offer flexibility, generalisability, and efficient deployment, making them powerful allies in personalised health monitoring.

4. Conclusions

This work addressed the challenge of interpreting sensor data for frail individuals by developing a hybrid framework that integrates KG and FL. Our approach models clinically defined KHI: sleep patterns, excretion control, physical mobility, and caregiver interaction using non-invasive sensing (wearable and environmental) and expert-informed semantic structures.
KG provided a flexible and interpretable representation of health knowledge, while FL handled the vagueness inherent in both sensor inputs and clinical terminology. Through fuzzy reasoning on structured graphs, we generated daily summaries that reflected high-level behaviours such as nocturnal rest, bathroom routines, physical activity, and caregiver presence. A real-world case study conducted in Granada, Spain, demonstrated the feasibility of our system for continuous monitoring in naturalistic settings. Additionally, we developed data-driven models trained on labels derived from our fuzzy-defined indicators. These models achieved high classification performance (F1 scores greater than 0.90 in most behavioural indicators, particularly those related to regular and well-defined patterns), showing that expert semantic knowledge can guide the generation of reliable ground truth for supervised learning. Their lightweight nature and capacity for device deployment further validate their potential for real-time monitoring in edge-based environments.
Overall, this research proposes an interpretable and clinically grounded framework that bridges expert knowledge and sensor data, while demonstrating that machine learning can complement symbolic reasoning for robust, scalable health monitoring. Our findings suggest a viable path toward personalised and explainable systems capable of early detection and continuous support in ageing and frailty contexts.
Future work should expand the range of indicators (e.g., nutrition, medication adherence, potential cognitive markers), refine existing models through broader clinical validation, and enhance explainability with natural language summaries derived from the KG/FL reasoning. Further research could involve larger longitudinal studies to assess generalisability and reliability, integration with clinical alert systems, dynamic adaptation of the KG based on the evolution of user health, and exploration of hybrid models that combine the strengths of KG/FL with machine learning techniques. Additionally, analysing multiple indicators jointly, could uncover relevant behavioural correlations (e.g., how sleep quality influences mobility), offering richer insight into health dynamics. This duality enables both transparency and adaptability, addressing the critical need for trust and performance in health monitoring technologies.

Author Contributions

Conceptualization, J.M.-Q.; Methodology, A.P.-R. and J.M.-Q.; Validation, A.P.-R. and J.M.-Q.; Formal analysis, J.M.-Q.; Investigation, A.P.-R., I.V.L., R.D., A.R., D.G. and J.M.-Q.; Resources, J.M.-Q.; Data curation, A.P.-R.; Writing—original draft, A.P.-R.; Writing—review & editing, A.P.-R., I.V.L., D.G. and J.M.-Q.; Visualization, A.P.-R.; Funding acquisition, J.M.-Q. All authors have read and agreed to the published version of the manuscript.

Funding

This contribution has been funded by the Spanish Institute of Health ISCIII through the project DTS21-00047 and by the University of Granada through the project ’Detection of Sports Activities Using IoT Devices’ (6324) of the Office of Technology Transfer (OTRI).

Institutional Review Board Statement

The study was conducted in accordance with the Declaration of Helsinki, and approved by the Institutional Review Board (or Ethics Committee) of Comité de Ética de Investigación del Distrito de Granada Metropolitano (19 December 2024).

Informed Consent Statement

Written informed consent has been obtained from the patient to publish this article.

Data Availability Statement

All raw data and Python notebooks generated and analysed during this study are available in the public GitHub repository URL https://github.com/AuroraPR/Fuzzy-Health-KPI (accessed on 14 June 2025).

Conflicts of Interest

The authors declare no conflicts of interest.

Abbreviations

The following abbreviations are used in this manuscript:
AALAmbient Assisted Living
FLFuzzy Logic
FTWFuzzy Temporal Window
KHIFuzzy Health Indicators
KGKnowledge Graph
TLAThree letter acronym
UWBUltra-Wideband

References

  1. Caballero, P.; Ortiz, G.; Medina-Bulo, I. Systematic literature review of ambient assisted living systems supported by the Internet of Things. Univers. Access Inf. Soc. 2024, 23, 1631–1656. [Google Scholar] [CrossRef]
  2. Wang, K.; Ghafurian, M.; Chumachenko, D.; Cao, S.; Butt, Z.A.; Salim, S.; Abhari, S.; Morita, P.P. Application of artificial intelligence in active assisted living for aging population in real-world setting with commercial devices—A scoping review. Comput. Biol. Med. 2024, 173, 108340. [Google Scholar] [CrossRef] [PubMed]
  3. Perandrés-Gómez, A.; Merdeces Párraga-Vico, M.; Díaz-Jiménez, D.; Medina-Quero, J.; Polo-Rodríguez, A. Impact of Training Programmes in Digital Skills to Reduce Unwanted Loneliness in Older Andalusian Women. In Proceedings of the Italian Forum of Ambient Assisted Living, Florence, Italy, 25–28 June 2024; pp. 431–440. [Google Scholar]
  4. Rehan, H. Enhancing Early Detection and Management of Chronic Diseases With AI-Driven Predictive Analytics on Healthcare Cloud Platforms. J. AI-Assist. Sci. Discov. 2024, 4, 1–38. [Google Scholar]
  5. Rehman, A.; Naz, S.; Razzak, I. Leveraging big data analytics in healthcare enhancement: Trends, challenges and opportunities. Multimed. Syst. 2022, 28, 1339–1371. [Google Scholar] [CrossRef]
  6. Peláez-Aguilera, M.D.; Espinilla, M.; Fernandez Olmo, M.R.; Medina, J. Fuzzy linguistic protoforms to summarize heart rate streams of patients with ischemic heart disease. Complexity 2019, 2019, 694126. [Google Scholar] [CrossRef]
  7. Polo-Rodríguez, A.; Romero-Sanchez, J.; Fernández-García, E.; Paloma-Castro, O.; Porcel-Gálvez, A.M.; Medina-Quero, J. Review on internet of things for innovation in nursing process-a pubmed-based search. In Proceedings of the International Conference on Ubiquitous Computing and Ambient Intelligence, Riviera Maya, Mexico, 28–29 November 2023; pp. 57–70. [Google Scholar]
  8. Wang, J.; Zhang, Q.; Shi, F.; Li, D.; Cai, Y.; Wang, J.; Li, B.; Wang, X.; Zhang, Z.; Zheng, C. Knowledge graph embedding model with attention-based high-low level features interaction convolutional network. Inf. Process. Manag. 2023, 60, 103350. [Google Scholar] [CrossRef]
  9. Arrotta, L.; Civitarese, G.; Bettini, C. Dexar: Deep explainable sensor-based activity recognition in smart-home environments. Proc. ACM Interact. Mob. Wearable Ubiquitous Technol. 2022, 6, 1–30. [Google Scholar] [CrossRef]
  10. Salguero, A.G.; Espinilla, M.; Delatorre, P.; Medina, J. Using ontologies for the online recognition of activities of daily living. Sensors 2018, 18, 1202. [Google Scholar] [CrossRef] [PubMed]
  11. Abdel-Razik, M.S.M.; Rizk, H.I.; Zein, M.M.; Abdel-Megeid, S.M.E.S.; Abd El Fatah, S.A. Promoting the culture of key performance indicators (KPIs) among primary health care staff at health district level: An intervention study. Eval. Program Plan. 2023, 96, 102188. [Google Scholar] [CrossRef]
  12. Polo-Rodriguez, A.; Cavallo, F.; Nugent, C.; Medina-Quero, J. Human activity mining in multi-occupancy contexts based on nearby interaction under a fuzzy approach. Internet Things 2024, 25, 101018. [Google Scholar] [CrossRef]
  13. Gürsel, G. Healthcare, uncertainty, and fuzzy logic. Digit. Med. 2016, 2, 101–112. [Google Scholar] [CrossRef]
  14. Chen, X.; Hu, Z.; Sun, Y. Fuzzy logic based logical query answering on knowledge graphs. In Proceedings of the AAAI Conference on Artificial Intelligence, Online, 22 February–1 March 2022; Volume 36, pp. 3939–3948. [Google Scholar]
  15. Johnson, K.B.; Wei, W.Q.; Weeraratne, D.; Frisse, M.E.; Misulis, K.; Rhee, K.; Zhao, J.; Snowdon, J.L. Precision medicine, AI, and the future of personalized health care. Clin. Transl. Sci. 2021, 14, 86–93. [Google Scholar] [CrossRef] [PubMed]
  16. Yan, S.; Lin, K.J.; Wang, H. Toward Lightweight End-to-End Semantic Learning of Real-Time Human Activity Recognition for Enabling Ambient Intelligence. IEEE Trans. Knowl. Data Eng. 2024, 36, 7157–7170. [Google Scholar] [CrossRef]
  17. Chen, T.C.T. Explainable Ambient Intelligence (XAmI): Explainable Artificial Intelligence Applications in Smart Life; Springer Nature: Berlin/Heidelberg, Germany, 2024. [Google Scholar]
  18. Chen, L.; Nugent, C.D.; Wang, H. A knowledge-driven approach to activity recognition in smart homes. IEEE Trans. Knowl. Data Eng. 2011, 24, 961–974. [Google Scholar] [CrossRef]
  19. Medina, J.; Espinilla, M.; Zafra, D.; Martínez, L.; Nugent, C. Fuzzy fog computing: A linguistic approach for knowledge inference in wearable devices. In Proceedings of the Ubiquitous Computing and Ambient Intelligence: 11th International Conference, UCAmI 2017, Philadelphia, PA, USA, 7–10 November 2017; Springer: Berlin/Heidelberg, Germany, 2017; pp. 473–485. [Google Scholar]
  20. Zadeh, L.A. Fuzzy sets. Inf. Control 1965, 8, 338–353. [Google Scholar] [CrossRef]
  21. Sajedi, S.N.; Maadani, M.; Nesari Moghadam, M. F-LEACH: A fuzzy-based data aggregation scheme for healthcare IoT systems. J. Supercomput. 2022, 78, 1030–1047. [Google Scholar] [CrossRef]
  22. Zadeh, L.A. A prototype-centered approach to adding deduction capability to search engines-the concept of protoform. In Proceedings of the 2002 Annual Meeting of the North American Fuzzy Information Processing Society Proceedings, NAFIPS-FLINT 2002 (Cat. No. 02TH8622), New Orleans, LA, USA, 27–29 June 2002; pp. 523–525. [Google Scholar]
  23. Fontenla-Seco, Y.; Bugarin, A.; Lama, M. Fuzzy temporal protoforms for the quantitative description of processes in natural language. In Proceedings of the 2021 IEEE International Conference on Fuzzy Systems (FUZZ-IEEE), Luxembourg, 11–14 July 2021; pp. 1–6. [Google Scholar]
  24. Ramos-Soto, A.; Bugarin, A.J.; Barro, S.; Taboada, J. Linguistic descriptions for automatic generation of textual short-term weather forecasts on real prediction data. IEEE Trans. Fuzzy Syst. 2014, 23, 44–57. [Google Scholar] [CrossRef]
  25. Kaczmarek-Majer, K.; Casalino, G.; Castellano, G.; Hryniewicz, O.; Dominiak, M. Explaining smartphone-based acoustic data in bipolar disorder: Semi-supervised fuzzy clustering and relative linguistic summaries. Inf. Sci. 2022, 588, 174–195. [Google Scholar] [CrossRef]
  26. Chen, K.; Zhang, D.; Yao, L.; Guo, B.; Yu, Z.; Liu, Y. Deep learning for sensor-based human activity recognition: Overview, challenges, and opportunities. ACM Comput. Surv. (CSUR) 2021, 54, 1–40. [Google Scholar] [CrossRef]
  27. Liu, P.; Wang, L.; Ranjan, R.; He, G.; Zhao, L. A survey on active deep learning: From model driven to data driven. ACM Comput. Surv. (CSUR) 2022, 54, 1–34. [Google Scholar] [CrossRef]
  28. Abidi, S.S.R.; Abidi, S.R. Intelligent health data analytics: A convergence of artificial intelligence and big data. In Healthcare Management Forum; SAGE Publications: Los Angeles, CA, USA, 2019; Volume 32, pp. 178–182. [Google Scholar]
  29. Liaw, W.; Kakadiaris, I.A. Primary care artificial intelligence: A branch hiding in plain sight. Ann. Fam. Med. 2020, 18, 194. [Google Scholar] [CrossRef] [PubMed]
  30. Lloyd, R.C. Quality Health Care: A Guide to Developing and Using Indicators; Jones & Bartlett Learning: Burlington, MA, USA, 2019. [Google Scholar]
  31. Loh, H.W.; Ooi, C.P.; Seoni, S.; Barua, P.D.; Molinari, F.; Acharya, U.R. Application of explainable artificial intelligence for healthcare: A systematic review of the last decade (2011–2022). Comput. Methods Programs Biomed. 2022, 226, 107161. [Google Scholar] [CrossRef] [PubMed]
  32. Wan, S.; Guan, S.; Tang, Y. Advancing bridge structural health monitoring: Insights into knowledge-driven and data-driven approaches. J. Data Sci. Intell. Syst. 2024, 2, 129–140. [Google Scholar] [CrossRef]
  33. Singh, B.; Chastin, S.; Miatke, A.; Curtis, R.; Dumuid, D.; Brinsley, J.; Ferguson, T.; Szeto, K.; Simpson, C.; Eglitis, E.; et al. Real-world accuracy of wearable activity trackers for detecting medical conditions: Systematic review and meta-analysis. JMIR mHealth uHealth 2024, 12, e56972. [Google Scholar] [CrossRef]
  34. Adewoyin, O.; Wesson, J.; Vogts, D. User modelling to support behavioural modelling in smart environments. In Proceedings of the 2022 3rd International Conference on Next Generation Computing Applications (NextComp), Flic-en-Flac, Mauritius, 6–8 October 2022; pp. 1–6. [Google Scholar]
  35. Martínez-Cruz, C.; Quero, J.M.; Serrano, J.M.; Gramajo, S. Monwatch: A fuzzy application to monitor the user behavior using wearable trackers. In Proceedings of the 2020 IEEE International Conference on Fuzzy Systems (FUZZ-IEEE), Glasgow, UK, 19–24 July 2020; pp. 1–8. [Google Scholar]
  36. Bugarin, A.; Marín, N.; Sánchez, D.; Trivino, G. Fuzzy knowledge representation for linguistic description of time series. In Proceedings of the 2015 Conference of the International Fuzzy Systems Association and the European Society for Fuzzy Logic and Technology (IFSA-EUSFLAT-15), Gijón, Spain, 30 June–3 July 2015; Atlantis Press: Amsterdam, The Netherlands, 2015; pp. 1346–1353. [Google Scholar]
  37. Silva, M.A.S.; Dimuro, G.P.; Borges, E.N.; Lucca, G.; Marco-Detchart, C. Analysis of Fuzzy Techniques in Edge Detection. In Proceedings of the International Conference on Enterprise Information Systems, Prague, Czech Republic, 24–26 April 2023; Springer: Berlin/Heidelberg, Germany, 2024; pp. 161–180. [Google Scholar]
  38. Medina, J.; Martinez, L.; Espinilla, M. Subscribing to fuzzy temporal aggregation of heterogeneous sensor streams in real-time distributed environments. Int. J. Commun. Syst. 2017, 30, e3238. [Google Scholar] [CrossRef]
  39. Sun, L.; Yang, X.; Hu, C. Dswhar: A dynamic sliding window based human activity recognition method. In Proceedings of the 2022 IEEE Smartworld, Ubiquitous Intelligence & Computing, Scalable Computing & Communications, Digital Twin, Privacy Computing, Metaverse, Autonomous & Trusted Vehicles (SmartWorld/UIC/ScalCom/DigitalTwin/PriComp/Meta), Haikou, China, 15–18 December 2022; pp. 1421–1426. [Google Scholar]
Figure 1. Architecture of components which outlines the flow of data from wearables devices and ambient sensors of patient and caregiver. The KG inference model computes the KHI for each dimension in real-time.
Electronics 14 02459 g001
Figure 2. Ontology which describe the edges and nodes of the KG based on sensor streams, protoforms (defined by quantifiers, temporal and spatial restrictions) and high-level fuzzy rules.
Electronics 14 02459 g002
Figure 3. Sensor architecture for indoor monitoring, integrating UWB-based localization, environmental sensing, and wearable devices for caregiver and patient. All data streams are collected locally for health indicator modelling.
Electronics 14 02459 g003
Figure 4. (A) Projection of a fuzzy temporal windows in a fuzzy data stream, and (B) inference of protoforms in the KG.
Electronics 14 02459 g004
Figure 5. Participant’s home layout and environment. (Left): Floor plan showing the location of UWB anchors (maroon circles) and binary/consumption sensors (green circles) in the monitored rooms (living room, bedroom, hallway, bathroom). (Right): Photographs of the real environment in the bedroom (top) and bathroom (bottom).
Electronics 14 02459 g005
Figure 6. Overview of the deployed sensor devices: (A) Wearable UWB tag (Estimote), (B) motion and flush sensors (Aqara) in the bathroom, (C) smart plug (TP-Link) and fixed UWB tag (Estimote), (D) smartwatch (Amazfit Bip U Pro) worn by the participant.
Electronics 14 02459 g006
Figure 7. Fuzzy KG for evaluating correct sleep patterns. The model integrates two main dimensions—adequate sleep time and quality of sleep—through indicators such as quantity, timing, sleep depth, and location.
Electronics 14 02459 g007
Figure 8. Three-day evolution of sleep metrics showing components and the final Correct sleep indicator (highlighted). The first two nights indicate well-rated sleep, contrasting with the third night’s low Correct sleep score, which coincides with reduced sleep duration and potential sleep outside the bedroom.
Electronics 14 02459 g008
Figure 9. Fuzzy KG for assessing excretion control. Day and night excretion patterns are evaluated through frequency and timing indicators, integrating sensor based detection using motion, toilet usage, and flush events.
Electronics 14 02459 g009
Figure 10. Three-day evolution of excretion control metrics showing components and the final wc adequate indicator (highlighted). Days 2 and 3 indicate well-rated excretion control, contrasting with Day 1’s low overall score, which coincides with insufficient daytime excretion frequency while night-time frequency remained adequate.
Electronics 14 02459 g010
Figure 11. Fuzzy KG for assessing physical mobility. The main dimension of physical activity is decomposed into active mobility and walking patterns, integrating step counts, durations, and spatial data to determine whether most activity occurs outdoors.
Electronics 14 02459 g011
Figure 12. Evolution of three-day of physical mobility indicators and the final Physical mobility indicator (highlighted). The overall score is limited by consistently low physical activity, but varies daily based on levels of outdoor activity.
Electronics 14 02459 g012
Figure 13. Fuzzy KG for assessing caregiver presence and interaction. Two main dimensions—closeness and privacy—are integrated using spatial and proximity indicators.
Electronics 14 02459 g013
Figure 14. Three-day evolution of caregiver presence metrics, showing components and the final Adequate caregiver interaction indicator (highlighted). The overall score reflects daily interaction intensity, peaking significantly higher on Days 2 and 3 compared to Day 1, coinciding with periods of elevated combined closeness and presence in private spaces.
Electronics 14 02459 g014
Table 1. Performance metrics of data-driven models for KHI inference.
Alpha-CutWSProtoformACCF1 Score
SVM RF KNN SVM RF KNN
0.75360C#most_sleep_night_per_day0.890.830.870.880.790.88
0.75360C#sleep_per_day0.560.760.880.520.730.89
0.98360C#deep_per_day0.980.990.970.990.990.98
0.71360C#bedroom_sleep_per_day0.710.670.860.660.620.86
0.515C#excretion_detection0.990.990.990.990.990.99
0.5360C#agg_wc_day_adequate0.770.830.920.750.810.92
0.25360C#agg_wc_night_adequate0.820.900.960.830.880.96
0.25360C#active_mobility0.740.800.950.710.780.95
0.2560C#walking30m0.980.960.980.970.960.98
0.75360C#walk_per_day_outdoor0.810.810.920.790.790.92
0.25360C#social_distance2_per_day0.650.720.900.610.700.90
0.25360C#non_privacy__per_day0.760.840.900.740.830.86
AVG0.800.840.930.790.820.92
Disclaimer/Publisher’s Note: The statements, opinions and data contained in all publications are solely those of the individual author(s) and contributor(s) and not of MDPI and/or the editor(s). MDPI and/or the editor(s) disclaim responsibility for any injury to people or property resulting from any ideas, methods, instructions or products referred to in the content.

