Article

Retinex-Based Low-Light Image Enhancement via Spatial-Channel Redundancy Compression and Joint Attention

School of Computer Science and Information Security, Guilin University of Electronic Technology, Guilin 541000, China
*
Author to whom correspondence should be addressed.
These authors contributed equally to this work.
Electronics 2025, 14(11), 2212; https://doi.org/10.3390/electronics14112212
Submission received: 28 March 2025 / Revised: 13 May 2025 / Accepted: 28 May 2025 / Published: 29 May 2025

Abstract

:
Low-light image enhancement (LLIE) methods based on Retinex theory often involve complex, multi-stage training and are commonly built on convolutional neural networks (CNNs). However, CNNs suffer from limitations in capturing long-range dependencies and often introduce redundant computations, leading to high computational costs. To address these issues, we propose a lightweight and efficient LLIE framework that incorporates an optimized CNN compression strategy and a novel attention mechanism. Specifically, we design a Spatial-Channel Feature Reconstruction Module (SCFRM) to suppress spatial and channel redundancy via split-reconstruction and separation-fusion strategies. SCFRM is composed of two parts, a Spatial Feature Enhancement Unit (SFEU) and a Channel Refinement Block (CRB), which together enhance feature representation while reducing computational load. Additionally, we introduce a Joint Attention (JOA) mechanism that captures long-range dependencies across spatial dimensions while preserving positional accuracy. Our Retinex-based framework separates the processing of illumination and reflectance components using a Denoising Network (DNNet) and a Light Enhancement Network (LINet). SCFRM is embedded into DNNet for improved denoising, while JOA is applied in LINet for precise brightness adjustment. Extensive experiments on multiple benchmark datasets demonstrate that our method achieves superior or comparable performance to state-of-the-art LLIE approaches, while significantly reducing computational complexity. On the LOL and VE-LOL datasets, our approach achieves the best or second-best scores in terms of PSNR and SSIM metrics, validating its effectiveness and efficiency.

1. Introduction

Traditional image processing methods, such as histogram equalization [1] and gamma correction [2], are limited in effectiveness for low-light image enhancement tasks due to their reliance on heuristic-based operations and limited adaptability.
Deep learning approaches, especially convolutional neural networks, have become essential tools for low-light image enhancement. CNNs naturally handle multi-channel inputs, such as RGB three-channel images, by extracting features [3] from each channel using different convolutional kernels and subsequently fusing the information across channels, effectively capturing cross-channel correlations. However, CNNs typically overlook long-range dependencies when extracting local features, limiting their effectiveness in complex scenarios. Additionally, CNN-based methods often introduce redundant computations [4], resulting in increased computational requirements. To address these limitations, recent research efforts have focused on optimizing CNN architectures to better capture long-range dependencies, reduce computational redundancy, and improve their overall effectiveness in LLIE tasks. Restructuring network architectures, such as the introduction of skip connections in ResNet [5], has helped reduce redundant parameters by linking previous feature maps. MobileNet [6] decomposes traditional convolutional operations into a depthwise convolution (DWC), which processes each channel independently, and a pointwise convolution (PWC), typically a 1 × 1 convolution. This decomposition significantly decreases computational complexity and reduces the number of parameters. SPCONV [7] divides input channels into two independent subgroups for differentiated feature extraction; however, this method introduces additional matrix operations in the subsequent feature fusion stage. Although these approaches substantially improve model efficiency, they typically address redundancy either in the spatial dimension or the channel dimension alone, leaving room for further optimization. In this paper, we propose the Spatial-Channel Feature Reconstruction Module, which simultaneously reduces spatial and channel redundancy. SCFRM comprises two main components: SFEU and CRB. Initially, the input feature map is processed by SFEU to adaptively minimize spatial redundancy. Subsequently, CRB addresses redundancy across feature channels. The input feature map is first processed by SFEU, which adaptively separates and reconstructs feature map weights to minimize spatial redundancy. Subsequently, CRB reduces channel redundancy by unequally separating feature map channels, compressing them into a lower-dimensional representation, and then fusing the refined information back into the feature map.
The attention mechanism [8] allows neural networks to dynamically focus on the most relevant regions of a feature map during computation, rather than treating all areas equally. As a result, it has been widely and effectively utilized in deep learning, significantly enhancing neural network performance. In this paper, we propose JOA, which decomposes traditional 2D global pooling into two collaborative 1D feature encoding processes that aggregate features along different spatial directions. This approach not only jointly captures long-range dependencies but also preserves precise positional information, leading to more effective and efficient low-light image enhancement.
In this paper, we decompose images into reflectance and illumination components based on Retinex theory [9]. These components are then enhanced separately using DNNet and LINet, after which the enhanced components are fused to reconstruct the final enhanced image. We integrate the SCFRM into DNNet to accelerate processing and reduce redundancy, thereby improving denoising performance. DNNet adopts a U-shaped network architecture, effectively utilizing extracted features and further enhancing denoising capabilities. Additionally, we incorporate JOA into LINet to effectively capture critical positional information within the illumination component. This attention selectively emphasizes dark image regions with stronger enhancements while applying moderate enhancements to brighter regions, thus preventing overexposure. By adaptively allocating attention weights, the proposed method effectively enhances color-rich areas without causing over-enhancement or distortion. Experimental results demonstrate that our proposed approach significantly outperforms existing methods, achieving superior enhancement quality and computational efficiency. Our contributions can be summarized as follows:
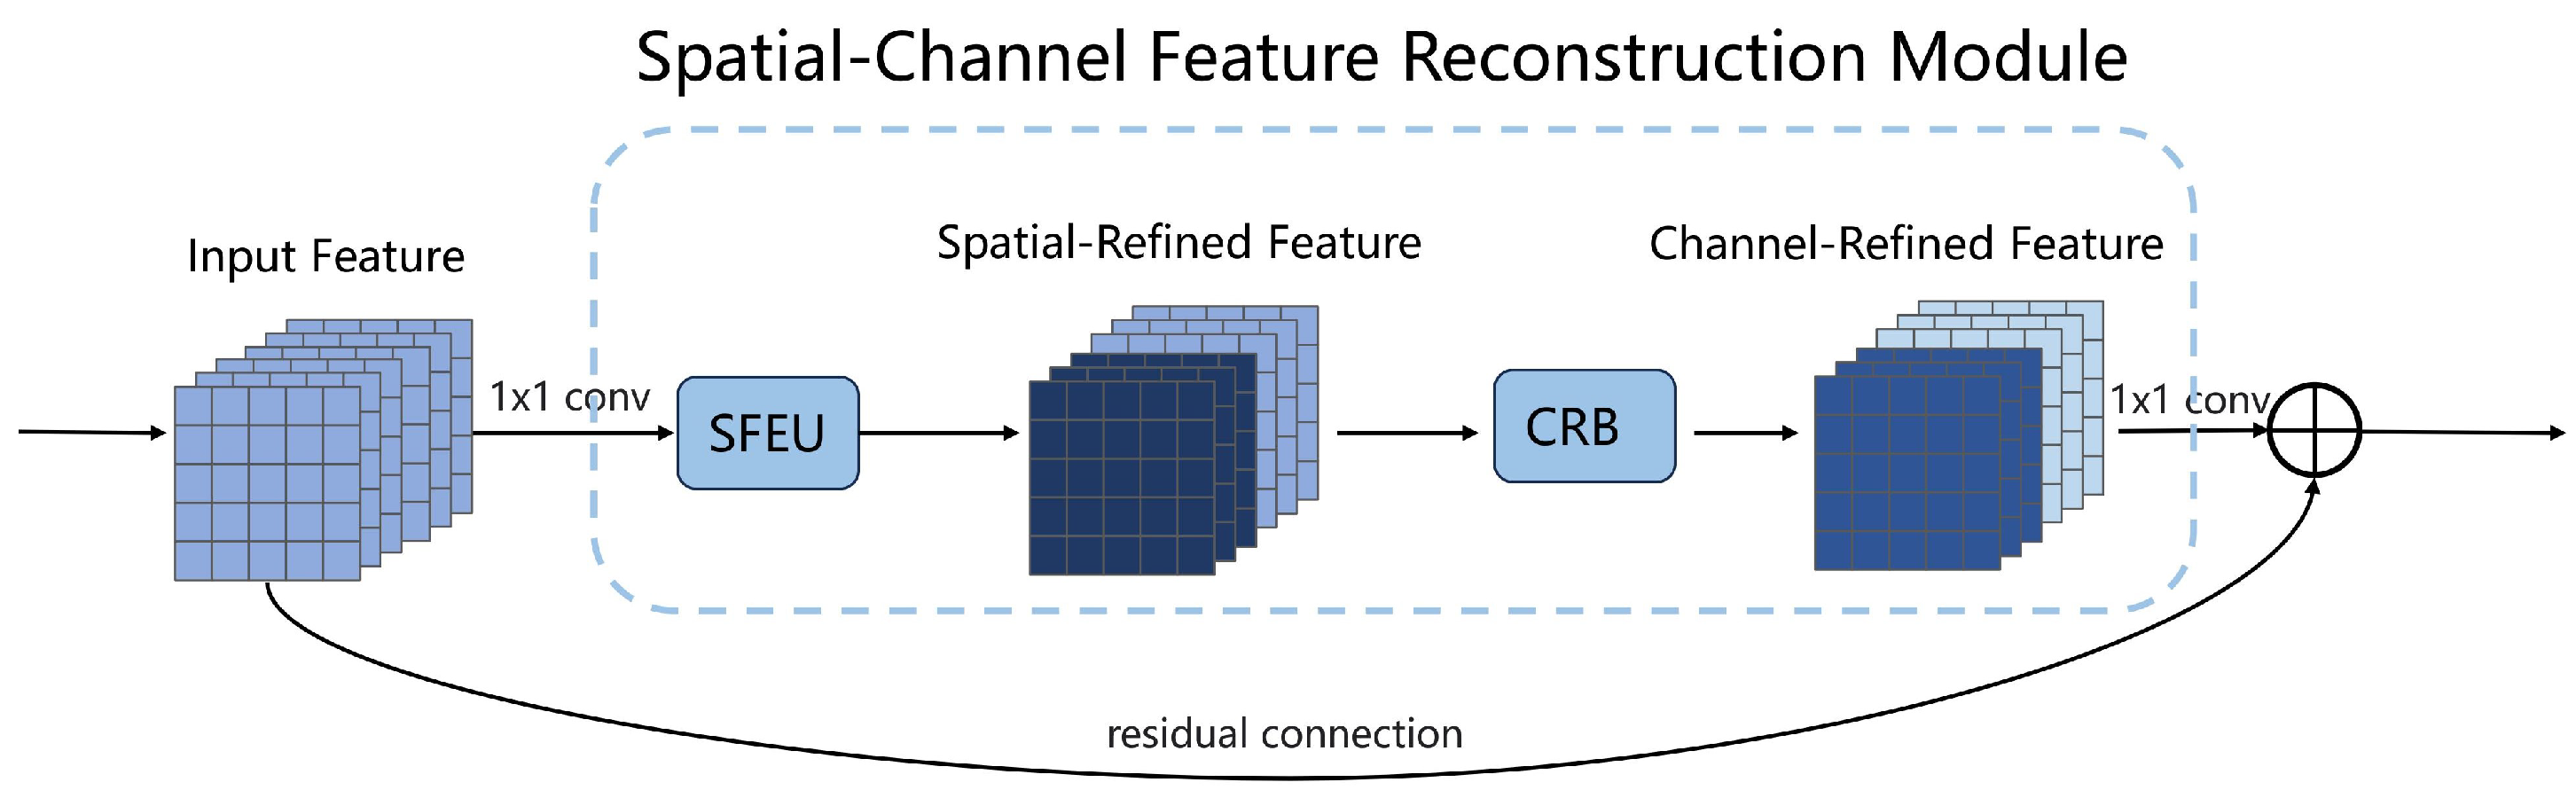
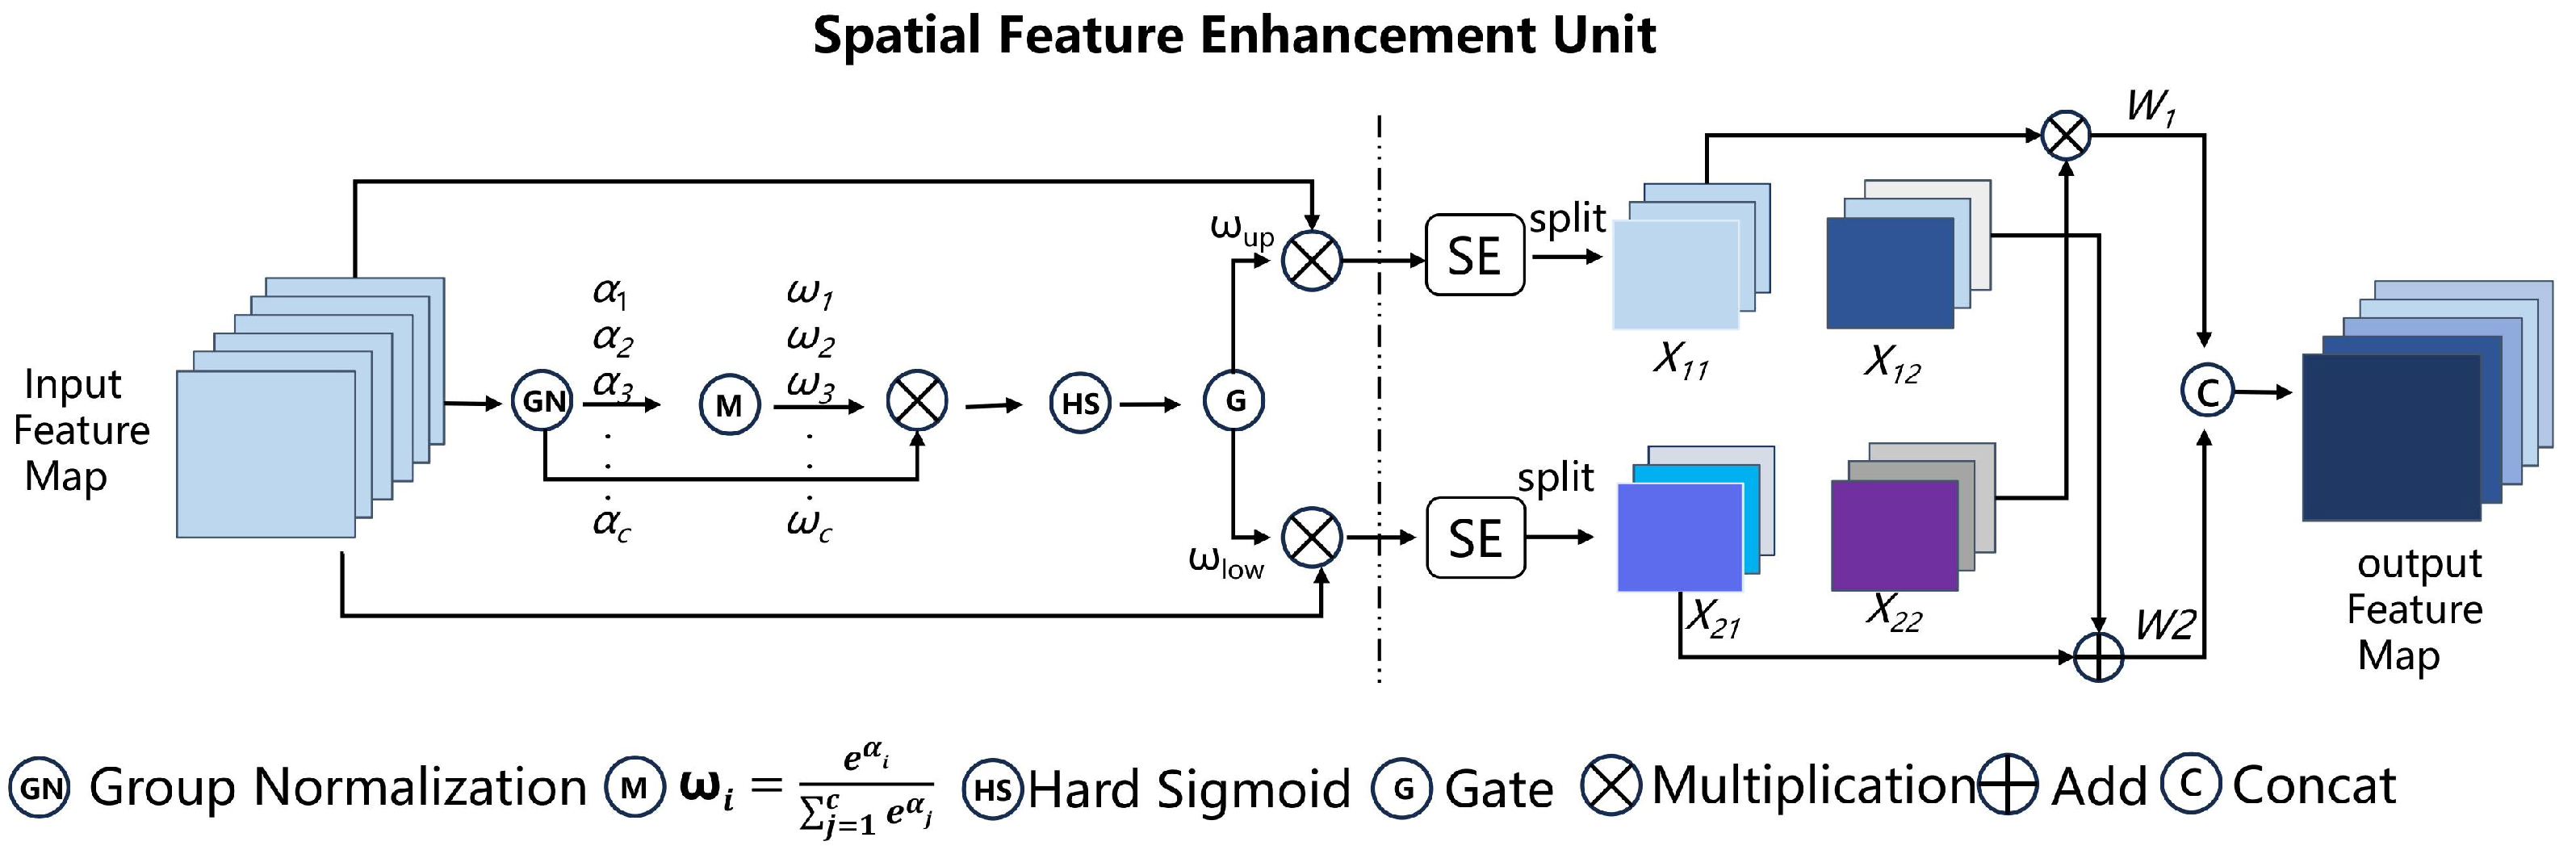
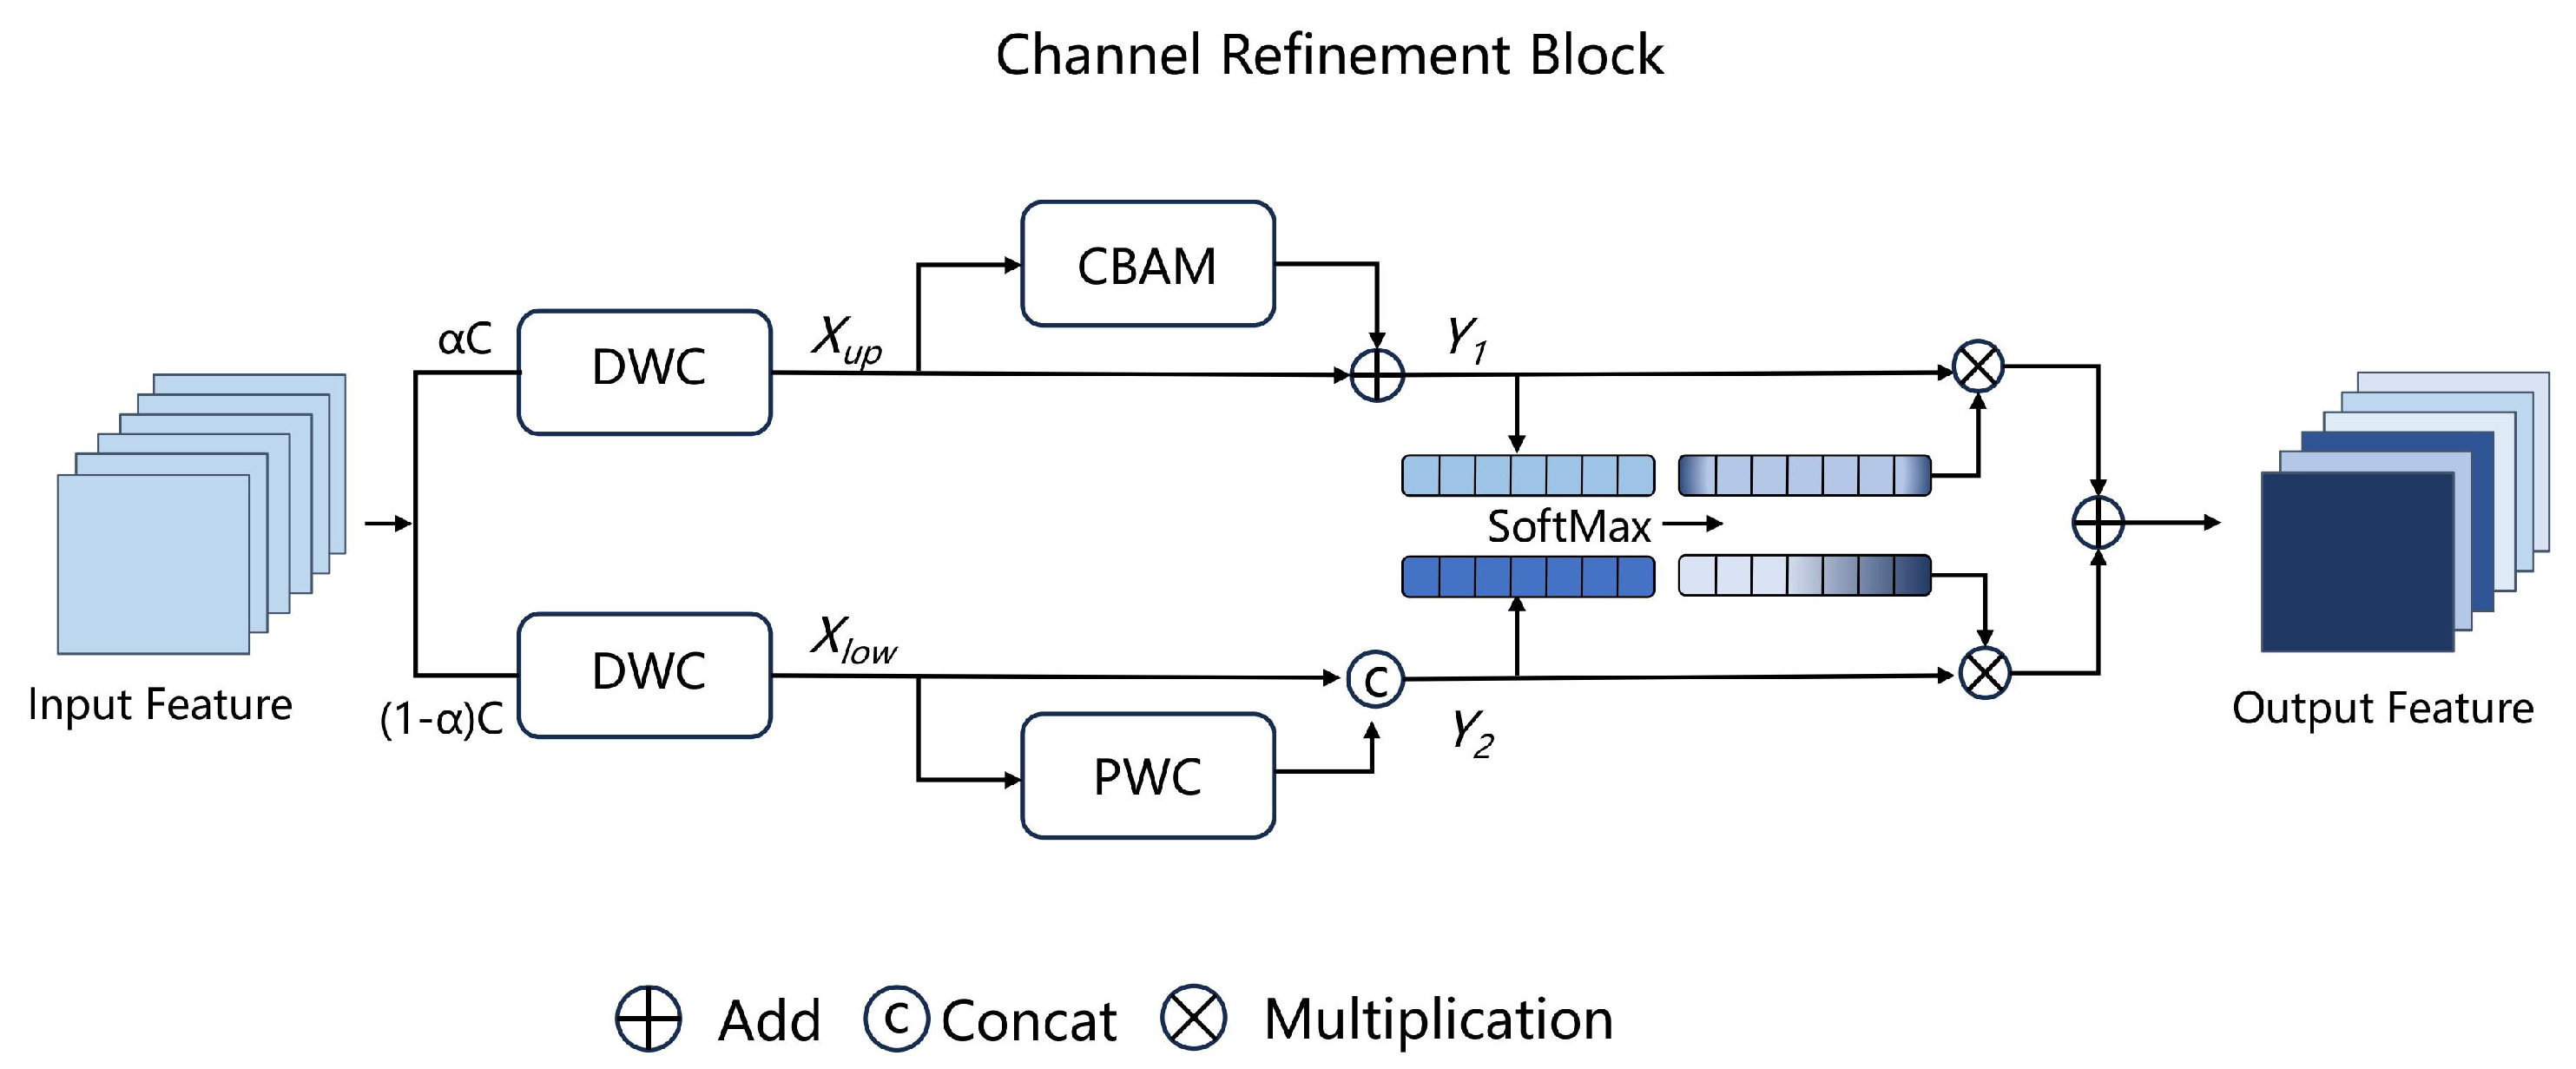
  • We design a compact and effective module that simultaneously suppresses spatial and channel redundancy using a combination of split–reconstruction and separation–fusion strategies, significantly reducing computational cost while enhancing feature representation.
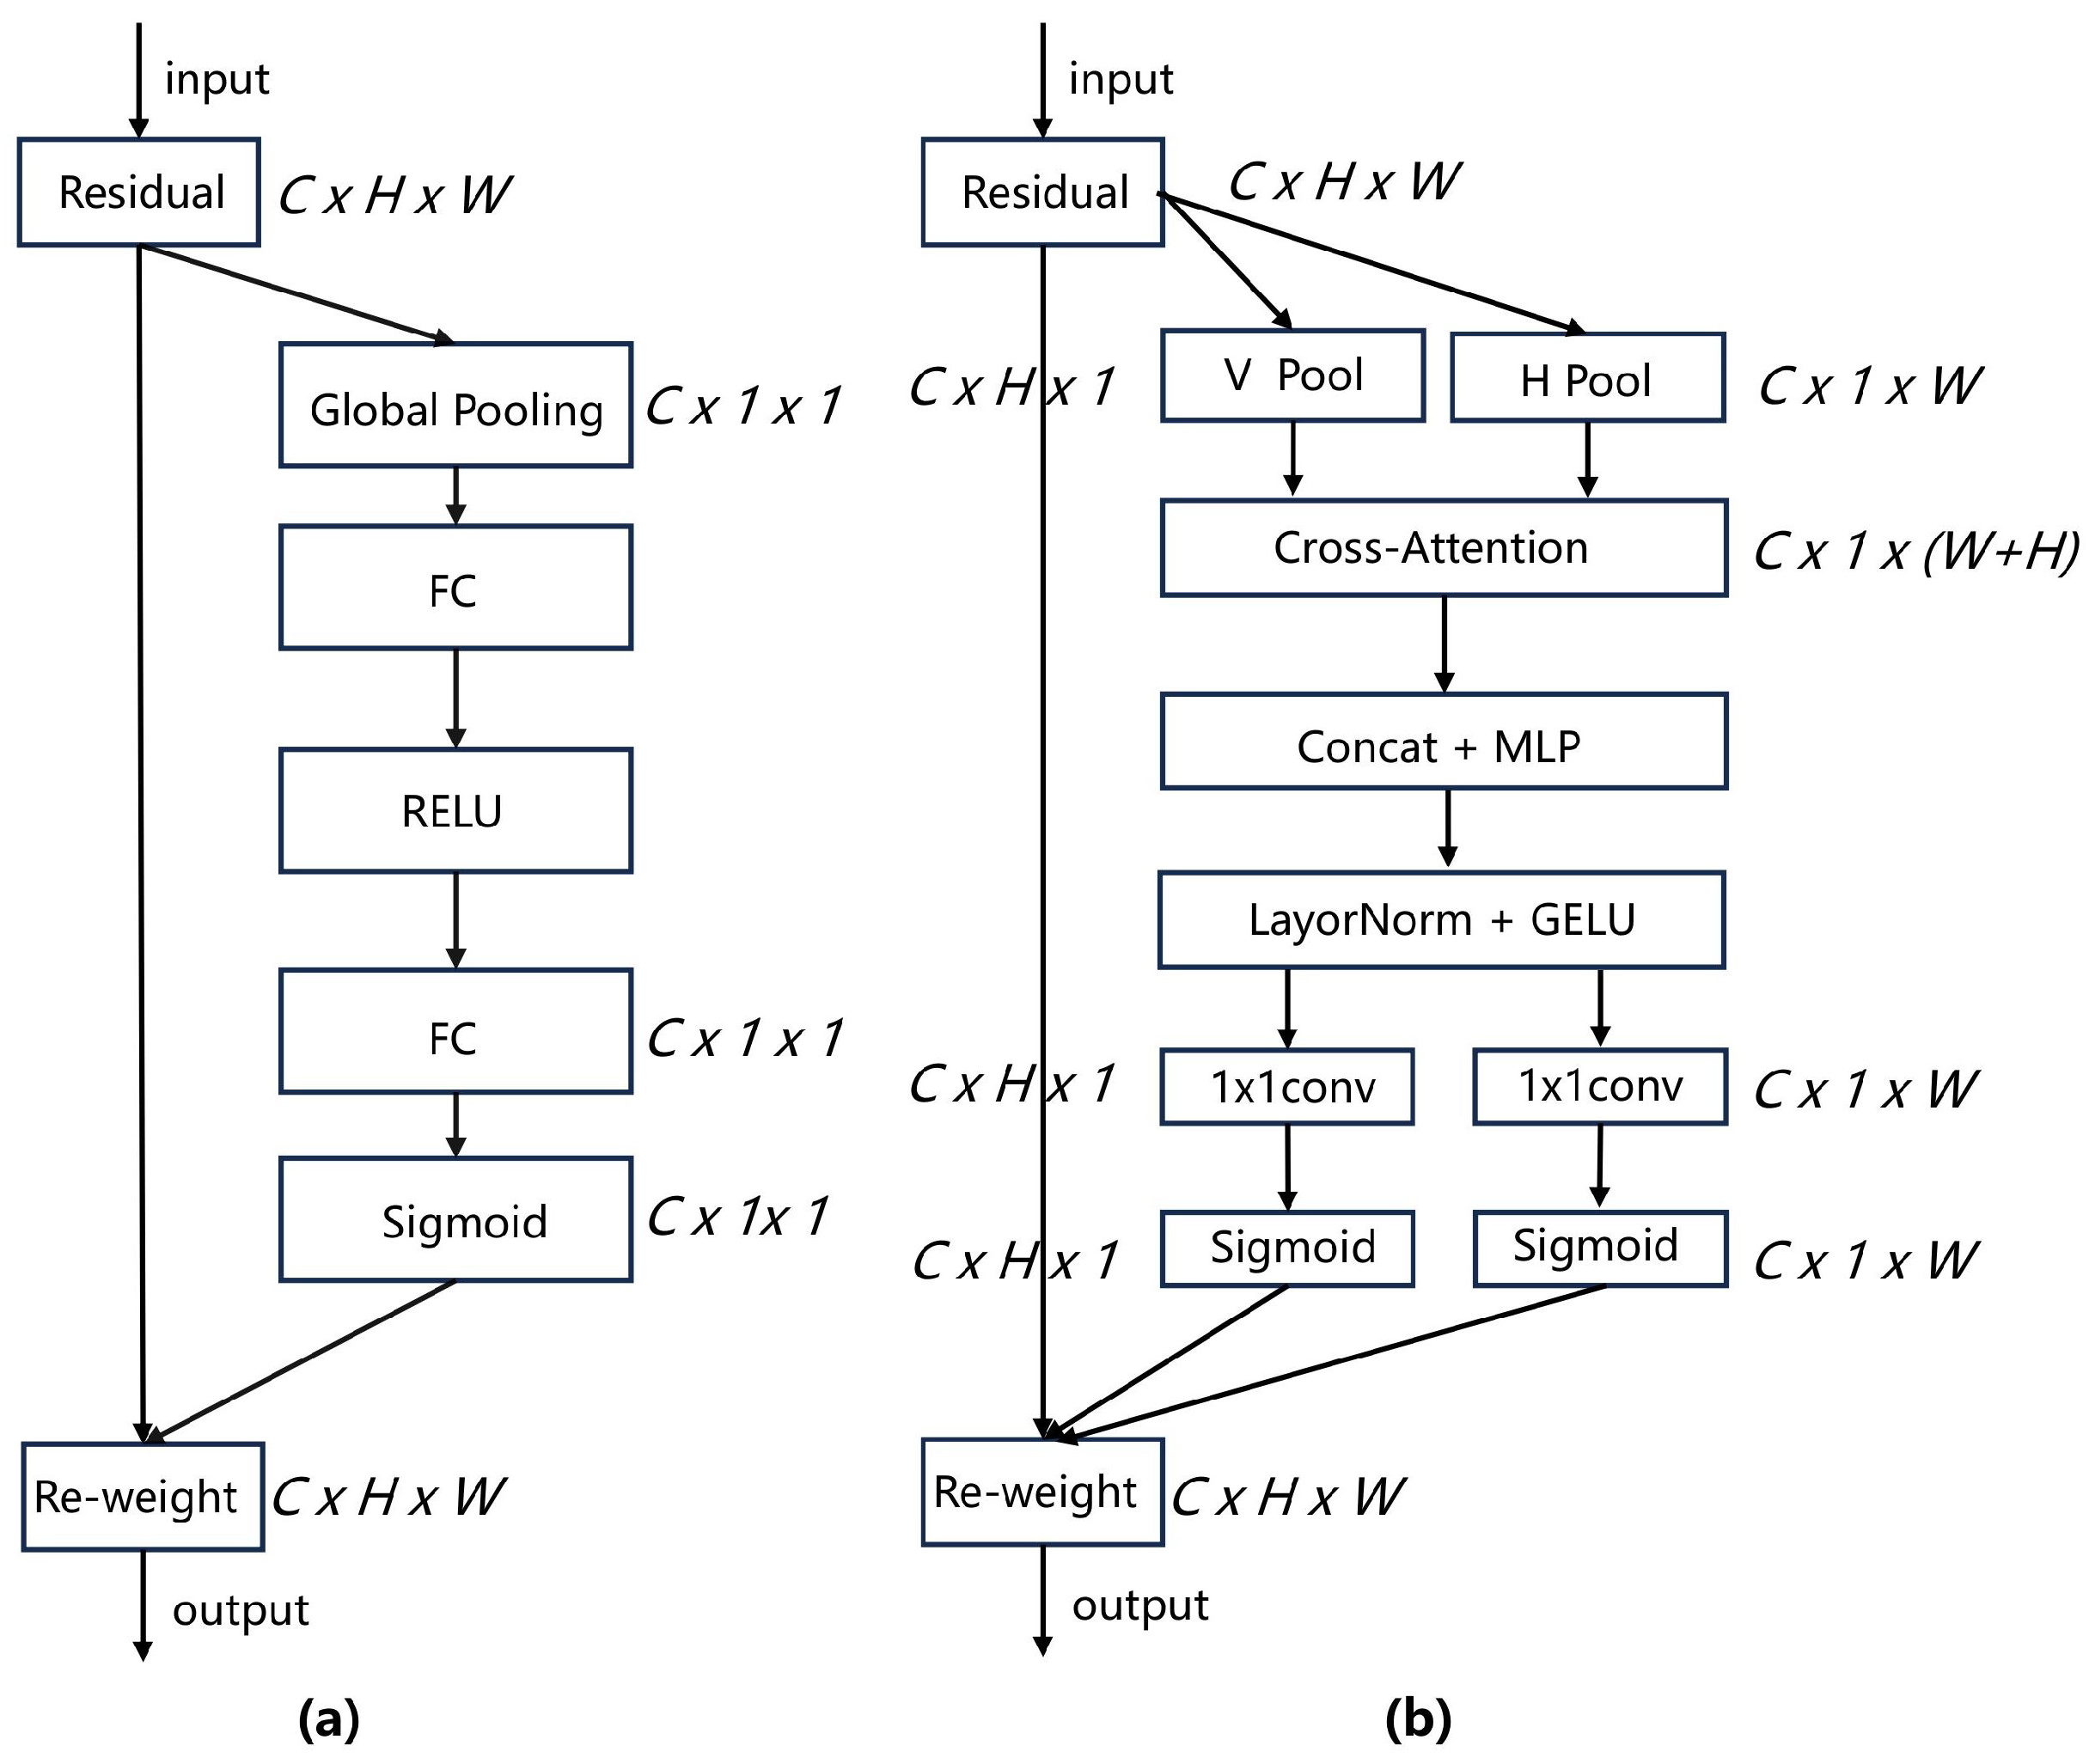
  • We propose a dual-directional attention mechanism that decomposes global pooling into two 1D feature encodings, enabling the model to capture long-range dependencies and retain positional accuracy simultaneously.
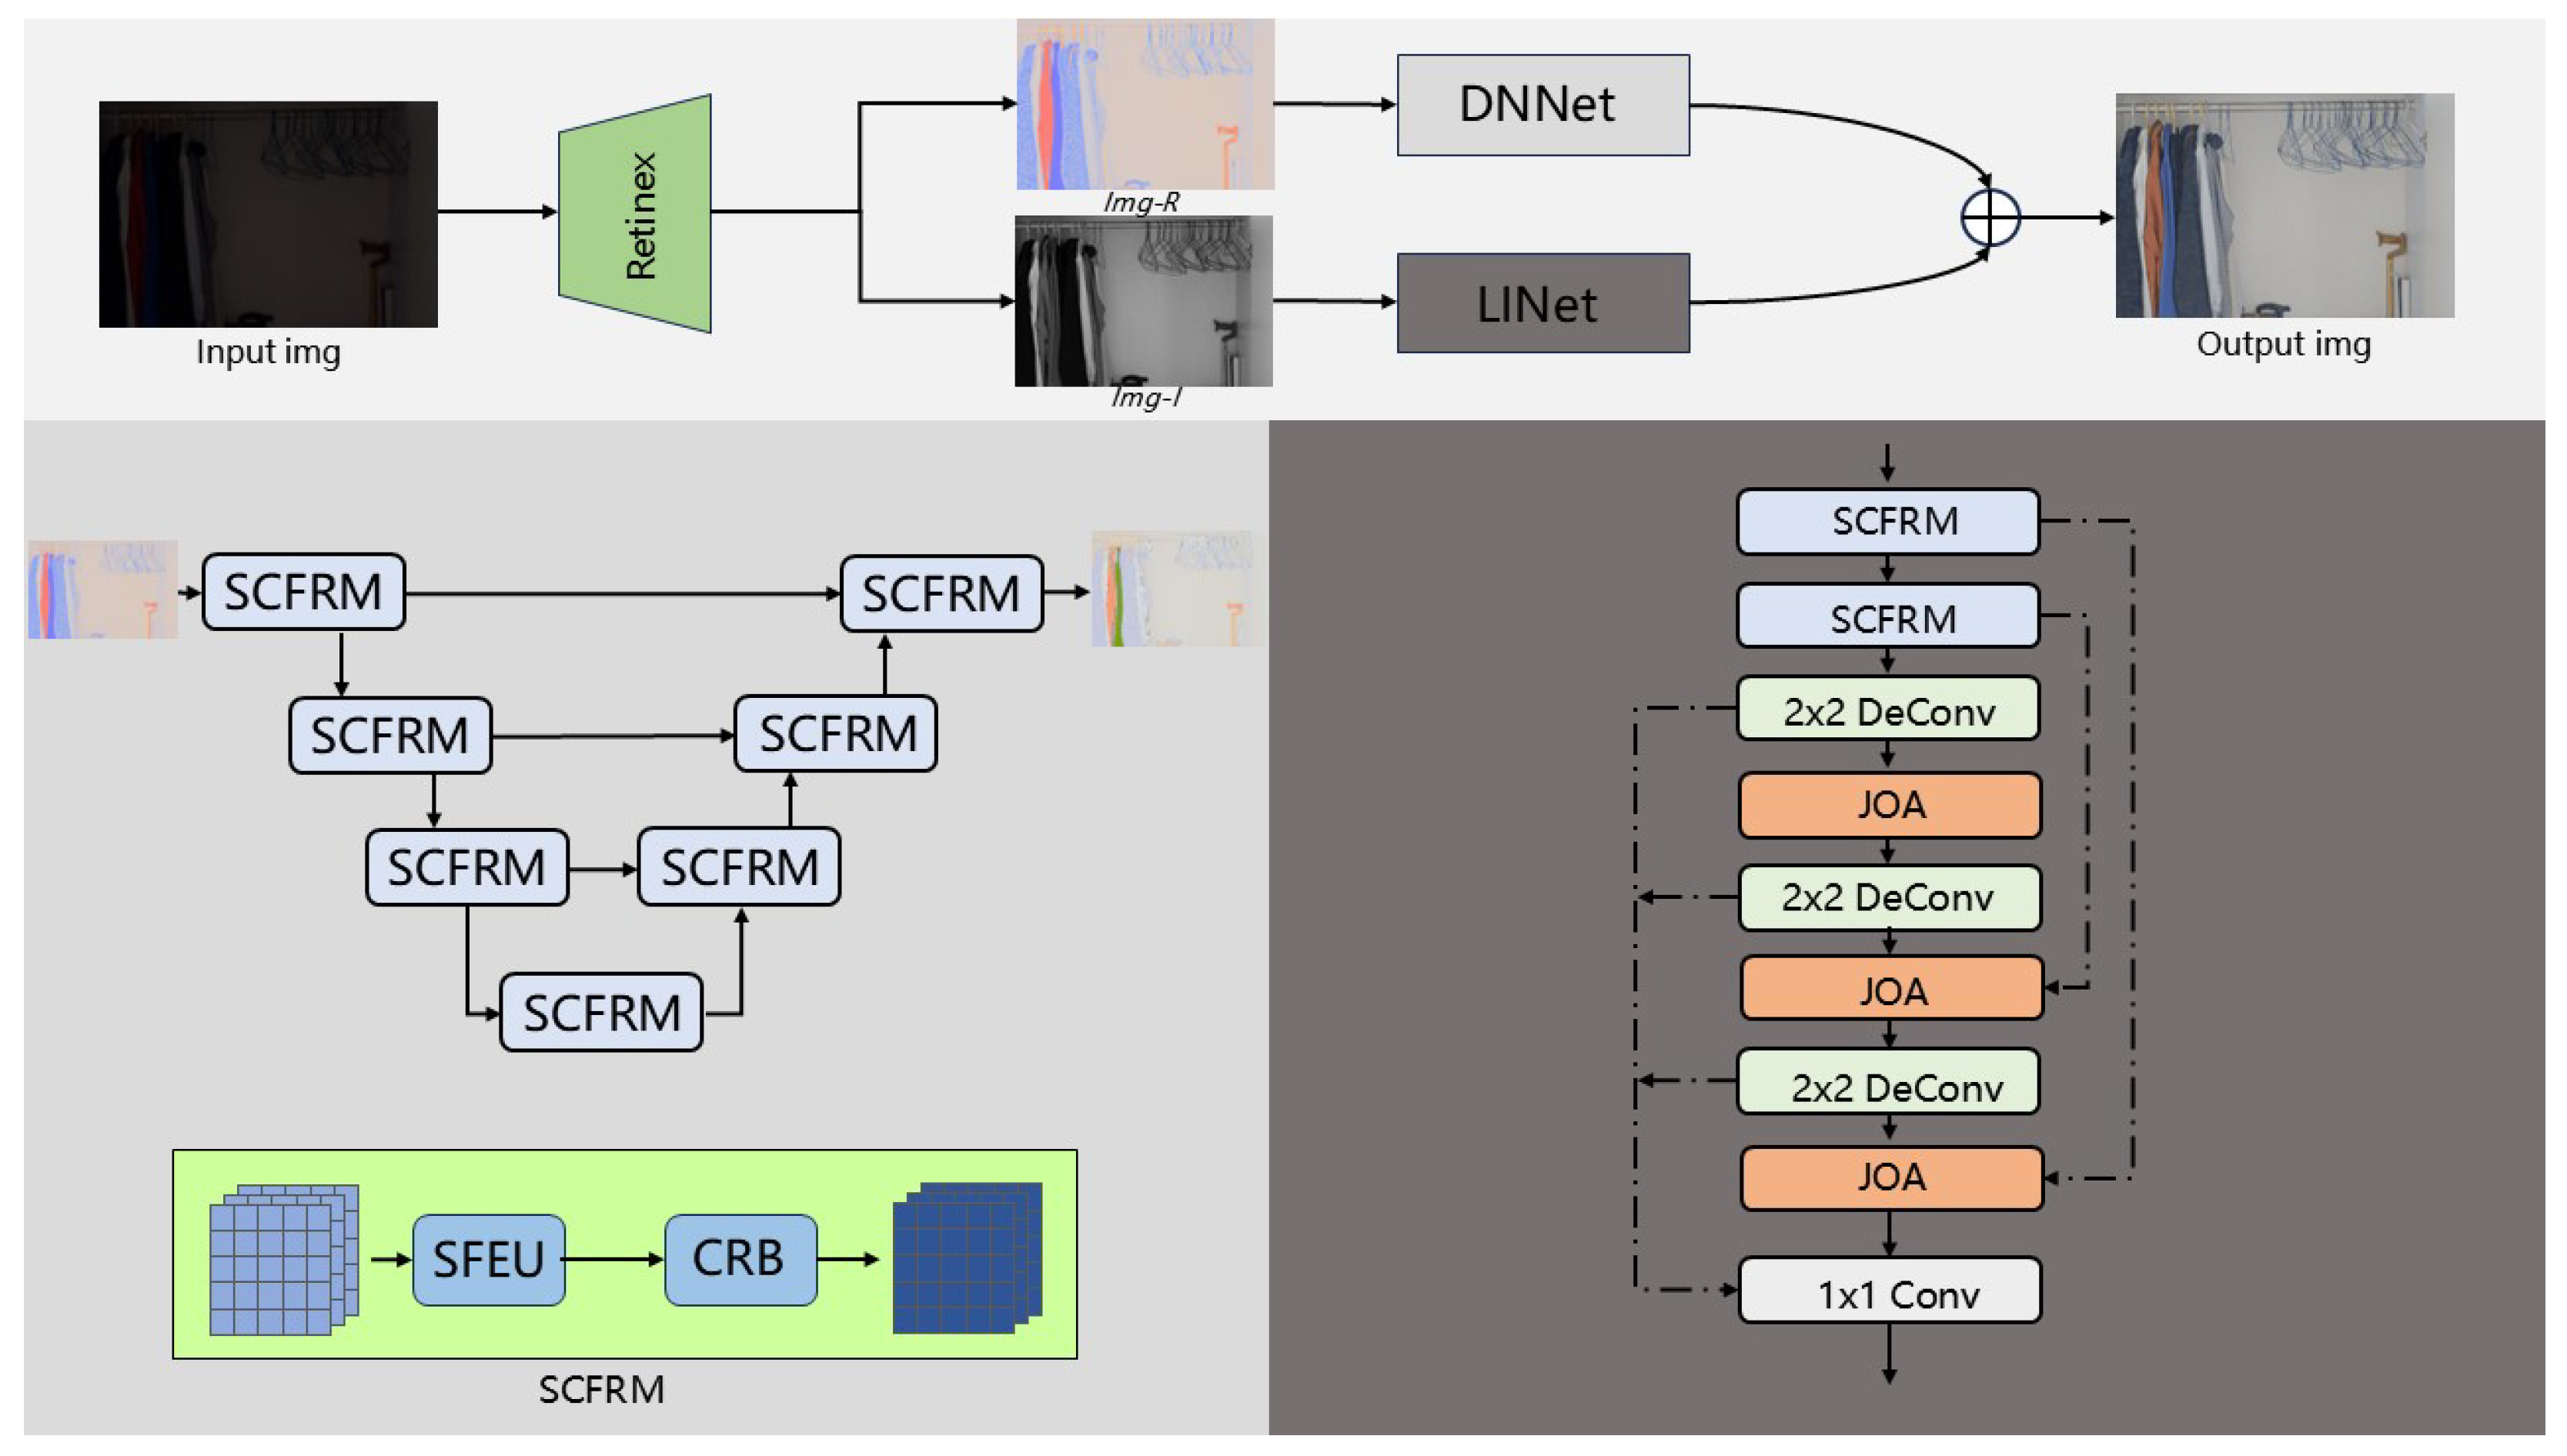
  • We construct a dual-branch network that separately enhances reflectance and illumination components using DNNet and LINet. SCFRM and JOA are strategically integrated to boost denoising performance and illumination adjustment, respectively.
  • Our method achieves advanced or competitive performance compared to state-of-the-art approaches.
The remainder of this paper is structured as follows: Section 2 reviews related work, Section 3 provides a detailed description of our proposed model, Section 4 presents the experiments and discussion, and Section 5 offers concluding remarks.

2. Related Work

2.1. Deep Learning-Based Low-Light Image Enhancement

Traditional low-light image enhancement algorithms, such as histogram equalization, gamma correction, and tone mapping [10], have demonstrated moderate success in improving image quality but still possess certain limitations. For instance, these methods tend to amplify noise in darker regions and may compromise detail and texture information when enhancing brightness and contrast. In the era of big data, deep learning has become the mainstream technique for low-light image enhancement due to its powerful generalization capabilities. LLNet [11] was the first deep learning-based LLIE neural network, pioneering the use of end-to-end frameworks for low-light enhancement tasks. This approach improves brightness and reduces noise by stacking sparse denoising autoencoders. However, although it enhances image brightness, the resulting images frequently exhibit artifacts. Furthermore, LLNet’s training dataset was created by artificially simulating low-light conditions, thus limiting its representativeness for real-world scenarios. RetinexNet [12] comprises DecomNet and EnhanceNet, modules responsible for image decomposition and enhancement, respectively, and integrates the BM3D denoising method. It also introduced the LOL dataset, containing paired images captured in extremely dark environments. The dataset was constructed by varying camera parameters such as ISO and exposure time. Kind [13] also utilizes multiple networks for image decomposition and optimization, employing the mean squared error (MSE) loss function to guide the learning process. However, it suffers from issues of overexposure during enhancement. Kind++ [14] extends the original Kind framework by incorporating a multi-scale illumination attention mechanism and a data alignment strategy, thereby achieving higher visual quality in enhanced low-light images. RAUNA [15] employs a self-supervised fine-tuning strategy, enabling the network to automatically identify optimal hyperparameters. It also captures global and local brightness information to improve image brightness. Despite these improvements, RAUNA introduces artifacts in enhanced images. LYTNet is a lightweight network containing only 45K parameters. It adopts a dual-path structure to separately handle chrominance and luminance and employs multi-head self-attention mechanisms in both paths to effectively extract features. LightenNet [16] utilizes a four-layer convolutional neural network to predict the Retinex illumination map; however, it performs inadequately on low-quality images. RDGAN [17] combines Retinex decomposition with fusion-based enhancement strategies but may unintentionally amplify noise and JPEG artifacts. EnlightenGAN [18] achieves robust generalization through unsupervised learning, effectively enhancing dark regions while preserving detailed textures across diverse real-world scenarios.

2.2. Attention Mechanisms

Humans naturally and efficiently identify regions of interest within complex visual scenes. Inspired by this capability, attention mechanisms have been introduced into computer vision, simulating human visual attention to extract meaningful feature maps for neural network tasks [19]. By leveraging attention mechanisms, neural networks dynamically adjust their parameters according to the input image’s features, enhancing adaptability and accuracy across various applications. Currently, the most widely adopted attention mechanism in edge computing is the Squeeze-and-Excitation (SE) attention module [20]. SE is highly efficient, introducing only a minimal number of additional parameters and computational overhead. It effectively captures the importance of different channels, thereby enhancing critical feature representations. However, SE attention considers only inter-channel relationships, neglecting spatial information. Consequently, it cannot capture positional relationships between local spatial features within an image. To address this limitation, the Convolutional Block Attention Module (CBAM) [21] was developed. CBAM simultaneously incorporates both channel and spatial information to automatically select more relevant features. Nevertheless, its spatial attention mechanism relies solely on a simple 1 × 1 convolution, which may be insufficient for modeling complex spatial dependencies. Additionally, Self-Attention [22], the core component of Transformer models, has been widely adopted due to its powerful contextual modeling capabilities, though its significant computational cost limits its suitability for lightweight applications. SkNet [23], another notable method, enhances feature extraction by adaptively selecting convolutional kernels of varying receptive fields, analogous to how the human visual system selectively processes information at multiple scales. In this paper, we propose a Joint Attention that reduces dimensionality along both horizontal and vertical directions while preserving essential positional information. The resulting feature maps are multiplied together, reinforcing the representation of regions of interest and simultaneously capturing spatial and channel features. By utilizing positional information, the JOA enables LINet to effectively enhance specific areas requiring improvement, thus significantly elevating the overall quality of low-light image enhancement.

3. Materials and Methods

In this section, we first present a detailed overview of the overall architecture of our proposed RURL, as illustrated in Figure 1. Next, we elaborate on the sub-networks: DNNet, which incorporates the Spatial-Channel Feature Reconstruction Module, and LINet, which utilizes the Joint Attention. Finally, we describe the loss function employed for training the network.

3.1. Overall Architecture

Our proposed model leverages Retinex theory to achieve image decomposition, separating the input image into reflectance and illumination components. These components are processed independently by DNNet and LINet, respectively, and then fused to produce the final enhanced image. For the decomposition step, we employ Gaussian filtering, as manual parameter adjustment enables a fast and stable decomposition process. The mathematical formulation of image decomposition is as follows:
S = I R
where S denotes the input image, I the decomposed illumination component, and R the decomposed reflectance component. The symbol ⊗ represents element-wise multiplication.
To estimate the illumination component I, we apply Gaussian filtering directly to the input image S, yielding a smooth version that approximates the illumination:
I = G σ ( S )
where G σ ( · ) denotes Gaussian filtering with standard deviation. The reflectance component R is then computed:
R = S I + ϵ
where ϵ = 10 3 prevents division-by-zero in low-illumination regions. This filtering-based decomposition is widely adopted in Retinex-inspired methods due to its efficiency and the practical observation that illumination tends to vary slowly across space, whereas reflectance encodes sharp edges and textures. Ma et al. [24] proposed an improved Multi-Scale Retinex with Color Restoration (MSRCR) algorithm, which further validated the feasibility of using Gaussian filtering to estimate the illumination component. In their method, multi-scale Gaussian filters were first applied to remote sensing images to obtain rough illumination estimates, followed by guided filtering for refinement. Although their approach includes additional refinement steps, the initial use of Gaussian filtering for illumination extraction demonstrated both effectiveness and practicality in real-world image enhancement tasks. Following this strategy, we also employ multi-scale Gaussian filtering to decompose the input image into illumination and reflectance components. The decomposed results are subsequently processed by DNet and LLNet for denoising and illumination enhancement, respectively.

3.2. DNNet

Inspired by UNet [25], we adopt a commonly used U-shaped network as our backbone architecture to simultaneously capture global context and local details. Specifically, our network follows a typical multi-scale encoder–decoder structure, as illustrated in Figure 2. Prior to the UNet-like structure, we apply two dilated convolutions [26] to enlarge the receptive field, facilitating the extraction of richer feature information. For downsampling, we employ strided convolutions with a 2 × 2 kernel, which slightly increases the number of parameters but improves model performance. Conversely, for upsampling, we use transposed convolutions with a 2 × 2 kernel, optimizing the generation of high-quality upsampled features while preserving critical spatial details. This approach helps suppress noise and enhance contrast in low-light images.
Our proposed CFRM is integrated before and after each convolutional layer, with additional connections established between specific SCFRMs to alleviate the gradient vanishing problem and maintain high-resolution feature representations. SCFRM effectively reduces both spatial and channel redundancy, thereby enhancing the efficiency of the denoising network. The proposed SCFRM enhances feature representation by explicitly reducing spatial and channel redundancies through a two-stage design. Specifically, the Spatial Feature Enhancement Unit (SFEU) exploits the variations of pixel distributions quantified by group normalization to distinguish between rich and less informative regions. By splitting and cross-reconstructing the feature maps, SFEU enables effective spatial feature compression while preserving essential structural information. Furthermore, the Channel Reduction Block (CRB) compresses channel-wise redundancy by adaptively dividing feature maps into two complementary subsets and applying specialized operations for high- and low-level semantics. The use of attention mechanisms and global pooling allows CRB to adaptively emphasize informative channels while suppressing less important ones, thereby enhancing feature compactness without sacrificing representation power. Together, SFEU and CRB jointly optimize spatial and channel efficiency, enabling SCFRM to achieve effective denoising with lower computational overhead. It comprises the Spatial Feature Enhancement Unit and the Channel Reduction Block, as shown in the dashed box in Figure 3. Given the input features, SFEU first generates spatially refined intermediate features, after which CRB further enhances these features spatially and temporally.
To explicitly address spatial redundancy, we introduce SFEU, as depicted in Figure 4.
This unit employs splitting and reconstruction operations. The splitting operation separates feature maps containing rich information from those with relatively less information. We utilize Group Normalization (GN) [27] to quantify the amount of information in different feature maps. The eq is as follows:
α i = G N ( x i ) = γ x i μ g σ g 2 + ϵ + β
where x i is the input feature, μ g is the mean of the gth group, and σ g is the variance of the gth group. The parameters γ and β are learnable scaling and translation factors, respectively. The term ϵ is a small positive constant (typically 10 5 ) used to prevent division by zero.
Richer spatial information leads to greater variations in spatial pixels, resulting in larger α values. The normalized correlation weight ω c R C × W is computed using Equation (5), which reflects the importance of different feature maps.
ω i = e α i j = 1 C e α j , i , j = 1 , 2 , , C
The reweighted feature map ω c is subsequently mapped into the range [0, 1] using the Hard Sigmoid [28] function and passed through a gate. Feature map values exceeding a predefined threshold (set to 0.5 in our experiments) are denoted as ω u p , whereas those below this threshold are denoted as ω l o w . The entire split process can be expressed as Equation (6):
W = G a t e H a r d S i g m o i d ω G N ( X )
where X represents the input feature map, and W denotes ω u p and ω l o w .
For the reconstruction operation, we do not simply concatenate multiple feature maps or directly apply element-wise addition. Instead, we introduce a cross-reconstruction strategy to comprehensively integrate diverse information. Specifically, the two separated feature maps are first individually processed by the SE module, after which each is further divided into sub-feature maps X 11 , X 12 and X 21 , X 22 , respectively. Finally, spatially enhanced feature maps are obtained through reconstruction operations.
W 1 = X 11 X 22 , W 2 = X 12 X 21 , o u t = W 1 W 2
where ⊗ denotes element-wise multiplication, ⊕ denotes element-wise summation, and ∪ denotes concatenation.
SFEU can only reduce redundancy in the spatial dimension and cannot address redundancy in the feature map channels. To mitigate this limitation, we propose the CRB (Channel Reduction Block) after SFEU. By introducing separate processing pathways for rich and compressed feature maps, and by adaptively fusing them based on learned importance weights, CRB effectively alleviates information loss caused by aggressive compression. This mechanism ensures that the final fused features maintain both detailed spatial textures and critical semantic information, thus achieving a better trade-off between redundancy reduction and representation fidelity. The CRB employs separation and fusion operations.
Given an input feature map of size C × W × H, we first split the channels into two sub-feature maps based on a splitting ratio α (0 < α < 1). One sub-feature map contains α C channels, while the other contains ( 1 α ) C channels. Next, we apply depthwise separable convolution to each sub-feature map for compression, thereby balancing the computational cost of the CRB. After compression, the input feature map is separated into two parts: X u p and X l o w . We send X u p to the rich feature extraction stage, as shown in Figure 5. To extract high-level semantic information, we utilize the CBAM (Convolutional Block Attention Module), which slightly increases computational complexity. However, since global average pooling (GAP) [29] and global max pooling (GMP) may cause partial information loss, we add the original X u p to the CBAM output, forming the initially fused feature map Y 1 . For the X l o w feature map, we employ a 1 × 1 pointwise convolution (PWC) [30]. This approach is both computationally efficient and effective at enhancing channel mixing, resulting in a feature map containing low-level semantic information. To extract further features without additional computational overhead, we reuse the original X l o w and concatenate it with these newly generated features to form another initially fused feature map Y 2 . The formulation is as follows:
Y 1 = X u p C B A M ( X u p ) , Y 2 = X l o w P W C ( X l o w ) ,
We do not simply add or concatenate Y 1 and Y 2 directly. First, we apply global average pooling (Pooling) to aggregate the communication information. Next, we subject the global channel values S 1 and S 2 to a softmax operation, generating a feature importance vector. Finally, guided by this vector, we obtain the final fused features β 1 and β 2 . The processing procedure is as follows:
Y = β 1 Y 1 + β 2 Y 2
In short, SFEU further reduces the redundancy of spatially refined feature maps in the spatial dimension, while CRB addresses channel-level redundancy through low-cost operations and a feature reuse mechanism. By sequentially stacking SFEU and CRB, DNNet can effectively minimize redundant features and achieve strong noise reduction with minimal time overhead.

3.3. LINet

LINet is designed to enhance images by improving the contrast of the decomposed illumination map. The network leverages spatial information to enhance contrast. Its overall architecture resembles ResNet, facilitating information flow and promoting feature reuse through extensive residual connections. Details can be seen in Figure 6. Additionally, we employ a multi-scale fusion strategy, which concatenates the outputs of the deconvolution layers during the sampling process, thereby reducing feature information loss. Furthermore, we propose a JOA embedded within the network to precisely highlight image regions that require contrast enhancement. The difference between it and the SE structure is illustrated in Figure 7. In the following section, we provide a detailed introduction. Global pooling is commonly used for spatial encoding, but it often fails to preserve positional information, which is crucial for capturing spatial structures in computer vision. To address this limitation, we decompose the global pooling operation into two separate pooling operations along the horizontal and vertical directions. This approach effectively captures long-range dependencies while maintaining accurate positional information. The specific operation is as follows:
Z h = 1 W 0 i < W x ( h , i ) , Z w = 1 H 0 j < H x ( j , w ) ,
where x ( h , i ) denotes feature computation along the height dimension, while x ( j , w ) refers to feature computation along the width dimension.
Then, Cross-Attention [31] is applied to interact with positional information in both directions, enabling more precise feature selection and improved focus on the target regions. The fused W and H are concatenated and passed into MLP to enhance representational capacity. Next, the MLP [32] output, f, is split into f h and f w along the spatial dimension. Afterward, regularization is performed, followed by the GELU non-linear activation function. Two separate 1 × 1 convolutions then transform the activated features into tensors G h and G w , each retaining the same number of channels as the input feature. Finally, G h and G w are fused with the input tensor X to produce the final output. The specific operations are formulated as follows:
G h = σ ( L N ( f h ) ) , G w = σ ( L N ( f w ) ) , o u t = G h G w X ,
where the symbol σ represents GELU, and ⊗ denotes element-wise multiplication.

3.4. Loss Function

In the model proposed in this paper, we perform denoising and brightness enhancement separately for low-light images. Thus, the total loss function comprises two components: L o s s d n and L o s s r e . The first loss function measures the mean squared distance between the predicted image noise and the noise in the normal image. L o s s d n is defined as follows:
Loss d n = 1 2 m x M R ^ l o w R n o r 2
where M is the set of the test dataset, m is the number of elements in the set, and R ^ l o w and R n o r represent the predicted reflectance component and the reflectance component of the normal image, respectively. In the second loss function L o s s r e , we introduce the spatial consistency L s c and feature map smoothing L m s . L o s s r e is defined as follows:
L s c = x , y I out ( x , y ) I in ( x , y ) , L m s = 1 N c ε n = 1 N x I ( c , n ) + y I ( c , n ) , L o s s r e = γ 1 L s c + γ 2 L m s
where N represents the number of pixels in a single channel, and x and y denote the gradients in the horizontal and vertical directions, respectively. I represents the pixel coordinates, and ϵ represents the number of channels in the feature map. γ 1 and γ 2 are set to 1500 and 5, respectively. The combined loss function used for model training is defined as follows:
L o s s = α L o s s d n + β L o s s r e
Parameters α and β are hyperparameters representing weights that need to be systematically adjusted during model training.

4. Experimental Results

4.1. Implementation Details

We trained the model using the PyTorch 2.1 framework on an NVIDIA V100 GPU. The LOL [12] dataset was used for training and testing, and we further conducted a cross-dataset evaluation on the VE-LOL [33] dataset. The dataset comprises 485 sets of training images and 15 sets of test images, each containing a low-light image paired with a corresponding normal-exposure reference image. VE-LOL employs a camera imaging model to apply exposure compensation to the original LOL dataset, generating more realistic high-quality normal-light reference images. We trained the model for 50 epochs, utilizing the Adam [34] optimizer with an initial learning rate of 0.01. A learning rate decay strategy was implemented, gradually reducing the learning rate to 0.00001 over the course of training. All training and validation images were resized to 640 × 480 pixels.
We compare our model against URetinex [25], Zero-DCE [35], KinD, RetinexNet, EnlightenGAN, DCC-Net [36], DeepUPE [37], LLFlow [38], and MBLLEN [39], using PSNR and SSIM as evaluation metrics. Higher PSNR and SSIM values indicate superior image enhancement performance.

4.2. Ablation Studies

To evaluate the effectiveness of the proposed SCFRM module, we conducted experiments on the low-light image enhancement task by replacing the commonly used 3 × 3 convolution kernel with our SCFRM design. All models were trained from scratch using default training strategies on an NVIDIA V100 GPU, and each experiment was repeated under identical settings. To minimize the impact of result variability, we report the median performance.
The SCFRM module comprises two components: the Spatial Feature Enhancement Unit (SFEU) and the Channel Refinement Block (CRB). To assess the individual contributions of each component, we first applied SFEU and CRB separately to LLNet. As shown in Table 1, incorporating only the SFEU (LLNet + S) improves PSNR by approximately 1%, with negligible increase in FLOPs. In contrast, integrating only the CRB (LLNet + C) leads to a slight decrease in PSNR but yields a significant reduction—around 20%—in both the number of parameters and FLOPs. Additionally, the inference time per image on GPU decreases to 0.008 s, demonstrating the CRB’s efficiency advantages. These results indicate that even a single module can substantially enhance overall model performance. Furthermore, we evaluated three different configurations combining SFEU and CRB: a sequential structure with SFEU followed by CRB (S+C), a sequential structure with CRB followed by SFEU (C+S), and a parallel structure (C&S). Experimental results show that the S+C configuration achieves the highest PSNR. Therefore, we adopt the S+C combination to construct SCFRM for further performance enhancement.
To investigate the impact of varying the ratio parameter α in the CRB module, we adjusted α from 1/10 to 9/10 and evaluated the resulting PSNR and FLOPs performance on the LOL dataset. As illustrated in Figure 8, the network’s low-light enhancement capability improves consistently with increasing α . A higher α enables the extraction of richer feature representations during the CRB’s channel-splitting stage. Notably, when α is set to 1/2, the network achieves an optimal trade-off between PSNR and computational complexity (FLOPs). Consequently, all subsequent experiments adopt α = 1/2 as the optimal configuration to balance enhancement performance and efficiency.

4.3. Quantitative Comparison

Table 2 presents a comparison of our method against other approaches on the LOL dataset. Evidently, our method outperforms competing methods. Specifically, our method achieves the highest PSNR value, reaching 24.93 dB—an improvement of 0.82 dB over the second-best method. Meanwhile, it ranks second in SSIM, demonstrating robust image enhancement capabilities.
We evaluated the generalization capability of our model on the VE-LOL dataset, with results presented in Table 3. These findings confirm that our method exhibits robust generalization performance in real-world settings.
We conducted comparative experiments on the See-in-the-Dark (SID) [40] and Extreme Low-light Denoising (ELD) [41] low-light image enhancement datasets using the NIQE and PI metrics, with the results shown in Table 4. The SID dataset comprises 509 pairs of low-light and normally exposed images, where the low-light images were captured under extremely low-illumination conditions (i.e., high ISO and short exposure time). In contrast, the ELD dataset was collected in real-world, extremely low-light environments, and the images exhibit significant degradation due to severe underexposure, noise, and color distortion. Lower NIQE scores indicate a closer alignment with natural image statistics, while lower PI scores reflect better overall perceptual quality.
On the SID dataset, our method achieved the best PI score (2.78) and the second-best NIQE score (4.57), slightly behind KinD (4.18). On the more challenging ELD dataset, our model attained either the best or second-best performance across both metrics (NIQE = 2.46, PI = 2.03). These results demonstrate that our approach not only significantly enhances image quality but also preserves a natural visual appearance, indicating strong generalization capabilities.

4.4. Qualitative Comparison

In Figure 9, we present the results of applying different enhancement methods to the same image from the LOL dataset. Overall, our method achieves brightness, contrast, and color accuracy closer to the ground truth. MBLLEN and Zero-DCE suffer from insufficient brightness enhancement, resulting in deviations from the normal image, and the MBLLEN-enhanced image still contains noticeable noise. KinD, LLFlow, and URetinex produce outputs with a whiter tone, failing to accurately reflect the real scene due to insufficient contrast. EnlightenGAN provides effective brightness enhancement but struggles to suppress noise. Although the results of DCC-Net are somewhat similar to ours, our method yields colors closer to the normal image and preserves the texture and details of the stacked books, thus avoiding undesirable over-smoothing effects.
Furthermore, Figure 10 shows the results of various enhancement methods on the VE-LOL dataset. MBLLEN, Zero-DCE, and URetinex continue to exhibit insufficient brightness, while LLFlow and URetinex reveal under-enhancement issues. Overall, our method offers superior enhancement quality in terms of visual perception.
These visual results confirm that our method successfully capitalizes on reducing spatiotemporal channel redundancy and integrating joint attention, thereby achieving superior image enhancement. Collectively, these findings demonstrate that our approach exhibits robust performance in low-light image enhancement.

5. Conclusions

In this paper, we develop a low-light image enhancement network based on Retinex theory. Specifically, we design a U-Net-like denoising network for the decomposed reflectance map. Within this network, we embed our proposed Spatial-Channel Feature Reconstruction Module, which reduces spatiotemporal feature redundancy, into both the downsampling and upsampling processes, while establishing appropriate residual connections. This approach effectively addresses local issues such as detail preservation and noise suppression. For the decomposed illumination map, we construct an ResNet-like enhancement network. At the final stage of this network, we integrate our Joint Attention, which leverages two-directional feature interactions to accurately capture positional information. JOA helps solve global image-related challenges, including color accuracy and brightness enhancement. We extensively validate the effectiveness and robustness of our method, and experimental results demonstrate its clear advantages over several state-of-the-art approaches.
Future research may focus on accelerating inference speed to meet the demands of edge computing and mobile devices, thus making the model more adaptable to diverse and complex lighting conditions (e.g., extreme darkness, backlighting, and urban night lighting). In addition, further improvements could enhance the model’s generalization capabilities and robustness in uncontrolled environments.

Author Contributions

Conceptualization, Z.X.; methodology, Z.X.; validation, Z.X.; formal analysis, Z.X., D.L., X.Q. and J.C.; investigation, Z.X.; resources, Z.X.; data curation, Z.X.; writing—original draft preparation, Z.X., D.L. and J.C.; writing—review and editing, Z.X., D.L., X.Q. and J.C.; visualization, Z.X.; supervision, Z.X. and J.C.; project administration, J.C. All authors have read and agreed to the published version of the manuscript.

Funding

This work was funded by the Guangxi Key R&D Plan Project (AB25069476; AB24010164; AB23026135).

Data Availability Statement

We use the public datasets LOL, VE-LOL, SID, and ELD.

Conflicts of Interest

The authors declare no conflicts of interest.

References

  1. Dhal, K.G.; Das, A.; Ray, S.; Gálvez, J.; Das, S. Histogram equalization variants as optimization problems: A review. Arch. Comput. Methods Eng. 2021, 28, 1471–1496. [Google Scholar] [CrossRef]
  2. Huang, S.C.; Cheng, F.C.; Chiu, Y.S. Efficient contrast enhancement using adaptive gamma correction with weighting distribution. IEEE Trans. Image Process. 2012, 22, 1032–1041. [Google Scholar] [CrossRef] [PubMed]
  3. Barbhuiya, A.A.; Karsh, R.K.; Jain, R. CNN based feature extraction and classification for sign language. Multimed. Tools Appl. 2021, 80, 3051–3069. [Google Scholar] [CrossRef]
  4. Li, J.; Wen, Y.; He, L. Scconv: Spatial and channel reconstruction convolution for feature redundancy. In Proceedings of the IEEE/CVF Conference on Computer Vision and Pattern Recognition, Vancouver, BC, Canada, 17–24 June 2023; pp. 6153–6162. [Google Scholar]
  5. Xu, W.; Fu, Y.L.; Zhu, D. ResNet and its application to medical image processing: Research progress and challenges. Comput. Methods Programs Biomed. 2023, 240, 107660. [Google Scholar] [CrossRef]
  6. Howard, A.G.; Zhu, M.; Chen, B.; Kalenichenko, D.; Wang, W.; Weyand, T.; Andreetto, M.; Adam, H. Mobilenets: Efficient convolutional neural networks for mobile vision applications. arXiv 2017, arXiv:1704.04861. [Google Scholar]
  7. Zhang, Q.; Jiang, Z.; Lu, Q.; Han, J.; Zeng, Z.; Gao, S.H.; Men, A. Split to be slim: An overlooked redundancy in vanilla convolution. arXiv 2020, arXiv:2006.12085. [Google Scholar]
  8. Niu, Z.; Zhong, G.; Yu, H. A review on the attention mechanism of deep learning. Neurocomputing 2021, 452, 48–62. [Google Scholar] [CrossRef]
  9. Wen, H.; Dai, F.; Wang, D. A survey of image dehazing algorithm based on retinex theory. In Proceedings of the 2020 5th International Conference on Intelligent Informatics and Biomedical Sciences (ICIIBMS), Okinawa, Japan, 18–20 November 2020; IEEE: Piscataway, NJ, USA, 2020; pp. 38–41. [Google Scholar]
  10. Debevec, P.; Gibson, S. A tone mapping algorithm for high contrast images. In Proceedings of the 13th Eurographics Workshop on Rendering, Pisa, Italy, 26–28 June 2002; Citeseer: San Diego, CA, USA, 2002; Volume 2, p. 21. [Google Scholar]
  11. Lore, K.G.; Akintayo, A.; Sarkar, S. LLNet: A deep autoencoder approach to natural low-light image enhancement. Pattern Recognit. 2017, 61, 650–662. [Google Scholar] [CrossRef]
  12. Wei, C.; Wang, W.; Yang, W.; Liu, J. Deep retinex decomposition for low-light enhancement. arXiv 2018, arXiv:1808.04560. [Google Scholar]
  13. Zhang, Y.; Zhang, J.; Guo, X. Kindling the darkness: A practical low-light image enhancer. In Proceedings of the 27th ACM International Conference on Multimedia, Nice, France, 21–25 October 2019; pp. 1632–1640. [Google Scholar]
  14. Zhang, Y.; Guo, X.; Ma, J.; Liu, W.; Zhang, J. Beyond brightening low-light images. Int. J. Comput. Vis. 2021, 129, 1013–1037. [Google Scholar] [CrossRef]
  15. Liu, X.; Xie, Q.; Zhao, Q.; Wang, H.; Meng, D. Low-light image enhancement by retinex-based algorithm unrolling and adjustment. IEEE Trans. Neural Netw. Learn. Syst. 2023, 35, 15758–15771. [Google Scholar] [CrossRef] [PubMed]
  16. Li, C.; Guo, J.; Porikli, F.; Pang, Y. LightenNet: A convolutional neural network for weakly illuminated image enhancement. Pattern Recognit. Lett. 2018, 104, 15–22. [Google Scholar] [CrossRef]
  17. Wang, J.; Tan, W.; Niu, X.; Yan, B. RDGAN: Retinex decomposition based adversarial learning for low-light enhancement. In Proceedings of the 2019 IEEE International Conference on Multimedia and Expo (ICME), Shanghai, China, 8–12 July 2019; IEEE: Piscataway, NJ, USA, 2019; pp. 1186–1191. [Google Scholar]
  18. Jiang, Y.; Gong, X.; Liu, D.; Cheng, Y.; Fang, C.; Shen, X.; Yang, J.; Zhou, P.; Wang, Z. Enlightengan: Deep light enhancement without paired supervision. IEEE Trans. Image Process. 2021, 30, 2340–2349. [Google Scholar] [CrossRef]
  19. Guo, M.H.; Xu, T.X.; Liu, J.J.; Liu, Z.N.; Jiang, P.T.; Mu, T.J.; Zhang, S.H.; Martin, R.R.; Cheng, M.M.; Hu, S.M. Attention mechanisms in computer vision: A survey. Comput. Vis. Media 2022, 8, 331–368. [Google Scholar] [CrossRef]
  20. Hu, J.; Shen, L.; Sun, G. Squeeze-and-excitation networks. In Proceedings of the IEEE Conference on Computer Vision and Pattern Recognition, Salt Lake City, UT, USA, 18–23 June 2018; pp. 7132–7141. [Google Scholar]
  21. Woo, S.; Park, J.; Lee, J.Y.; Kweon, I.S. Cbam: Convolutional block attention module. In Proceedings of the European conference on computer vision (ECCV), Munich, Germany, 8–14 September 2018; pp. 3–19. [Google Scholar]
  22. Rabe, M.N.; Staats, C. Self-attention does not need O(n2) memory. arXiv 2021, arXiv:2112.05682. [Google Scholar]
  23. Li, X.; Wang, W.; Hu, X.; Yang, J. Selective kernel networks. In Proceedings of the IEEE/CVF Conference on Computer Vision and Pattern Recognition, Long Beach, CA, USA, 15–20 June 2019; pp. 510–519. [Google Scholar]
  24. Ma, J.; Fan, X.; Ni, J.; Zhu, X.; Xiong, C. Multi-scale retinex with color restoration image enhancement based on Gaussian filtering and guided filtering. Int. J. Mod. Phys. B 2017, 31, 1744077. [Google Scholar] [CrossRef]
  25. Azad, R.; Aghdam, E.K.; Rauland, A.; Jia, Y.; Avval, A.H.; Bozorgpour, A.; Karimijafarbigloo, S.; Cohen, J.P.; Adeli, E.; Merhof, D. Medical image segmentation review: The success of u-net. IEEE Trans. Pattern Anal. Mach. Intell. 2024, 46, 100760010095. [Google Scholar] [CrossRef]
  26. Yu, F.; Koltun, V. Multi-scale context aggregation by dilated convolutions. arXiv 2015, arXiv:1511.07122. [Google Scholar]
  27. Wu, Y.; He, K. Group normalization. In Proceedings of the European Conference on Computer Vision (ECCV), Munich, Germany, 8–14 September 2018; pp. 3–19. [Google Scholar]
  28. Lee, J.J.; Kim, J.W. Successful removal of hard sigmoid fecaloma using endoscopic cola injection. Korean J. Gastroenterol. 2015, 66, 46–49. [Google Scholar] [CrossRef]
  29. Christlein, V.; Spranger, L.; Seuret, M.; Nicolaou, A.; Král, P.; Maier, A. Deep generalized max pooling. In Proceedings of the 2019 International Conference on Document Analysis and Recognition (ICDAR), Sydney, Australia, 20–25 September 2019; IEEE: Piscataway, NJ, USA, 2019; pp. 1090–1096. [Google Scholar]
  30. Hua, B.S.; Tran, M.K.; Yeung, S.K. Pointwise convolutional neural networks. In Proceedings of the IEEE Conference on Computer Vision and Pattern Recognition, Salt Lake City, UT, USA, 18–23 June 2018; pp. 984–993. [Google Scholar]
  31. Chen, C.F.R.; Fan, Q.; Panda, R. Crossvit: Cross-attention multi-scale vision transformer for image classification. In Proceedings of the IEEE/CVF International Conference on Computer Vision, Montreal, BC, Canada, 11–17 October 2021; pp. 357–366. [Google Scholar]
  32. Liu, R.; Li, Y.; Tao, L.; Liang, D.; Zheng, H.T. Are we ready for a new paradigm shift? A survey on visual deep mlp. Patterns 2022, 3, 100520. [Google Scholar] [CrossRef]
  33. Liu, J.; Xu, D.; Yang, W.; Fan, M.; Huang, H. Benchmarking low-light image enhancement and beyond. Int. J. Comput. Vis. 2021, 129, 1153–1184. [Google Scholar] [CrossRef]
  34. Reyad, M.; Sarhan, A.M.; Arafa, M. A modified Adam algorithm for deep neural network optimization. Neural Comput. Appl. 2023, 35, 17095–17112. [Google Scholar] [CrossRef]
  35. Guo, C.; Li, C.; Guo, J.; Loy, C.C.; Hou, J.; Kwong, S.; Cong, R. Zero-reference deep curve estimation for low-light image enhancement. In Proceedings of the IEEE/CVF Conference on Computer Vision and Pattern Recognition, Seattle, WA, USA, 13–19 June 2020; pp. 1780–1789. [Google Scholar]
  36. Zhang, Z.; Zheng, H.; Hong, R.; Xu, M.; Yan, S.; Wang, M. Deep color consistent network for low-light image enhancement. In Proceedings of the IEEE/CVF Conference on Computer Vision and Pattern Recognition, New Orleans, LA, USA, 18–24 June 2022; pp. 1899–1908. [Google Scholar]
  37. Wang, R.; Zhang, Q.; Fu, C.W.; Shen, X.; Zheng, W.S.; Jia, J. Underexposed photo enhancement using deep illumination estimation. In Proceedings of the IEEE/CVF Conference on Computer Vision and Pattern Recognition, Long Beach, CA, USA, 15–20 June 2019; pp. 6849–6857. [Google Scholar]
  38. Wang, Y.; Wan, R.; Yang, W.; Li, H.; Chau, L.P.; Kot, A. Low-light image enhancement with normalizing flow. In Proceedings of the AAAI Conference on Artificial Intelligence, Virtual, 22 February–1 March 2022; Volume 36, pp. 2604–2612. [Google Scholar]
  39. Lv, F.; Lu, F.; Wu, J.; Lim, C. MBLLEN: Low-light image/video enhancement using cnns. In Proceedings of the BMVC, Newcastle, UK, 3–6 September 2018; Volume 220, p. 4. [Google Scholar]
  40. Li, C.; Guo, C.; Han, L.; Jiang, J.; Cheng, M.M.; Gu, J.; Loy, C.C. Low-light image and video enhancement using deep learning: A survey. IEEE Trans. Pattern Anal. Mach. Intell. 2021, 44, 9396–9416. [Google Scholar] [CrossRef] [PubMed]
  41. Zhang, Y.; Qin, H.; Wang, X.; Li, H. Rethinking noise synthesis and modeling in raw denoising. In Proceedings of the IEEE/CVF International Conference on Computer Vision, Montreal, QC, Canada, 10–17 October 2021; pp. 4593–4601. [Google Scholar]
Figure 1. Our Retinex theory-based low-light image enhancement network framework. The top rectangular box represents the overall architecture of the network, while the light gray box on the left and the dark gray box on the right, respectively, illustrate the brief structures of the denoising network DNNet and the brightening network LINet.
Electronics 14 02212 g001
Figure 2. Structure diagram of DNNet, where SF is embedded and residual connections are established.
Electronics 14 02212 g002
Figure 3. The dashed box represents SCFRM, which is composed of SFEU and CRB connected sequentially.
Electronics 14 02212 g003
Figure 4. Diagram of Spatial Feature Enhancement Unit.
Electronics 14 02212 g004
Figure 5. Diagram of Channel Reduction Block.
Electronics 14 02212 g005
Figure 6. Structure diagram of LINet, with JOA placed in the later stages of the network.
Electronics 14 02212 g006
Figure 7. Comparison of SE Attention and Joint Attention: (a) SE Attention; (b) the proposed Joint Attention, where V Pool and H Pool represent vertical and horizontal pooling, respectively.
Electronics 14 02212 g007
Figure 8. The trade-off between FLOPs and PSNR at different split ratios α .
Electronics 14 02212 g008
Figure 9. Qualitative comparison on the same image from the LOL dataset. (a) DCC-Net. (b) Zero-DCE. (c) URetinex. (d) EnlightenGAN. (e) KinD. (f) LLFlow. (g) Ours. (h) Ground truth. The right panel shows a magnified view of the red boxed region in the left panel.
Electronics 14 02212 g009
Figure 10. Qualitative comparison and generalization evaluation on the same image from the VE-LOL dataset. (a) DCC-Net. (b) Zero-DCE. (c) URetinex. (d) EnlightenGAN. (e) KinD. (f) LLFlow. (g) Ours. (h) Ground truth. The right panel shows a magnified view of the red boxed region in the left panel.
Electronics 14 02212 g010
Table 1. Experimental results using different combinations of SFEU and CRB. S and C denote SFEU and CRB, respectively. Inference time is measured in seconds on GPU.
DescriptionParams (M)FLOPs (G)Times (s)PSNR (db)
LLNet10.7122.620.01423.74
LLNet + S9.5422.370.01324.92
LLNet + C2.7417.880.00822.45
LLNet + C + S2.7416.450.00824.56
LLNet + S + C2.7416.430.00825.05
LLNet + S & C2.7416.420.00823.93
Table 2. Quantitative comparisons on the LOL dataset. The best PSNR and SSIM results are in bold, while the second-best results are in italics.
MethodsPSNRSSIM
DCC-Net21.760.854
DeepUPE15.460.456
EnlightenGAN19.520.661
KinD18.340.786
LLFlow21.380.830
MBLLEN18.620.693
RetinexNet17.660.658
URetinex24.110.813
Zero-DCE16.820.549
Ours24.930.845
Table 3. Generalization comparisons on the VE-LOL dataset. The best PSNR and SSIM results are in bold, while the second-best results are in italics.
MethodsPSNRSSIM
DCC-Net27.540.886
DeepUPE14.230.562
EnlightenGAN19.250.658
KinD21.480.793
LLFlow24.730.902
MBLLEN18.160.715
RetinexNet15.740.547
URetinex21.610.827
Zero-DCE18.340.548
Ours28.690.891
Table 4. Quantitative comparisons on the SID and ELD datasets. The best NIQE and PI results are in bold, and the second-best are in italics.
MethodsSIDELD
NIQEPINIQEPI
KinD4.183.083.223.14
RetinexNet12.036.942.641.78
SCI9.747.063.192.48
URetinex9.835.452.662.18
Zero-DCE12.245.243.092.44
Ours4.572.782.462.03
Disclaimer/Publisher’s Note: The statements, opinions and data contained in all publications are solely those of the individual author(s) and contributor(s) and not of MDPI and/or the editor(s). MDPI and/or the editor(s) disclaim responsibility for any injury to people or property resulting from any ideas, methods, instructions or products referred to in the content.

