Article

Cognitive Insights into Museum Engagement: A Mobile Eye-Tracking Study on Visual Attention Distribution and Learning Experience

1
Graduate School of Science and Engineering, Chiba University, Yayoi-cho 1-33, Inage-ku, Chiba 263-8522, Japan
2
Design Research Institute, Chiba University, Yayoi-cho 1-33, Inage-ku, Chiba 263-8522, Japan
*
Author to whom correspondence should be addressed.
Electronics 2025, 14(11), 2208; https://doi.org/10.3390/electronics14112208
Submission received: 30 April 2025 / Revised: 26 May 2025 / Accepted: 28 May 2025 / Published: 29 May 2025
(This article belongs to the Special Issue New Advances in Human-Robot Interaction)

Abstract

:
Recent advancements in Mobile Eye-Tracking (MET) technology have enabled the detailed examination of visitors’ embodied visual behaviors as they navigate exhibition spaces. This study employs MET to investigate visual attention patterns in an archeological museum, with a particular focus on identifying “hotspots” of attention. Through a multi-phase research design, we explore the relationship between visitor gaze behavior and museum learning experiences in a real-world setting. Using three key eye movement metrics—Time to First Fixation (TFF), Average Fixation Duration (AFD), and Total Fixation Duration (TFD), we analyze the distribution of visual attention across predefined Areas of Interest (AOIs). Time to First Fixation varied substantially by element, occurring most rapidly for artifacts and most slowly for labels, while video screens showed the shortest mean latency but greatest inter-individual variability, reflecting sequential exploration and heterogeneous strategies toward dynamic versus static media. Total Fixation Duration was highest for video screens and picture panels, intermediate yet variable for artifacts and text panels, and lowest for labels, indicating that dynamic and pictorial content most effectively sustain attention. Finally, Average Fixation Duration peaked on artifacts and labels, suggesting in-depth processing of descriptive elements, and it was shortest on video screens, consistent with rapid, distributed fixations in response to dynamic media. The results provide novel insights into the spatial and contextual factors that influence visitor engagement and knowledge acquisition in museum environments. Based on these findings, we discuss strategic implications for museum research and propose practical recommendations for optimizing exhibition design to enhance visitor experience and learning outcomes.

1. Introduction

Understanding how visitors engage with museum environments—what they look at, where they spend time, and how experiences are shaped—has long been a central focus in tourism and visitor research. In this regard, mobile eye tracking offers a unique methodological advantage by opening a “visual window” into visitors’ perceptual and cognitive processes, thus allowing researchers to examine attention and learning through the lens of gaze behavior.
Mobile eye tracking, also known as gaze point tracking, is a sensor-based technological method that captures eye-related metrics, monitors eye movement trajectories, estimates gaze positions, and processes visual data through computational instrumentation [1]. With the increasing adoption of eye tracking in research, this technique provides real-time insights into individuals’ perceptual and behavioral responses [2]. Although the application of eye tracking in museum contexts can be traced back to the 1980s [3], recent advancements in its technical sophistication and measurement precision have substantially enhanced its capacity to generate empirical insights into visual attention and attentional dynamics [4]. Given that eye movements typically occur at a subconscious level [5], they are difficult to measure using conventional self-report instruments such as surveys or interviews [2]. As a result, eye tracking has emerged as a promising alternative methodology in visitor studies [6,7,8]. Previous research has highlighted that insights derived from visual attention can contribute to the advancement of mobile learning [9] and the enhancement of visitor experiences [10]. With the advent of eye tracking research, a distinct methodology became available, offering first-hand insights into an experience from an individual’s perspective [6,7]. A key challenge in utilizing mobile eye tracking technology to support museum visitors lies in accurately identifying their interests. This may be partially addressed by tracking visitors’ physical locations and the duration of their stays in specific areas [8]. However, a more nuanced challenge concerns the identification of specific objects or elements that attract visual attention [11].
Based on this rationale, a fine-grained analysis of visitors’ attention and behavioral patterns within the museum environment can yield critical insights into the dynamic interplay between exhibition components and visitors’ cognitive processes. In this article, we illustrate how the integration of a contextual learning framework for visitor engagement with mobile eye-tracking methodology—an approach that aligns closely with cognitive models of visitor behavior—enables a more nuanced exploration of the cognitive processes underpinning exhibition experiences. We conducted an exploratory, small-scale investigation of visitor visual attention directed at artifact presentations, aiming to understand how combinations of display modalities facilitate comprehension of artifact-related information. Rather than mining large-scale eye-tracking datasets for overarching patterns, this study leverages detailed gaze analyses of a limited participant cohort to uncover novel insights into how visitors interpret and engage with varied exhibit formats.
This study is structured into four principal sections. The Section 1 provides a comprehensive review of mobile eye-tracking research within the context of museum experiences. The Section 2 presents the three-stage research design employed in the study. The Section 3 details the empirical findings, visualizing eye-tracking data to elucidate visitor behavior within physical museum environments. Finally, the study concludes by discussing the theoretical and methodological implications of mobile eye-tracking research, proposing directions for future inquiry, and offering practical recommendations for enhancing museum experience design based on empirical insights. Taking a section of an exhibition on Liang Zhu Museum as an example, the present study empirically demonstrates that mobile eye-tracking technology can elucidate visitors’ attentional distribution and information integration across diverse exhibition elements with an unprecedented level of granularity. Consequently, these findings provide novel insights into the differential effects of textual labels, pictorial displays, and artifacts on visitors’ information processing and learning within the museum context.

2. Literature Review

2.1. Museums as Contexts for Visual and Cognitive Engagement

Museums serve as multifaceted cultural spaces that not only preserve and exhibit historical artifacts but also foster public education, identity construction, and social cohesion [12,13]. As institutions grounded in experiential and informal learning, museums are inherently visual environments, where the spatial arrangement of objects, signage, and interpretive materials shapes visitor interpretation and meaning-making [14,15]. At the same time, the increasing attention to visitor-centered design in museum studies has emphasized the need to understand how individuals interact with exhibition components in real time [16]. Each visitor brings prior knowledge, expectations, and personal interests into the museum experience, making visitor engagement highly subjective and context-dependent [17,18]. Equally critical is the facilitation of individualized learning experiences through the optimization of visitor flow within museum environments [12,15]. However, it is essential to recognize that visitor experiences are inherently subjective, both during the moment of engagement and in subsequent retrospective evaluations [19]. Additionally, spatial variables such as gallery layout, lighting, signage positioning, and artifact placement significantly influence museum-goers’ pathways and attentional distribution [20]. This means that human-centered design is critical for individual differences to be taken into consideration. Therefore, human-centered and inclusive design strategies play a critical role in ensuring that museums provide equitable and engaging experiences to diverse audiences [21].

2.2. Visual Attention and Mobile Eye Tracking Technology

Visual attention, defined as the cognitive process that allows individuals to concentrate on specific stimuli while filtering out irrelevant information selectively, is fundamental to perception and learning in visually complex environments such as museums [22,23]. Notably, humans’ eye movements are largely influenced by the nature of objects. For instance, pictures are more visually appealing than text, whereas digital content is more attractive than traditional static materials. Attention is shaped by both bottom-up factors, such as luminance, color, motion, and contrast, and top-down factors, including goals, prior knowledge, and personal relevance [24,25]. However, since eye movements are typically unconscious and occur rapidly, averaging three to four per second [26], traditional research tools such as questionnaires or interviews are insufficient for capturing the complexity of visual attention. Approximately 80% of information processing in human cognition is mediated through visual perception. Consequently, the analysis of eye movements constitutes a fundamental methodological approach for investigating visual information processing and serves as a primary conduit for sensory input in cognitive processing [27]. Mobile eye-tracking technology provides a robust methodological tool for capturing the intricate cognitive mechanisms underlying human visual information processing, allowing for the accurate localization and quantification of individual gaze patterns.
In contrast to traditional cognitive assessments, eye movement analysis is an effective method for characterizing information processing during reading. It provides quantifiable behavioral indicators that offer insights into cognitive engagement and comprehension [28,29]. Therefore, eye tracking constitutes a precise methodological tool for capturing and analyzing visual information processing. It enables researchers to identify participants’ fixation locations over time and to map the sequential patterns and trajectories of gaze movements. Eye tracking technology serves as a valuable instrument for investigating cognitive processes in naturalistic and digital contexts, as it reveals the dynamic relationship between ocular behavior and cognitive responses during information reception [30]. The eye movements commonly observed and recorded in eye tracking are fixation and saccades [31]. When the eye is in fixation or saccade, it indicates visual attention. During fixation or saccadic eye movements, visual attention is engaged. Key eye movement parameters, including fixation duration, fixation location, and visual scan path, are critical indicators for evaluating attentional allocation in visual behavior analysis [32]. Empirical research has demonstrated a direct correlation between fixation metrics and user preference. Specifically, shorter fixation durations and fewer fixations indicate lower preference, whereas prolonged fixation durations and increased fixation frequency are associated with higher preference levels [33]. The technology has been widely adopted in fields such as retail shops [4], urban environments, cultural heritage locations [34], and museums [35].

2.3. Use of Mobile Eye Tracking in the Visitor Studies

Although the design of museums and exhibition spaces has evolved over centuries, comprehending the intricacies of museum experiences, particularly the individualized learning processes occurring during visits, has never been more critical. However, a comprehensive understanding of these experiences remains challenging. It is often derived through conventional methodologies, such as quantitative visitor surveys [36], which may not fully capture the complexity of visitor engagement. With the advent of mobile eye tracking, researchers are now able to study visual behavior in dynamic and ecologically valid settings such as museums [37] and exhibitions [38]. Several relevant studies are summarized in Table 1. Notably, Mayr et al. [9] delivered a pioneering exploratory application of mobile eye tracking to informal learning in museums, highlighting that mobile eye tracking enables the analysis of cognitive processing of visual information as visitors navigate and engage with exhibition content within authentic, real-world settings. However, their analysis overlooks that visitors do not merely integrate spatially distributed information but actively “appropriate” the exhibition experience. To date, Eghbal-Azar [39] has conducted the most comprehensive analysis of museum visitors’ gaze behavior. By examining the eye-tracking data from eight participants at the “South Sea Oasis” exhibition and eight at the “Modern German Literature” exhibition, she delineated eighteen distinct eye-movement patterns that constitute the fundamental components of visitor attention and exploratory behavior. Both Rainoldi, Mokatren & Kuflik and Neuhofer & Joos [40] demonstrate the feasibility of deploying mobile eye tracking in real-world museum settings to capture visitors’ natural gaze behavior. Furthermore, each study leverages gaze-derived metrics to inform the design of context-aware interpretive tools that enhance informal learning and engagement. By integrating mobile eye tracking with traditional surveys, Krogh-Jespersen et al. [37] revealed that variations in awe responses are directly linked to visitors’ visual attention on specific exhibit features. Teo et al. [41] use MET to explore how diverse interactive affordances influence visitor engagement in a science center gallery. Collectively, these investigations underscore MET’s unique contribution to identifying which exhibit features drive attention, learning, and emotion, thereby informing evidence-based exhibit design. However, little research has examined in-depth the visitor behavior to elucidate the interplay between exhibit elements and cognitive processing. In the present study, we employed the high-precision Tobii Pro Glasses 3 (100 Hz sampling rate) to conduct an in-depth analysis of visual attention among eight visitors at the Liang Zhu Museum in China. We addressed two primary research questions: (1) How do visitors allocate initial attention (“attention capture”) across different exhibition element types—artifacts, pictorial panels, textual panels, labels, and videos? (2) Which elements receive sustained scrutiny (“attention hold”), potentially indicating deeper cognitive operations such as meaning-making, comprehension, and working-memory elaboration?
Nonetheless, mobile eye tracking is not without its caveats [39]. First, the requirement for participants to wear conspicuous headgear and undergo calibration, sometimes repeatedly, may induce observer effects, as visitors become aware of gaze recording and may consciously modify their behavior. Second, although fixations are commonly used as proxies for visual attention, peripheral vision can detect elements without direct fixation, and covert attentional focus may diverge from overt gaze direction. While the strict form of the eye–mind hypothesis has been debated, it remains broadly accepted that gaze metrics generally reflect the spatial distribution of attention [42].

3. Method

In this study, we operationalize a constructivist cognitive framework of visitors’ meaning-making processes by employing mobile eye tracking to capture real-time gaze behavior. Specifically, participants’ gaze data were recorded as they engaged freely with the exhibition, and fixation metrics were mapped onto predefined Areas of Interest aligned with key exhibit components. By triangulating these quantitative measures with our constructivist model, we can systematically probe the unfolding of cognitive processes as visitors construct personal interpretations of the exhibition content. Despite challenges such as the conspicuous nature of the recording apparatus and the labor-intensive coding of raw data, this study demonstrates that mobile eye tracking affords an unprecedentedly precise analysis of visitors’ attentional patterns within a museum setting.

3.1. Research Setting

This study employed a three-phase mixed-methods design, as shown in Figure 1. In Stage 1, a pre-experience survey was administered to capture participants’ visit motivations, prior museum experiences, domain knowledge, and interests, thereby characterizing their personal learning context. In Stage 2, on-site mobile eye tracking was used to record and analyze visitors’ behavioral trajectories, social interactions, engagement with the physical environment, and fixation distributions and durations on key exhibit elements, with the aim of elucidating attention-allocation patterns during the museum learning process. In Stage 3, a post-experience survey assessed visitors perceived learning outcomes; observational data, eye-tracking metrics, and self-report measures were then triangulated alongside socio-demographic factors to comprehensively examine how personal, socio-cultural, and physical contexts jointly influence museum learning efficacy.

3.2. Survey for Information About Visitors

Before the experiment, participants completed a questionnaire capturing their background and visit motivations. Survey items probed interest in the featured artifacts, general enthusiasm for site museums, and reasons for attendance. We also assessed artifact-specific curiosity and collected demographic data alongside self-reported museum-visit frequency. That information is shown in Table A1.

3.3. Eye-Tracking Experiment
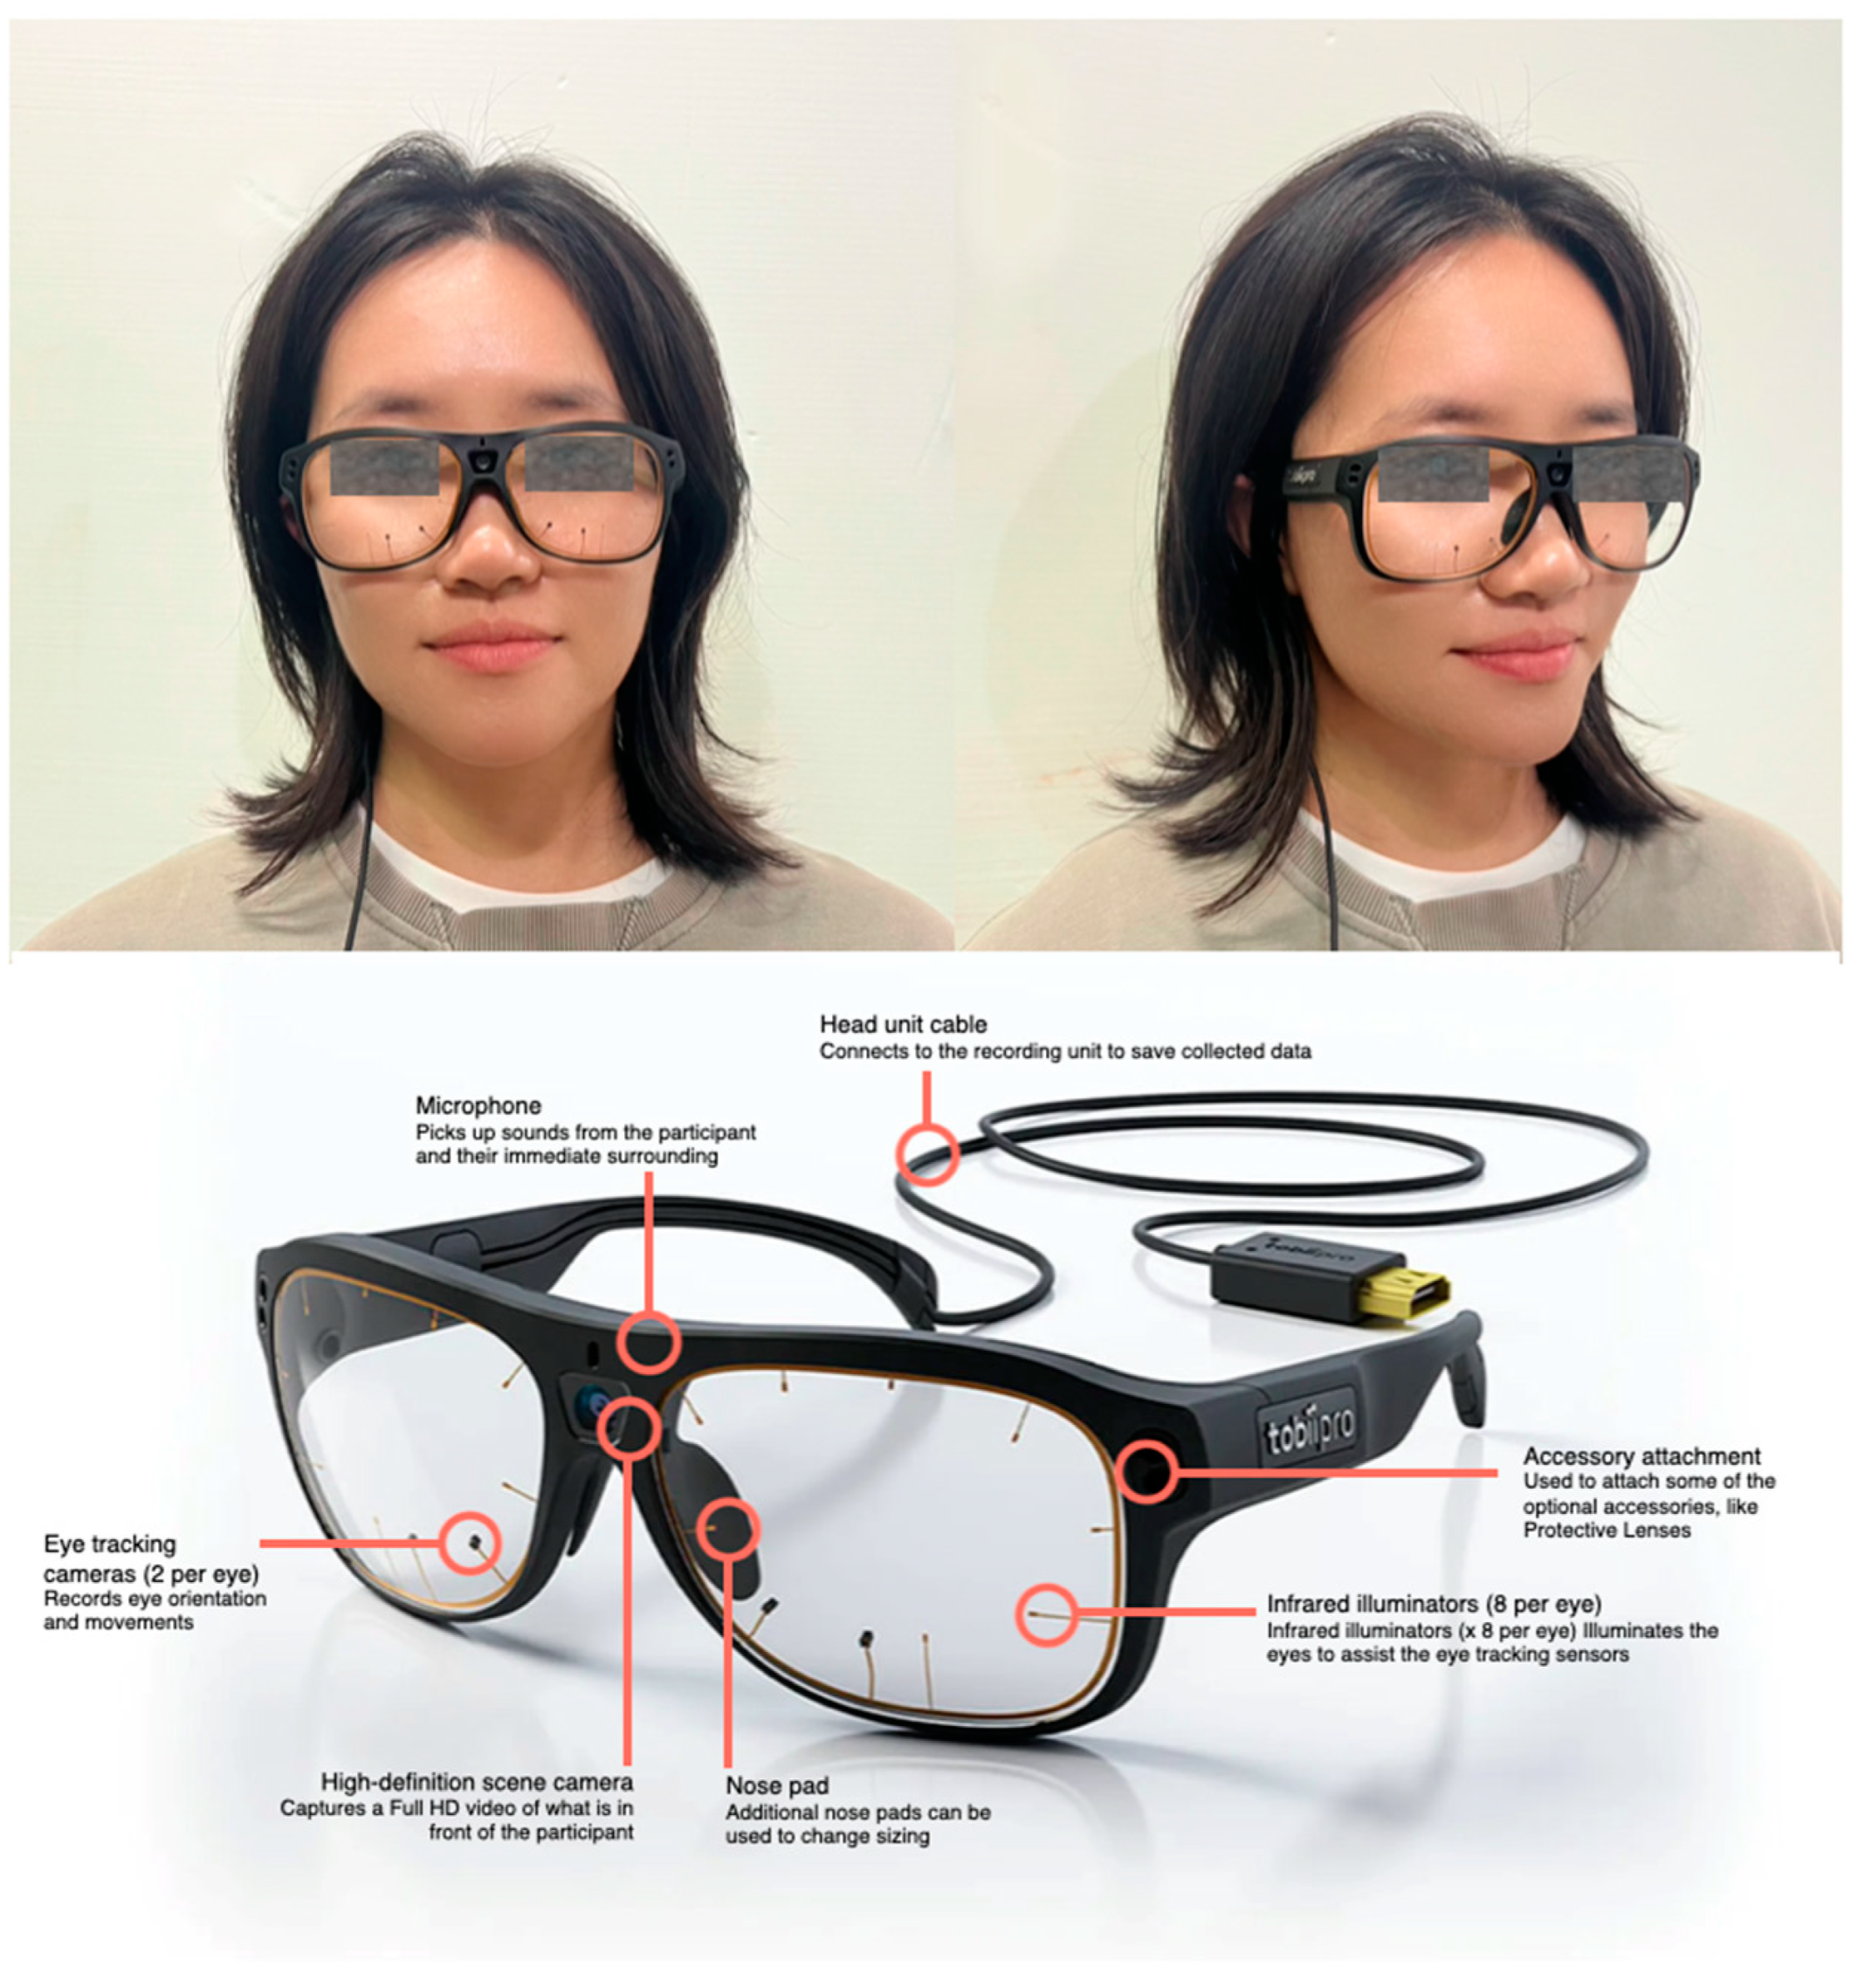
To investigate how visitors distribute their attention across the different types of exhibition elements (artifacts, labels, pictures, texts, and screens) of the museum section, we set up an eye-tracking experiment to examine the visual responses of participants to the display elements of artifacts. Due to the recent technological advancements, mobile eye-trackers facilitate the unobtrusive recording of gaze behavior as individuals move freely within a real-world museum setting. Consequently, this methodology enables the natural identification of the specific information that attracts viewers’ attention when engaging with artifacts and display elements.

3.3.1. Apparatus

Eye-tracking data were collected using the Tobii Pro Glasses 3 (Figure 2) running at 100 Hz. Three models of mobile eyetrackers are popular: Tobii Pro Glass 3, Pupil Labs Core, and Varjo XR-3. Compared to the other two devices, the Tobii Pro Glasses 3 strikes an optimal balance between precision and usability. It is supported by a comprehensive software ecosystem—platforms such as Tobii Pro Studio provide robust data annotation, AOI segmentation, and statistical analysis capabilities. Another reason for selecting the Tobii Pro Glasses 3 as the data-collection instrument is their lightweight, wearable design, which permits participants to navigate the museum freely and engage with exhibits in an ecologically valid setting. Meanwhile, we know that an eye-tracking system with one camera and two light sources is the simplest configuration, which is robust to slippage. However, this only works when both glints and the pupil center are detected correctly. To address these challenges, Tobii Pro Glasses 3 uses 8 illuminators and 2 eye cameras per eye, along with additional motion sensors for head pose estimation. The glasses are attached via a cord to a recording unit that clips to the visitors’ clothing, enabling guest independence and freedom of movement. The recording unit includes a memory card that saves the guests’ gaze data onto a video of their environment and an audio recording of what they say and hear. This memory card is later inserted into a computer with Tobii Pro Lab Analyzer to import the data for processing and analysis.

3.3.2. Participants

The study included 8 participants (4 males, 4 females; M age = 25, SD = 2.20). Of these eight participants, five were master’s students studying at the China Academy of Arts, and three were visitors from the Liang Zhu Archeological Museum randomly recruited into the study. The Liang Zhu Archeological Museum was a first-time experience for all participants. The master students were recruited as volunteers through the personal contacts of the first author. The other visitors were randomly recruited on-site. Participants near the exhibition section were asked if they would be part of an eye-tracking study. Participation in the study was voluntary. The researcher showed the eye trackers to the participants and explained that they would wear the eye tracker frame and carry the battery and receiver as they walked through the gallery at their own pace and free will. Consent was obtained before data collection. Eight recordings were analyzed.

3.3.3. Procedure

All eye-tracking sessions were conducted during the museum’s off-peak hours (weekday mornings and early afternoons), thereby minimizing interference from other visitors and ambient noise on participants. While we did not deploy dedicated sound-level metering instruments, the research assistant continuously monitored environmental noise qualitatively and confirmed that sound levels remained low (<conversational speech) throughout each session. Instrumental noise measurement was omitted in order to avoid additional equipment that might have intruded on the naturalistic museum setting and altered visitor behavior. Each participant was asked to wear the Tobii Pro Glasses 3, and calibration was performed. To minimize data loss from device slippage, the eye-tracking apparatus was additionally secured in place using adhesive tape [43]. During the calibration, the participant was asked to keep their head as still as possible, and calibration was performed only by shifting their eyes. Once calibration was completed, participants freely navigated the Liang Zhu Archeological Museum, and the recording was started. During the experiment, a technician accompanied each participant at a non-intrusive distance to continuously monitor and recalibrate the eye-tracking device, thereby ensuring the accuracy of the eye-movement data.
After the participant was finished exploring, the recording was stopped, and the eye tracker was wiped down with alcohol and wipes for the next participant. The data collected in the storage device were then downloaded to the computer for Tobii Lab analysis. The result is the scene camera footage, overlayed with the gaze point (commonly represented by circles and lines), obtained from the eye camera. Both footage from the scene camera and the eye camera were merged, resulting in the scene camera footage overlaying the gaze point. After the museum visit, participants were asked a few questions to find out their views about the exhibits in the gallery and what they had learned from one exhibit.

3.4. Post-Experiment Interview
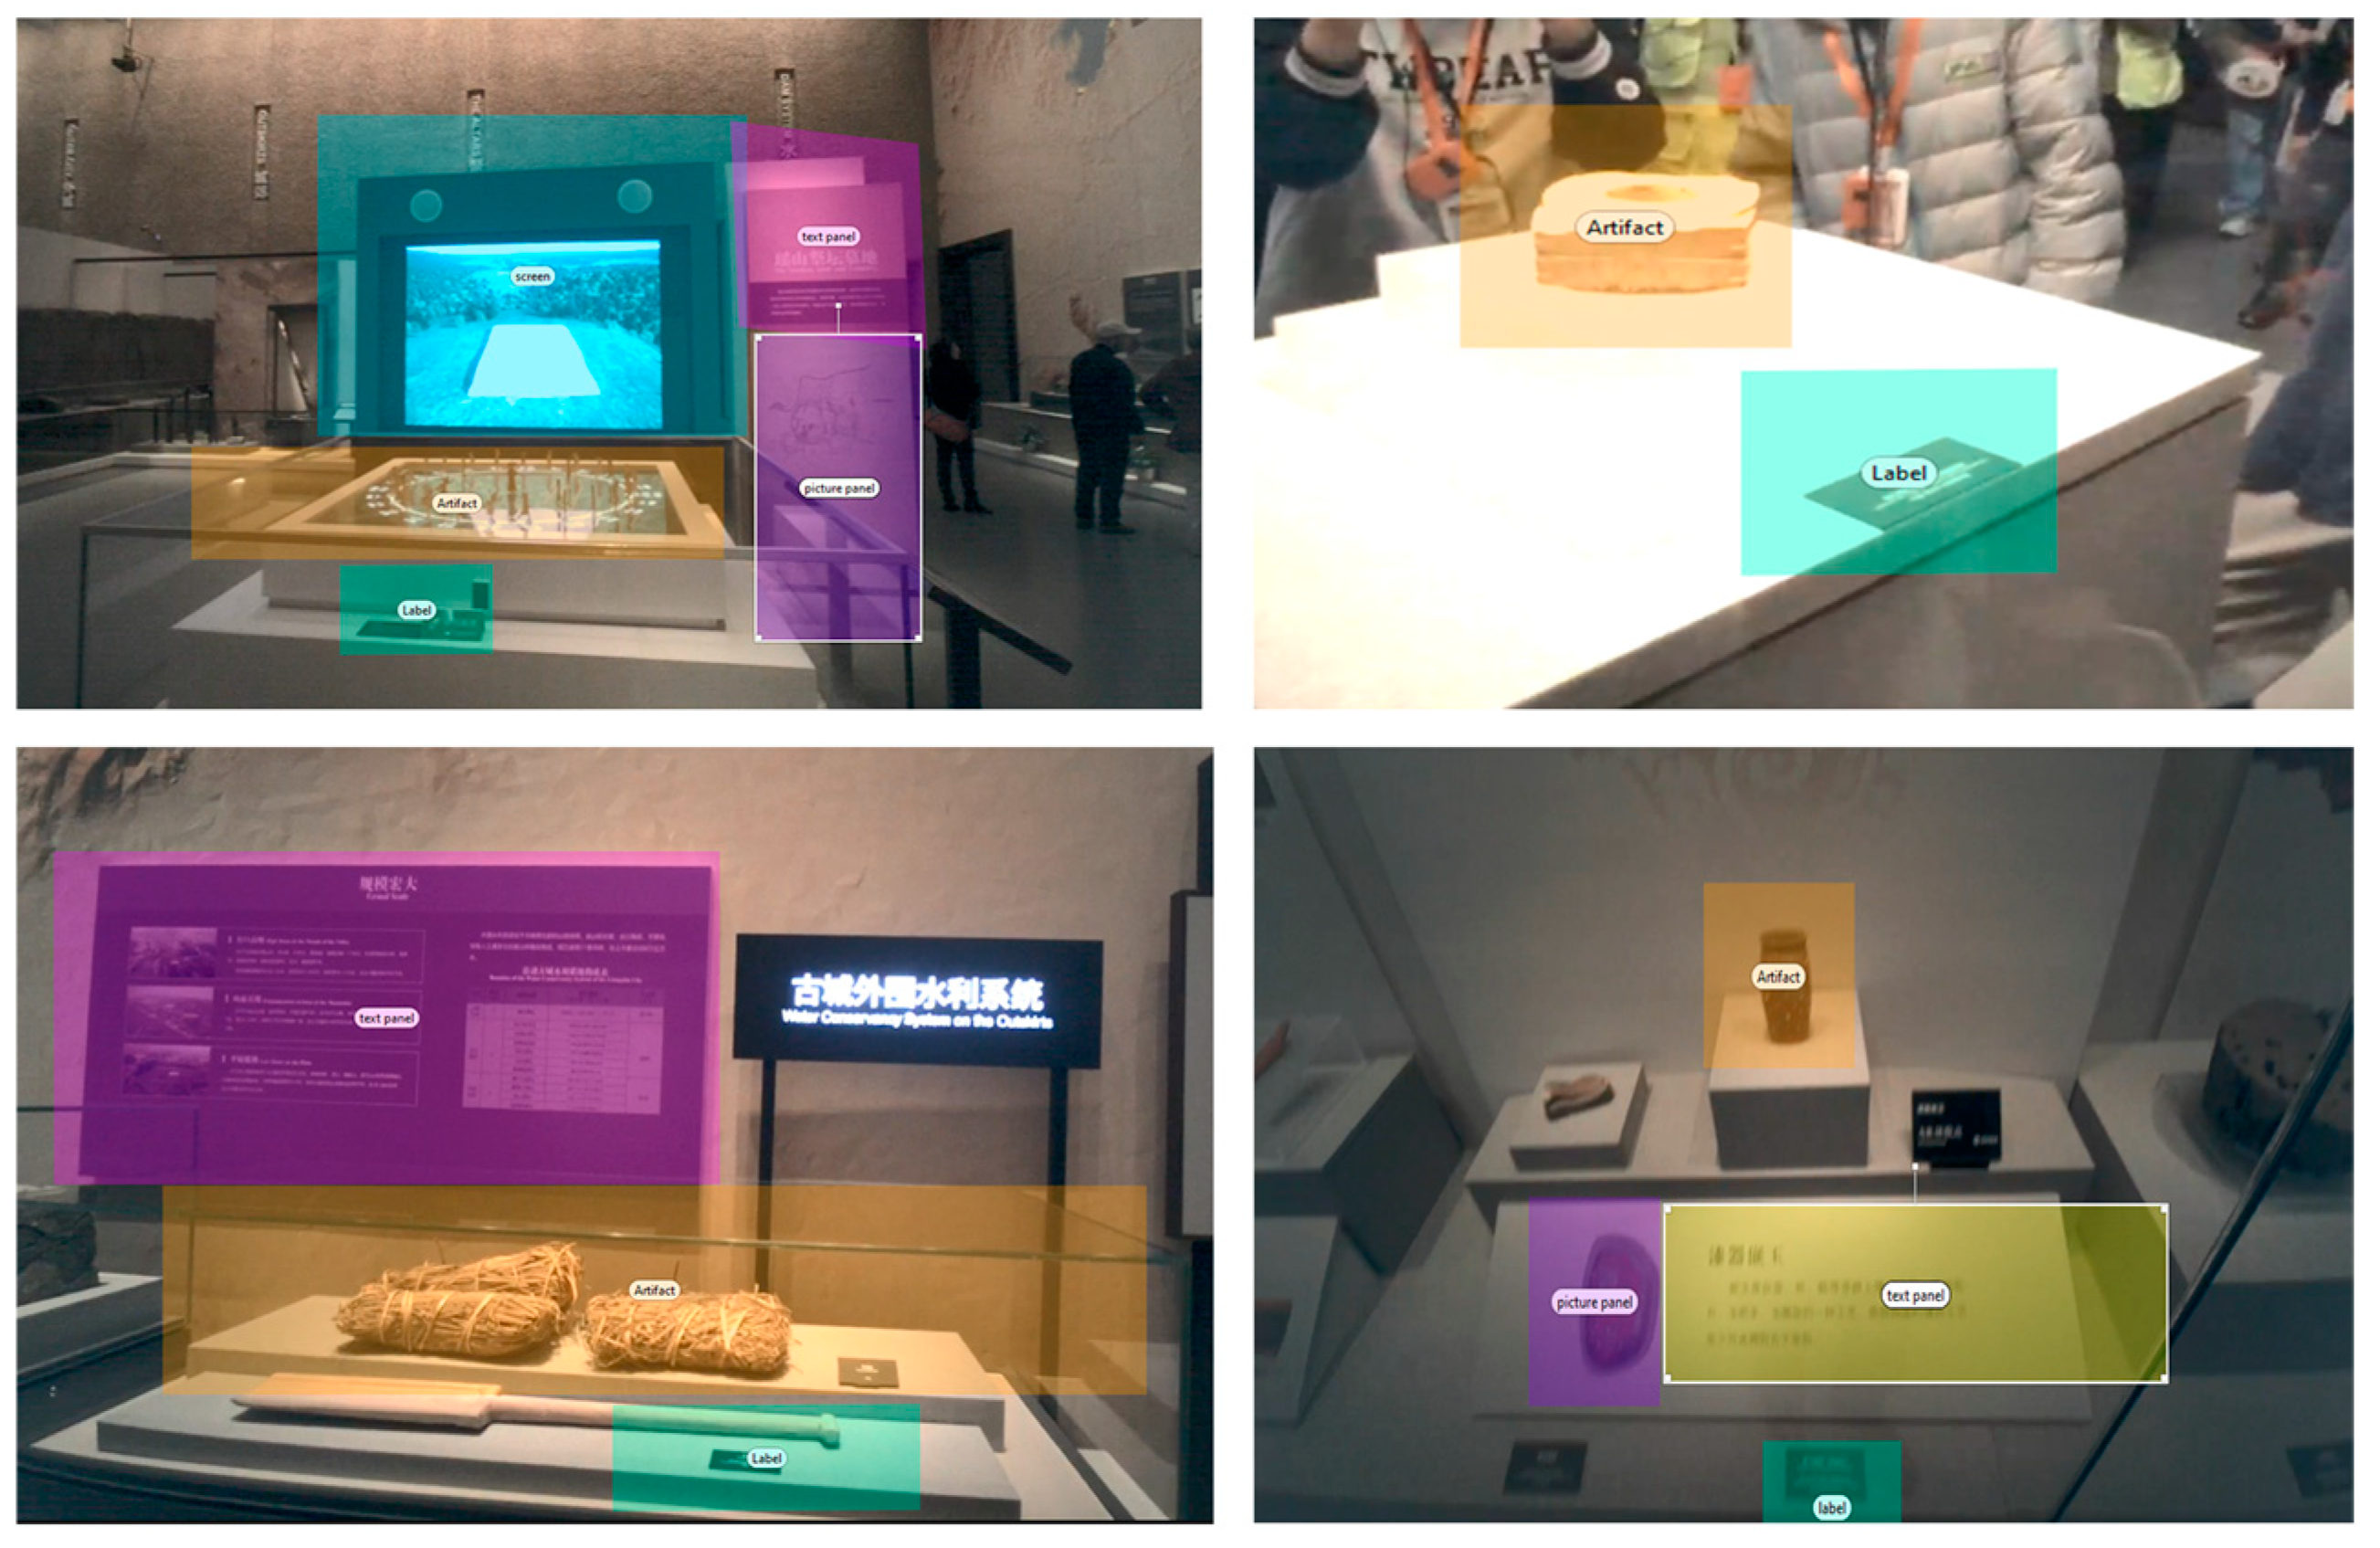
Inferences about underlying cognitive processes based on eye-movement data are prone to error. To mitigate interpretive bias, it is essential to establish explicit a priori hypotheses that define how specific cognitive mechanisms should manifest in ocular metrics. Such hypotheses can then be empirically evaluated using interview measures of participants’ interests and prior knowledge. Also, while inspection times can be indicative of the viewers’ overt attention, the underlying cognitive processes require further empirical investigation. For example, due to their linear sequential nature, reading texts and building up the respective mental text models may take more time than building up corresponding mental representations of pictorial scenes [42]. But differences in inspection time may also reflect true differences in the depth of elaboration in working memory, with prolonged inspection times indicating either comprehension problems or thoughtful processes of meaning-making. Insights into these processes can be gained by an interview.
The first section of the interview addresses participants’ post-visit museum experiences, while the second section focuses on their user experience with the eye-tracking apparatus. First section questions included: (a) What were the most engaging or interesting exhibits for you in this museum? (b) Can you explain to me what a Mud-Wrapped Grass is? Which part of the exhibition helped you understand it? (c) What other feedback do you have on the exhibit? (d) Which exhibition elements helped you better understand the content of the exhibition? The second section includes three questions: (a) Please rate the overall comfort of the eye-tracking glasses (fit, weight, and headband pressure). (b) To what extent did wearing the device interfere with your natural movement and exploration of the exhibits? (c) Please indicate how distracting the eye-tracking apparatus was during your visit.

3.5. Data Analysis

Data from the Tobii Pro Glasses 3 were exported and analyzed in Tobii Pro Lab Analyzer using the Tobii Attention Fixation Filter. Then, trained research assistants (one who served as the primary coder and one who served as a reliability coder) hand-coded each participant’s visual patterns onto the video to allow for analyses across participants as to what features of the exhibit captured their visual attention. The reliability coder independently coded a randomly selected subset of 4 participants, and the inter-coder reliability ranged from 93% to 99% (Cohen’s kappa = 0.96). For the current study, fixations were categorized based on five elements of the exhibits by creating Dynamic Areas of Interest (AOIs) in Tobii Pro Lab, comprising: (a) Artifacts, (b) Artifact labels, (c) Picture panels, (d) Text panels, (e) Video screens, as shown in Figure 3. Four factors to examine how much attention participants paid to particular exhibit display elements, as follows:
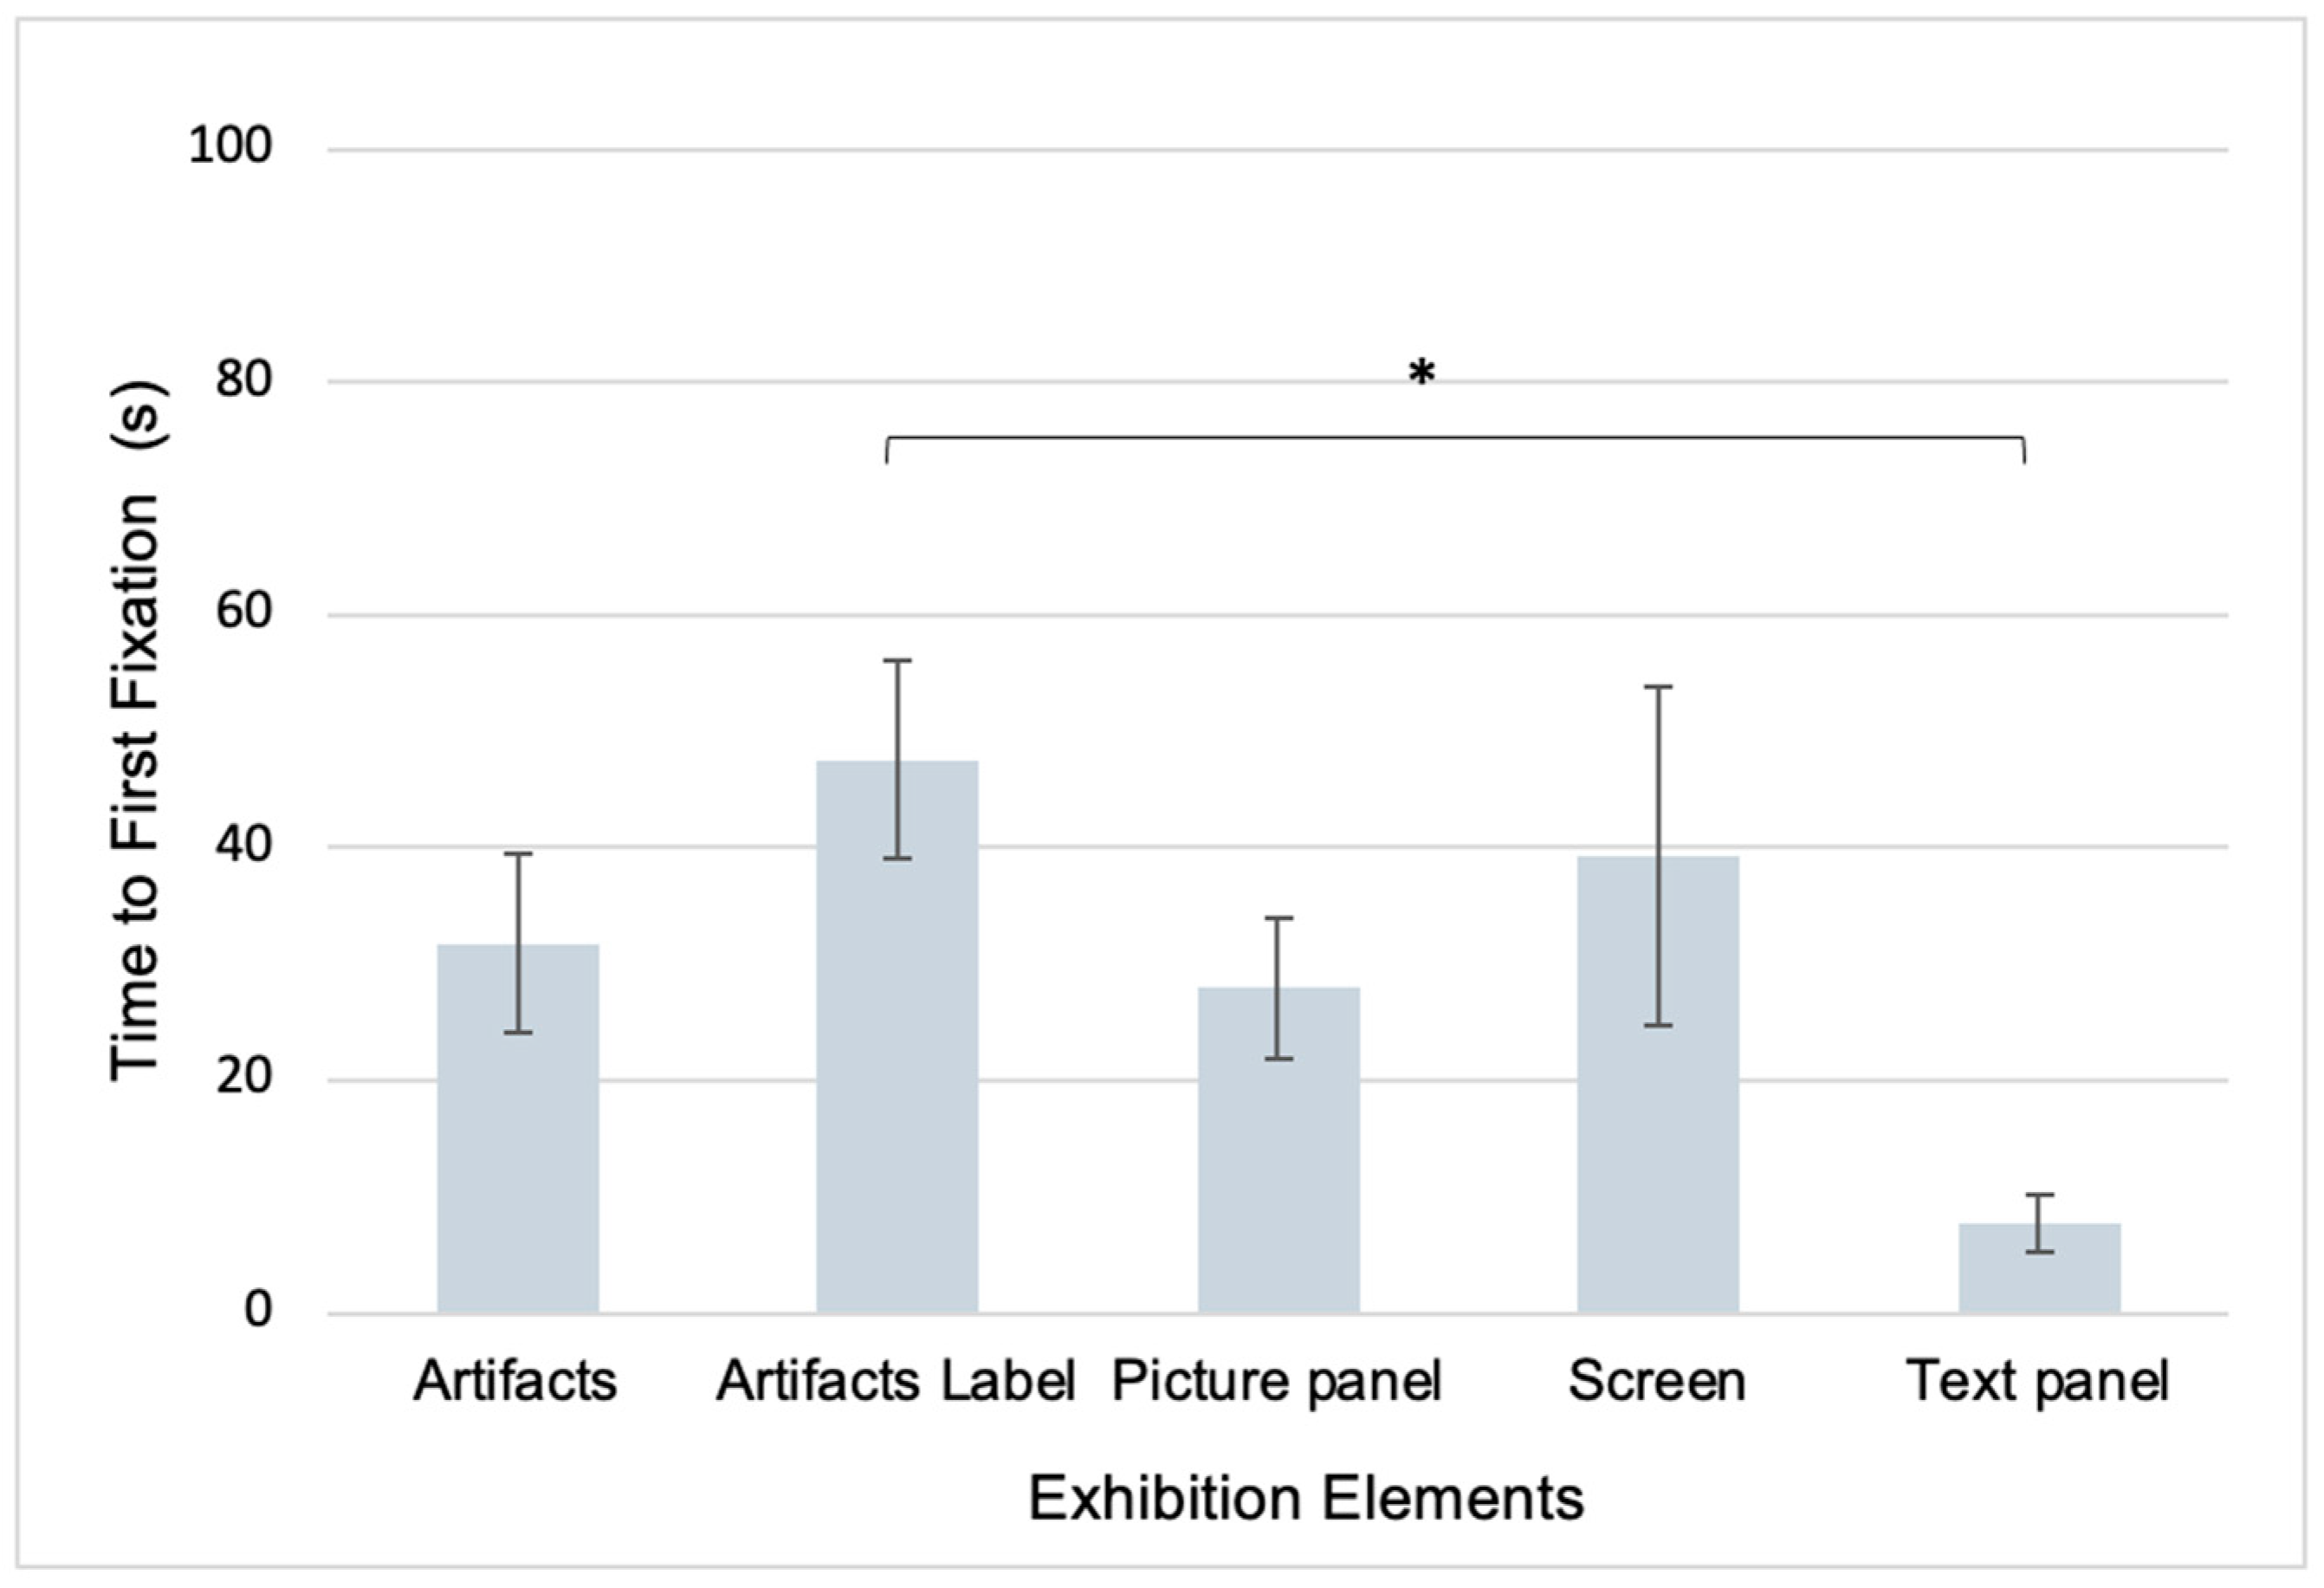
  • Time to First Fixation (TFF);
  • Total Fixation Duration (TFD);
  • Average Fixation Duration (AFD);
  • Ratio On-Target: All Fixation Time (ROAFT).
Fixation is an eye movement state that can be defined as the periods of time when the eyes are relatively still, holding the central foveal vision in place so that the visual system can take in detailed information about what is being looked at. Duration is defined as the elapsed time between the first gaze point and the last gaze point in the sequence of gaze points that make up the fixation. Areas of Interests (AOIs) are predefined regions or objects within the visual stimulus that participants are expected to attend to during the experiment; by serving as analytical units for gaze tracking, AOIs enable quantitative and statistical assessment of attentional distribution across specific exhibit components. Time to First Fixation (TFF), Total Fixation Duration (TFD), and Average Fixation Duration (AFD) are key metrics in mobile eye tracking that together characterize attentional dynamics and cognitive processing. TFF measures the latency between the onset of a stimulus or entry into an Area of Interest (AOI) and the first fixation, indexing the salience or initial attentional pull of exhibit elements—shorter TFFs indicate stronger immediate attraction [44]. TFD quantifies the sum of all fixation durations within an AOI over a viewing period, serving as a proxy for overall engagement and depth of information extraction—greater TFD reflects more sustained processing [6]. AFD, calculated as TFD divided by the number of fixations, captures the average cognitive effort per fixation: longer AFDs imply more intensive scrutiny, whereas shorter AFDs denote rapid scanning [26]. Additionally, the Ratio of On-Target to All Fixation Time (ROAFT) was computed to further assess the extent of attention allocated to specific exhibition elements. Ratio On-Target: All Fixation Time (ROAFT) is the ratio of AOG (Area of Glance) to fixation on a specific AOI (Area of Interest). The duration of a particular AOI is obtained by subtracting the end times (ET) from the start times (ST) of the fixations and dividing the resulting values by the value of the entire set of AOG, as represented by Equation (1) [45].
ROAFT = i = 1 n ET F i ST F i   in   AOI j = 1 m ET F j ST F j   in   AOG
Finally, to discern any significant differences existing between visual attention on the different exhibition’s elements, a one-way analysis of variance (ANOVA) was conducted.

4. Results

4.1. Descriptive Statistics
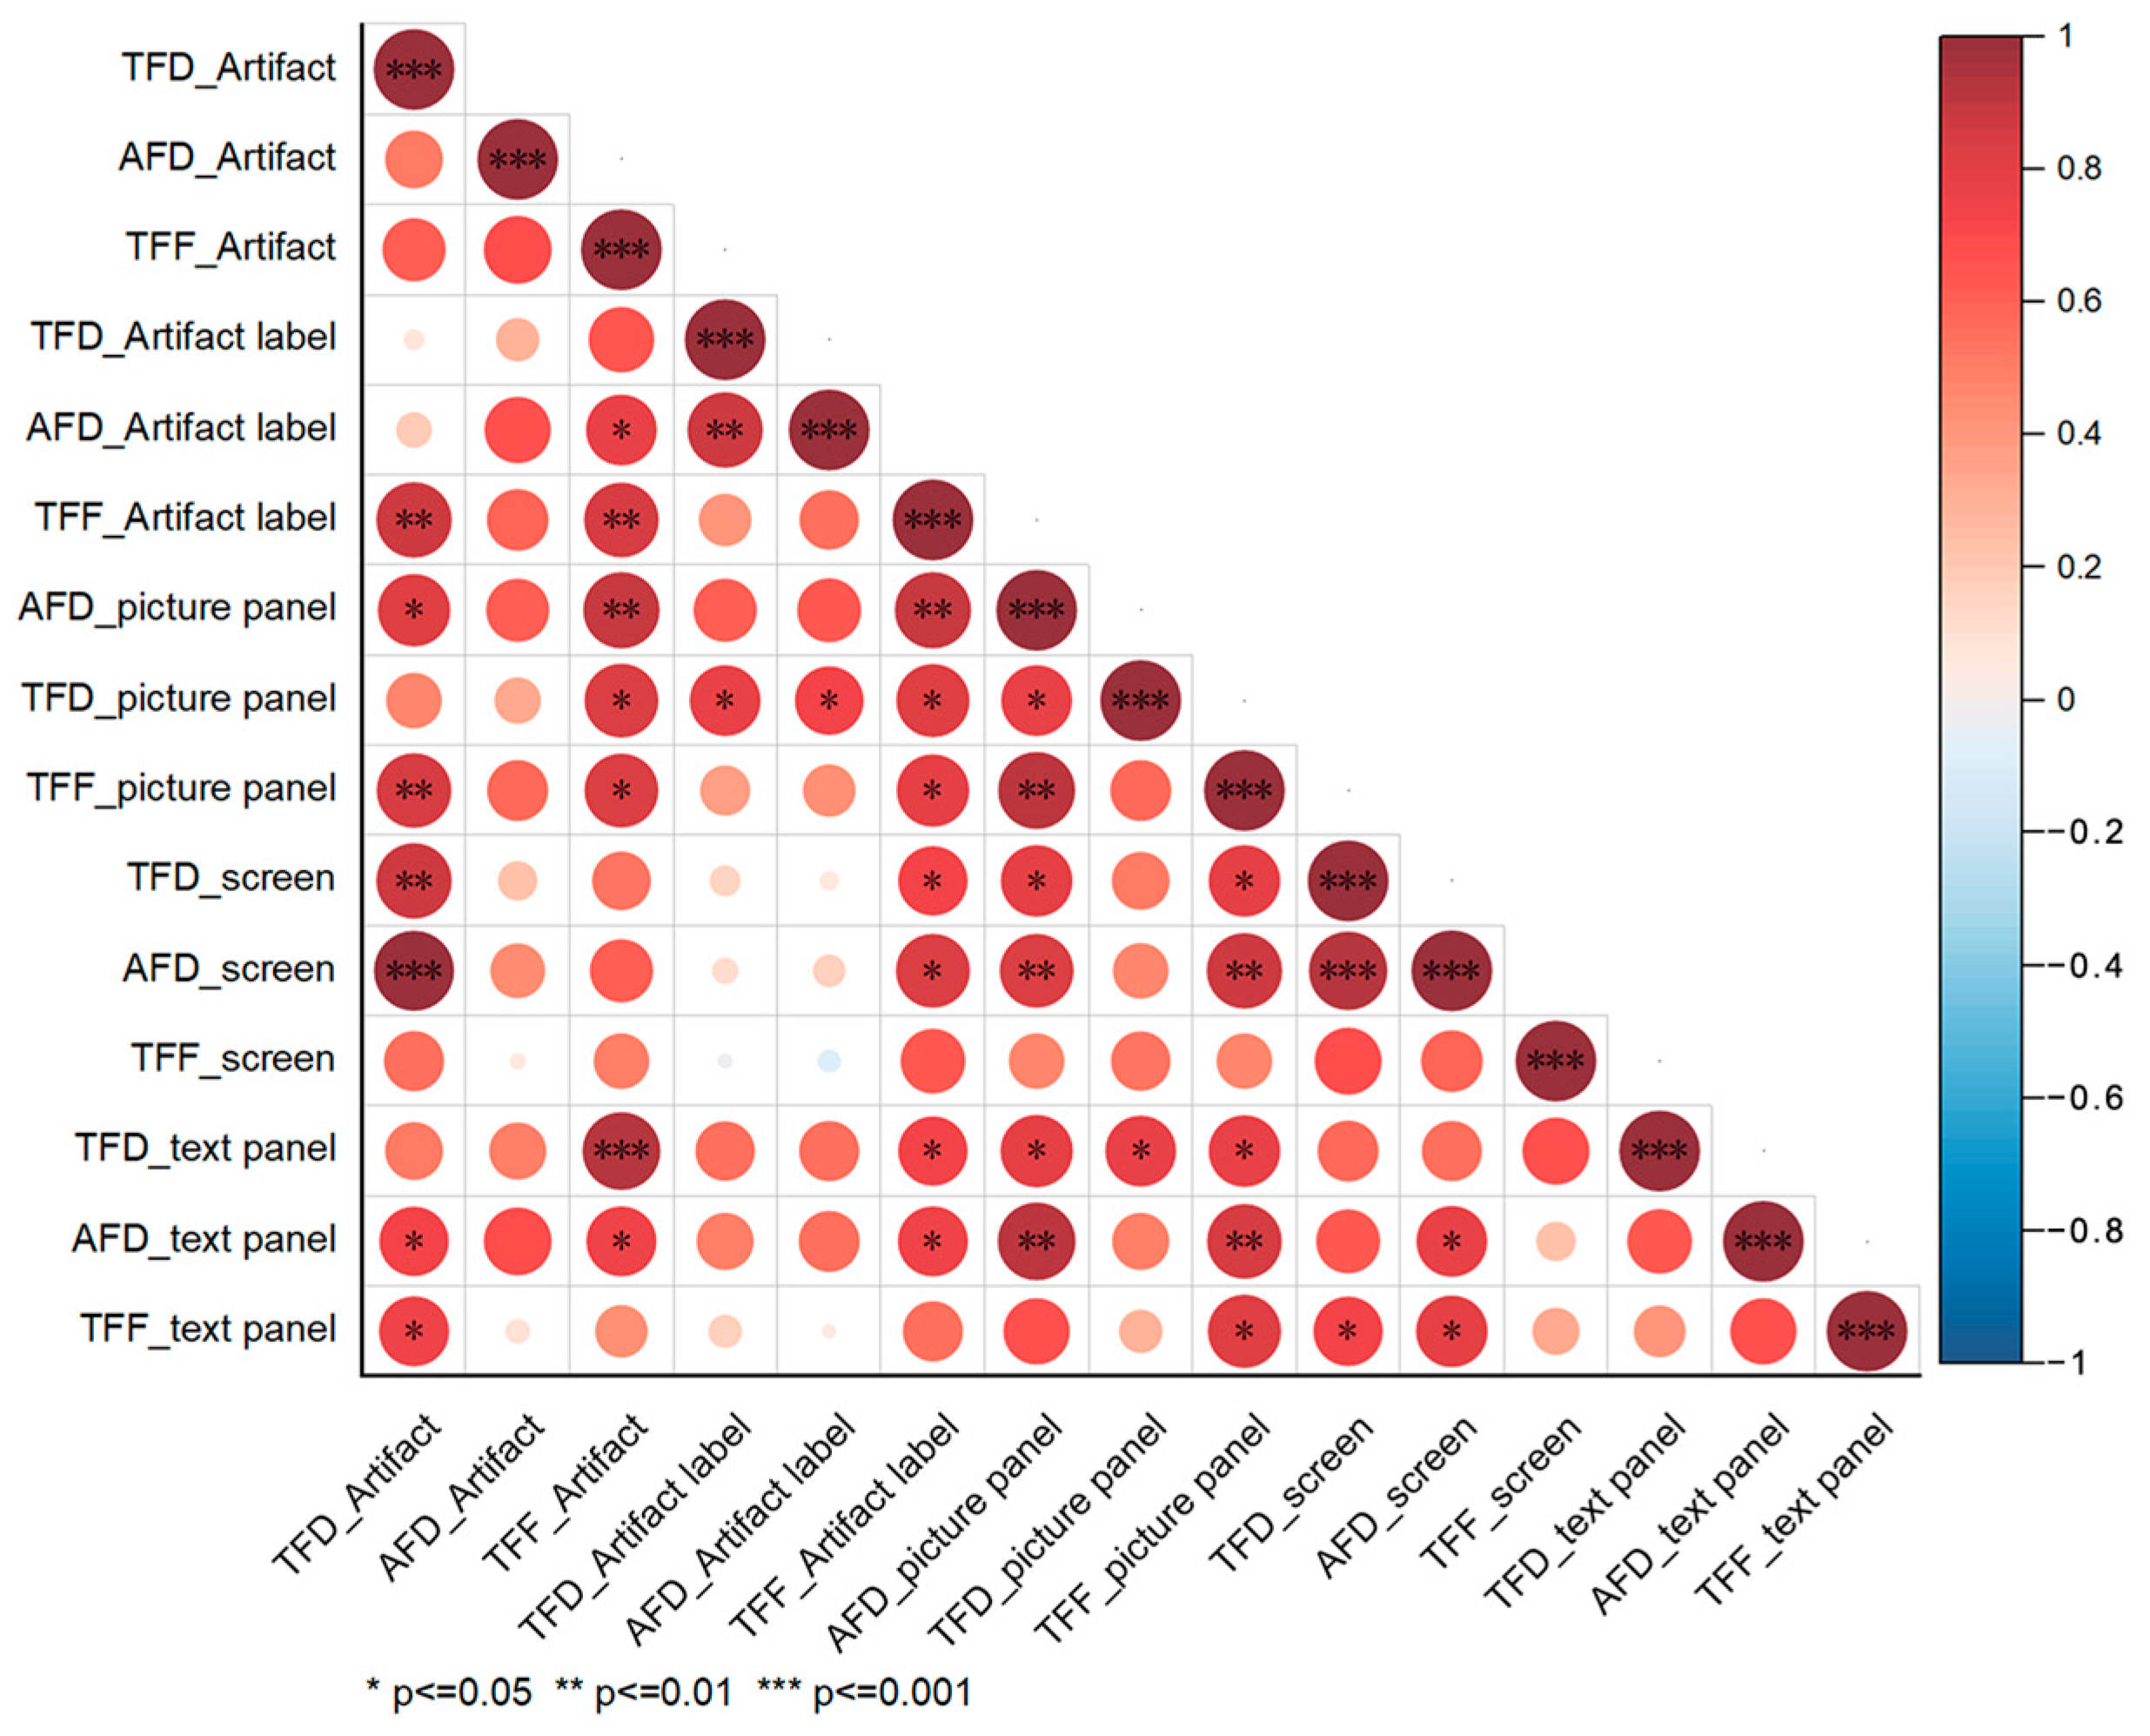
Descriptive statistical analyses were performed to explore differences in visual attention across these exhibition elements, and the results are summarized in Table 2. First, Time to First Fixation (TFF) was shortest for artifacts (M = 31.77 s, SD = 20.45) and longest for artifact labels (M = 47.57 s, SD = 24.13), implying that visitors initially prioritize objects before reading labels. Video screens showed intermediate but highly variable latencies (M = 39.19 s, SD = 41.15), reflecting individual differences in the immediacy of engagement. Total Fixation Duration (TFD) peaked on dynamic media (screens: M = 53.69 s, SD = 65.12) and picture panels (M = 40.14 s, SD = 30.17), indicating that moving or pictorial content sustains attention. In contrast, labels attracted minimal dwell (M = 7.82 s, SD = 8.64), while artifacts (M = 29.32 s, SD = 18.50) and text panels (M = 29.81 s, SD = 29.00) yielded comparable but more variable engagement. Average Fixation Duration (AFD) was greatest for artifacts (M = 1.77 s, SD = 0.97) and labels (M = 1.51 s, SD = 1.32), suggesting deeper processing per fixation, whereas text panels (M = 1.36 s) and picture panels (M = 0.85 s) invoked shorter, scanning-style fixations. Video screens exhibited the shortest AFD (M = 0.62 s, SD = 0.33), consistent with rapid attentional shifts driven by dynamic content.

4.2. Main Analysis

A correlation matrix was generated to graphically present relationships among the different exhibition elements and their associated eye-tracking metrics, allowing for a clearer visualization of attentional patterns in Figure 4. The color scale encodes both the strength and direction of the correlations: red indicates positive correlations, blue indicates negative correlations, and white represents near-zero correlations. The transparency level of each cell reflects the magnitude of the correlation coefficient, with higher transparency denoting weaker associations and greater opacity indicating stronger correlations.
The correlation matrix visualization illustrates the relationships between different eye-tracking metrics (TFF, TFD, and AFD) across various exhibition elements, including artifacts, artifact labels, picture panels, screens, and text panels. The intensity and color of the circles indicate the strength and direction of the correlation, with statistical significance levels denoted by asterisks (* p < 0.05, ** p < 0.01, *** p < 0.001).
The correlation analysis of visual attention metrics revealed several key patterns regarding visitor engagement with different types of exhibition elements: First, strong positive correlations were observed among fixation metrics—specifically Time to First Fixation (TFF), Total Fixation Duration (TFD), and Average Fixation Duration (AFD)—within each exhibit type. For example, TFD and AFD for artifacts exhibited a significant positive correlation (p < 0.001), indicating that participants who devoted longer total attention to artifacts also demonstrated longer average fixation durations and earlier initial fixations. This pattern was consistently observed across artifact labels, picture panels, video screens, and text panels, suggesting a stable internal consistency in attentional behavior toward individual exhibit categories. Second, high levels of attention were directed toward digital media elements. Video screens and picture panels demonstrated strong correlations between their respective TFD and AFD values (p < 0.001), reinforcing previous findings that dynamic visual content attracts and sustains substantial visitor attention in museum settings. The strong association between TFD_Screen and AFD_Screen suggests that when participants attended to screens, their engagement was not only frequent but also temporally extended. Third, artifact labels emerged as critical facilitators of visitor engagement with physical artifacts. The strong positive correlation between TFD_Artifact Label and TFF_Artifact Label (p < 0.001) implies that labels often serve as initial points of visual anchoring, guiding visitor attention toward the associated artifacts. This finding aligns with prior research emphasizing the interpretive role of textual explanations in enhancing visitor-object interactions. Finally, weaker correlations were observed between fixation metrics for traditional artifacts and digital media elements (e.g., screens, picture panels).
A one-way between-subjects ANOVA was conducted to assess the effect of display modality on three eye-tracking metrics. For Total Fixation Duration (TFD), no significant differences were observed among the five display types, F(4, 35) = 1.80, p = 0.151. In contrast, display modality produced a significant main effect on Time to First Fixation (TFF), F(4, 35) = 2.90, p = 0.036, indicating that initial attentional capture varied by display type. Tukey post hoc tests demonstrated that artifact labels (M = 47.57 ms, SD = 24.13) elicited significantly longer TFF than text panels (M = 7.69 ms, SD = 6.84), as shown in Figure 5. Finally, there was a marginally significant effect of display modality on Average Fixation Duration (AFD), F(4, 35) = 2.44, p = 0.065.
To further assess participants’ attention allocation toward specific exhibition components, the Ratio of On-Target Fixation Time to All Fixation Time (ROAFT) was calculated for five categories of display elements—artifacts, labels, picture panels, text panels, and video screens—across five exhibit modules (Table 3). The results reveal considerable variation in how different content types attract and retain attention. Artifacts consistently received moderate attention across Exhibits 01–04 (ROAFT range: 0.19–0.20). However, in Exhibit 05, artifact engagement sharply increased (M = 0.71, SD = 0.11), suggesting that the artifact(s) in this section were particularly salient or prominently placed, resulting in significantly higher fixation time relative to other elements. Labels attracted the least attention across all exhibits, with ROAFT values ranging from 0.00 (Exhibit 02) to 0.10 (Exhibit 01). These low values indicate that labels were generally overlooked, or viewed only briefly, highlighting potential issues related to label visibility, positioning, or informational load. Picture panels showed the highest variability in ROAFT across exhibits. Exhibit 02 displayed an exceptionally high ROAFT (M = 0.68, SD = 0.20), indicating dominant visual engagement with pictorial content. In contrast, other exhibits showed markedly lower values (e.g., Exhibit 03: M = 0.07), suggesting that the effectiveness of image-based elements was context-dependent. Text panels demonstrated mixed results. Exhibit 01 recorded the highest ROAFT for text (M = 0.46, SD = 0.11), while Exhibit 02 had none (M = 0.00), and the remaining exhibits showed moderate engagement (M = 0.22–0.32). These differences suggest that visitors’ attention to text is highly variable and may depend on design factors such as length, legibility, or integration with nearby visual stimuli. Screens (digital video content) showed a progressive increase in engagement, peaking in Exhibit 03 (M = 0.36, SD = 0.19). This pattern confirms the strong attentional pull of dynamic media, especially when compared to more static forms of content. Notably, even in exhibits with high screen ROAFT, other elements—such as artifacts or text—did not always show parallel increases, indicating that digital content may compete with, rather than complement, traditional displays.
We used grouped bar charts (Figure 6) to precisely compare which exhibit group received higher levels of attention in each Area of Interest (AOI). This visualization allows for the simultaneous examination of multiple categories, making it particularly effective for identifying which exhibit types receive higher levels of attention within distinct AOIs. Distinct colors were employed to represent each of the six individual exhibit items.

5. Findings and Discussion

The analysis first examined various museum display elements and compared visitors’ engagement with artifacts, labels, picture panels, text panels, and video screens. The analysis of Time to First Fixation (TFF) reveals distinct attentional patterns across exhibition elements. Artifacts exhibited a relatively short mean TFF, indicating that visitors tended to allocate their attention toward artifacts soon after entering the exhibition space. In contrast, artifact labels demonstrated a longer mean TFF, suggesting that labels were typically noticed after initial engagement with the artifacts. This temporal sequence may reflect either the influence of spatial layout or the natural progression of visitor exploration behaviors. Video screens exhibited the shortest mean TFF among the elements analyzed but also showed the highest standard deviation, indicating substantial individual differences. Some visitors were oriented to the video content almost immediately, while others delayed their attention, reflecting heterogeneous attentional strategies toward dynamic media. Regarding Total Fixation Duration (TFD), visitors demonstrated the longest cumulative viewing times on video screens and picture panels. These findings suggest that dynamic visual content and pictorial information were particularly effective in sustaining visitor attention over time. Conversely, artifacts and text panels elicited comparable total fixation durations. However, text panels exhibited a higher standard deviation, indicating greater variability in visitor engagement with textual elements. Artifact labels recorded the shortest total fixation duration, implying that although visitors attended to labels, they allocated only minimal viewing time to them. In terms of Average Fixation Duration (AFD), artifacts and artifact labels yielded the highest values. These results suggest that although the total viewing time for labels was limited, when fixations occurred, they were relatively stable and prolonged, potentially reflecting cognitive processing of descriptive or informational content. Previous research also confirmed that, in contrast, labels were less often noticed by the visitors, but if they were noticed, the visitors tended to spend substantial time reading them [46]. Text panels dictate a scanning strategy where visitors extract information more rapidly rather than engaging in extended fixations. Notably, video screens exhibited the lowest AFD, implying that while visitors dedicated substantial overall attention to video content, individual fixations were brief. This pattern likely reflects the dynamic and continuously changing nature of video media, which necessitates distributed visual attention across multiple elements.
The results revealed distinct patterns of visitor engagement across exhibition elements. These findings are congruent with previous research [46] that physical artifacts quickly captured visitors’ initial attention, serving as primary focal points within the exhibition. However, associated labels attracted delayed and minimal attention, suggesting that textual information was secondary to artifact exploration. Dynamic media elements, particularly video screens, effectively sustained overall attention, although individual fixations were brief, reflecting distributed scanning rather than deep engagement. This is in line with previous studies arguing that digital materials can lead to higher interest and attention levels [47]. While digital media per se may not be the motivating factors for people to visit a museum, they are indeed the elements that receive most attention during a visit. Picture panels also captured considerable attention, highlighting the power of visual imagery in exhibition design. Conversely, text panels exhibited greater variability in fixation patterns, indicating challenges in maintaining consistent visitor engagement with static textual information. Notably, when visitors focused on artifacts and labels, their average fixation durations were relatively high, implying deeper cognitive processing during these engagements. Overall, the findings emphasize the importance of balancing immediate visual attraction with opportunities for sustained cognitive engagement in museum environments.
Furthermore, the findings have revealed several interesting correlations between physical exhibition’s elements. The particularly strong attraction of video screens and picture panels reinforces the growing influence of digital media in shaping visitor behavior. However, the observed competitive relationship between digital components and traditional artifacts suggests that digital media, while effective in capturing attention, may inadvertently detract from deeper engagement with physical objects if not carefully integrated. Therefore, curators and designers should strategically balance digital and physical elements to avoid attentional competition and enhance complementary engagement. About the label, the data show that in line with the intuition of many curators, the visitors often tended to ignore labels [48], focusing their attention on primary elements instead. But the general conclusion that visitors are reluctant to read labels is not supported by the present pattern of results. Moreover, the central role of artifact labels in mediating attention toward artifacts underscores the continued importance of textual interpretation in museum experiences. Labels not only provide informational scaffolding but also serve as critical visual entry points, facilitating more meaningful interactions with artifacts. Ensuring that labels are visually accessible, concise, and cognitively engaging is, thus, vital for promoting integrated learning experiences.
Analysis of ROAFT across the five exhibition modules revealed that artifacts generally commanded moderate attention, except in Exhibit 05 where they dominated visitors’ fixation time, suggesting enhanced salience or presentation. Labels attracted minimal attention in all modules, indicating limited effectiveness in guiding gaze. Picture panels’ impact varied markedly by context—highly engaging in Exhibit 02 but less so elsewhere, highlighting the importance of visual integration within the display narrative. Text panels also exhibited context-dependent engagement, performing well in some modules but being ignored in others, likely reflecting variation in perceived relevance and readability. Finally, screens demonstrated a progressive increase in attentional capture throughout the sequence, underscoring the strong draw of dynamic media in museum settings. However, visitors with greater familiarity and comfort with screen and video interfaces may exhibit disproportionately longer fixations on interactive displays, not solely as a function of content salience but also due to their “tech-savvy” [49]. To mitigate this bias, future analyses should incorporate digital literacy as a covariate or stratify the sample by self-reported technology experience. Such an approach would clarify whether extended screen dwell times reflect genuine engagement with exhibit content or simply a greater ease in interacting with digital media. Overall, the ROAFT analysis demonstrates that visual attention in museum contexts is highly dependent on content type and exhibit design. Artifacts and picture panels emerged as strong attractors in specific contexts, while labels consistently struggled to capture sustained attention. Dynamic digital media, represented by screens, became increasingly dominant across successive exhibits, reinforcing previous findings regarding the strong visual pull of motion-based stimuli. These findings underscore the critical importance of strategic spatial design, content integration, and multimodal balance in facilitating effective visitor engagement within museum exhibitions.
The post-visit survey (N = 8) indicates that participants found the Tobii Pro Glasses 3 to be generally comfortable (mean comfort rating = 3.8/5) and experienced minimal interference with their natural movement (mean = 4.0/5) and attention (mean = 4.0/5). Open-ended feedback (Q4–Q7) consistently cited the hands-on artifact displays and explanatory labels as the most engaging and informative elements, suggesting that these modes of presentation effectively support visitor comprehension. Taken together, these results confirm that, with a lightweight design and well-managed calibration procedures, mobile eye tracking can be deployed in museum settings without substantially disrupting the visitor experience. Nonetheless, the very small sample and limited qualitative responses restrict the breadth of inference; future work should replicate these findings with larger and more diverse visitor cohorts to strengthen their external validity.

6. Conclusions

Physical contexts, spatial design, and exhibition elements are critical determinants of learning experiences in museums [15]. As digital technologies become increasingly integrated into museum settings, growing attention is being directed toward the design of artifacts that effectively blend physical and digital media to facilitate visitor flow and enhance learning outcomes and the visiting experience. This study employed a mobile eye-tracking research design to investigate visitor experiences within a real-world museum setting. The results indicate that the museum experience emerges as a multifaceted construct shaped by the dynamic interplay between visitors’ personal contexts and the physical environments curated by the museum. The analysis of eye-tracking metrics—specifically time to first fixation, mean fixation duration, and total fixation duration—highlighted exhibition elements that most effectively captured visitor attention and fostered sustained engagement. As fixation duration is closely associated with visual attention and underlying cognitive processes, it serves as a critical proxy for learning. Therefore, gaining a detailed understanding of the temporal patterns of visitor engagement with exhibition elements—both across the general population and among different age cohorts—yields important insights for informing the design of more effective museum learning environments.

6.1. Theoretical and Practical Implications

This study advances the emerging field of mobile eye-tracking research by providing empirical evidence of visitor visual attention in a real-world museum context [49]. The application of mobile eye-tracking enabled the unobtrusive collection of fine-grained data on visitor gaze behavior in situ, providing insights that are largely inaccessible through traditional evaluation techniques [50]. This study advances the understanding of the relationship between exhibition elements and visitor interaction by placing the analysis of physical components in museum design at the forefront. Given that a fundamental objective of museums is to create experiences that engage visitors, encourage interaction with artifacts, and promote learning, the role of physical design is of critical importance.
From a technology perspective, the emerging calibration-free MET technology is also promising for maintaining acceptable accuracy in outdoor settings. Mobile eye tracking research in museum studies is an emerging method that has just begun to gain traction, as highlighted in recent studies [35,37]. Despite some limitations, mobile eye tracking is a powerful data collection method in museum experience research. This study contributes to an improved understanding of information processing in museum learning contexts by employing mobile eye-tracking technology. Through this exploratory investigation, we obtained novel insights into how visitors visually engage with and interpret exhibition content. While the interpretations derived from the current data require further empirical validation, the findings offer a level of granularity and ecological validity that would have been difficult to achieve using conventional research methods. For this reason, we recommend further application of mobile eye tracking as a particularly suited method to understand real-time visitor behaviors without intrusion in natural environments [9].
From a museum design perspective, this study identifies which exhibition elements elicit visitor interaction. It reveals interrelationships among these elements and the temporal dynamics of visitor engagement (e.g., order, sequence, and duration of interaction with exhibits, information panels, and videos). The findings of this study reinforce the imperative of tailoring exhibitions to diverse visitor profiles, rather than assuming a one-size-fits-all model of engagement. The heterogeneity observed in visual attention patterns across content types and exhibit elements suggests that visitors differ not only in their interests but also in their cognitive strategies, temporal pacing, and preferred modes of interaction. Designers are, therefore, encouraged to adopt a segmented, user-centered design approach that accounts for varying levels of prior knowledge, age, motivation, and attentional capacity. This process should begin with a data-informed understanding of the target audience, including demographic characteristics and behavioral preferences derived from empirical tools such as eye tracking, observational studies, and post-visit feedback.

6.2. Limitations and Future Works

Our study has some limitations within which our findings need to be interpreted carefully. One of the main limitations is that the results were obtained from a small sample size and did not consider segmented types of visitors from diverse backgrounds. Given the high dimensionality and richness of eye-tracking datasets, large sample sizes are rarely utilized [51], constraining the extent to which findings from small samples can be generalized. This challenge is particularly pronounced in the study of complex, ill-defined activities such as exhibition visits, where behavioral variability across individuals is substantial. Nevertheless, this exploratory study prioritizes the rich, contextual insights gained from real-world observation, thereby contributing to a more nuanced understanding of visitor behavior and cognitive engagement within museum settings. To address these limitations, future research should incorporate larger and more demographically diverse samples to enable comparative analysis across age groups, educational backgrounds, and cultural orientations. In addition to sample-related constraints, methodological factors inherent to mobile eye tracking warrant careful consideration. When interpreting these findings, it is important to acknowledge that participants were cognizant of having their gaze behavior recorded and may have altered their viewing patterns to appear more engaged or knowledgeable. Nevertheless, the substantial variability in visual exploration suggests that participants did not uniformly adopt a strategy of attending meticulously to every exhibit element.
Future research in the museum domain could leverage mobile eye tracking to address specific design and experiential challenges, such as optimizing exhibition layouts, improving interpretive media, and enhancing overall visitor flow and engagement. This methodology holds promise for supporting the development of novel exhibition concepts and the iterative refinement of existing displays, wayfinding systems, and visitor pathways. Mobile eye tracking may be a valuable tool for uncovering cognitive and behavioral processes that remain difficult to access through conventional post-visit surveys or interviews. By capturing real-time visual attention data in situ, researchers can gain deeper insights into how visitors navigate, interpret, and emotionally respond to complex cultural environments. Such insights can inform evidence-based design strategies that accommodate diverse visitor needs and support more meaningful, inclusive, and personalized museum experiences.

Author Contributions

Conceptualization, W.S. and K.O.; methodology, W.S.; software, W.S.; validation, W.S. and L.L.; formal analysis, W.S.; investigation, W.S.; resources, W.S. and K.O.; data curation, W.S. and L.L.; writing—original draft preparation, W.S.; writing—review and editing, W.S.; visualization, W.S.; supervision, K.O.; project administration, W.S. and K.O. All authors have read and agreed to the published version of the manuscript.

Funding

This research received no external funding.

Institutional Review Board Statement

The study was conducted in accordance with the Declaration of Helsinki, and the protocol was approved by the Ethics Committee of Hebei Normal University on 12 February 2025.

Informed Consent Statement

Informed consent was obtained form all subjects involved in the study.

Data Availability Statement

The data presented in this study are available in the article.

Conflicts of Interest

The authors declare no conflicts of interest.

Abbreviations

METMobile eye tracking
ROAFTRatio On-Target: All Fixation Time
TFDTotal fixation duration
AFDAverage fixation duration
TFFTime to first fixation

Appendix A

Table A1. Survey for visitors’ information.
NoDirectionQuestion
1Demographical Information1. Age
2. Gender
3. Education and Major
2Visiting an Archaeological Site Museum1. How often do you generally visit an Archaeological Site Museum in a normal year?
2. How interested are you in artifacts?
3. What is your purpose when visiting an Archaeological Site Museum?
(Images of Liang Zhu artifacts are presented)
3Interests of artifact1. Please write down what you are curious about the presented artifact.
2. Please write down the reason for your curiosity.

References

  1. Su, C.; Huang, M.; Zhang, J.; Yang, R. The Application of Eye Tracking on User Experience in Virtual Reality. In Proceedings of the 2023 IEEE 2nd International Conference on Cognitive Aspects of Virtual Reality (CVR), Veszprém, Hungary, 26–27 October 2023; IEEE: Veszprém, Hungary, 2023; pp. 000057–000062. [Google Scholar]
  2. Scott, N.; Zhang, R.; Le, D.; Moyle, B. A review of eye-tracking research in tourism. Curr. Issues Tour. 2019, 22, 1244–1261. [Google Scholar] [CrossRef]
  3. Buquet, C.; Charlier, J.R.; Paris, V. Museum application of an eye tracker. Med. Biol. Eng. Comput. 1988, 26, 277–281. [Google Scholar] [CrossRef] [PubMed]
  4. Horsley, M.; Eliot, M.; Knight, B.A.; Reilly, R. (Eds.) Current Trends in Eye Tracking Research; Springer International Publishing: Cham, Switzerland, 2014; ISBN 978-3-319-02867-5. [Google Scholar]
  5. Kastner, S.; Pinsk, M.A. Visual attention as a multilevel selection process. Cogn. Affect. Behav. Neurosci. 2004, 4, 483–500. [Google Scholar] [CrossRef] [PubMed]
  6. Duchowski, A.T. Eye Tracking Methodology: Theory and Practice, 2nd ed.; Springer: London, UK, 2007; ISBN 978-1-84628-608-7. [Google Scholar]
  7. Bojko, A. Eye Tracking the User Experience: A Practical Guide to Research; Rosenfeld Media: Brooklyn, NY, USA, 2013; ISBN 978-1-933820-10-1. [Google Scholar]
  8. Yalowitz, S.S.; Bronnenkant, K. Timing and Tracking: Unlocking Visitor Behavior. Visit. Stud. 2009, 12, 47–64. [Google Scholar] [CrossRef]
  9. Mayr, E.; Knipfer, K.; Wessel, D. In-Sights into Mobile Learning An Exploration of Mobile Eye Tracking Methodology for Learning in Museums. In Researching Mobile Learning: Frameworks, Tools and Research Designs; Peter Lang Verlag: Oxford, UK, 2009; pp. 189–204. [Google Scholar]
  10. Mokatren, M.; Kuflik, T. Exploring the potential contribution of mobile eye-tracking technology in enhancing the museum visit experience. In Proceedings of the 1st Workshop on Advanced Visual Interfaces for Cultural Heritage, AVI*CH 2016, Bari, Italy, 7–10 June 2016. [Google Scholar]
  11. Falk, J.H.; Dierking, L.D. Learning from Museums: Visitor Experiences and the Making of Meaning; American Association for State and Local History book series; AltaMira Press: Walnut Creek, CA, USA, 2000; ISBN 978-0-7425-0294-9. [Google Scholar]
  12. Falk, J.H.; Dierking, L.D. The Museum Experience Revisited; Routledge: London, UK; Taylor & Francis Group: New York, NY, USA, 2016; ISBN 978-1-61132-044-2. [Google Scholar]
  13. Hooper-Greenhill, E. Museums and the Interpretation of Visual Culture, 1st ed.; Routledge: London, UK, 2020; ISBN 978-1-00-312445-0. [Google Scholar]
  14. Bitgood, S. Environmental psychology in museums, zoos, and other exhibition centers. In Handbook of Environmental Psychology; John Wiley & Sons, Inc.: Hoboken, NJ, USA, 2002; pp. 461–480. [Google Scholar]
  15. Hein, G.E. Learning in the Museum; Routledge: London, UK, 2002. [Google Scholar]
  16. Black, G. (Ed.) The Engaging Museum: Developing Museums for Visitor Involvement; Taylor and Francis: Hoboken, NJ, USA, 2012; ISBN 978-0-415-34556-9. [Google Scholar]
  17. Pekarik, A.J.; Doering, Z.D.; Karns, D.A. Exploring Satisfying Experiences in Museums. Curator Mus. J. 1999, 42, 152–173. [Google Scholar] [CrossRef]
  18. Falk, J.H. Identity and the Museum Visitor Experience; Left Coast Press: Walnut Creek, CA, USA, 2009; ISBN 978-1-59874-162-9. [Google Scholar]
  19. Neuhofer, B.; Buhalis, D.; Ladkin, A. A Typology of Technology-Enhanced Tourism Experiences. Int. J. Tour. Res. 2014, 16, 340–350. [Google Scholar] [CrossRef]
  20. Tzortzi, K. Movement in museums: Mediating between museum intent and visitor experience. Mus. Manag. Curatorship 2014, 29, 327–348. [Google Scholar] [CrossRef]
  21. Simon, N. The Participatory Museum; Museum 2.0: Santa Cruz, CA, USA, 2010. [Google Scholar]
  22. Posner, M.I. Orienting of Attention. Q. J. Exp. Psychol. 1980, 32, 3–25. [Google Scholar] [CrossRef]
  23. Itti, L.; Koch, C. Computational modelling of visual attention. Nat. Rev. Neurosci. 2001, 2, 194–203. [Google Scholar] [CrossRef]
  24. Theeuwes, J. Top–down and bottom–up control of visual selection. Acta Psychol. 2010, 135, 77–99. [Google Scholar] [CrossRef]
  25. Henderson, J. Human gaze control during real-world scene perception. Trends Cogn. Sci. 2003, 7, 498–504. [Google Scholar] [CrossRef] [PubMed]
  26. Rayner, K. Eye Movements in Reading and Information Processing: 20 Years of Research. Psychol. Bull. 1998, 124, 372–422. [Google Scholar] [CrossRef] [PubMed]
  27. Vernet, M.; Kapoula, Z. Binocular motor coordination during saccades and fixations while reading: A magnitude and time analysis. J. Vis. 2009, 9, 2. [Google Scholar] [CrossRef] [PubMed]
  28. Duchowski, A.T. A breadth-first survey of eye-tracking applications. Behav. Res. Methods Instrum. Comput. 2002, 34, 455–470. [Google Scholar] [CrossRef]
  29. Klaib, A.F.; Alsrehin, N.O.; Melhem, W.Y.; Bashtawi, H.O.; Magableh, A.A. Eye tracking algorithms, techniques, tools, and applications with an emphasis on machine learning and Internet of Things technologies. Expert Syst. Appl. 2021, 166, 114037. [Google Scholar] [CrossRef]
  30. Nyström, M.; Holmqvist, K. An adaptive algorithm for fixation, saccade, and glissade detection in eyetracking data. Behav. Res. Methods 2010, 42, 188–204. [Google Scholar] [CrossRef]
  31. Chen, H.-C.; Wang, C.-C.; Hung, J.C.; Hsueh, C.-Y. Employing Eye Tracking to Study Visual Attention to Live Streaming: A Case Study of Facebook Live. Sustainability 2022, 14, 7494. [Google Scholar] [CrossRef]
  32. Carter, B.T.; Luke, S.G. Best practices in eye tracking research. Int. J. Psychophysiol. 2020, 155, 49–62. [Google Scholar] [CrossRef]
  33. Lai, M.-L.; Tsai, M.-J.; Yang, F.-Y.; Hsu, C.-Y.; Liu, T.-C.; Lee, S.W.-Y.; Lee, M.-H.; Chiou, G.-L.; Liang, J.-C.; Tsai, C.-C. A review of using eye-tracking technology in exploring learning from 2000 to 2012. Educ. Res. Rev. 2013, 10, 90–115. [Google Scholar] [CrossRef]
  34. Mokatren, M.; Kuflik, T.; Shimshoni, I. Exploring the potential of a mobile eye tracker as an intuitive indoor pointing device: A case study in cultural heritage. Future Gener. Comput. Syst. 2018, 81, 528–541. [Google Scholar] [CrossRef]
  35. Rainoldi, M.; Yu, C.-E.; Neuhofer, B. The Museum Learning Experience Through the Visitors’ Eyes: An Eye Tracking Exploration of the Physical Context. In Eye Tracking in Tourism; Rainoldi, M., Jooss, M., Eds.; Tourism on the Verge; Springer International Publishing: Cham, Switzerland, 2020; pp. 183–199. ISBN 978-3-030-49708-8. [Google Scholar]
  36. Sheng, C.-W.; Chen, M.-C. A study of experience expectations of museum visitors. Tour. Manag. 2012, 33, 53–60. [Google Scholar] [CrossRef]
  37. Krogh-Jespersen, S.; Quinn, K.A.; Krenzer, W.L.D.; Nguyen, C.; Greenslit, J.; Price, C.A. Exploring the awe-some: Mobile eye-tracking insights into awe in a science museum. PLoS ONE 2020, 15, e0239204. [Google Scholar] [CrossRef]
  38. Pelowski, M.; Leder, H.; Mitschke, V.; Specker, E.; Gerger, G.; Tinio, P.P.L.; Vaporova, E.; Bieg, T.; Husslein-Arco, A. Capturing Aesthetic Experiences With Installation Art: An Empirical Assessment of Emotion, Evaluations, and Mobile Eye Tracking in Olafur Eliasson’s “Baroque, Baroque!”. Front. Psychol. 2018, 9, 1255. [Google Scholar] [CrossRef] [PubMed]
  39. Eghbal-Azar, K.; Widlok, T. Potentials and Limitations of Mobile Eye Tracking in Visitor Studies: Evidence From Field Research at Two Museum Exhibitions in Germany. Soc. Sci. Comput. Rev. 2013, 31, 103–118. [Google Scholar] [CrossRef]
  40. Rainoldi, M.; Neuhofer, B.; Jooss, M. Mobile Eyetracking of Museum Learning Experiences. In Information and Communication Technologies in Tourism 2018; Stangl, B., Pesonen, J., Eds.; Springer International Publishing: Cham, Switzerland, 2018; pp. 473–485. ISBN 978-3-319-72922-0. [Google Scholar]
  41. Teo, T.W.; Loh, Z.H.J.; Kee, L.E.; Soh, G.; Wambeck, E. Mediational Affordances at a Science Centre Gallery: An Exploratory and Small Study Using Eye Tracking and Interviews. Res. Sci. Educ. 2024, 54, 775–795. [Google Scholar] [CrossRef]
  42. Land, M.; Tatler, B. Looking and ActingVision and Eye Movements in Natural Behaviour; Oxford University Press: Oxford, UK, 2009; ISBN 978-0-19-857094-3. [Google Scholar]
  43. Homavazir, T.G.; Parupudi, V.S.R.; Pilla, S.L.S.R.; Cosman, P. Slippage-robust linear features for eye tracking. Expert Syst. Appl. 2025, 264, 125799. [Google Scholar] [CrossRef]
  44. Holmqvist, K.; Nyström, M.; Andersson, R.; Dewhurst, R.; Jarodzka, H. Eye Tracking: A Comprehensive Guide to Methods and Measures; Oxford University Press: Oxford, UK, 2011. [Google Scholar]
  45. Sharafi, Z.; Shaffer, T.; Sharif, B.; Gueheneuc, Y.-G. Eye-Tracking Metrics in Software Engineering. In Proceedings of the 2015 Asia-Pacific Software Engineering Conference (APSEC), New Delhi, India, 1–4 December 2015; IEEE: New Delhi, India, 2015; pp. 96–103. [Google Scholar]
  46. Schwan, S.; Gussmann, M.; Gerjets, P.; Drecoll, A.; Feiber, A. Distribution of attention in a gallery segment on the National Socialists’ Führer cult: Diving deeper into visitors’ cognitive exhibition experiences using mobile eye tracking. Mus. Manag. Curatorship 2020, 35, 71–88. [Google Scholar] [CrossRef]
  47. Venkatraman, V.; Dimoka, A.; Vo, K.; Pavlou, P.A. Relative Effectiveness of Print and Digital Advertising: A Memory Perspective. J. Mark. Res. 2021, 58, 827–844. [Google Scholar] [CrossRef]
  48. Bitgood, S. The Role of Attention in Designing Effective Interpretive Labels. J. Interpret. Res. 2000, 5, 31–45. [Google Scholar] [CrossRef]
  49. Jung, Y.J.; Zimmerman, H.T.; Pérez-Edgar, K. A Methodological Case Study with Mobile Eye-Tracking of Child Interaction in a Science Museum. TechTrends 2018, 62, 509–517. [Google Scholar] [CrossRef]
  50. Fantoni, S.F.; Jaebker, K.; Bauer, D.; Stofer, K. Capturing Visitors’ Gazes: Three Eye Tracking Studies in Museums. In Proceedings of the Annual Conference of Museums and the Web, Portland, OR, USA, 17–20 April 2013. [Google Scholar]
  51. Wooding, D.S. Fixation Maps: Quantifying Eye-movement Traces. In Proceedings of the Eye Tracking Research & Application Symposium, ETRA 2002, New Orleans, LA, USA, 25–27 March 2002. [Google Scholar]
Figure 1. Overview of research methodology.
Electronics 14 02208 g001
Figure 2. An example photo of a person wearing the Tobii Pro Glasses 3 (www.tobii.com) and a schematic of the Glasses 3 with info. The individual pictured in Figure 2 has provided written informed consent to publish their image alongside the manuscript.
Electronics 14 02208 g002
Figure 3. Definition of Areas of Interest (AOIs) for Exhibition Modules in Tobii Pro Lab.
Electronics 14 02208 g003
Figure 4. Visual representation of the correlation between different AOIs. Note: TFF = Time to First Fixation; TFD = Total Fixation Duration; AFD = Average Fixation Duration; time in seconds; screen = video screen.
Electronics 14 02208 g004
Figure 5. The effect of display elements on TFF. The difference in legibility between the two stroke weights, respectively, for the two letter spacings. The error bar represents the standard error. * Indicates p < 0.05.
Electronics 14 02208 g005
Figure 6. Mean ROAFT (%) across exhibit element types and individual exhibits.
Electronics 14 02208 g006
Table 1. Studies Employing Mobile Eye-Tracking Technology in Visitor Research.
Article (Author/Title /Year)Research QuestionsMethodsConclusions and Key Contribution
Mayr, Knipfer & Wessel: In-Sights into Mobile Learning An Exploration of Mobile Eye Tracking Methodology for Learning in Museums (2009) [9]What are the methodological challenges and opportunities of applying mobile eye tracking (MET) to investigate informal learning in museum–like settings?Device: ASL MobileEye head-mounted eye tracker (one scene camera + one eye camera; 30 Hz sampling)
Participants: n = 3 adult volunteers
Location: Nanotechnology mini-exhibition at a research institute
Procedure: Calibration → 17–57 min naturalistic exploration with synchronous video + gaze overlay → post-visit interview; video coded in Video graph
MET captured natural in situ gaze paths and fixation durations.
Triangulating gaze data with interviews enriched understanding of exploratory learning behaviors. Methodological Innovation: First systematic deployment of head-mounted eye tracking in a museum-like exhibition, demonstrating the feasibility of capturing naturalistic gaze paths in situ.
Eghbal-Azar & Widlok: Potentials and Limitations of Mobile Eye Tracking in Visitor Studies: Evidence From Field Research at Two Museum Exhibitions in Germany (2013) [39]How feasible is MET for collecting valid gaze data under real-world museum conditions?
Which contextual factors impede data quality and interpretation?
Devices: ASL MobileEye and Locarna PT Mini (25 Hz sampling)
Participants: n = 16 (8 experts + 8 novices)
Locations: Two thematic exhibitions in Germany
Procedure: On-site calibration; free-flow recordings (12–76 min per visitor); manual post-processing to generate gaze-overlaid video
MET produced high-resolution heatmaps and scan-path data in authentic settings.
Core gaze patterns consistent across venues. Field Validation: Conducted dual-site deployments (cultural and science exhibitions), establishing MET’s robustness across heterogeneous museum contexts.
Mokatren & Kuflik: Exploring the potential contribution of mobile eye-tracking technology in enhancing the museum visit experience (2016) [10]How can MET inform gaze-based mobile guide design?
How do visual strategies differ across physical objects, projections, and multimedia installations?
Device: Pupil Dev mobile eye-tracker
Participants: n = 5 (grid-test); n = 1 (prototype evaluation)
Location: Hecht Museum, University of Haifa
Procedure: Accuracy/precision grid test; single volunteer exhibit exploration; prototype evaluation
In this work-in-progress, they have demonstrated the feasibility of employing mobile eye tracking to enrich the museum visit experience. Applied Prototype Development: Demonstrated how MET can drive “gaze-triggered” mobile guides by evaluating Pupil Labs hardware performance and latency in real exhibit conditions.
Rainoldi, Neuhofer & Jooss: Mobile Eye tracking of Museum Learning Experiences (2019) [40]How is the museum learning experience contextually influenced by the surrounding physical context of the visitor?Device: Tobii Pro Glasses 2 (4 eye cameras + scene camera; 100 Hz)
Participants: n = 31 recruited; n = 24 valid after exclusions
Location: Special exhibition, Salzburg Museum, Austria
Procedure: Pre-visit survey; free-flow MET; post-visit survey; gaze data mapped to floor plan → heatmaps
Gaze hotspots aligned with key exhibit features, supporting contextual learning theory.
Introduced room-by-room heatmap aggregation mapped onto floor plans, providing an emic perspective on how spatial arrangement shapes visitor attention.
Krogh-Jespersen et al.: Exploring the awe-some: Mobile eye-tracking insights into awe in a science museum (2020) [37]Can “awe” be quantified via MET indicators?
Which exhibits elicit awe-related gaze patterns?
Device: Tobii Pro Glasses 2 (4 eye cameras + scene camera; 100 Hz)
Participants: n = 31 guests (15 Rotunda, 16 submarine)
Location: Museum of Science and Industry, Chicago, USA
Procedure: Between-subjects design; calibration; free-flow exploration; post-visit situational awe scale; frame-by-frame AOI coding
High awe ratings are associated with increased fixation durations and AOI-switching. Immersive exhibits most effectively elicited awe.
Emotion-Vision Mapping: Pioneered integration of real-time situational awe self-reports with concurrent MET, enabling dissection of gaze correlates of complex emotional states in museum visitors.
Teo, Loh, Kee et al.: Mediational Affordances at a Science Centre Gallery: An Exploratory and Small Study Using Eye Tracking and Interviews (2024) [41]How do the visitors interact with the artifacts, and how do the artefacts mediate the experiences of the visitors in the Energy Story gallery at the science center?Device: Dikablis mobile eye tracker (scene + eye camera)
Participants: N = 16 recruited; N = 15 valid
Location: Energy Story gallery, Science Centre Singapore
Procedure: Calibration; sequential exploration of three interactive stations (8–10 min each); concurrent MET + audio; post-visit interviews
The study suggests that overloading a single artifact with multiple affordances may impede engagement, whereas distributing interactivity across several artifacts can optimize visitor experience. Mixed-Methods Model: Combined high-resolution MET trajectories with thematic interview data to formulate a three-phase “Perceive–Explore–Understand” model of visitor meaning-making in interactive STEM exhibits.
Table 2. Descriptive statistics of eye-tracking metrics.
TFF TFDAFD
[Min, Max]MMM
(SD)(SD)(SD)
Artifacts[3.53, 61.48]31.7729.321.77
(21.66)(19.03)(0.97)
Artifacts label[4.00, 74.86]47.577.821.51
(24.13)(7.20)(1.32)
Picture Panels[8.47, 58.80]27.9440.140.85
(17.00)(30.17)(0.40)
Text Panels[0, 22.12]7.6929.811.36
(6.84)(27.03)(0.84)
Video Screen[0.13, 112.16]39.1953.690.62
(41.15)(65.12)(0.33)
Note: TFF = Time to First Fixation; TFD = Total Fixation Duration; AFD = Average Fixation Duration; time in seconds.
Table 3. Results of ROAFT between the five exhibit modules.
Exhibits 01Exhibits 02Exhibits 03Exhibits 04Exhibits 05
ElementsMSDMSDMSDMSDMSD
ROAFTArtifacts0.190.10.20.10.190.110.20.20.710.11
Labels0.100.110.00.020.10.180.050.060.030.04
Picture panel0.210.140.680.200.070.090.140.100.210.20
Text panel0.460.110.000.000.250.310.220.280.320.27
Screen0.000.000.140.040.360.190.120.110.230.12
Disclaimer/Publisher’s Note: The statements, opinions and data contained in all publications are solely those of the individual author(s) and contributor(s) and not of MDPI and/or the editor(s). MDPI and/or the editor(s) disclaim responsibility for any injury to people or property resulting from any ideas, methods, instructions or products referred to in the content.

