Article

Learning to Utilize Multi-Scale Feature Information for Crisp Power Line Detection

1
State Grid Jibei Electric Power Co., Ltd., Ultra High Voltage Branch, Beijing 102488, China
2
State Grid Jibei Electric Power Co., Ltd., Beijing 100054, China
3
School of Microelectronics, Tianjin University, Tianjin 300072, China
*
Authors to whom correspondence should be addressed.
Electronics 2025, 14(11), 2175; https://doi.org/10.3390/electronics14112175
Submission received: 28 March 2025 / Revised: 25 May 2025 / Accepted: 26 May 2025 / Published: 27 May 2025

Abstract

Power line detection (PLD) is a crucial task in the electric power industry where accurate PLD forms the foundation for achieving automated inspections. However, recent top-performing power line detection methods tend to generate thick and noisy edge lines, adding to the difficulties of subsequent tasks. In this work, we propose a multi-scale feature-based PLD method named LUM-Net to allow for the detection of power lines in a crisp and precise way. The algorithm utilizes EfficientNetV1 as the backbone network, ensuring effective feature extraction across various scales. We developed a Coordinated Convolutional Block Attention Module (CoCBAM) to focus on critical features by emphasizing both channel-wise and spatial information, thereby refining the power lines and reducing noise. Furthermore, we constructed the Bi-Large Kernel Convolutional Block (BiLKB) as the decoder, leveraging large kernel convolutions and spatial selection mechanisms to capture more contextual information, supplemented by auxiliary small kernels to refine the extracted feature information. By integrating these advanced components into a top-down dense connection mechanism, our method achieves effective, multi-scale information interaction, significantly improving the overall performance. The experimental results show that our method can predict crisp power line maps and achieve state-of-the-art performance on the PLDU dataset (ODS = 0.969) and PLDM dataset (ODS = 0.943).

1. Introduction

Power lines form the critical backbone of modern electricity distribution networks, facilitating the transfer of electricity from generation facilities to end users across vast geographical areas. The reliability and integrity of these networks directly impact national economic development, industrial production, and the daily lives of billions of people worldwide. With the increasing global demand for electricity and the rapid expansion of power grid infrastructure, the efficient inspection and maintenance of power lines have become paramount to ensure uninterrupted power supply and prevent catastrophic failures. The detection and monitoring of power lines represent a fundamental component of this maintenance process, enabling the early identification of potential hazards such as vegetation encroachment, structural damage, and insulator deterioration.
Traditional power line detection (PLD) methods predominantly rely on manual inspection procedures that are labor-intensive and time-consuming and pose safety risks to personnel [1]. In response to these challenges, the industry has increasingly turned to Unmanned Aerial Vehicles (UAVs) as an advanced alternative for automated inspection. These aerial platforms deliver enhanced observational capabilities with greater efficiency, providing access to previously difficult-to-reach heights and hazardous locations that would otherwise put human inspectors at considerable risk. The deployment of UAV technology represents a significant advancement in the PLD field, fundamentally transforming the approach to safety monitoring [2]. Furthermore, to optimize operational outcomes and resource utilization in inspection processes, significant research efforts have been directed toward automating the analysis of UAV-acquired data. This automation primarily focuses on processing RGB camera imagery collected during flight missions, enabling the more systematic evaluation of power line conditions without extensive human intervention [3]. To achieve this goal, several automatic solutions have recently been proposed, which span from traditional gradient-based methods [4,5] to advanced deep learning methods [6,7] employing convolutional neural networks (CNNs). Traditional gradient-based methods rely primarily on local intensity changes to detect edges, which presents several limitations for the PLD in complex scenarios. First, these methods struggle with varying lighting conditions and backgrounds commonly encountered in aerial imagery, often resulting in numerous false positives from similar linear structures like roads and building edges. Second, gradient-based approaches lack the contextual understanding necessary to distinguish power lines from visually similar objects, as they operate on pixel-level information without considering broader semantic features. Third, these methods demonstrate poor robustness against noise and occlusions from vegetation or structures, which frequently interrupt the continuity of power lines in real-world imagery. In contrast, deep learning methods employing CNNs overcome these limitations through their hierarchical feature learning capabilities, allowing them to capture both low-level edge information and high-level contextual cues. This enables more accurate discrimination between power lines and similar-appearing structures across diverse environmental conditions. The evolution of these methods has substantially improved the automation and accuracy of PLD, enabling more reliable identification of power line components, defects, and potential hazards across varying environmental conditions and complex backgrounds. Simultaneously, remarkable advancements in UAV hardware technologies have expanded data acquisition capabilities while reducing operational constraints. Modern UAVs can now capture detailed imagery even in challenging weather conditions and maintain precise flight paths along power corridors, providing consistently high-quality visual data essential for deep learning algorithms. This algorithmic progress, combined with these sophisticated aerial imaging platforms, forms the foundation of contemporary power line inspection systems that offer enhanced efficiency, comprehensive coverage, and improved worker safety.
Despite the significant advancements in PLD, current methods still face the challenge of generating excessively thick power line maps, which hinder their widespread practical implementation. This limitation can be attributed to the following two primary aspects: (1) Imbalanced pixel distribution. Power lines typically occupy only a few pixels in aerial images, while irrelevant background pixels constitute a significant majority of the image content. This severe class imbalance poses substantial challenges for classification, as the model must discriminate between the sparse target features and the overwhelming proportion of background elements. Consequently, the model often compensates for this imbalance by generating excessively thick line representations, compromising the precision of the power line locations. (2) Inadequate utilization of multi-scale features. Traditional deep CNNs typically rely on fixed-size receptive fields when processing features at different scales. This limitation can lead to an inability to capture multi-scale information when extracting power line features, thus reducing the accuracy of PLD. In addition, many existing methods fail to integrate features from different scales properly, leading to information loss. For example, high-level features often contain rich semantic information but lack fine details, while low-level features provide more detailed information but have weaker semantic representation. Without the proper fusion of these hierarchical features, achieving high-precision and reliable detection results becomes difficult.
In response to these challenges, we propose a U-shape architecture named LUM-Net that can generate clean and thin power line maps. Specifically, to address issue (1), we designed the Coordinated Convolutional Block Attention Module (CoCBAM). This module combines a channel attention module (CAM) and a spatial attention module (SAM) to enhance focus on power line pixels while suppressing background noise pixels. The CAM emphasizes important semantic information by weighting different feature channels, while the SAM highlights specific spatial locations to pinpoint the precise position of power lines. On the other hand, to address issue (2), we built the Bi-Large Kernel Convolutional Block (BiLKB) as the decoder, which utilizes large convolutional kernels to achieve feature decoding with a broader receptive field, supplemented by auxiliary small kernels to refine the extracted feature information. This design allows the model to capture large-scale contextual information while maintaining fine-grained details. The Large Kernel Block (LKB) employs a series of large convolutional kernels and a spatial kernel selection mechanism to enable spatial selection across different scale features. The Small Kernel Rectification (SKR) module employs 3 × 3 convolutions to refine the detailed information extracted by the Large Kernel Fusion (LKF) module, ensuring that the predicted power line maps are both clean and thin.
In addition, to fully utilize multi-scale features, a dense connection mechanism was introduced into the decoder that can enhance the detection of power lines by effectively combining deep semantic information with shallow detail information. In the decoder stage, we added decoded results from deeper layers element-wise to the input features of shallower decoders. This fusion strategy leverages the rich contextual information from deeper networks to suppress noise pixels while preserving detailed spatial information from shallower layers. Transposed convolution upsampling was employed to enlarge the resolution of feature maps, followed by batch normalization and ReLU activation.
It is worth noting that our work on precise PLD complements recent advancements in deep learning-based fault detection approaches, such as those presented in [8]. While these approaches focus on constructing health indicators (HIs) and probabilistic remaining useful life (RUL) prediction for mechanical systems like rolling bearings, our approach provides a critical foundation for electrical system maintenance by enabling highly accurate power line mapping. Specifically, the clean and thin power line maps generated by LUM-Net can serve as high-quality baseline data for subsequent electrical fault detection algorithms, similar to how the dual-channel architecture with Convolutional Block Attention Module (CBAM) [9] enhances feature extraction in mechanical systems. By integrating our precise PLD method with advanced fault detection systems, power grid operators can implement a more comprehensive and proactive maintenance strategy, potentially reducing system failures, maintenance costs, and improving overall grid reliability. This integration of precise visual detection with prognostic health management represents a promising direction for future research in power system maintenance and reliability engineering.
In summary, the main contributions of our work can be summarized as follows:
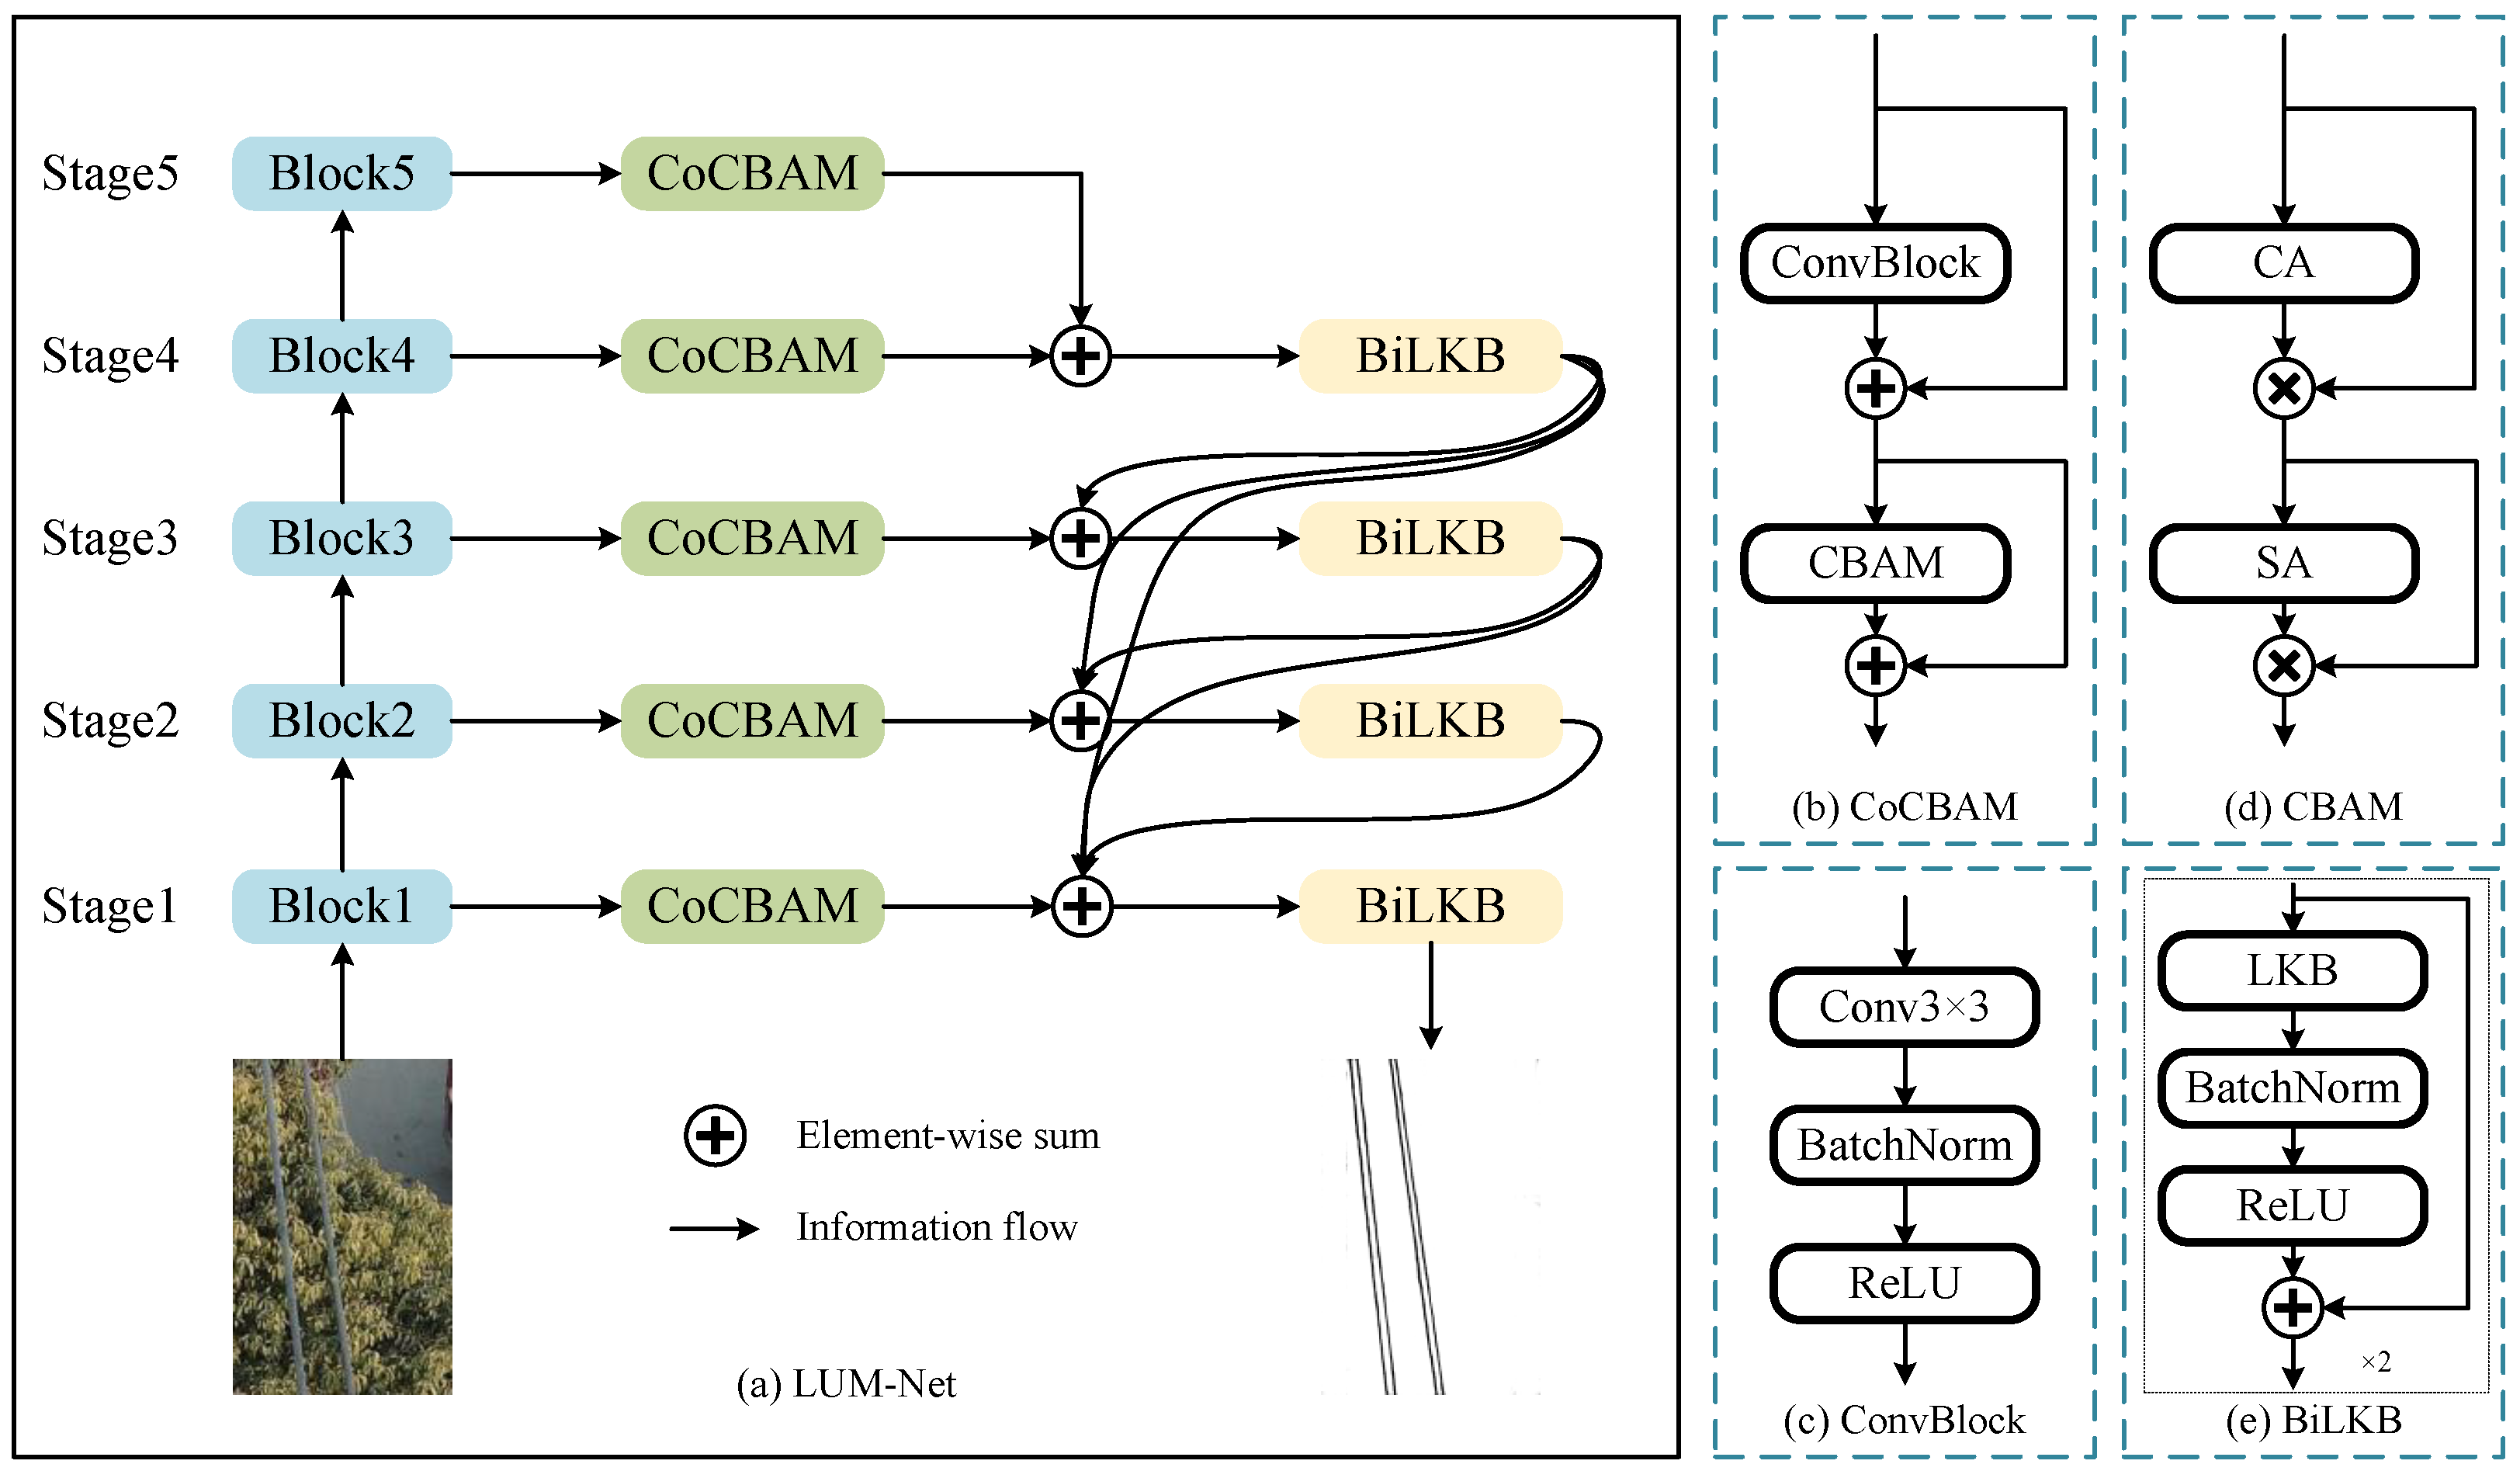
  • We propose the Coordinated Convolutional Block Attention Module (CoCBAM). This module selectively focuses on critical features by emphasizing both channel and spatial information, thereby refining the power lines and reducing noise.
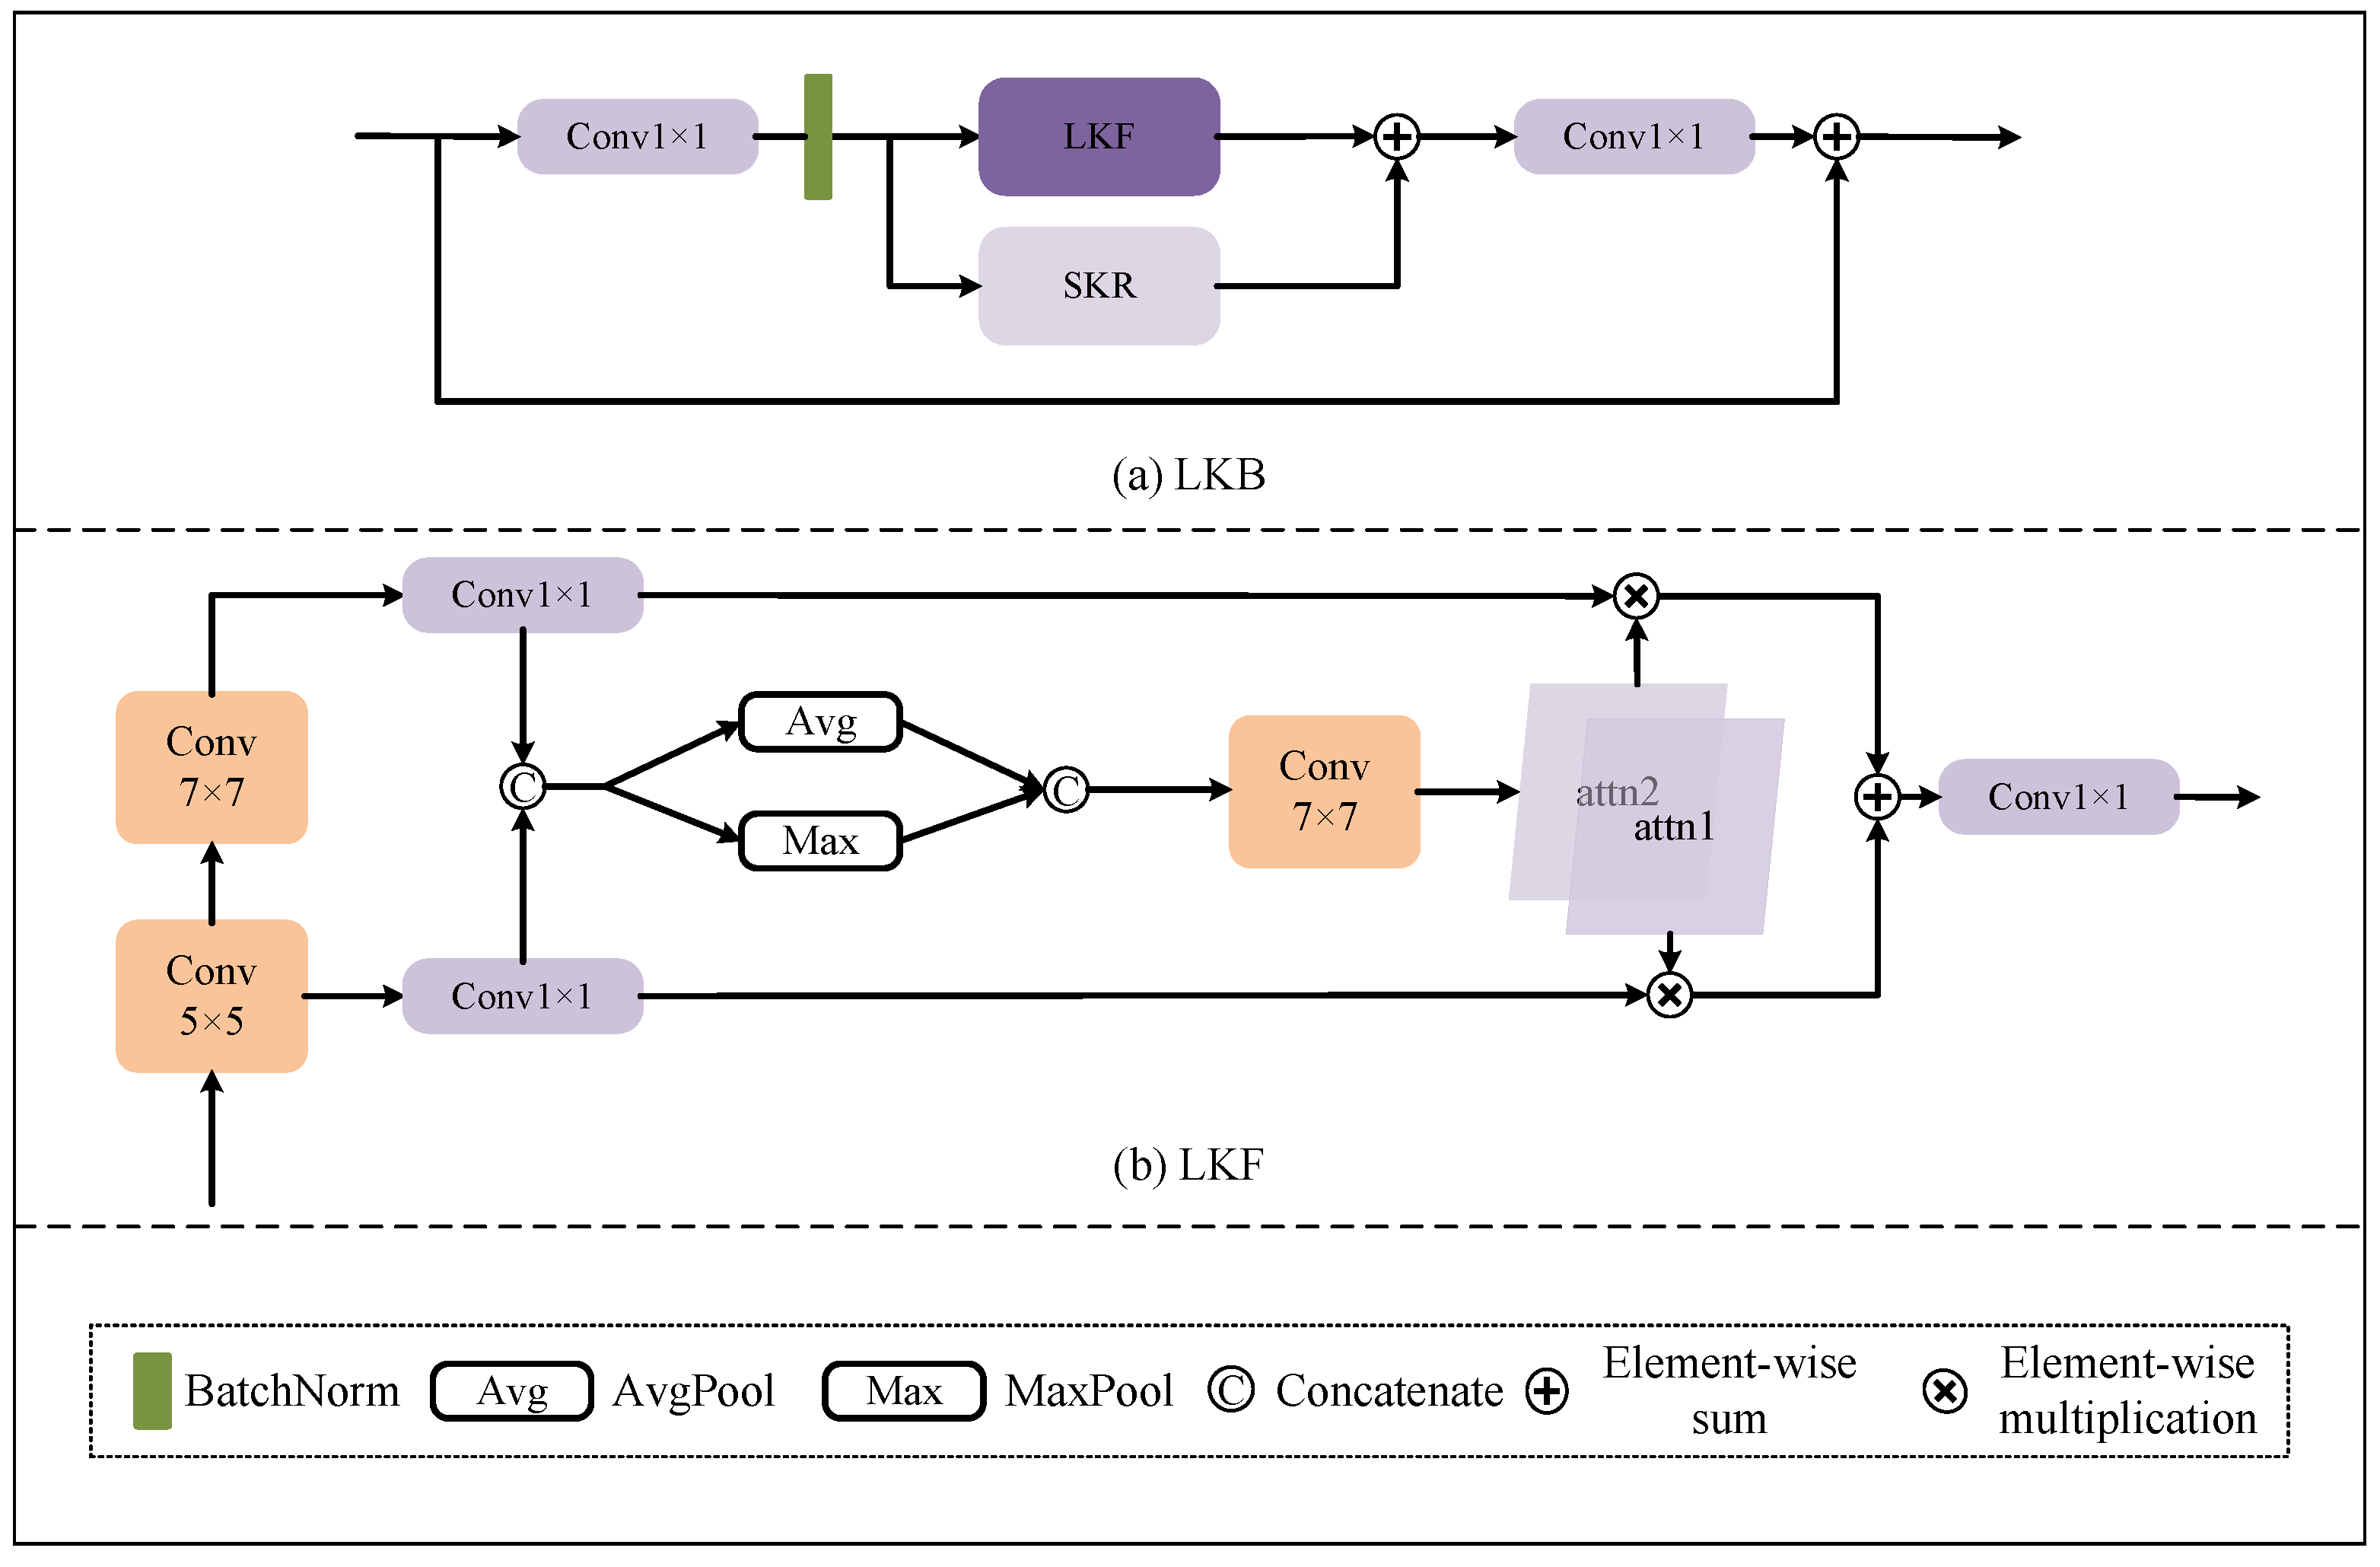
  • We designed the Bi-Large Kernel Convolutional Block (BiLKB) module as the decoder, utilizing larger convolutional kernels to achieve feature decoding with a broader receptive field, supplemented by auxiliary small kernels to refine the extracted feature information.
  • We constructed a U-shape encoder–decoder network named LUM-Net, which consists of the above key components and can predict clean power line maps. The high-precision mapping capability of LUM-Net demonstrates substantial engineering value by enabling automated UAV inspection systems.

2. Related Work

2.1. UAVs for PLD

PLD technology has evolved significantly from traditional manual inspection methods to modern, automated approaches. Traditional manual inspection procedures involve field technicians physically examining power line infrastructure, often requiring work at dangerous heights and in challenging terrains and hazardous conditions [1]. These conventional approaches present several critical limitations. They are extremely labor-intensive and time-consuming, pose significant safety risks to maintenance personnel, and cannot provide comprehensive coverage of extensive power grid networks efficiently.
The introduction of UAVs represents a fundamental shift in PLD methodology. Similar to recent advancements in construction monitoring applications, such as the rebar-counting model for reinforced concrete columns using UAVs and deep learning approaches [10], UAV-based systems offer enhanced observational capabilities with greater efficiency. These aerial platforms provide access to previously difficult-to-reach heights and hazardous locations while eliminating direct safety risks to human inspectors.

2.2. Deep Learning Application for PLD

PLD technology has progressed from traditional image processing and computer vision methods to the modern use of multiple sensor data (such as LiDAR, SAR, thermal imaging, etc.) and deep learning algorithms. Early research concentrated on using satellite imagery or aerial photogrammetry to monitor power line corridors. However, as technology has advanced, the focus has gradually shifted to more precise detection methods. This includes the employment of unmanned aerial vehicles (UAVs) for high-resolution image acquisition, combined with advanced image processing and machine learning techniques to enhance detection accuracy. LiDAR equipment is more expensive and cannot adapt to the changing PLD environment. Therefore, research on power line extraction primarily relies on optical images.
Traditional image-based PLD methods primarily rely on low-level local features and the design of operators based on prior gradient-based knowledge, such as Canny [4] and Sobel [11], to detect edge information. Subsequently, they employ the Hough transform and hand-designed filters to identify local power line elements. Finally, discrete primitives are connected into complete line segments through perceptual grouping. In 2002, to address the issue of detecting thin wires amid image clutter and noise, Kasturi et al. [12] proposed an approach that included an algorithm for sub-pixel edge detection suggested by Steger, followed by post-processing to reduce false alarms. In 2007, Yan et al. [13] analyzed the characteristics of imaged power lines and introduced an algorithm to extract power lines from aerial images automatically. This method first utilized a Radon transform to extract line segments of the power lines, then employed a grouping method to link each segment, and, finally, applied Kalman filter technology to connect the segments into a complete line. To detect power lines against a cluttered background, Li et al. [14] proposed a novel method in 2010 that developed a pulse-coupled neural filter to eliminate background noise and create an edge map before using the Hough transform to detect straight lines. In 2014, Song et al. [15] proposed a sequential local-to-global PLD algorithm, which can detect not only straight power lines but also curved ones. The local criterion used morphological filtering to obtain an edge map image, which was computed based on a matched filter and first-order difference of Gaussian. The global criterion grouped the line segments into whole power lines, which was formulated as a graph-cut model based on graph theory.
Although traditional image-based PLD methods can capture the characteristics of part of the power line, due to the complex background in the natural environment, the change in illumination, and the relatively small power line itself, these methods usually have difficultly distinguishing the difference between the power line and the background, resulting in low detection accuracy. With the development of deep learning, CNNs have been widely used in the field of electric power. In 2016, Pan et al. [16] proposed an accurate and robust PLD method wherein background noise was mitigated by an embedded CNN classifier before conducting the final power line extractions. In 2017, Gubbi et al. [17] proposed a CNN that directly used the Histogram of Gradient features as the input instead of the image itself to ensure the capture of accurate line features. In 2017, Madaan et al. [18] leveraged the recent advances in deep learning by treating wire detection as a semantic segmentation task and found an optimal model for detection accuracy and real-time performance on a portable GPU. In 2018, Yetgin et al. [19] experimented with a CNN, which was pre-trained on ImageNet in an end-to-end fashion, and extracted features from the intermediate stages of CNNs, feeding them to various classifiers. In 2019, Zhang et al. [6] developed an accurate PLD method using convolutional and structured features that fully exploited multiscale and structured prior information to conduct correct and efficient detection. In 2021, Jaffari et al. [20] proposed a generalized focal loss function based on the Matthews correlation coefficient (MCC) or the Phi coefficient to address the class imbalance problem in PL segmentation while utilizing a generic deep segmentation architecture. The work also improved the vanilla U-Net model with an additional convolutional auxiliary classifier head (ACU-Net) for better learning and faster model convergence. In 2023, Abdelfattah et al. [21] presented PLGAN based on generative adversarial networks to segment power lines from aerial images with different backgrounds, which took certain decoding features and embedded them into another semantic segmentation network by considering more context, geometry, and appearance information of power lines. In 2024, Duy Khoi Tran et al. [7] proposed LSNetV2 from weak supervision and polyline annotations, which enhanced LSNet with multi-line segment detection capability facilitated via a bipartite matching loss and increased receptive field to extract global information.

2.3. Deep Learning Application for Other Fields

Recent advancements in deep learning have demonstrated remarkable success across various domains, particularly in construction and infrastructure monitoring. Wang et al. [10] developed a rebar-counting model for reinforced concrete columns using unmanned aerial vehicles and deep learning approaches, achieving 94.61% accuracy under diverse conditions, including non-uniform illumination and complex backgrounds. Similar success has been reported in concrete crack detection [22], construction worker safety monitoring [23], and building defect identification [24], where deep learning methods consistently outperformed traditional computer vision approaches. These construction applications share significant parallels with power line detection, as both tasks involve identifying linear structures against complex backgrounds using aerial imagery.
Furthermore, deep learning has shown promising results in medical image analysis for detecting thin structures such as blood vessels [25] and neural pathways [26], remote sensing for identifying linear infrastructure features, and the semantic segmentation of power grid components [27]. These cross-domain successes demonstrate the generalizability of deep learning architectures for detecting linear features in complex scenarios, providing a strong theoretical and empirical foundation for applying similar methodologies to power line detection tasks. The consistent superior performance across diverse applications underscores the potential for addressing the specific challenges inherent in automated inspection systems.

3. Methodology

3.1. Network Architecture

LUM-Net is based on a U-shape encoder–decoder network for crisp PLD. The overall architecture is illustrated in Figure 1. In the encoder, we employed the lightweight EfficientNetV1 [28] model as the backbone network, enabling effective feature extraction across multiple scales. It captures rich details and semantic information at different levels by dividing the network into five stages (Block1-Block5). At skip connections, to enhance the focus on power line features and facilitate their extraction against complex backgrounds, we utilized the CoCBAM to increase the weight of extracted power line features. The decoder consists of the BiLKB, which employs larger convolution kernels to achieve feature decoding with a broader receptive field while simultaneously using auxiliary small convolution kernels to refine the extracted feature information. Additionally, we incorporated a dense connection mechanism into the decoder, which facilitates direct information flow between non-adjacent layers, thereby enhancing feature propagation and achieving accurate PLD.

3.2. CoCBAM Module

Given the challenge of blurred edges in PLD, where the background noise and irrelevant features can interfere with the detection process, the CoCBAM we designed is based on channel attention (CA) and spatial attention (SA). This module calibrates feature representations by cascading a conventional ConvBlock with the CBAM [9], which emphasizes power line features and facilitates the extraction of power line pixels in complex backgrounds.
The architecture of the CoCBAM is illustrated in Figure 1b. It consists of two fundamental components, ConvBlock and CBAM, integrated with residual connections. This module aims to enhance the representation of critical features by incorporating CBAM into CNNs. Specifically, the architecture of ConvBlock is shown in Figure 1c, which consists of a 3 × 3 convolution kernel, a batch normalization layer, and a ReLU activation function. These components work together to refine the feature representation, reducing noise interference and enhancing the clarity of power line maps. The CBAM integrates two attention mechanisms: a channel attention mechanism and a spatial attention mechanism. The detailed structure of the CBAM is depicted in Figure 1d; it can help the network focus more attentively on relevant information from both channel and spatial perspectives, thereby effectively filtering out background noise pixels that contribute minimally to the discriminative task, enabling it to distinguish power line features.
In the channel attention branch, CBAM utilizes global average pooling and maximum pooling operations to generate channel-wise statistics, which are then processed through shared, multi-layer perceptrons to produce channel attention maps that highlight informative feature channels. Concurrently, the spatial attention mechanism leverages both average-pooled and max-pooled features across the channel dimension to create a spatial attention map that identifies salient regions within the feature space. By multiplicatively applying these attention maps to the original features, CBAM effectively recalibrates the feature representations, allowing the network to selectively emphasize significant features while suppressing less informative ones, thus enhancing the representational capacity of CNNs without substantial computational overhead.
The CoCBAM module addresses the challenge of background noise and irrelevant features by leveraging the strengths of its components. The ConvBlock refines feature extraction, the CBAM enhances feature representation through channel and spatial attention mechanisms, and the residual connections ensure robust feature fusion. Collectively, these components enable the network to effectively suppress background interference, preserve thin power line features, and generate clear and continuous edges, even in complex environments.

3.3. BiLKB Module

Given the limitation of traditional deep convolutional networks that typically rely on fixed-size receptive fields when processing features at different scales, these networks often struggle to capture multi-scale information effectively. This shortcoming can significantly impact the comprehensiveness and accuracy of power line feature extraction. We propose the BiLKB as part of the decoder to overcome such shortcomings. The BiLKB module is specifically designed to enhance feature extraction by expanding the receptive field [29] and refining feature decoding, thereby improving the detection of power lines even in challenging conditions.
The BiLKB module, illustrated in Figure 1e, employs a residual structure that sequentially connects two LKBs with batch normalization layers and a ReLU activation function. This residual design helps mitigate the risk of vanishing gradients, ensuring that deeper layers can still contribute meaningful information to the final feature maps. It also facilitates better gradient flow, enabling more effective training and improved feature extraction across multiple scales.
As for the LKB module, as shown in Figure 2, it consists of a 1 × 1 convolution, a GELU activation function, an LKF module, a SKR module, and another 1 × 1 convolution for information fusion. The core LKF module comprises a series of large kernel convolutions and a spatial kernel selection mechanism, enabling spatial selection across different scale features. The SKR module utilizes 3 × 3 convolutions to refine the detailed information. These smaller kernels are particularly useful for capturing fine details and ensuring that the power lines are accurately delineated.
The LKF module first utilizes a standard 5 × 5 depthwise convolution and a 7 × 7 depthwise dilated convolution with dilation rate r = 3 to extract spatial features. These large kernels allow the network to capture a broader context around each pixel, which is crucial for distinguishing power lines from background elements that may share similar color and shape characteristics. Here, two depthwise dilated convolutions are sequentially connected instead of using a single large kernel convolution. This approach achieves an expanded receptive field while reducing the model parameters. As shown in (1), feature information F 1 is extracted through a 5 × 5 depthwise dilated convolution, and feature information F 2 is extracted through both a 5 × 5 and a 7 × 7 depthwise dilated convolution. The two feature maps are then concatenated, denoted by [;], resulting in F.
F = [ F 1 ; F 2 ]
Subsequently, a spatial selection mechanism is employed to select spatial features from the feature maps obtained by different scale convolutions. This spatial kernel selection mechanism involves average pooling and max pooling operations along the channel dimension, followed by a 7 × 7 convolution and sigmoid activation to generate spatial selection masks. These masks help the network prioritize important spatial locations, further enhancing the ability to decode accurate power line features. The implementation of the spatial selection mechanism is as follows: for the concatenated result of the two-scale feature information F, average pooling and max pooling are applied along the channel dimension, as shown in (2) and (3). Let P a v g and P m a x represent spatial average pooling and max pooling operations, respectively, resulting in f a v g and f m a x .
f a v g = P a v g ( F )
f max = P max ( F )
To enable interaction between features extracted by different spatial operations, the obtained spatially pooled features are concatenated and passed through a 7 × 7 convolution operation for feature interaction, followed by a sigmoid activation function, as shown in (4). Let σ denote the 7 × 7 convolution and sigmoid operation, resulting in a tensor that can be split along the channel dimension into separate spatial selection masks for the two different scale features’ information, denoted as a t t n 1 and a t t n 2 .
f = σ [ f a v g ; f max ] = [ a t t n 1 ; a t t n 2 ]
Finally, the two extracted feature maps of different scales, F 1 and F 2 , are passed through 1 × 1 convolutions to halve the number of channels, as shown in (5) and (6), resulting in F 1 and F 2 .
F 1 = c o n v 1 × 1 ( F 1 )
F 2 = c o n v 1 × 1 ( F 2 )
These are then element-wise multiplied with their corresponding spatial selection masks a t t n 1 and a t t n 2 and restored to the original number of channels through another 1 × 1 convolution operation, as shown in (7), resulting in the final feature maps after spatial selection y.
y = c o n v 1 × 1 [ a t t n 1 × F 1 + a t t n 2 × F 2 ]
Combining large and small kernels, the BiLKB module balances broad contextual understanding and detailed feature refinement, which is essential for high-precision PLD.

3.4. Dense Connection

During the decoder stage, to generate finer power line maps, we utilized a dense connection mechanism that adds the decoded results from deeper layers element-wise to the input features of shallower decoders. This utilizes the semantic information extracted by deeper networks to suppress noise pixels, fusing deep semantic information and shallow detail information. This structure uses transposed convolution [30] operations, batch normalization, and ReLU activation functions to enlarge the feature map sizes.
The dense connection mechanism is shown in the decoder part of Figure 1a. The semantic features from the fifth layer are upsampled by a factor of two through transposed convolution and added to the semantic features of the fourth layer, which are then fed into the decoder, as shown in (8), resulting in the decoded result O 4 .
O 4 = D ( f 4 + U 2 ( f 5 ) )
Using the decoding information O 4 , it is upsampled and added element-wise to the third layer’s semantic information, which is then fed into the decoder, as shown in (9), resulting in the decoded result O 3 .
O 3 = D ( f 3 + U 2 ( O 4 ) )
The decoded results from the fourth and third layers are upsampled by factors of 4 and 2, respectively, and added element-wise to the second layer’s feature information, which is then fed into the second layer decoder, as shown in (10), resulting in the decoded result O 2 .
O 2 = D ( f 2 + U 2 ( O 3 ) + U 4 ( O 4 ) )
The decoding information from the fourth, third, and second layers are upsampled by factors of 8, 4, and 2, respectively, and added element-wise to the first layer’s feature information, which is then fed into the first layer decoder, as shown in (11), resulting in the decoded result O 1 .
O 1 = D ( f 1 + U 2 ( O 2 ) + U 4 ( O 3 ) + U 8 ( O 4 ) )
Finally, the number of channels is compressed through convolution to generate a single-channel tensor, followed by a sigmoid activation function to output the power line prediction map M e d g e , as specifically shown in (12).
M e d g e = σ ( O 1 )
The designed dense connection mechanism can fully utilize feature information at different scales, resulting in more precise power line maps.

3.5. Loss Function

PLD can be regarded as a pixel-level binary classification task. However, due to the extremely small proportion of power line pixels, with background pixels accounting for approximately 90% to 95%, this significant imbalance in quantity leads to a model that is more inclined to predict background pixels, resulting in performance deviations from expectations. Therefore, we adopted a weighted cross-entropy loss function, which reassigns weights to each class based on the standard cross-entropy loss function to address the issue of imbalanced positive and negative sample distributions. The formula for the weighted cross-entropy loss function [31] is as follows:
L W C E = 1 N i = 1 N ( α y i log ( p i ) + β ( 1 y i ) log ( 1 p i ) )
where α and β are balanced factors, y i is the ground truth value (0 or 1) for the i t h pixel, and p i is the predicted probability that the i t h pixel belongs to a power line. N represents the total number of pixels.

4. Experiment

We conduct a series of ablation experiments to demonstrate the effectiveness of each module in LUM-Net from both qualitative and quantitative perspectives. The dataset we adopted was the PLD-UAV [6] dataset, which includes two sub-datasets for PLD with pixel-level annotations: the PLDU dataset and the PLDM dataset. The PLDU dataset, named the urban scene power line dataset, comprises 453 training images and 120 test images; the PLDM dataset, named the mountain scene power line dataset, includes 273 training images and 50 test images. Given that the provided sample images from the dataset were insufficient to support the model training, we employed a data augmentation strategy, which has been widely adopted in previous works [6,32,33] and is proven to improve model robustness and generalization. First, each image–label pair was flipped in four directions (0°, 90°, 180°, and 270°). Subsequently, we rotated each pair at 15° intervals, encompassing a full 360° range. Finally, these rotated pairs were resized and randomly cropped, ensuring that the original resolution was maintained throughout the process. It is noteworthy that this augmentation methodology was consistently applied across all datasets utilized in our study.

4.1. Implentation Details

LUM-Net was implemented using the PyTorch v1.12.1 deep learning framework. During the training phase, the hyperparameters were set as follows: mini batch size 4, initial learning rate 1 × 10 4 , learning rate decay ratio 0.1, weight decay 5 × 10 4 , and number of training epochs 30. The Adam optimization [34] method was used to update the model’s parameters. All experiments were conducted on a single NVIDIA A40 GPU.

4.2. Evaluation Metrics

PLD can be defined as a pixel-level classification task, where power line foreground pixels are considered positive samples and background pixels are negative samples. Evaluating the performance of a PLD method involves measuring the accuracy of classifying foreground pixels. Precision and recall are commonly used to quantify classification accuracy for PLD tasks, as shown in (14) and (15).
R = T P T P + F N
P = T P T P + F P
The F-score is typically employed to quantitatively measure the balance between precision and recall in PLD algorithms. As shown in (16), this value is the harmonic mean of precision and recall.
F = 2 P R P + R
Plotting precision and recall on the same coordinate graph yielded a precision-recall (P-R) curve, providing a more intuitive comparison of algorithm performance and allowing for qualitative PLD performance analysis [33].
We adopted three commonly used metrics in this field [6]: ODS-F (Optimal Dataset Scale F-score), OIS-F (Optimal Image Scale F-score), and AP (Average Precision) as comprehensive evaluation metrics to evaluate the model’s performance comprehensively. ODS-F and OIS-F are two strategies for selecting thresholds when calculating the F-measure. The ODS metric uses a fixed threshold that is the same for all images in the entire dataset and maximizes the F-measure in the whole dataset. This metric measures the overall performance optimized for a specific dataset. The OIS metric, on the other hand, selects an individual threshold for each image to achieve the optimal F-measure for that particular image. This metric focuses on the optimal performance of individual instances. The higher the F-scores for ODS and OIS, the higher the prediction accuracy. AP represents the integral of the precision-recall (P-R) curves and measures the average degree of match between a model’s predictions and actual labels. A higher AP indicates better average prediction performance. Therefore, using these metrics allows one to evaluate model performance from multiple dimensions.

4.3. Ablation Study

To evaluate the performance of each component in our model, we performed a series of ablation experiments on the PLDU dataset and here report the ODS, OIS, and AP. The results are shown in Table 1.
Evaluation of CoCBAM Module: When we removed the CoCBAM, the performance exhibited degradation of varying magnitudes across all three evaluation metrics, as shown in Table 1. This experiment demonstrated the effectiveness of our CoCBAM module. It proved that the CoCBAM module can focus on the characteristics of power lines, enhancing the representation of features and thus improving the performance. Additionally, we conducted a comparative experiment between CoCBAM and CBAM, with results presented in the fourth row of Table 1. It can be observed that when CoCBAM was replaced with CBAM, there was a significant decrease in performance. These findings provide substantial evidence that CoCBAM outperformed CBAM in this task.
Evaluation of BiLKB Module: The core component of the BiLKB module is the LKB module, which utilizes the LKF module for feature selection and the SKR module for detail correction. Therefore, ablation studies were conducted by removing the LKF and SKR modules separately. After removing the LKF module, the ODS was decreased by 0.007. The experimental results indicate that the large kernel depthwise convolution and spatial selection mechanism in the LKF module can effectively extract feature information with a larger receptive field and select important spatial details, significantly improving the network’s performance. As for SKR, when we removed this module, the ODS was decreased by 0.001. This shows that the small kernel auxiliary convolution in the SKR module can correct edge information and slightly improve detection accuracy. These results demonstrate the effectiveness of the LKF and SKR modules in enhancing the detection algorithm’s overall performance.

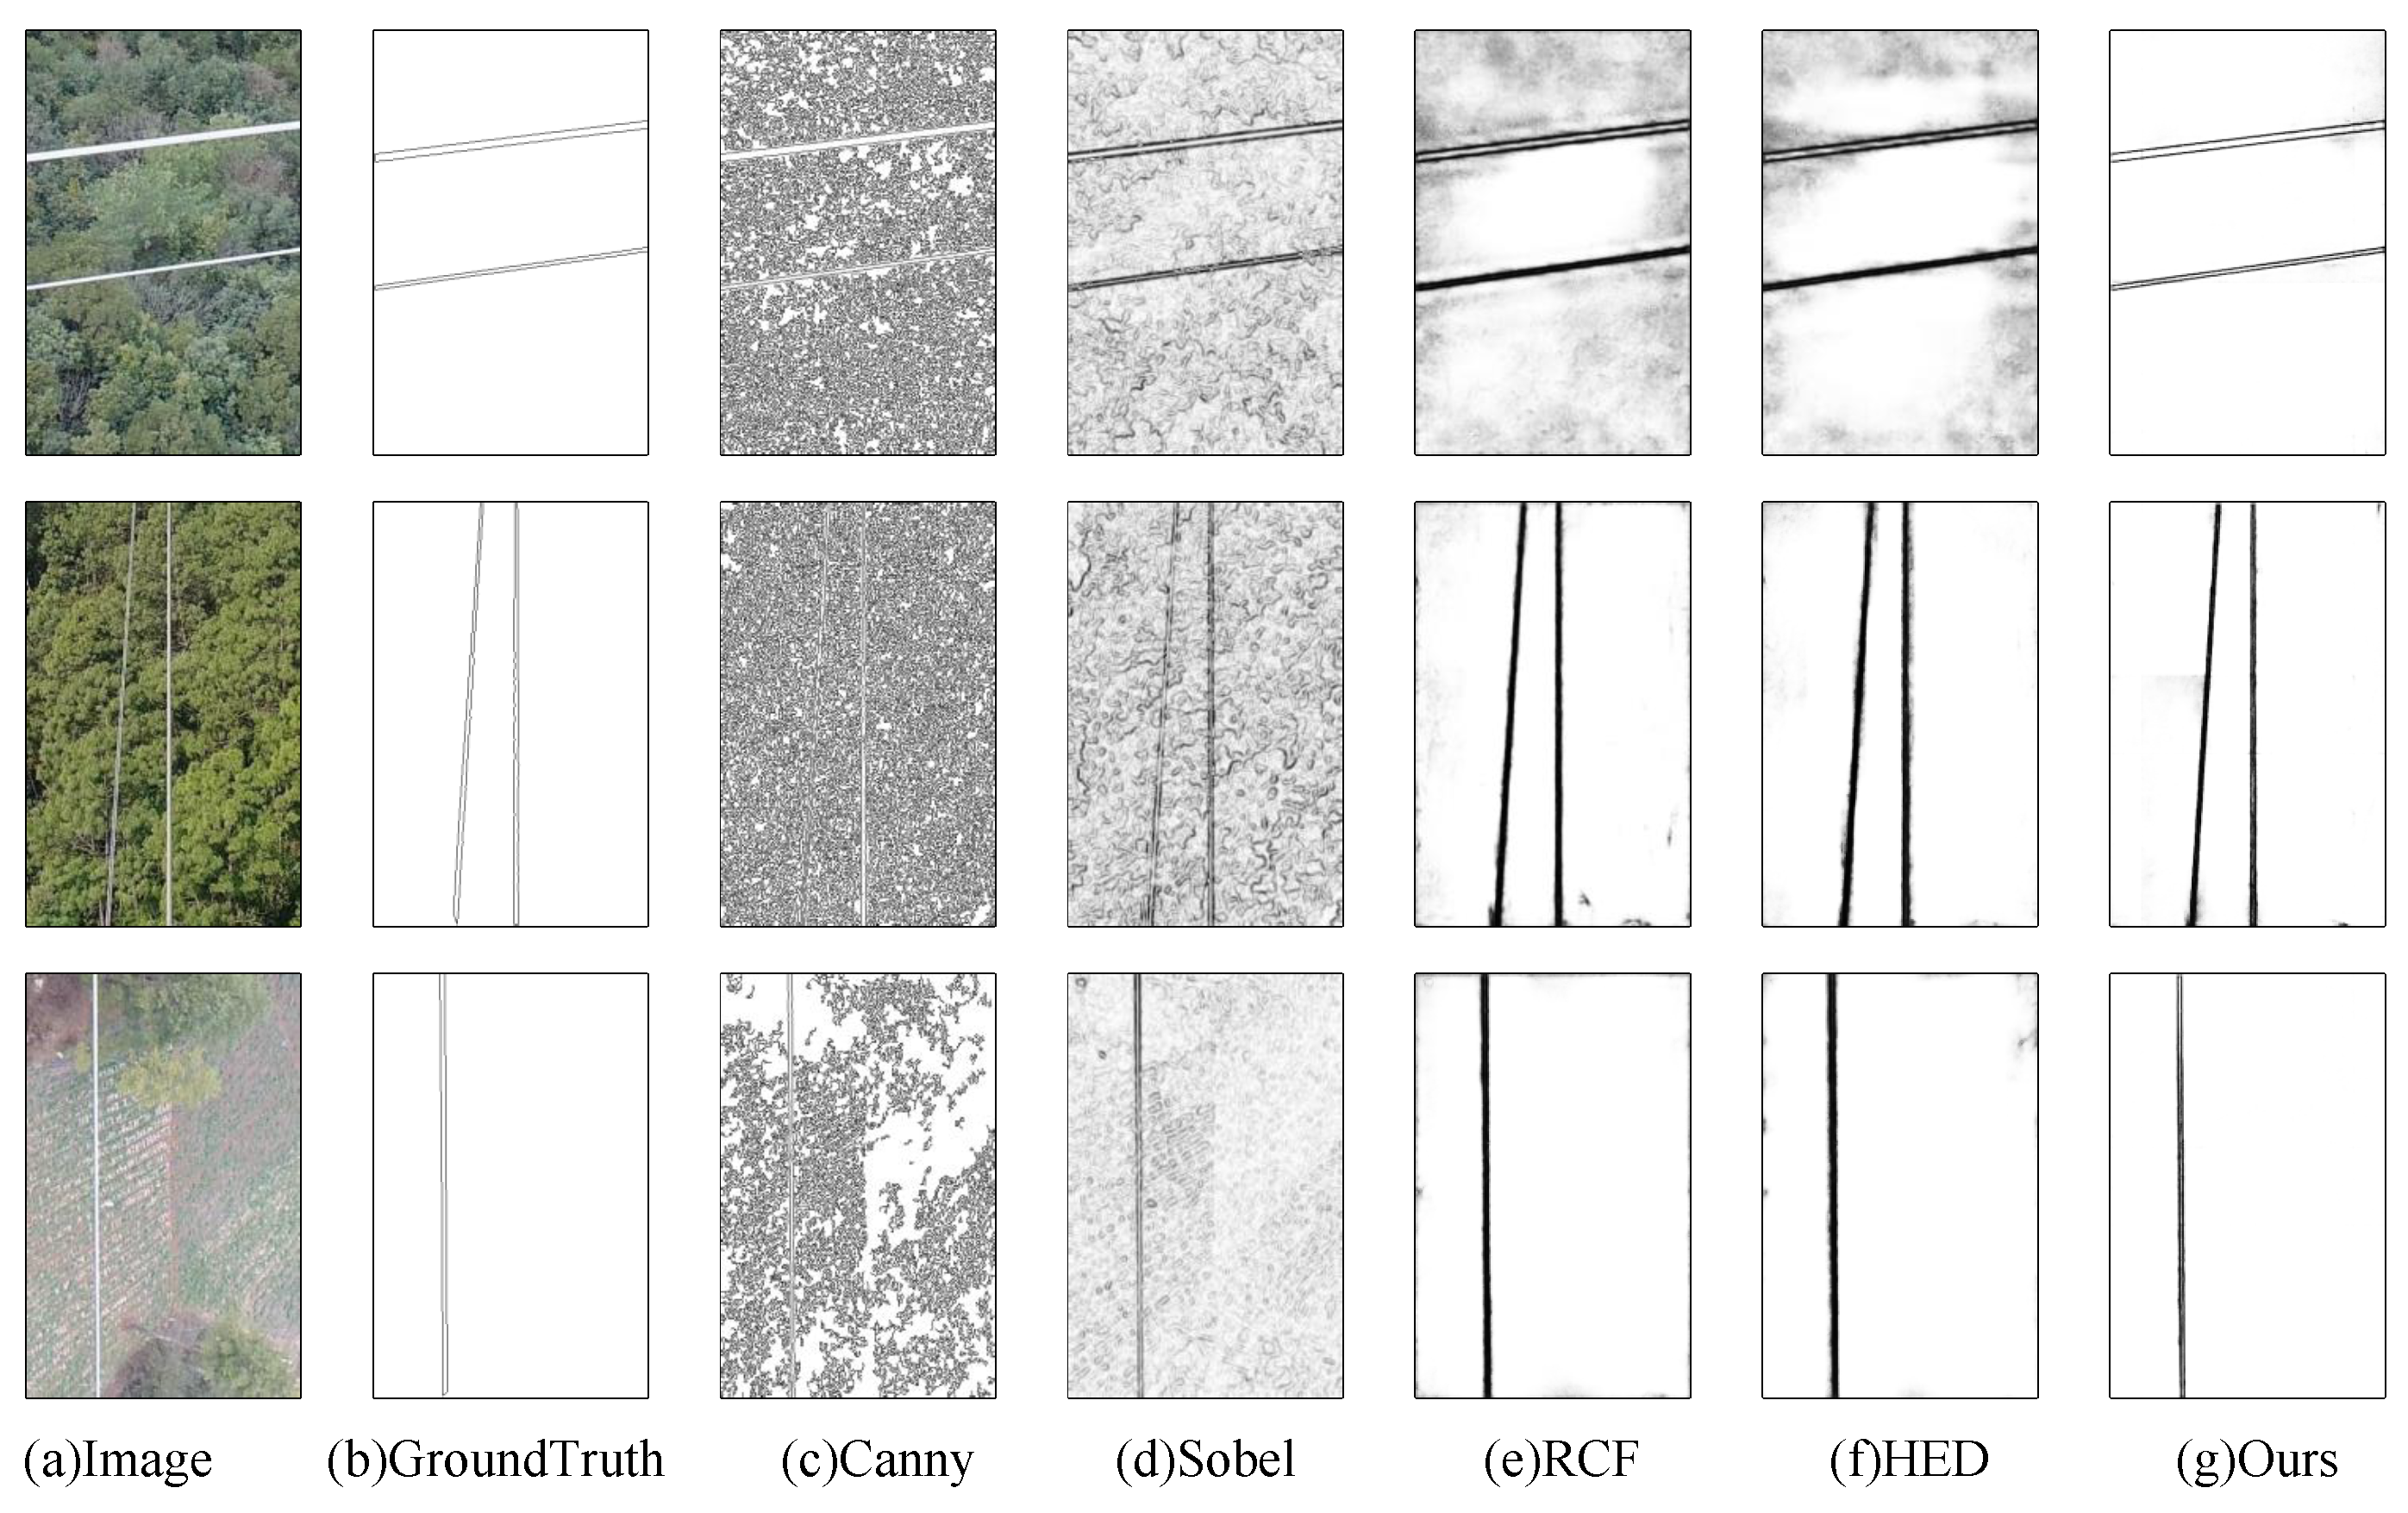
4.4. Comparative Experiments

We further compared several advanced methods. We performed this comparative experiment on two datasets: PLDU and PLDM.
Quantitative comparison on PLDU dataset: On the PLDU dataset, we compared our LUM-Net with traditional edge detection algorithms such as Canny [4] and Sobel [11], as well as deep learning-based edge detection algorithms like HED [32] and RCF [33]. The quantitative analysis results are shown in Table 2. Our LUM-Net achieved the best performance (ODS = 0.969, OIS = 0.976, AP = 0.965), which significantly surpassed that of the traditional edge detection algorithms. Compared to the deep learning-based algorithms HED and RCF, the LUM-Net’s ODS and OIS values were 5.7% and 4.2% and 12.2% and 11.0% higher, respectively. Figure 3 shows the precision-recall (P-R) curves for evaluating overall algorithm performance. It is evident from the P-R curves that the LUM-Net’s curve is closest to the top-right corner of the P-R graph, indicating optimal performance.
Qualitative analysis on PLDU dataset: For qualitative analysis, Figure 4 provides visual comparisons. It shows some images from the PLDU test set, manually annotated ground truth images, and PLD results obtained using different algorithms. From Figure 4, it is clear that traditional gradient-based operators such as Canny and Sobel struggled to distinguish complex backgrounds from power line features, resulting in much noise (e.g., leaf traces) in the predicted power line maps. Although HED and RCF, two deep learning-based algorithms, performed significantly better than traditional methods, their detected lines still contained noise, leading to thicker and blurrier power line maps. In contrast, the results obtained using the LUM-Net closely resembled the ground truth annotations and showed lower sensitivity to noise.
To further verify the effectiveness and robustness of our method, both qualitative and quantitative analyses were conducted on the PLDM dataset using methods consistent with those applied to the PLDU dataset.
Quantitative comparison on PLDM dataset: The quantitative analysis compared various detection algorithms based on their PLD metrics on the PLDM dataset. As shown in Table 3, LUM-Net achieved ODS and OIS values of 0.943 and 0.960 on the PLDM dataset. Compared to that of the HED and RCF algorithms, these values represented increases of 12.9%, 13.6%, and 20.1%, 20.9%, respectively. Based on the performance metrics from different algorithms, P-R curves were plotted, as illustrated in Figure 5. The results indicate that the proposed algorithm’s curve is closest to the upper-right corner of the P-R graph, demonstrating superior overall performance.
Qualitative analysis on PLDM dataset: The detection images obtained through various algorithms were compared for qualitative analysis, as shown in Figure 6. These comparisons highlight the outstanding performance and robustness of the proposed algorithm. Specifically, the power line maps generated by our LUM-Net were the clearest and exhibited strong interference resistance. This demonstrates that our method achieves high accuracy and maintains excellent performance under varying conditions, showcasing its robust nature against noise and complex backgrounds.

5. Conclusions and Discussion

5.1. Conclusions

This work proposed a novel PLD algorithm based on multi-scale features, utilizing EfficientNetV1 as the backbone for feature extraction. A Coordinated Convolutional Block Attention Module was designed to enhance the capability of extracting power line features. This module integrated channel and spatial attention mechanisms with convolutional blocks to improve feature representation. A Bi-Large Kernel Block module was also developed as a decoder. By cascading large kernel convolutions at different scales alongside a spatial selection mechanism, the BiLKB module assists small kernel convolutions in refining detailed information, thus expanding the receptive field and efficiently obtaining decoded information. Adopting a top-down dense connection mechanism facilitated the interaction of multi-scale decoded information, thereby improving detection accuracy. Experimental results demonstrate that the LUM-Net performs excellently in PLD. It signifies an important step toward the automation and intelligence of future power line inspection tasks.

5.2. Discussion

While our proposed LUM-Net demonstrates excellent performance in power line detection tasks, several limitations and challenges remain to be addressed in future work. The current implementation introduces additional computational overhead due to the CoCBAM module and large kernel convolutions in the BiLKB module, potentially limiting deployment on resource-constrained UAV platforms. Additionally, our model’s performance under extreme weather conditions (heavy fog, rain, snow) or varying illumination requires further evaluation, as these environmental factors may significantly degrade detection performance in real-world applications. The approach may still struggle with highly complex scenes where power lines are partially occluded by vegetation or structures, particularly in densely forested areas or complex urban environments where the thin nature of power lines makes complete detection challenging, even with our attention-based mechanisms. Furthermore, while comprehensive, the datasets used in this study may not fully represent the global diversity of power line installations, environmental contexts, and imaging conditions, potentially limiting the generalization capability of our model to new deployment scenarios.

Author Contributions

Conceptualization, K.L. and X.B.; methodology, K.L., X.B. and C.L.; software, F.W. and M.L.; validation, X.B. and C.L.; formal analysis, K.L. and C.L.; investigation, K.L. and X.G.; resources, X.G. and G.H.; data curation, K.L. and F.W.; writing—original draft preparation, K.L. and X.B.; writing—review and editing, C.L.; visualization, K.L and C.L.; supervision, X.G. and C.L.; project administration, X.G. and G.H.; funding acquisition, X.G. All authors have read and agreed to the published version of the manuscript.

Funding

This research was funded by the State Grid Jibei UHV Company Technology Project under grant number B3018H240006.

Institutional Review Board Statement

Not applicable.

Informed Consent Statement

Not applicable.

Data Availability Statement

The raw data supporting the conclusions of this article will be made available by the authors on request.

Conflicts of Interest

Authors Kai Li, Feiran Wang, Xinyang Guo and Geng Han were employed by the company State Grid Jibei Electric Power Co., Ltd. Author Min Liu was employed by the company State Grid Jibei Electric Power Co., Ltd. The remaining authors declare that the research was conducted in the absence of any commercial or financial relationships that could be construed as a potential conflict of interest.

Abbreviations

The following abbreviations are used in this manuscript:
CNNConvolutional Neural Network
ReLURectified Linear Unit
CoCBAMCoordinated Convolutional Block Attention Module
BiLKBBi-Large Kernel Convolutional Block
CAMChannel Attention Module
SAMSpatial Attention Module
HEDHolistically-nested Edge Detection
RCFRicher Convolutional Features for Edge Detection
CBAMConvolutional Block Attention Module
LKFLarge Kernel Fusion
SKRSmall Kernel Rectification
UAVUnmanned Aerial Vehicle
PLDPower Line Detection

References

  1. Yang, L.; Fan, J.; Liu, Y.; Li, E.; Peng, J.; Liang, Z. A review on state-of-the-art power line inspection techniques. IEEE Trans. Instrum. Meas. 2020, 69, 9350–9365. [Google Scholar] [CrossRef]
  2. Deng, C.; Wang, S.; Huang, Z.; Tan, Z.; Liu, J. Unmanned Aerial Vehicles for Power Line Inspection: A Cooperative Way in Platforms and Communications. J. Commun. 2014, 9, 687–692. [Google Scholar] [CrossRef]
  3. Nguyen, V.; Jenssen, R.; Roverso, D. Electrical power and energy systems automatic autonomous vision-based power line inspection: A review of current status and the potential role of deep learning. Electr. Power Energy Syst. 2018, 99, 107–120. [Google Scholar] [CrossRef]
  4. Canny, J. A computational approach to edge detection. IEEE Trans. Pattern Anal. Mach. Intell. 1986, PAMI-8, 679–698. [Google Scholar] [CrossRef]
  5. Sobel, I.E. Camera Models and Machine Perception. Ph.D. Thesis, Stanford University, Stanford, CA, USA, 1970. [Google Scholar]
  6. Zhang, H.; Yang, W.; Yu, H.; Zhang, H.; Xia, G.S. Detecting power lines in UAV images with convolutional features and structured constraints. Remote Sens. 2019, 11, 1342. [Google Scholar] [CrossRef]
  7. Tran, D.K.; Roverso, D.; Jenssen, R.; Kampffmeyer, M. LSNetv2: Improving weakly supervised power line detection with bipartite matching. Expert Syst. Appl. 2024, 250, 123773. [Google Scholar] [CrossRef]
  8. Guo, J.; Wang, Z.; Li, H.; Yang, Y.; Huang, C.G.; Yazdi, M.; Kang, H.S. A hybrid prognosis scheme for rolling bearings based on a novel health indicator and nonlinear Wiener process. Reliab. Eng. Syst. Saf. 2024, 245, 110014. [Google Scholar] [CrossRef]
  9. Woo, S.; Park, J.; Lee, J.Y.; Kweon, I.S. Cbam: Convolutional block attention module. In Proceedings of the European Conference on Computer Vision (ECCV), Munich, Germany, 8–14 September 2018; pp. 3–19. [Google Scholar]
  10. Wang, S.; Kim, M.; Hae, H.; Cao, M.; Kim, J. The development of a rebar-counting model for reinforced concrete columns: Using an unmanned aerial vehicle and deep-learning approach. J. Constr. Eng. Manag. 2023, 149, 04023111. [Google Scholar] [CrossRef]
  11. Kittler, J. On the accuracy of the Sobel edge detector. Image Vis. Comput. 1983, 1, 37–42. [Google Scholar] [CrossRef]
  12. Kasturi, R.; Camps, O.I. Wire Detection Algorithms for Navigation. 2002. Available online: https://ntrs.nasa.gov/citations/20020060508 (accessed on 25 May 2025).
  13. Yan, G.; Li, C.; Zhou, G.; Zhang, W.; Li, X. Automatic extraction of power lines from aerial images. IEEE Geosci. Remote Sens. Lett. 2007, 4, 387–391. [Google Scholar] [CrossRef]
  14. Li, Z.; Liu, Y.; Walker, R.; Hayward, R.; Zhang, J. Towards automatic power line detection for a UAV surveillance system using pulse coupled neural filter and an improved Hough transform. Mach. Vis. Appl. 2010, 21, 677–686. [Google Scholar] [CrossRef]
  15. Song, B.; Li, X. Power line detection from optical images. Neurocomputing 2014, 129, 350–361. [Google Scholar] [CrossRef]
  16. Pan, C.; Cao, X.; Wu, D. Power line detection via background noise removal. In Proceedings of the 2016 IEEE Global Conference on Signal and Information Processing (GlobalSIP), Washington, DC, USA, 7–9 December 2016; pp. 871–875. [Google Scholar]
  17. Gubbi, J.; Varghese, A.; Balamuralidhar, P. A new deep learning architecture for detection of long linear infrastructure. In Proceedings of the 2017 Fifteenth IAPR International Conference on Machine Vision Applications (MVA), Nagoya, Japan, 8–12 May 2017; pp. 207–210. [Google Scholar]
  18. Madaan, R.; Maturana, D.; Scherer, S. Wire detection using synthetic data and dilated convolutional networks for unmanned aerial vehicles. In Proceedings of the 2017 IEEE/RSJ International Conference on Intelligent Robots and Systems (IROS), Vancouver, BC, Canada, 24–28 September 2017; pp. 3487–3494. [Google Scholar] [CrossRef]
  19. Yetgin, Ö.E.; Benligiray, B.; Gerek, Ö.N. Power line recognition from aerial images with deep learning. IEEE Trans. Aerosp. Electron. Syst. 2018, 55, 2241–2252. [Google Scholar] [CrossRef]
  20. Jaffari, R.; Hashmani, M.A.; Reyes-Aldasoro, C.C. A novel focal phi loss for power line segmentation with auxiliary classifier U-Net. Sensors 2021, 21, 2803. [Google Scholar] [CrossRef]
  21. Abdelfattah, R.; Wang, X.; Wang, S. Plgan: Generative adversarial networks for power-line segmentation in aerial images. IEEE Trans. Image Process. 2023, 32, 6248–6259. [Google Scholar] [CrossRef] [PubMed]
  22. Khan, M.A.M.; Kee, S.H.; Pathan, A.S.K.; Nahid, A.A. Image processing techniques for concrete crack detection: A scientometrics literature review. Remote Sens. 2023, 15, 2400. [Google Scholar] [CrossRef]
  23. Akinsemoyin, A.; Awolusi, I.; Chakraborty, D.; Al-Bayati, A.J.; Akanmu, A. Unmanned aerial systems and deep learning for safety and health activity monitoring on construction sites. Sensors 2023, 23, 6690. [Google Scholar] [CrossRef]
  24. Perez, H.; Tah, J.H.; Mosavi, A. Deep learning for detecting building defects using convolutional neural networks. Sensors 2019, 19, 3556. [Google Scholar] [CrossRef]
  25. Gargari, M.S.; Seyedi, M.H.; Alilou, M. Segmentation of Retinal Blood Vessels Using U-Net++ Architecture and Disease Prediction. Electronics 2022, 11, 3516. [Google Scholar] [CrossRef]
  26. Loh, H.W.; Hong, W.; Ooi, C.P.; Chakraborty, S.; Barua, P.D.; Deo, R.C.; Soar, J.; Palmer, E.E.; Acharya, U.R. Application of deep learning models for automated identification of Parkinson’s disease: A review (2011–2021). Sensors 2021, 21, 7034. [Google Scholar] [CrossRef]
  27. Li, F.; Yigitcanlar, T.; Nepal, M.; Nguyen, K.; Dur, F. Machine learning and remote sensing integration for leveraging urban sustainability: A review and framework. Sustain. Cities Soc. 2023, 96, 104653. [Google Scholar] [CrossRef]
  28. Tan, M.; Le, Q. Efficientnet: Rethinking model scaling for convolutional neural networks. In Proceedings of the International Conference on Machine Learning, PMLR, Long Beach, CA, USA, 9–15 June 2019; pp. 6105–6114. [Google Scholar]
  29. Li, Y.; Li, X.; Dai, Y.; Hou, Q.; Liu, L.; Liu, Y.; Cheng, M.M.; Yang, J. Lsknet: A foundation lightweight backbone for remote sensing. Int. J. Comput. Vis. 2024, 133, 1410–1431. [Google Scholar] [CrossRef]
  30. Zeiler, M.D.; Fergus, R. Visualizing and understanding convolutional networks. In Proceedings of the Computer Vision–ECCV 2014: 13th European Conference, Zurich, Switzerland, 6–12 September 2014, Proceedings, Part I 13; Springer: Berlin/Heidelberg, Germany, 2014; pp. 818–833. [Google Scholar]
  31. Mao, A.; Mohri, M.; Zhong, Y. Cross-entropy loss functions: Theoretical analysis and applications. In Proceedings of the International Conference on Machine Learning, PMLR, Honolulu, HI, USA, 23–29 July 2023; pp. 23803–23828. [Google Scholar]
  32. Xie, S.; Tu, Z. Holistically-nested edge detection. In Proceedings of the IEEE International Conference on Computer Vision, Santiago, Chile, 7–13 December 2015; pp. 1395–1403. [Google Scholar]
  33. Liu, Y.; Cheng, M.M.; Hu, X.; Wang, K.; Bai, X. Richer convolutional features for edge detection. In Proceedings of the IEEE Conference on Computer Vision and Pattern Recognition, Honolulu, HI, USA, 21–26 July 2017; pp. 3000–3009. [Google Scholar]
  34. Kingma, D.P.; Ba, J. Adam: A method for stochastic optimization. arXiv 2017, arXiv:1412.6980. [Google Scholar] [CrossRef]
Figure 1. The architecture of (a) LUM-Net, (b) CoCBAM, (c) ConvBlock, (d) CBAM, and (e) BiLKB.
Electronics 14 02175 g001
Figure 2. The structure of LKB and LKF, respectively.
Electronics 14 02175 g002
Figure 3. P-R curves on PLDU dataset. Our proposed method achieved the highest performance, significantly outperforming other methods.
Electronics 14 02175 g003
Figure 4. Qualitative analysis on PLDU dataset.
Electronics 14 02175 g004
Figure 5. P-R curves on PLDM dataset. Our method also achieved the highest performance.
Electronics 14 02175 g005
Figure 6. Qualitative analysis on PLDM dataset.
Electronics 14 02175 g006
Table 1. Ablation experiments on PLDU dataset.
CoCBAMLKFSKRCBAMODSOISAP
0.9660.9750.963
0.9620.9700.961
0.9680.9750.965
0.9650.9710.962
0.9690.9760.965
Table 2. Comparative experiments on PLDU dataset.
MethodODSOISAP
Canny0.2350.2700.109
Sobel0.4530.5000.365
HED0.9170.9370.927
RCF0.8640.8790.893
LUM-Net0.9690.9760.965
Table 3. Comparative experiments on PLDM dataset.
MethodODSOISAP
Canny0.1520.1640.054
Sobel0.5370.6740.546
HED0.8350.8450.716
RCF0.7850.7940.620
LUM-Net0.9430.9600.925
Disclaimer/Publisher’s Note: The statements, opinions and data contained in all publications are solely those of the individual author(s) and contributor(s) and not of MDPI and/or the editor(s). MDPI and/or the editor(s) disclaim responsibility for any injury to people or property resulting from any ideas, methods, instructions or products referred to in the content.

