Article

Venous Thrombosis Risk Assessment Based on Retrieval-Augmented Large Language Models and Self-Validation

by
Dong He
,
Hongrui Pu
and
Jianfeng He
*
Faculty of Information Engineering and Automation, Kunming University of Science and Technology, Kunming 650500, China
*
Author to whom correspondence should be addressed.
Electronics 2025, 14(11), 2164; https://doi.org/10.3390/electronics14112164
Submission received: 3 April 2025 / Revised: 23 May 2025 / Accepted: 23 May 2025 / Published: 26 May 2025

Abstract

:
Venous thromboembolism is a disease with high incidence and fatality rate, and the coverage rate of prevention and treatment is insufficient in China. Aiming at the problems of low efficiency, strong subjectivity, and low extraction and utilization of electronic medical record data by traditional evaluation methods, this study proposes a multi-scale adaptive evaluation framework based on retrieval-augmented generation. In this framework, we first optimize the knowledge base construction through entity–context dynamic association and Milvus vector retrieval. Next, the Qwen2.5-7B large language model is fine-tuned with clinical knowledge via Low-Rank Adaptation technology. Finally, a generation–verification closed-loop mechanism is designed to suppress model hallucination. Experiments show that the accuracy of the framework on the Caprini, Padua, Wells, and Geneva scales is 79.56%, 88.32%, 90.51%, and 84.67%, respectively. The comprehensive performance is better than that of clinical expert evaluation, especially in complex cases. The ablation experiments confirmed that the entity–context association and self-verification augmentation mechanism contributed significantly to the improvement in evaluation accuracy. This study not only provides a high-precision, traceable intelligent tool for VTE clinical decision-making, but also validates the technical feasibility, and will further explore multi-modal data fusion and incremental learning to optimize dynamic risk assessment in the future.

1. Introduction

Venous thromboembolism (VTE) is a disease with high morbidity and high risk of death [1]. Approximately 10 million cases of VTE are reported worldwide each year [2]. In Western countries, approximately 1 in 12 people are diagnosed with VTE during their lifetime [3]. Early risk assessment of VTE is a central aspect of clinical control. Thromboembolic symptoms are difficult to recognize, the course of the disease is insidious, and the misdiagnosis rate is high. However, effective prevention of VTE can significantly reduce its incidence by implementing appropriate prevention strategies, and VTE risk assessment plays a crucial role in clinical practice [4]. However, only a small proportion of patients in China currently receive VTE prophylaxis [5]. Therefore, the prevention and treatment of VTE is very important in medical practice.
In the existing clinical practice of VTE risk assessment, we mainly rely on manually filling out risk assessment scales such as Padua [6], Caprini [6], Wells [7], Geneva [8], etc. This traditional scale assessment relies on manual calculation by healthcare personnel, which is not only inefficient, subjective, and with high omission rate, but also prone to errors. For example, the Caprini scale needs than 40 risk factors manually entered, such as the patient’s age and type of surgery, and the total score calculated, while the Padua scale needs to be combined with patients’ internal medicine symptoms and test indexes for stratification. Different departments need to use different scales, e.g., orthopedic departments use Caprini [9], but the risk assessment model of Padua is designed for general internal medicine patients and is mainly evaluated among acutely ill hospitalized patients [8], which further adds to the complexity of the assessment process. At the same time, due to the high workload of healthcare professionals, VTE risk assessments are not performed, or, sometimes, they are completed but not thoroughly enough [10]. Electronic Medical Records (EMRs), as the core data carrier of clinical diagnosis and treatment, contain a large number of pathological features, diagnostic and treatment records, and risk factors related to VTE, but their unstructured text characteristics lead to underutilization of information [11]. With the popularization of electronic medical record (EMR) systems and the development of artificial intelligence (AI) technology [12], scale assessment has gradually evolved in the direction of automation and intelligence, and the current core technology paths for automated risk assessment of VTE can be classified into three categories, namely, rule-based systems, machine learning models, and deep learning models.
In the early 2000s, some hospitals embedded scales into electronic forms in their electronic medical record systems, and clinical staff could automatically accumulate scores after checking the boxes, which greatly improved the scoring efficiency and reduced the paper entry; however, the evaluation was still limited because it had to be filled out manually, and the system could not interface with real-time dynamic data, such as test indexes and image reports. Since the 2010s, rule-based NLP engines have realized automatic mapping of scale entries by parsing structured fields such as age, type of surgery, and identifying key descriptions in unstructured text such as “long-term bed-ridden” and “central venous catheterization”, which not only reduces manual intervention but also explores hidden risk factors and significantly improves accuracy and comprehensiveness. The method is clear, customizable, low-data-dependent, and easy to be reviewed by experts; however, with the diversification of clinical scenarios and document formats, the expansion of the rule base brings about high maintenance costs, conflict management problems, and limited support for the complex semantics of free text.
Many researchers have used machine learning and NLP techniques to jointly model structured and unstructured data from electronic medical records for efficient prediction of disease risk; for example, Contreras-Luján et al. [13] evaluated the performance of six ML algorithms for early diagnosis of deep vein thrombosis (DVT), and KNN achieved 90% accuracy and 80.66% specificity on both PC and Raspberry Pi 4 edge devices: both reached 90.4% accuracy and 80.66% specificity, resulting in a low-cost, portable diagnostic system. Wang et al. [14] compared a random forest-based model with the Padua scale in Chinese hospitalized patients and found that it outperformed the traditional scale in terms of sensitivity and specificity. He et al. [15] combined Caprini scores with electronic health record features to predict VTE risk in trauma inpatients using the LASSO + RF model, and the AUC was improved to 0.799. The above studies are able to automatically mine high-dimensional features, reduce manual intervention, and support real-time decision-making by edge devices, with low-cost and customizable advantages. However, they rely heavily on a large amount of labeled data, and are mostly sample-poor or single-center studies, which are prone to overfitting and insufficient support for complex semantic understanding and model interpretability; meanwhile, edge deployments are constrained by computational and storage resources, which may lead to inference delays and performance tradeoffs due to model simplification.
In recent years, scholars have attempted to use deep learning to automatically assess VTE risk: Chen et al. [16] annotated Wells and Geneva scale entries with medical text and constructed a joint extraction model to automatically extract VTE risk factors from EMRs, and then assessed the risk of pulmonary embolism (PE) based on Wells and Geneva scale rule-based inference, with an accuracy rate of 84.7% and 86.1%. Yang et al. [17] proposed a two-branch deep learning DB-DL model based on the Padua scale, in which the disease classification branch utilized diagnosis, symptoms, and their weights to determine the disease category, and the clinical factor branch combined Chinese lexical analysis subwords with professional corpus and rules to extract comprehensive factors. The model had an AUC of 0.883 in high risk/low risk judgment, and the time consumed for single EMR evaluation was only 0.37 s. This kind of deep learning method can automatically learn complex semantic relationships in unstructured text, deal with high-dimensional features without manually designing rules, and significantly improve the evaluation speed and potential for large-scale application. However, there are limitations: first, it relies heavily on large-scale, high-quality labeled data, and is prone to overfitting in data-scarce environments; second, the model computation and storage overhead is large, which is not conducive to the deployment of edge or real-time scenarios with resource constraints; and third, the “black-box” feature brings insufficient interpretability, which makes it difficult to meet the clinical requirements for transparency in the decision-making process.
In the current fields of Natural Language Processing, Large Language Models (LLMs) and Retrieval Augmented Generation (RAG) [18] techniques are developing rapidly, and numerous research results are emerging. Mansurova et al. [19] proposed a Q&A approach that relies solely on an external knowledge base by constructing a dense vector indexing database and utilizing the Reciprocal Rank Fusion (RRF) technique to optimize the retrieval results. The authors used two large-scale language models (Llama 2 7b and 13b) for evaluation, focusing on the models’ ability to extract useful information when dealing with noisy data, their ability to choose not to answer in case of missing knowledge, and their ability to integrate model parameter memories with external knowledge. The construction of a dense vector index database in this study provides ideas for this research. Hang et al. [20] proposed the MCQGen framework, which combines Chain-of-Thought and Self-Refine cueing engineering techniques to automatically generate multiple-choice questions with stems, answers, and distractors based on the support of an external knowledge base, improving the complexity and discriminatory nature of questions. This study provides ideas for the construction of fine-tuned datasets for this study, and the self-refine technology provides an effective solution for this paper.
Existing automated assessment techniques still face three major bottlenecks:
  • The heterogeneous nature of EMRs, such as being unstructured and involving a large amount of specialized terminology, leads to large errors in feature extraction of the trained model even after extensive manual annotation [21].
  • The lack of model interpretability makes physicians have insufficient trust in the results of automated assessment [22].
  • The existing systems are mostly limited to single-scale optimization and lack cross-scale risk prediction capability.
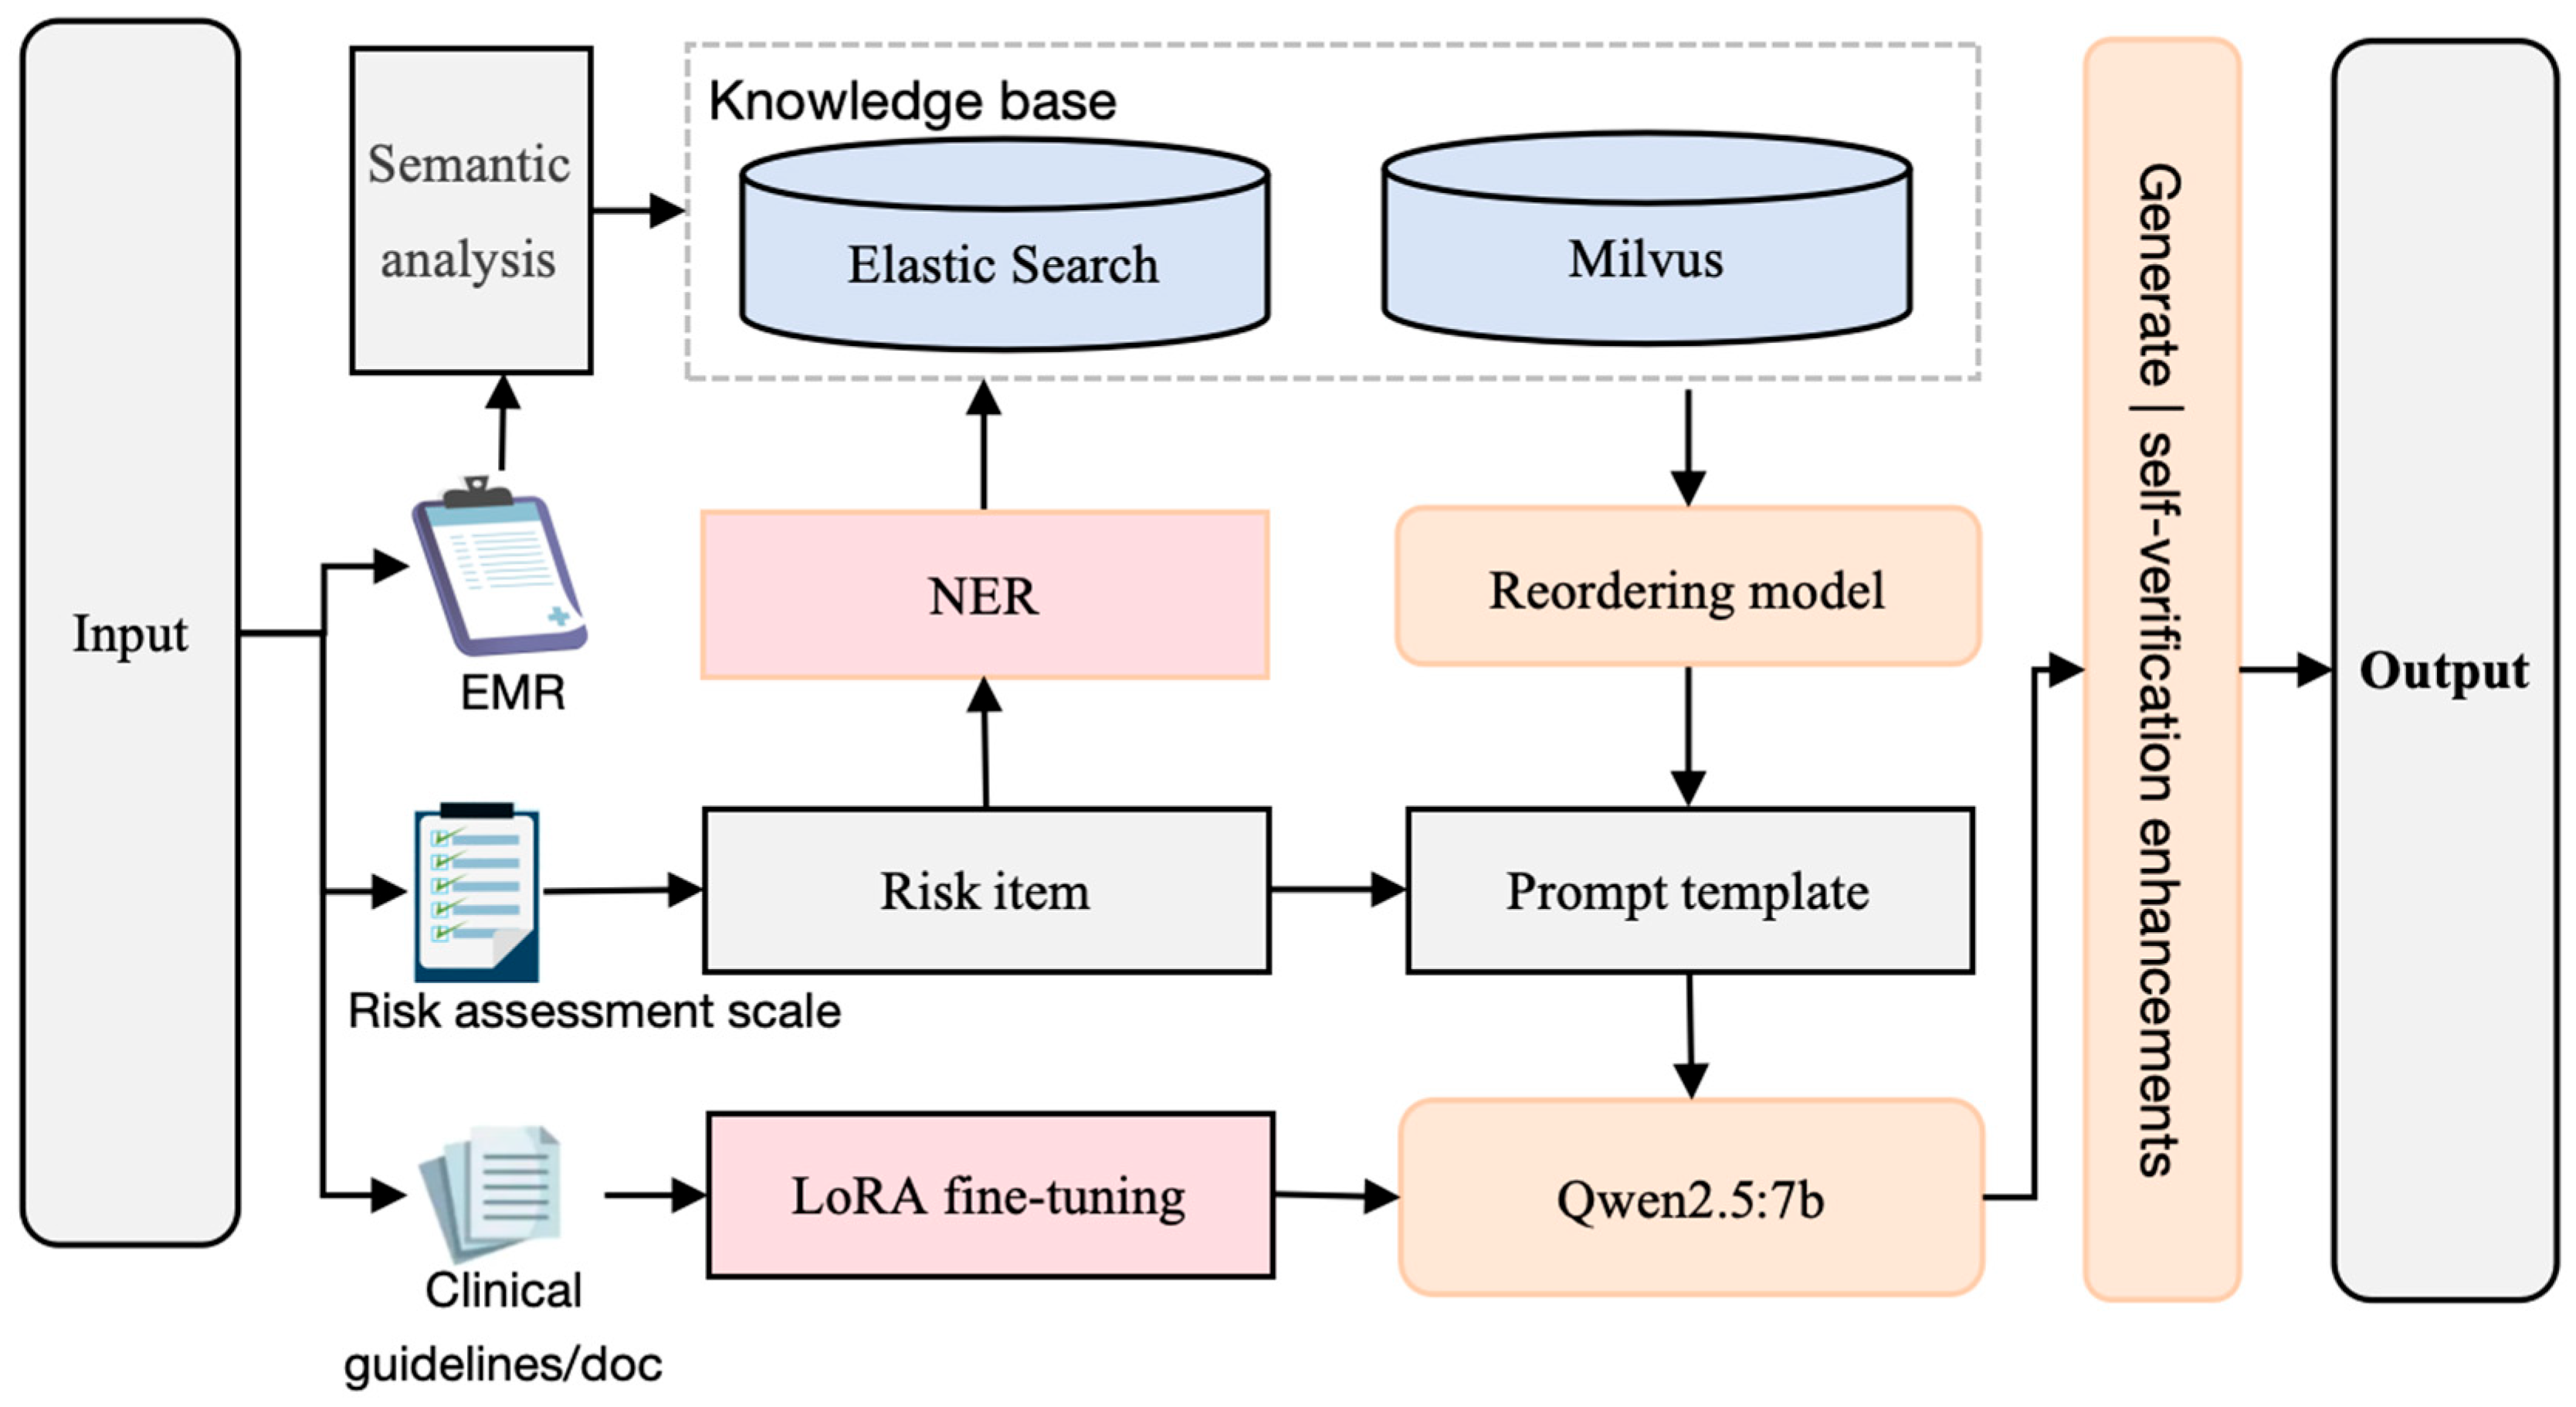
To address the above issues, this study proposes a generative big model framework for VTE risk assessment. By constructing a knowledge base optimized for multiple searches and adopting a domain-adaptive fine-tuning strategy, the generative macromodel is empowered with the ability to parse text from clinical EHRs. Combined with the closed-loop mechanism of generation–validation, it further ensures the accuracy on medical problems.

2. Methods

In this study, we propose a multi-scale adaptive VTE risk assessment framework based on the RAG model, which includes three parts: constructing a knowledge base for multiple retrieval optimization, fine-tuning the domain adaption to the LLMs, and introducing a closed-loop mechanism of generation–verification. The overall process is shown in Figure 1.
This framework covers a mixture of ElasticSearch [23], Milvus [24], and reordering [25,26] to optimize the construction of the knowledge base, the injection of VTE guideline knowledge through Low-Rank Adaptation (LoRA) [27] fine-tuning, and the use of two parts of generation–validation closure, which work together to achieve the contextual completeness of the risk factor assessment, the dynamic adaptability of the multi-scales, and clinical interpretability, providing a reliable paradigm for the automated VTE scale risk assessment. In this paper, we propose a reliable paradigm for automated risk assessment of VTE scales.

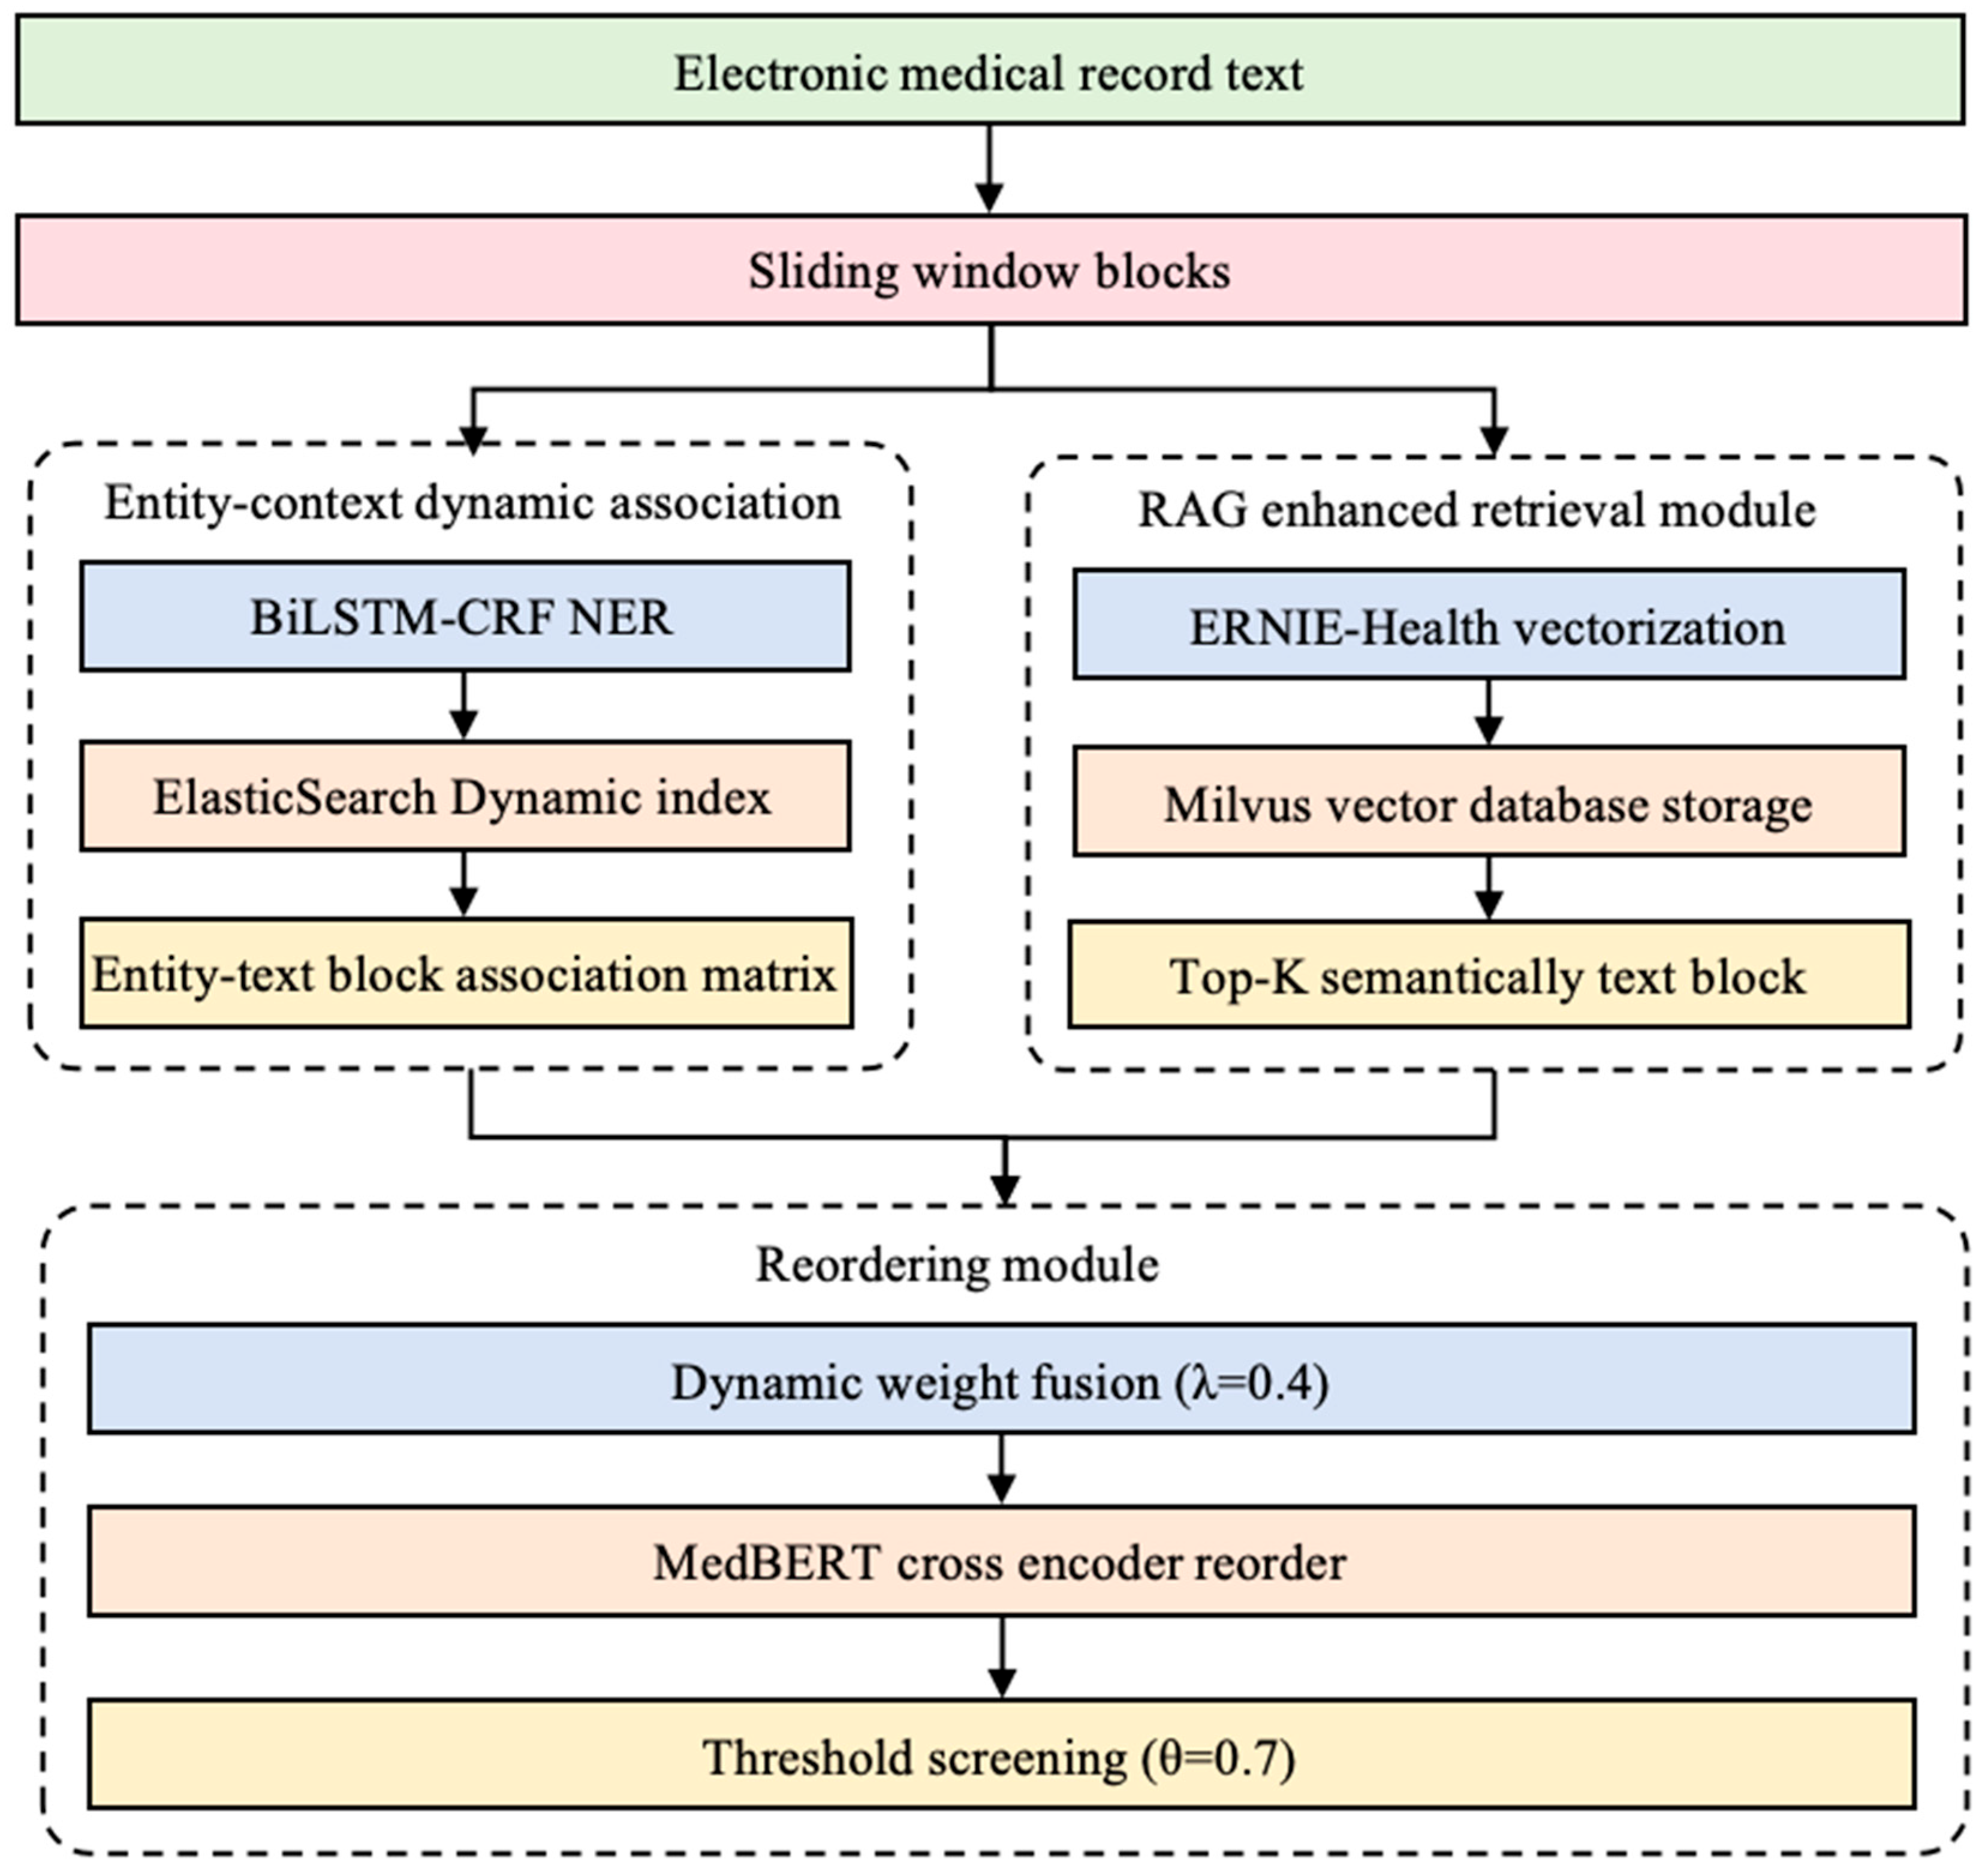
2.1. Knowledge Base Optimized for Multiple Searches

The first part of the framework constructed in this study is the Multiple Search Optimization Knowledge Base, the architecture of which is shown in Figure 2. For each risk item in the VTE risk assessment scale, the knowledge base is built for the electronic medical record of a specified patient. Firstly, the original case text is divided into text blocks using the entity–context dynamic association method, and each text block is sequentially identified with named entities, and the connection between entities and text blocks is established to realize text content retrieval. Secondly, the LangChain framework is used to integrate the Milvus vector database with the text blocks cut out of the cases to realize semantic storage and retrieval of electronic medical records. Finally, reordering is introduced to the original case-related text obtained from text content retrieval and text semantic retrieval to assess the degree of matching between the related text and the scale risk factors. The following is the specific design and function of each module.

2.1.1. Entity–Context Dynamic Associations

In order to create an entity–context dynamically associated knowledge base based on a single patient’s electronic medical record, the first task is to process the unstructured electronic medical record data for semantic segmentation and entity recognition. As shown in Figure 2, the process starts with the semantic chunking operation of the original medical record text: the sliding window algorithm combined with the syntactic parsing rules is used to divide the continuous text into semantically coherent text blocks with a length between 150–200 characters. The length interval is an empirical optimum determined by evaluating entity recall and semantic integrity under different truncation lengths. Specifically, the sliding window slides in steps of s = 50 characters and allows overlapping traversal of the text; the step size is set based on the linguistic property that 50 characters without punctuation rarely occurs consecutively in Chinese text to increase the probability of hitting the boundary of a sentence. When there is a period, semicolon, or line break in the window, the nearest marker position is selected as the cutting point to ensure the semantic integrity of chunking. The chunking process can be formalized as
C i   =   a r g m a x j i , i + L Punctuation T j
Among them, C i represents the i-th text block, L is the window length threshold, set to 150–200 characters, T j is the j -th character of the original text, and Punctuation · is the punctuation integrity check function. After the actual text block segmentation is completed, the length of the text block is counted, and there is no text block with a character length of 200, which indicates that the boundary identifier appears within 50 characters from the 150th character in all text blocks during segmentation.
First, data preprocessing was performed for all EHR data to form text blocks. All text blocks of a single patient were selected, and entity recognition was performed for each text block based on RoBERTa-wwm and the Chinese EHR named entity recognition model with multi-head attention [28]. After the recognition is completed, the entity–text block dynamic index is constructed by ElasticSearch to realize the fast mapping of entity keywords to the original context. The index structure contains the following fields: entity name, entity category, belonging text block ID, and context fragment.
When searching for the entity “D-dimer”, ElasticSearch quickly returns all relevant text blocks and their locations based on a backward-indexed index, ensuring that subsequent risk assessments are based on the full clinical context.
The method effectively solves the problem of long text semantic fragmentation and jargon omission detection through semantic chunking optimization and dictionary-enhanced entity recognition, and provides a high-precision and traceable entity–context association basis for subsequent risk assessment.

2.1.2. Milvus Vector Retrieval

In addition, in order to build an efficient and scalable medical knowledge base, this study adopts the LangChain framework to integrate the Milvus vector database for semantic storage and retrieval of electronic medical record text. The process starts with the vectorized encoding of preprocessed text blocks: based on the medical domain-adapted BERT variant of the ERNIE-Health pre-training model [29], a dense vector representation of the i-th text blocks is generated v i , which is mathematically formalized as
v i = E R N I E H e a l t h C i R d
where C i is the content of the i-th text block and d = 768 is the vector dimension. ERNIE-Health With the entity masking strategy and the pre-training of the medical Q&A task, the deep semantic associations of the terminology can be captured, and the vectors of the composite medical domain entities such as “deep vein thrombosis” are better characterized than those of the general BERT model.
After text block vectorization, the hierarchical index structure is constructed by the Milvus vector database. The HNSW (Hierarchical Navigable Small World) algorithm is used to optimize the Approximate Nearest Neighbor (ANN) search of the high-dimensional vector space [30], and its index construction process can be described as three stages:
Graph structure initialization: randomly select anchor vectors as initial nodes, construct multi-layer navigation graphs by greedy search; high-level graphs are sparsely connected for fast coarse screening, and bottom-level graphs are densely connected to guarantee fine-grained recall.
Dynamic insertion mechanism: new text block vectors are inserted into the nearest neighbor nodes according to the distance threshold θ = 0.85, which is an empirical setting commonly used in practice. Ensure topology stability during index update.
Retrieval phase: when a risk factor such as “three days of postoperative bed rest” is entered for assessment, the RAG mechanism performs the following steps: the query text Q is encoded as a vector v q , and its cosine similarity to the knowledge base vector v p is computed by Milvus as S R A G :
S R A G = v q · v p v q v p
This returns the top-K candidate text blocks, with default K = 20; this value is adjusted to target the best average result based on the context window length in the LLMs parameters and the knowledge base capacity.
The method is able to quickly identify text blocks associated with risk factors by constructing a vector database and retrieving it by cosine similarity.

2.1.3. Reordering

In the risk assessment phase, in order to ensure the high relevance of the retrieval results to the risk factors, this study designs a hybrid reordering mechanism based on Cross-Encoder, whose core objective is to optimize the ordering of the candidate text blocks through fine-grained semantic interactions. When risk factors are input for risk assessment, the system triggers ElasticSearch for keyword matching and RAG for semantic similarity retrieval process synchronously, obtains the sets of candidate text blocks C E S and C R A G , respectively, merges the two blocks into C A L L , and then screens the top-5 high-confidence text blocks through dynamic weight fusion and deep semantic reordering. The specific process is as follows:
Retrieval result fusion: The match score between the query and all text blocks C A L L is computed based on the BM25 algorithm S E S , which is used to measure the word-frequency inverse document-frequency match between the query and the text blocks, and the semantic match score between the query and all text blocks C A L L is computed by cosine similarity S R A G , which is used to measure the degree of semantic alignment in the vector space. The two are linearly fused according to the dynamic weights λ :
S A L L = λ S E S + 1 λ S R A G
where S A L L represents the retrieval score of all text blocks. The value of λ ranges from 0 to 1. When λ > 0.5, it means that the retrieval score is based on ElasticSearch term matching, and vice versa, it is based on RAG semantic retrieval results. In this study, we set λ to be 0.5, which is a fusion strategy that takes into account both term matching and contextual semantic association. Finally, according to S A L L , the top-20 candidate text blocks C f u s i o n are filtered out.
Cross-encoder reordering: In order to further eliminate semantic bias, such as “postoperative analgesia” being mistakenly matched with “postoperative bedridden”, a fine-grained scoring of C f u s i o n is performed using a cross-encoder based on MedBERT fine-tuning. The cross-encoder splices the query Q and the text block C i into the joint input sequence C L S Q S E P C i S E P , and captures the interaction features between the two through a multi-layer Transformer encoder, and finally outputs the relevance probability:
S r e r a n k = S i g m o i d W · h C L S
where S r e r a n k is the result of the fine-grained scoring of the 20 text blocks in C f u s i o n , h C L S is the hidden layer vector labeled by C L S , W R 1 × d is the trainable parameter matrix, and d = 768 is the vector dimension. The scoring mechanism is able to recognize implicit semantic associations, e.g., for the query “length of postoperative bed rest”, ElasticSearch may return the text block “did not get out of bed on postoperative day 2 due to pain” = 0.88, whereas the RAG retrieves “Postoperative anticoagulation with low molecular heparin” = 0.82. After fusion and reordering, the former gets = 0.92 due to high semantic relevance, while the latter is filtered, due to semantic deviation, down to = 0.45.
Threshold screening and result generation: Set the relevance threshold θ = 0.7, only retain the text blocks with S r e r a n k ≥ θ, avoid the text blocks with too-low relevance to the query statement to serve as the basis for risk assessment, through the experiments, when the threshold value is 0.7, the accuracy of the assessment of scale topics reaches the peak, and the reordering effect is the best. The top-5 are selected in descending order of ratings as the contextual basis for the final risk assessment. When the number of text blocks exceeding the relevance threshold is less than 5, only a small number of text blocks are selected. The number of text blocks depends on the limitation of the maximum input length of the model. Too many text blocks will affect the model text comprehension when constructing the prompts.
The method significantly improves the recall precision of risk factor contexts through the dual optimization of hybrid retrieval fusion and deep semantic reordering.

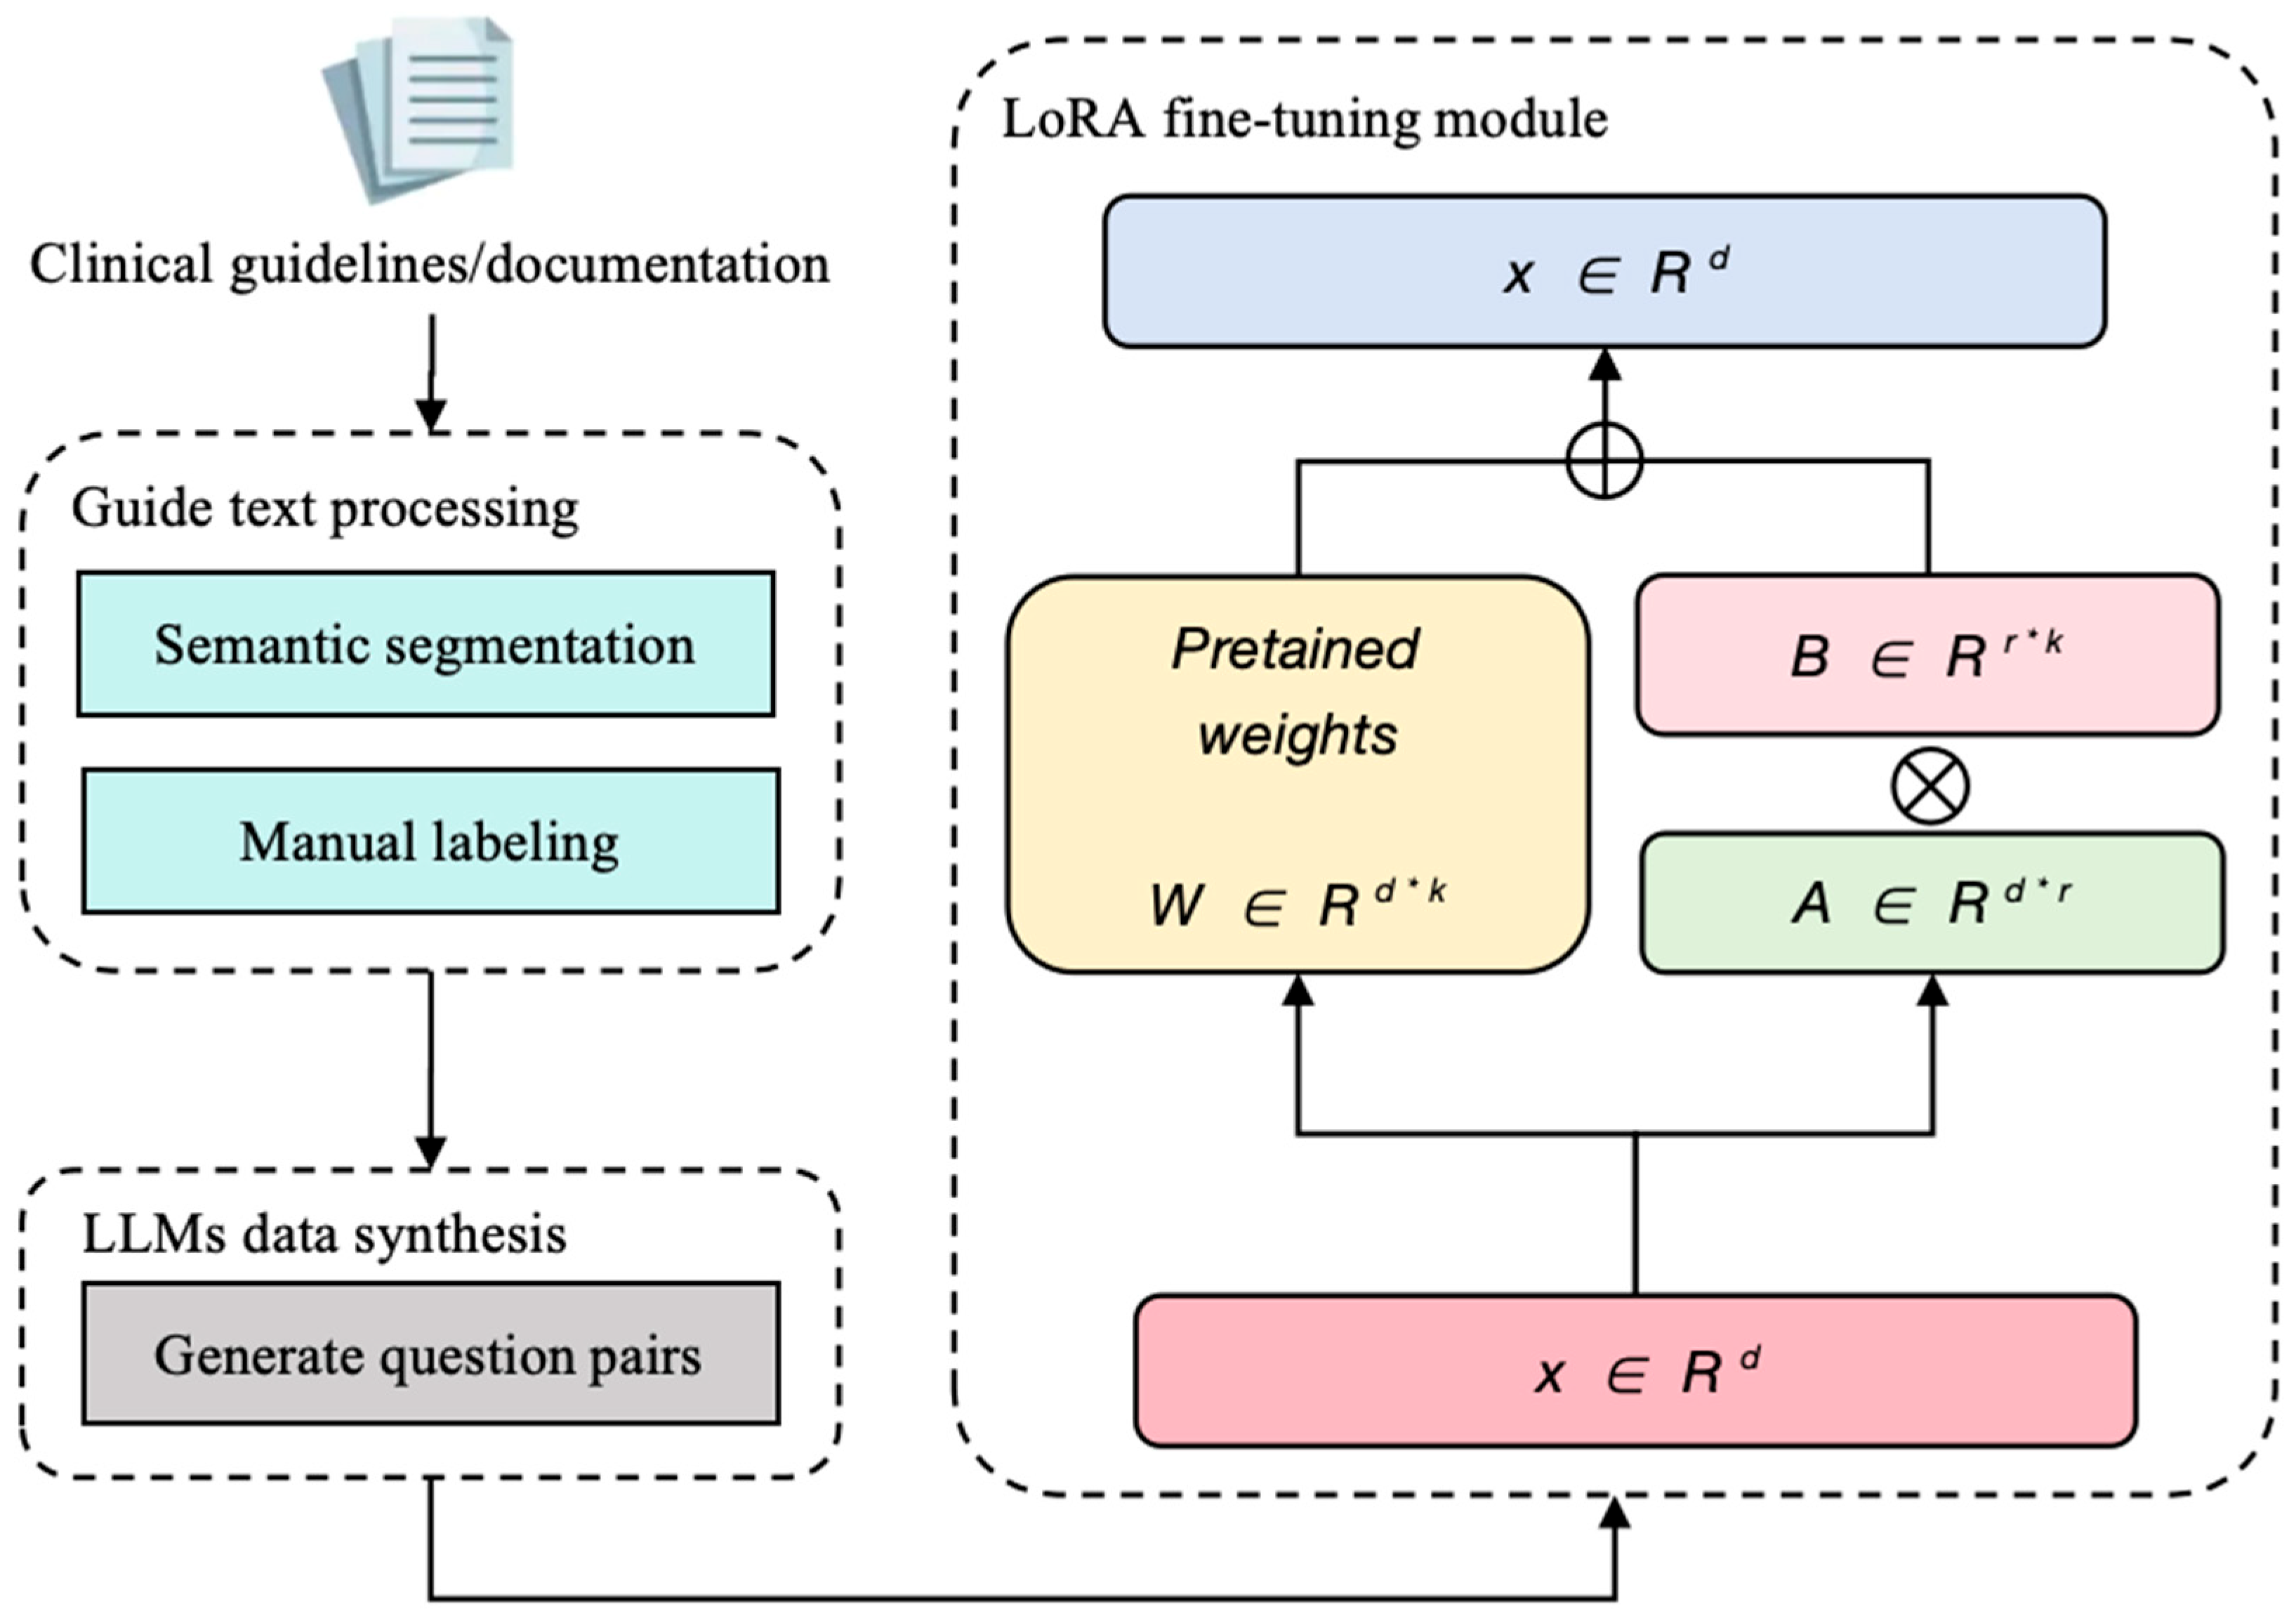
2.2. Domain-Adaptive Fine-Tuning Strategies

In order to achieve efficient alignment of large LLMs with evidence-based medical knowledge, this study conducted a domain-adaptive fine-tuning strategy based on the “Nursing Guidelines for the Prevention and Treatment of Venous Thromboembolism” [31], which was realized by embedding the knowledge of clinical specifications into the Qwen2.5-7B model through the LoRA technique. As shown in Figure 3, the process starts with the construction of the fine-tuned dataset: The text of the guidelines is first semantically segmented and subsequently fed into the Qwen2.5-7B model to generate clinical question–answer pairs associated with each paragraph. For example, a synthetic data sample was generated for the guideline provision “D-dimer > 500 μg/L suggests hypercoagulability”.
In Figure 3, A and B are the parameter matrices in the fine-tuning process: A is used to perform a low-rank transformation of the input features to adapt to the domain-specific feature distribution, and B is used to fine-tune the pre-training weights in concert with A to better adapt the model to domain-specific tasks. The LoRA technique is used in the fine-tuning stage to realize efficient parameter updating. While the traditional full-parameter fine-tuning requires adjusting all 7 billion parameters of LLMs such as Qwen2.5-7B, LoRA is achieved by injecting the low-rank matrices A and B into the self-attention module of the Transformer layer, as shown in the following formula:
W = W + A B
where A R d × r ,   B R r × k ; d represents the dimensionality of the input features, d = 4096 in the correlation model setting; r is the rank of the low-rank matrix, r = 8; and k is related to the model output. In this study, only 0.1% of the added parameters, about 70M parameters, are fine-tuned. Specifically, the forward calculation of the original weight matrix W 0 R d × d was corrected. The calculation formula is shown below:
h = W 0 x + W x
where x is the input feature vector whose dimension is related to d, which is the data representation of the model input, and h is the output feature, which is the feature representation obtained after the model computation. By freezing the original parameter W 0 and training only A and B , the model can accurately capture the diagnostic logic of medical scenarios, such as the association between “D-dimer abnormality” and “anticoagulant therapy”, while retaining the general semantic capability.
The training objective function is defined as the weighted sum of the cross-entropy loss and the guideline compliance constraints. The formula is shown below:
L = α · L C E y , y ^ + β · L g u i d e l i n e y g e n , y r e f
where L C E is the standard text generation loss, which is used to measure the difference between the model generated text y ^ and the real label y ; L g u i d e l i n e is the compliance penalty term based on the rule engine, which is used to evaluate the degree of conformity of the generated answer y g e n deviating from the guideline terms y r e f . The two weighting coefficients of α and β are hyper-parameters, which need to be adjusted according to the specific task and dataset in order to find the optimal balance between the cross-entropy loss and the compliance penalty term, thus optimizing the performance of the model. The method effectively solves the problem of medical text scarcity through knowledge-guided synthetic data generation and efficient fine-tuning of parameters, providing intelligent support for clinical decision-making with high compliance and low risk.

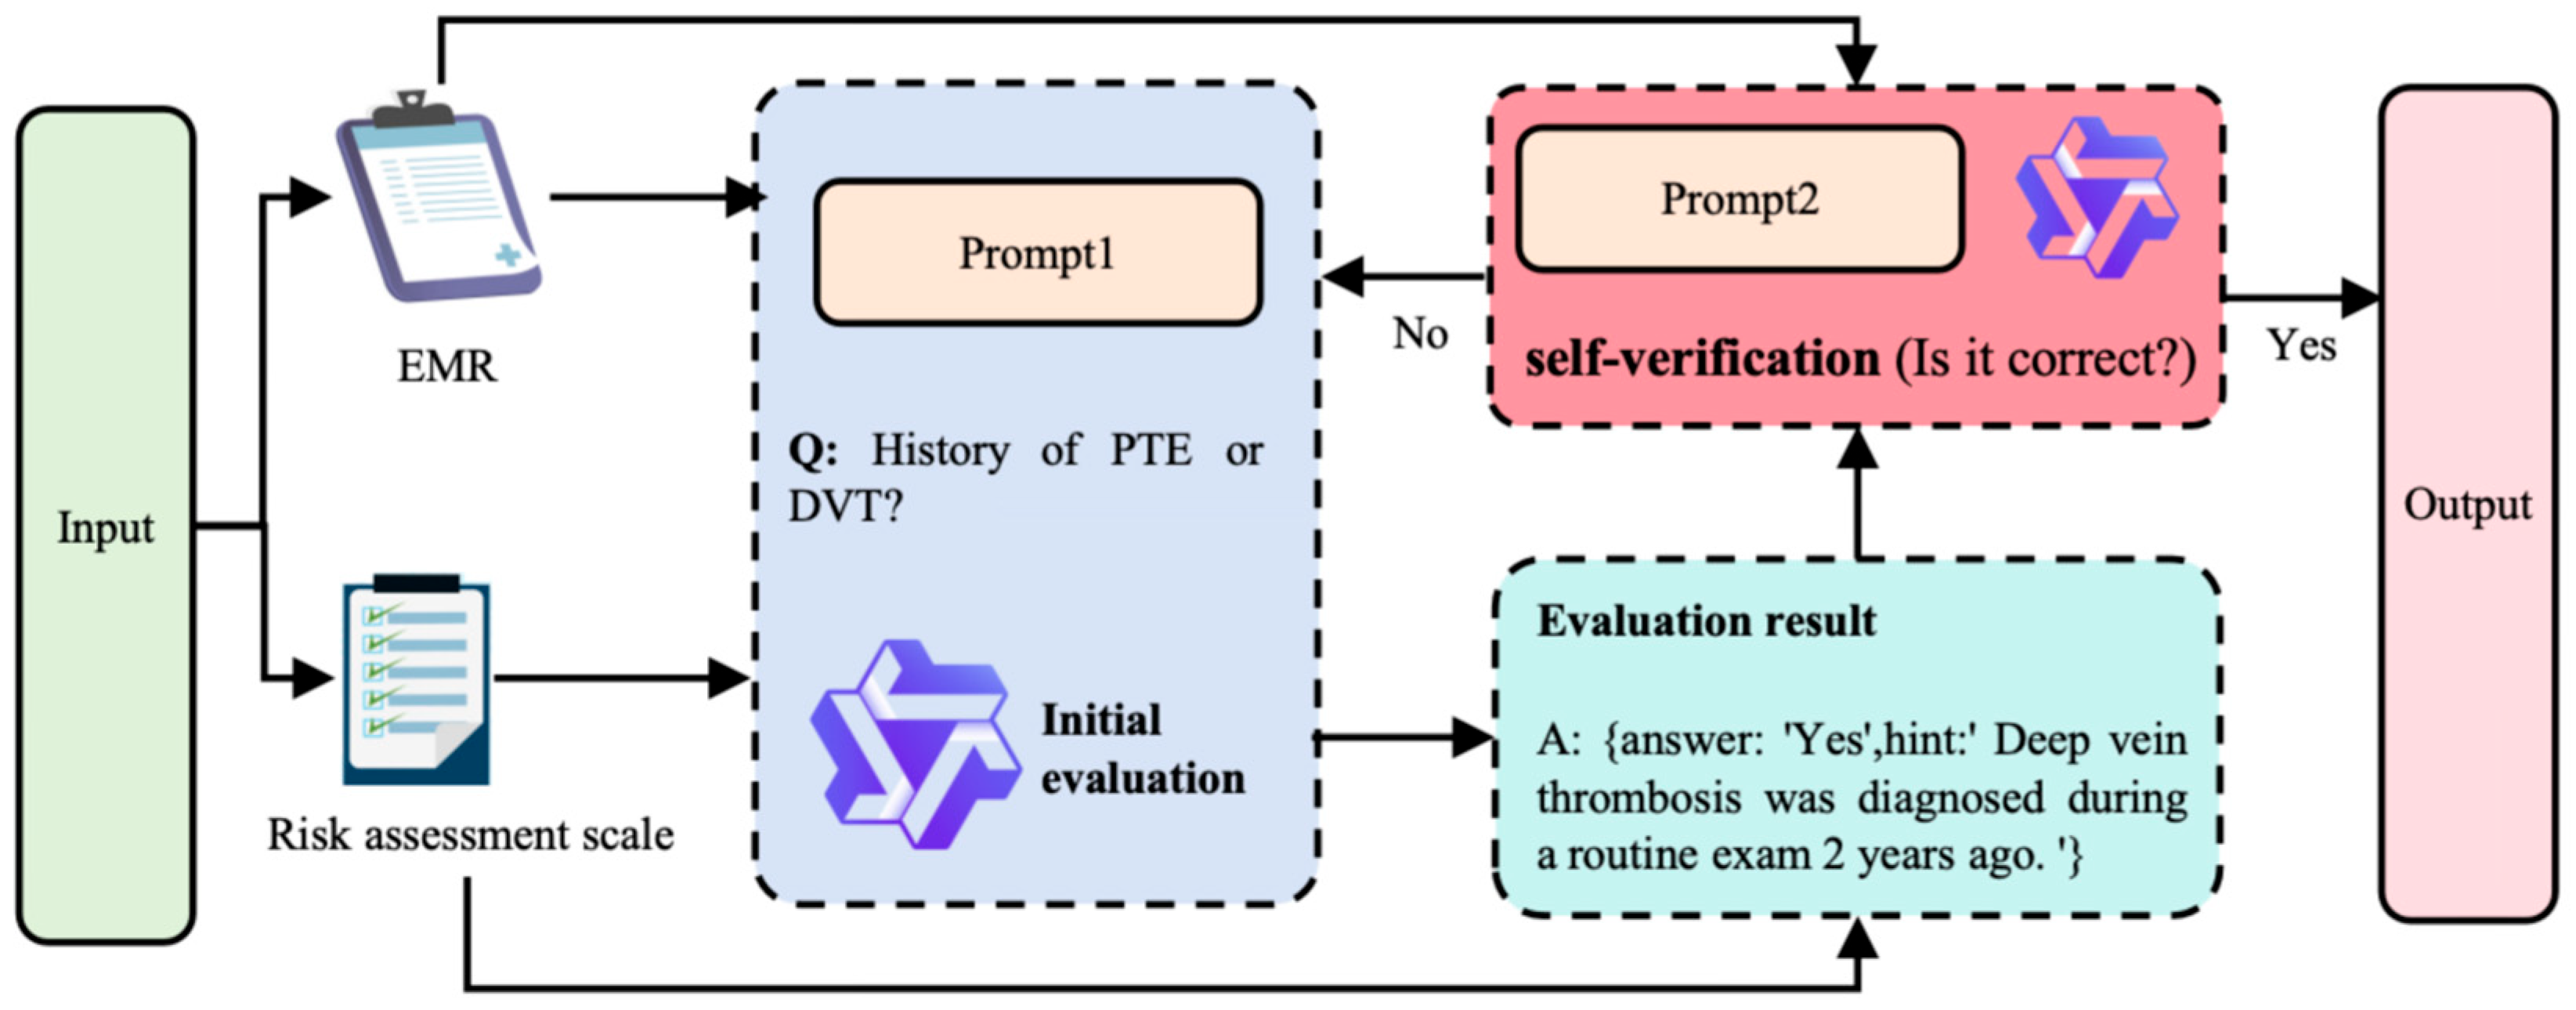
2.3. Generation–Verification Closed-Loop Mechanism

Aiming at the problem of Hallucination in LLMs for medical tasks [32], i.e., the generated content seems meaningless or unfaithful to the provided source content. In this study, we propose a closed-loop system based on Self-Verification Augmentation (SVA) to simulate the clinician’s dual decision-making validation process, so as to suppress model misjudgments due to overfitting or semantic drift. In the following, the dynamic cue engineering and self-validation augmentation mechanism are elaborated.

2.3.1. Dynamic Hints Project

The Dynamic Cueing Project aims to achieve seamless adaptation of multi-scale risk assessment tasks through context-aware instruction chain generation algorithms. Its core design principle lies in explicitly encoding scale assessment logic into structured cueing templates, thereby guiding LLMs to output standardized results according to evidence-based medical specifications. The specific construction method is as follows:
For Caprini, Padua, and other target scales, analyze their risk assessment entries and weighting rules, such as the Caprini scale of “surgery duration > 45 min” corresponds to 2 points, and extract the key risk factor set F . The formula is shown below:
F = f 1 , f 2 , , f n
where f n is the risk factors in the scale, such as surgical history and coagulation indices. The output format is defined through the JSON Schema to force the model to generate results according to a predefined template. Define the Prompt template as shown in Table 1.
Dynamic cue engineering achieves zero-sample adaptation for multi-scene assessment tasks through scale logic encoding with structured output constraints. Experiments show that the method does not require model retraining in switching between scales such as Caprini and Padua. The mechanism doubly guarantees the clinical compliance of the output by semantically checking the correlation between the risk factors and the rationale through syntactic constraints such as enumeration value restriction.

2.3.2. SVA

As humans, after we infer a conclusion, we tend to check it and avoid errors by revalidating it. When complex reasoning is involved, language models often lack robustness, and any small misrepresentation may change the full meaning of the proposition, leading to a wrong answer, which this study attributes to the model’s illusions. One previous solution is to evaluate the model output correctness by training validators (verifiers). However, there are three major drawbacks of training verifiers: they require many human and computational resources, they may have false positives, and they have poor interpretability.
Weng et al. [33] introduced two methods, conditional mask-based self-validation and true–false item validation, to allow LLMs to self-validate. Conditional masking-based self-validation masks one of the conditions and uses the candidate conclusions and other known conditions to derive the masked condition values to test the consistency of the conclusions. True–false item validation does not mask any of the conditions and allows the model to reverse inference by automatically determining whether the conclusion satisfies the conditions. Its experiments, in which the self-validation method was introduced in six arithmetic reasoning datasets, yielded an average improvement of up to 2.84%, demonstrating the effectiveness of self-validation on both common-sense reasoning and logical reasoning datasets. This study shows that LLMs can use self-validation with only a few hints and without training or gradient updating.
In this study, based on the self-validation theory proposed by Weng et al., and considering that multiple conditions are not involved in the task of this study and that there is no data computation or inference relationship in the content of the medical records, a self-validation enhancement mechanism was constructed using true–false item validation. The self-validation prompt template was constructed, as shown in Table 2.
The relevant cases used in the generation phase and the preliminary conclusions obtained were input into the large model again to verify the correctness of the results obtained from the initial assessment of the model. The flow of the self-validation enhancement mechanism is shown in Figure 4.
In natural language processing tasks, model “illusion” refers to the phenomenon that the generated content is contrary to the objective facts, logic, or input information. Traditional methods rely on manual verification or external knowledge base comparison, but face a double challenge in the electronic medical record risk assessment scenario: on the one hand, the generation of medical records needs to strictly follow the individual characteristics of patients, and the cost of manual annotation is extremely high; on the other hand, the authenticity of the generated results needs to be verified based on a single sample, and the general knowledge base is difficult to be adapted. To this end, this study proposes a dynamic iteration of the hallucination rate assessment index, whose core logic lies in testing the ability of the model self-validation mechanism to suppress hallucinations: if the model-generated answer passes the self-validation after the initial output or a single correction, it is regarded as the effective elimination of hallucinations; if it fails to pass the validation after two consecutive corrections, then it is judged as an anomaly and a cumulative count is made. By limiting a single evaluation to trigger a maximum of five validation iterations with consecutive failures as the termination condition, this metric quantifies the stability of the model under limited error correction attempts. The phantom rate is calculated as shown in Equation (10):
H = R T × 100 %
where R denotes the number of abnormal assessments defined, indicating that the iterative correction is triggered by logical contradictions or unsupported conclusions and fails to pass the validation even after two consecutive corrections. T denotes the total number of assessments.
To verify the effectiveness of the self-validation module, the ablation experiment removes the module and directly outputs the raw generated results, while the same validation logic is called asynchronously to count the number of illusions. By comparing the difference in the illusion rate between the experimental group and the control group, the contribution of the self-validation mechanism in suppressing the fictitious information of the model can be clarified.
By introducing the self-validation mechanism of the big model, the system is able to automatically detect and correct the generated content. Re-inputting the corrected output and the original cue information into the model for iterative generation can effectively identify and correct errors, improve the accuracy of the model output, and make full use of the text comprehension capability of the big model to improve the accuracy of VTE risk assessment compared to directly using the judgment results output from the big model. Experiment 4 in this paper verifies the effectiveness of the SVA mechanism in coping with the hallucination problem.

3. Experimentation and Analysis

3.1. Data

The experimental data used in this study were derived from the electronic medical record data of 1236 inpatients admitted to a tertiary hospital in Yunnan Province, China, during the period 2020–2023, and contained multidimensional clinical information such as chief complaint, current medical history, past history, examination results, medication records, and surgical records. The dataset covered 618 patients with confirmed VTE and 618 patients without confirmed VTE at the time of data collection, with DVT accounting for 68.3% of confirmed patients and PE accounting for 31.7%. This is a retrospective study, and only the case data before diagnosis were kept for confirmed patients to avoid the interference of confirmed diagnosis information in medical records on the prediction model. The total text volume amounted to 4.2 GB, containing 25,874 unstructured medical records and 3452 structured test reports.

3.1.1. Data Pre-Processing

Semantic chunking process: Continuous text is cut into semantically coherent text chunks based on syntactic parsing rules that rely on the Stanford CoreNLP toolkit [34]. The chunking process preserves complete sentence boundary markers, such as periods and semicolons, to ensure that each text chunk contains independent clinical observation or disposition information. Entity–context dynamic associations have been described in detail.
Entity–context dynamic index construction: Based on RoBERTa-wwm and the multi-attention Chinese EHR named entity recognition model, we annotate 12 types of clinical entities, such as “D-dimer > 500 μg/L”, “low molecular heparin anticoagulation therapy”, and construct the entity–text block association matrix. Each entity annotation contains entity category, text block ID, and contextual fragments of 50 characters before and after the entity, and evidence of clinical guideline association.
Semantic retrieval knowledge base construction: The text blocks are vectorized and stored in the Milvus vector database, and a hybrid retrieval system is established by combining with ElasticSearch. The vector encoding adopts the medical domain-adapted BERT variant of the ERNIE-Health model to generate 768-dimensional dense vectors, and the cosine similarity threshold is set to 0.85 to ensure the semantic relevance. The preprocessed data set is divided in an 8:1:1 ratio.

3.1.2. Scale Introduction

In the clinical management of DVT and PE, the scientific selection of risk assessment tools is the basis for individualized prevention and treatment strategies. In this study, four commonly used clinical risk assessment scales were used to validate the effectiveness of the method, Caprini scale, Padua scale, simplified version of Wells scale, and revised version of Geneva scale, and the contents of the relevant scales are shown in Table A1, Table A2 and Table A3.

3.1.3. Fine-Tuning Dataset Generation

The fine-tuning of the clinical guidelines was performed by manually segmenting the text of the “Nursing Guidelines for the Prevention and Treatment of Venous Thromboembolism” guidelines according to the paragraphs, in order to retain the complete semantics as much as possible, and at the same time, the length of a single paragraph was no more than 1000 Chinese characters. The Qwen2.5-7B model generates clinical Q&A pairs corresponding to the text blocks of the paragraphs, and 1000 synthetic Q&A pairs are constructed as the fine-tuning dataset. For example, in response to the guideline provision that “postoperative bed rest for ≥3 days increases the risk of VTE”, the model generates the question “<Q>: Does a patient’s continued bed rest for 5 days postoperatively trigger the ’activity limitation’ item in the Caprini scale? <A>: Yes.” and other question-and-answer pairs. Fine-tuning the dataset helps the model to build a VTE domain body of knowledge for accurate responses on risk assessment and self-validation tasks.
To ensure the medical rigor and reliability of the data generated for the Q&A pairs, data validation and cleansing are required. For example, the “Diagnostic Strategies for PTE” section of the modeling guide generated five sample Q&A pairs, as shown in Table 3, and subjected them to data validation and cleansing.
In the first step, duplicate question entries with semantic similarity higher than a set threshold are screened by similarity matching, Q&A pairs with grammatical errors and semantic mutilations in the question or answer are removed, and data with low relevance of the question to VTE prevention and care are removed. For example, in example Q&A pair 1 in Table 3, there is no semantic correspondence between the question and the answer.
In the second step, the remaining data were evaluated using the Qwen2.5-7B model to evaluate the semantic relevance of the questions and answers, and the responses with incorrect logical associations were generated twice. For example, in example Q&A pair 2, an error was made in the logical correlation, and the second-generated response was “Hemodynamically stable with no elevated RVD or cardiac biomarkers”.
In the third step, the semantically complete dataset obtained in the second step was reviewed by phlebotomists to consider corrections or exclusions for disease care rules and entries with medical theory errors. For example, the example question-and-answer pair 3 was not adequately answered; the correct response was “intermediate-risk patients with both right ventricular dysfunction (RVD) and elevated cardiac biomarkers”.

3.2. Experimental Setup

3.2.1. Experimental Environment

This study builds an experimental environment based on NVIDIA RTX 4090, and relies on the Ollama framework to achieve localized deployment and inference optimization of LLMs. The configuration of the experimental environment is shown in Table 4.
In the experiment, several LLMs were deployed simultaneously through Ollama, as shown in Table 5.
The models are all deployed in parallel with a single NVIDIA RTX 4090 graphics card, and the distributed inference acceleration is achieved by model deployment through the Ollama open-source cross-platform LLMs tool. All models in the experiment share the same retrieval enhancement configuration and validation mechanism, including the Milvus vector database, ElasticSearch entity retrieval, and closed-loop generation–validation mechanism to ensure the fairness of comparison results. The inference optimization strategies include dynamic mixed-precision computation, local model caching, and high-frequency query result caching.

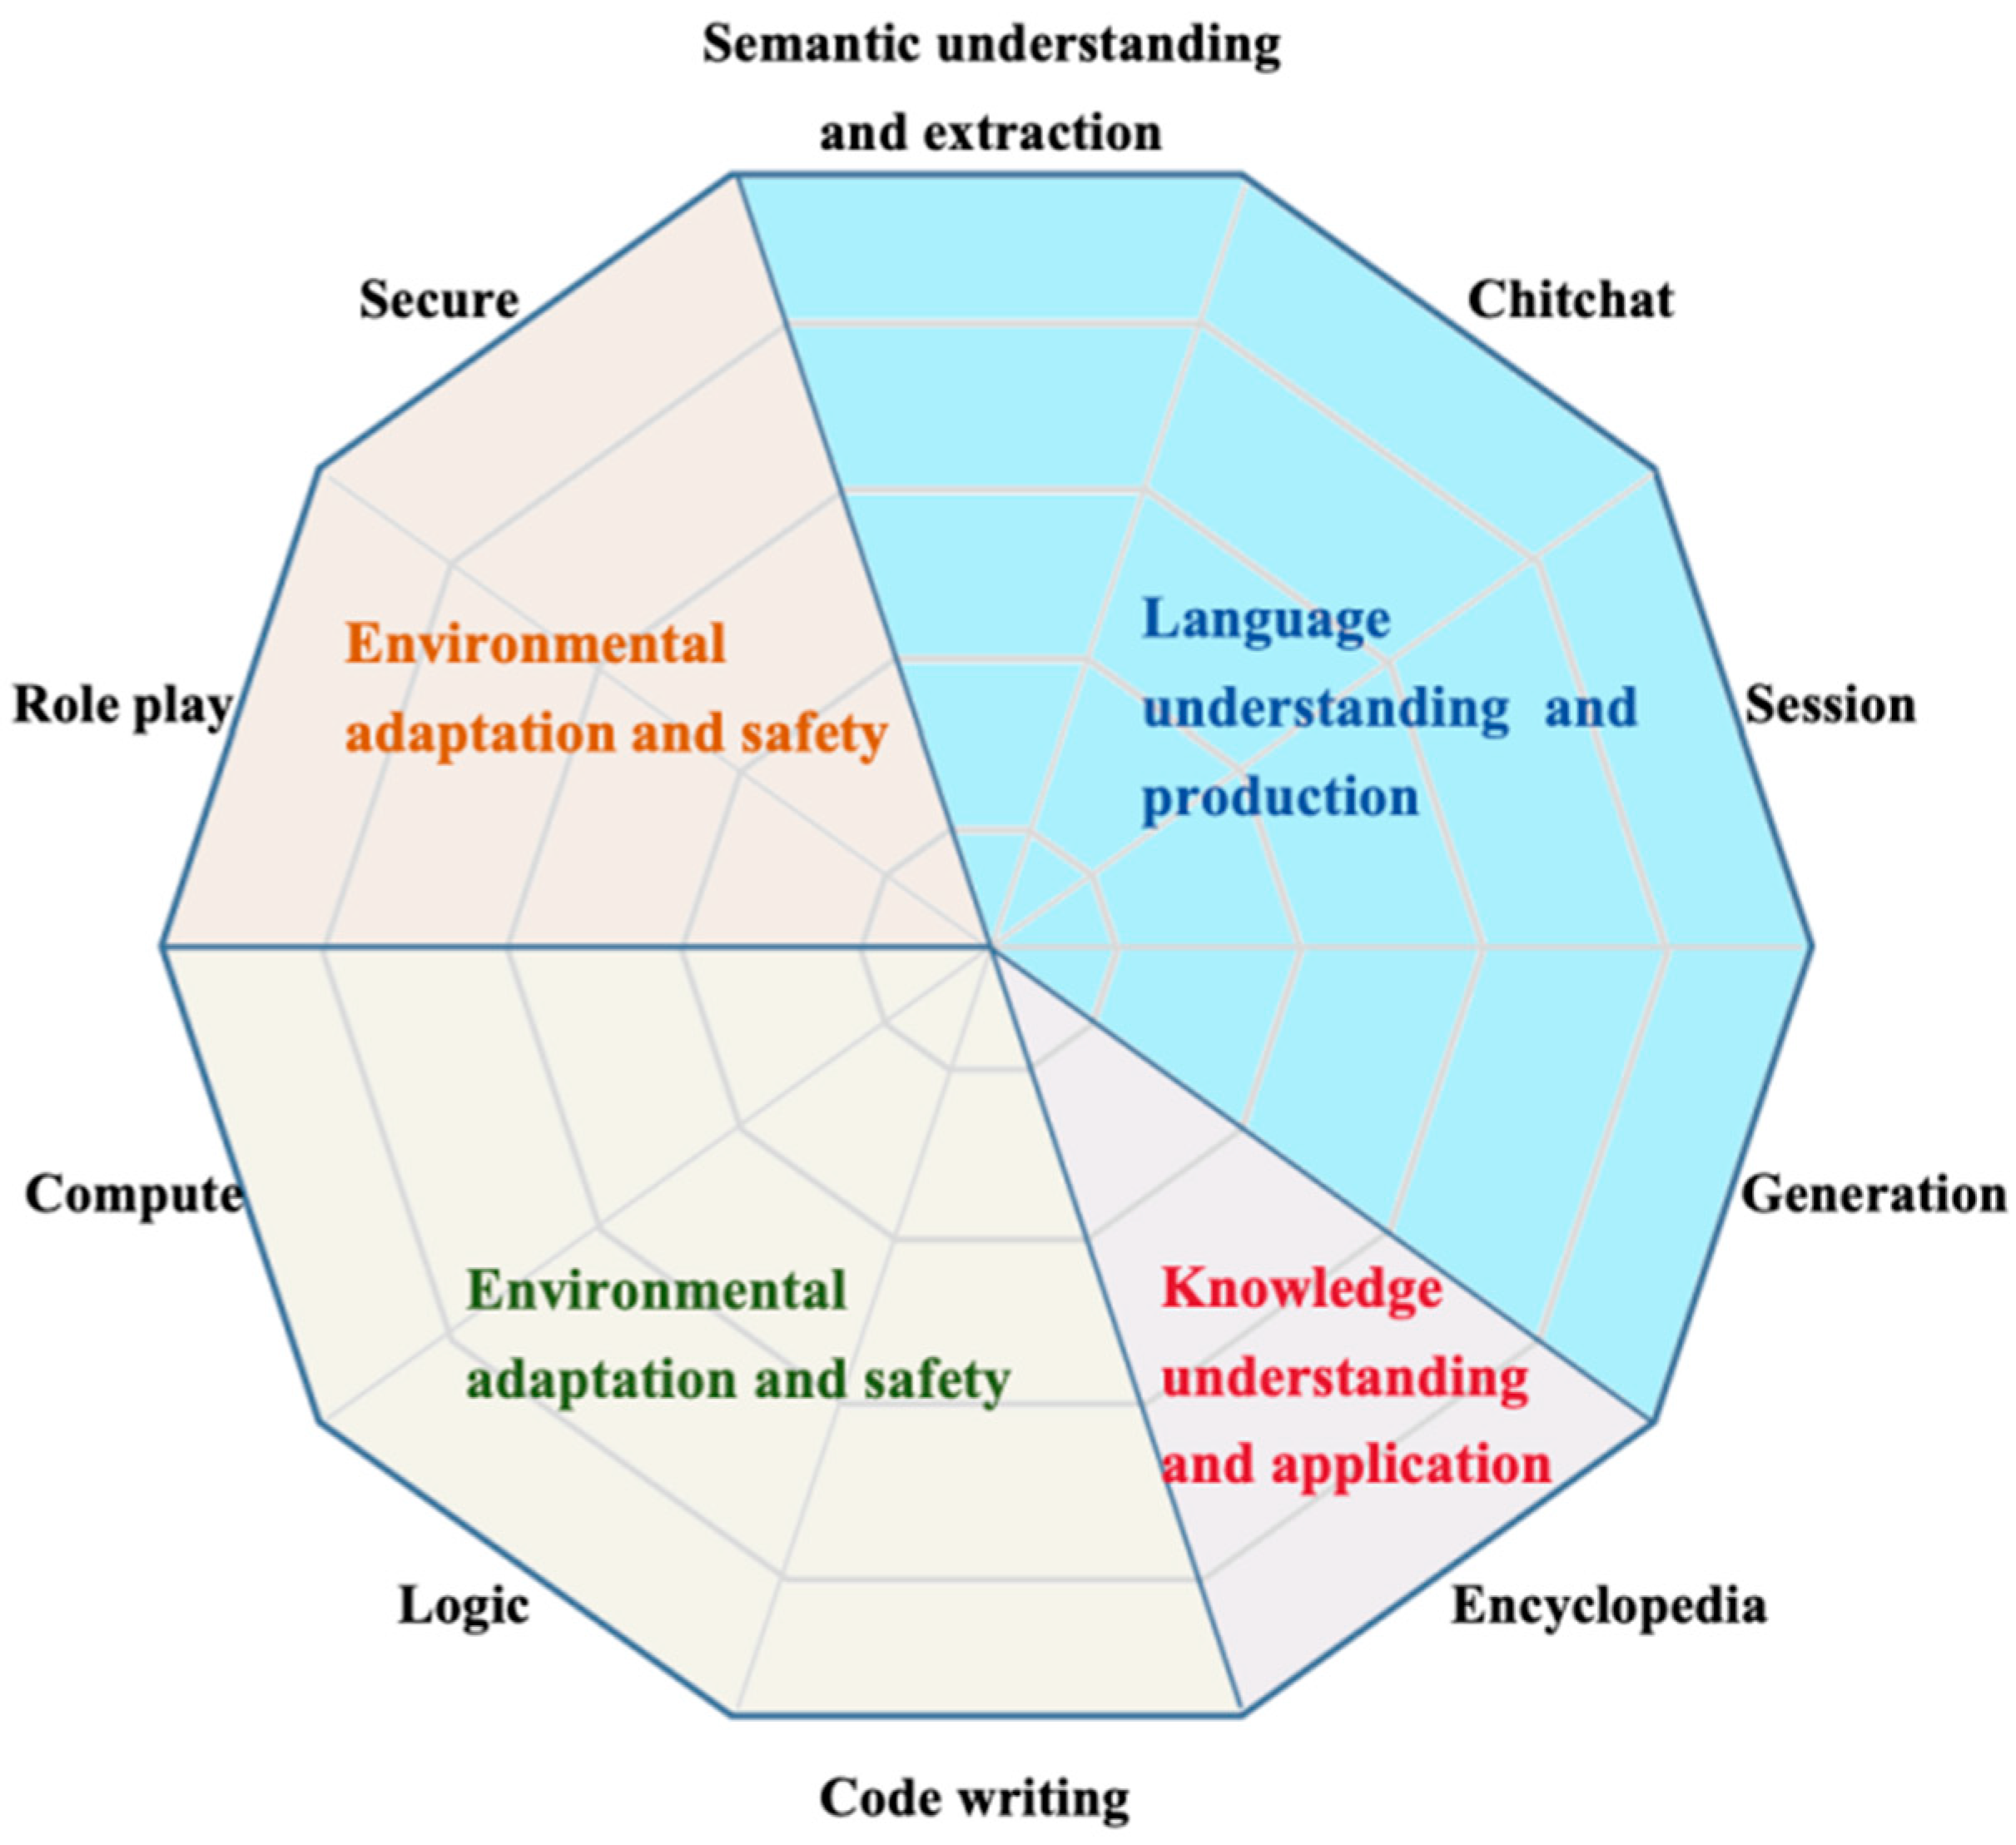
3.2.2. LLM Selection

Given the sensitivity characteristics of clinical medical data and the legal requirements for patient privacy protection, future application scenarios need to be deployed locally and filed by the state; this study excludes the use of generative AI services and non-open-source LLMs from outside China. By systematically evaluating the open-source general-purpose large models, the model architectures with excellent performance in Chinese processing tasks are screened for subsequent domain-adaptive training.
As shown in Figure 5, this study adopts the SuperCLUE [35] Chinese generalized LLMs evaluation framework to comprehensively evaluate the model performance from ten core capability dimensions, and this benchmarking system pays special attention to the comprehensive evaluation of Chinese semantic comprehension and text generation capabilities.
Table 6 shows the performance ranking of the mainstream open-source big models in China, which is derived from the latest ranking released by SuperCLUE on 15 January 2025, and the top ten are intercepted for the evaluation of this study. Based on this list, this study filters out the most suitable big model architectures for the current application scenarios in the healthcare domain in conjunction with the study scale. Among many domestic open-source models, Deepseek-V3, the largest open-source model in terms of number of participants, ranks first with its excellent performance in science and hard problems, while Deepseek-V2.5, another open-source model developed by the corresponding company Deepseek, ranks fourth, with a number of participants of 236 B. In the second and third places are the open-source models developed by Alibaba: the Qwen2.5 series of models, with 72 B and 32 B parameters, respectively. Sixth place went to Qwen2.5-7B-Instruct, which provided equally efficient performance with the smallest number of parameters on the list, 7 B.
Combining the systematic Chinese performance of SuperCLUE, the experimental resource carrying quota, and the consideration of data privacy in clinical scenarios, Qwen2.5-7B-Instruct is chosen as the base large model in this study, which, as the best performing model evaluated under the number of tens of billions of covariates, has a high degree of superiority in terms of the equipment requirements for the experimental deployments, as well as in terms of the performance of the tasks in this study.

3.3. Evaluation Indicators

The following metrics were used in this study to assess model performance:
Precision (P). Indicates the proportion of samples correctly identified as positive examples to all samples predicted as positive examples:
P = T P T P + F P
where TP is true positive and FP is false positive.
Recall (R). Indicates the proportion of samples correctly identified as positive cases to all actual positive case samples:
R = T P T P + F N
where FN is false negative.
F1 value. The reconciled mean of the combined accuracy and recall:
F 1 = 2 P R P + R
Hallucination Rate (H). As presented in Section 2.3.2, this metric is based on the methodological design of this study and is used to measure the proportion of false conclusions generated by the model; see Equation (10).
Assessment Time (Inference Time). Records the average elapsed time in seconds for a single risk assessment, reflecting the real-time nature of the model.

3.4. Experimental Results and Analysis

Experiment 1: Multi-scale assessment results.
The results of the multiscale risk assessment based on the Qwen2.5-7B LLMs are shown in Table 7, and the accuracy of the model on the Caprini, Padua, Wells, and Geneva scales reached 79.56%, 88.32%, 90.51%, and 84.67%, respectively, which were all significantly better than the consistency level of the assessment by the clinical experts, and the inter-expert Kappa coefficient was 0.78.
The Wells scale had the best performance, with an F1 value of 89.47%, because its assessment logic relied on clear clinical risk factors, such as D-dimer and chest pain symptoms, which were highly compatible with the descriptions of key text blocks retrieved by the model through search augmentation. The Caprini scale had the lowest accuracy of 79.56%, probably because it involved more than 40 complex indicators, such as type of surgery and age stratification. For the same indicator, there may be different periods of condition narratives in the case, and there is a bias in the model understanding, and more indicators means less tolerance. The Padua scale has the highest consistency between the model and the experts, with an accuracy difference of only 1.91%, which indicates that the model is more effective in identifying and clinically judging risk factors such as obesity and activity limitation of the internal medicine patients. It has been shown that there are more detailed physiological indicators and treatment recommendations in the cases of internal medicine patients, and these semantic relationships allow the larger model to model patients more accurately. Due to the impact of complex cases, 30% of complex cases in the test set, such as VTE patients with combined multi-organ failure, resulted in a 2.3% decrease in the recall rate of the Geneva scale, but the model still maintained a high accuracy rate through dynamic cue engineering.
The above experimental results validate the effectiveness of the retrieval-enhanced large model in multi-scale assessment, while its structured output, a list of risk factors in JSON format, provides clinicians with a traceable basis for decision-making and significantly improves assessment efficiency and standardization.
Experiment 2: Comparison with supervised methods.
To ensure consistent evaluation, we conducted comparative experiments between the Qwen2.5-7B LLMs and 3 supervised methods. The results are presented in Table 8.
Caprini scale: The accuracy of this study was 79.56%, slightly lower than the 79.9% of He et al. This is mainly due to the fact that the scale involves large changes in physiological parameters within a short period of time, and there may be multiple narratives of different periods in the medical records, requiring deep logical reasoning entries, which can be further optimized in the future by enhancing the parsing capability of the pathology report.
However, He et al. only conducted Caprini scale risk assessment for trauma patients, with a small sample size and a single-center study, and there are limitations in designing features through multiple machine learning methods and eliminating overfitting by using regularization terms. The model in this study performs more consistently in complex cases, such as multidisciplinary consultation records, by performing electronic medical record text retrieval on patients without the need for predefined features.
Wells scale: The accuracy rate of this study was 90.51%, which was significantly higher than the 84.7% of Chen et al. [16]. The Wells scale has the least number of items, and most of them are symptomatic descriptions, and few of them are indicator descriptions, and the dynamic cueing engineering and the SVA mechanism of this paper’s method are effective in dealing with semantic ambiguities of the symptoms in the patient’s case.
Geneva scale: The accuracy of this study’s method was significantly worse compared to Chen et al.’s method; lagging behind by 1.43%, the scale was more rigorous in design, with the addition of age and heart rate items compared to the Wells scale, and some undiagnosed patients were incorrectly judged to be diagnosed because of an occasional heart rate of more than 95 beats/min combined with an age of more than 65 years old, which was due to the lack of depth in this paper’s methodology inference capability. The large model is unusually sensitive to specific descriptions and the lack of risk assessment of patients from the time dimension, which is also a limitation of this paper’s trial.
Padua scale: The F1 value of this study’s method was 87.00%, which was lower than the F1 value of 0.883 of Yang et al. However, both were higher than the assessment accuracy of the clinical experts.
The combined performance on the four scales, with a mean F1 of 84.53%, significantly outperformed the single scale optimization method and achieved the assessment accuracy of clinical experts. The adaptive advantage of multimodal retrieval and dynamic cueing on cross-scale assessment was verified.
Experiment 3: Comparison between different LLMs.
The results of the comparison of four large models of the same parameter magnitude deployed based on the Ollama framework in the same experimental setting are shown in Table 9 below. All models used retrieval-enhanced configuration with the SVA mechanism, and the test set contained 103 VTE patients.
Qwen2.5-7B had the best overall performance, with significantly higher F1 values than the other models in all scales, e.g., the Caprini scale F1 = 78.16%, which was 5.01% higher than that of DeepSeek-R1-7B. The lowest rate of hallucination averaged 3.1%, which was attributed to the synergistic effect of the domain-adaptive fine-tuning and the SVA mechanism. The average evaluation time was only 0.2 s slower than Llama2-7B, validating the effectiveness of quantization and parallel optimization.
DeepSeek-R1-7B has a significant problem with hallucinations: The rate of hallucinations is 15.7–19.3%, such as misclassifying “postoperative analgesia” as “bleeding risk”. Although the accuracy on the Wells scale was 85.44%, the recall rate was 83.02% due to logical drift.
The Chinese language ability of the Llama series is limited. Llama2-7B only has an F1 value of 63.88% on the Caprini scale due to a biased understanding of terminology such as “malignant tumor” and “anticoagulation therapy”. Llama3.1-8B, despite its improved logical reasoning ability, still has performance bottlenecks due to Chinese word separation errors, e.g., “deep vein thrombosis” was segmented as “deep vein/thrombosis” but wrongly segmented as “deep/vein/thrombosis”. In Chinese expression, deep veins and veins represent two different meanings.
Evaluation time vs. model size tradeoff: Llama2-7B has the fastest inference speed of 1.9 s but the worst Chinese language capability. Qwen2.5-7B achieves a balance of speed and accuracy with 7 billion parameters through optimization measures such as sparse attention by the model.
Qwen2.5-7B demonstrates significant advantages in Chinese medical scenarios, with its domain adaptation fine-tuning and SVA mechanism effectively suppressing hallucinations and enhancing clinical confidence, providing a more reliable solution for VTE risk assessment.
Experiment 4: Ablation Experiment.
The results of the ablation experiments based on the Qwen2.5-7B model validate the contribution of each core module to the model performance. The experiment was performed on 103 VTE patients from the same test set, and the evaluation metrics included accuracy (P), recall (R), F1 value, evaluation time, and phantom rate. The evaluation results are shown in Table 10.
The complete model achieved 79.56%, 88.32%, 90.51%, and 84.67% accuracy on Caprini, Padua, Wells, and Geneva scales, respectively, and the illusion rate was controlled in the range of 2.5–3.4%, demonstrating the synergistic effect of the multimodal retrieval optimization and the generation–validation closed-loop mechanism.
After removing the entity–context dynamic association, the F1 value of the Caprini scale plummets by 6.98%, from 78.16% to 71.18%. Theoretically, this module mainly solves the problems of semantic fragmentation of long texts and the omission of technical terms, while the Caprini scale involves more than 40 complex indicators, which should be more dependent on semantic retrieval than on entity–context, but the results are not good. It was found that some risk factors such as “swelling of upper and lower extremities” and “varicose veins” had too many semantic similarities in the cases, and the RAG semantic search alone might not be able to accurately locate the contextual contexts of the keywords due to semantic segmentation. The 5.6% increase in phantom rate indicates that dynamic indexing is essential to suppress logical drift such as misclassifying “postoperative analgesia” as “bleeding risk”.
Removal of the RAG-enhanced search module resulted in a 4.11% decrease in the Padua scale F1 value, from 84.07% to 79.96%. This was due to the fact that entity–context search, although capable of accurately capturing the contextual semantics of the terminology, was unable to capture the implicit association between “central venous catheterization” and “thrombotic risk”. After removal, the assessment time was reduced by 0.4 s, but the phantom rate increased by 8.4%, from 2.8% to 11.2%, validating the need for semantic retrieval to reduce logical drift.
The absence of the reordering module resulted in a 2.29% decrease in the F1 value of the Wells scale, from 89.47% to 87.18%. This was due to the non-filtering of irrelevant text blocks such as “postoperative analgesia”, which resulted in the misclassification of the symptom “chest pain”. The cross-coder contributed significantly to the semantic calibration of “not getting out of bed” and “length of time in bed”, effectively suppressing the rate of hallucinations by 1.7%, from 7.4% to 5.7%.
After the SVA mechanism was removed, we still detected the hallucination rate, but did not correct the erroneous output. Hallucination rates increased by an average of 11.7%. For example, the Caprini scale hallucination rate increased from 3.1% to 14.8%, with typical errors including incorrectly associating “lower extremity edema” with “obesity” without triggering correction logic. The Padua scale F1 value decreased by 2.16% from 87% to 84.84% due to the lack of logical consistency checking of “BMI ≥ 30” and “edema”, suggesting that SVA has an irreplaceable role to play in maintaining compliance in clinical decision-making. This demonstrates the irreplaceable role of SVA in maintaining compliance with clinical decision-making.
Each module has a synergistic enhancement effect on the model performance, among which the entity–context dynamic association and the SVA mechanism contribute most prominently, improving the accuracy of risk factor traceability and the ability of phantom suppression, respectively. The ablation experiment not only verifies the effectiveness of the multimodal retrieval optimization strategy, but also highlights the necessity of the generation–validation closed-loop mechanism in clinical decision-making systems, providing empirical support for the clinical reliability of the model.

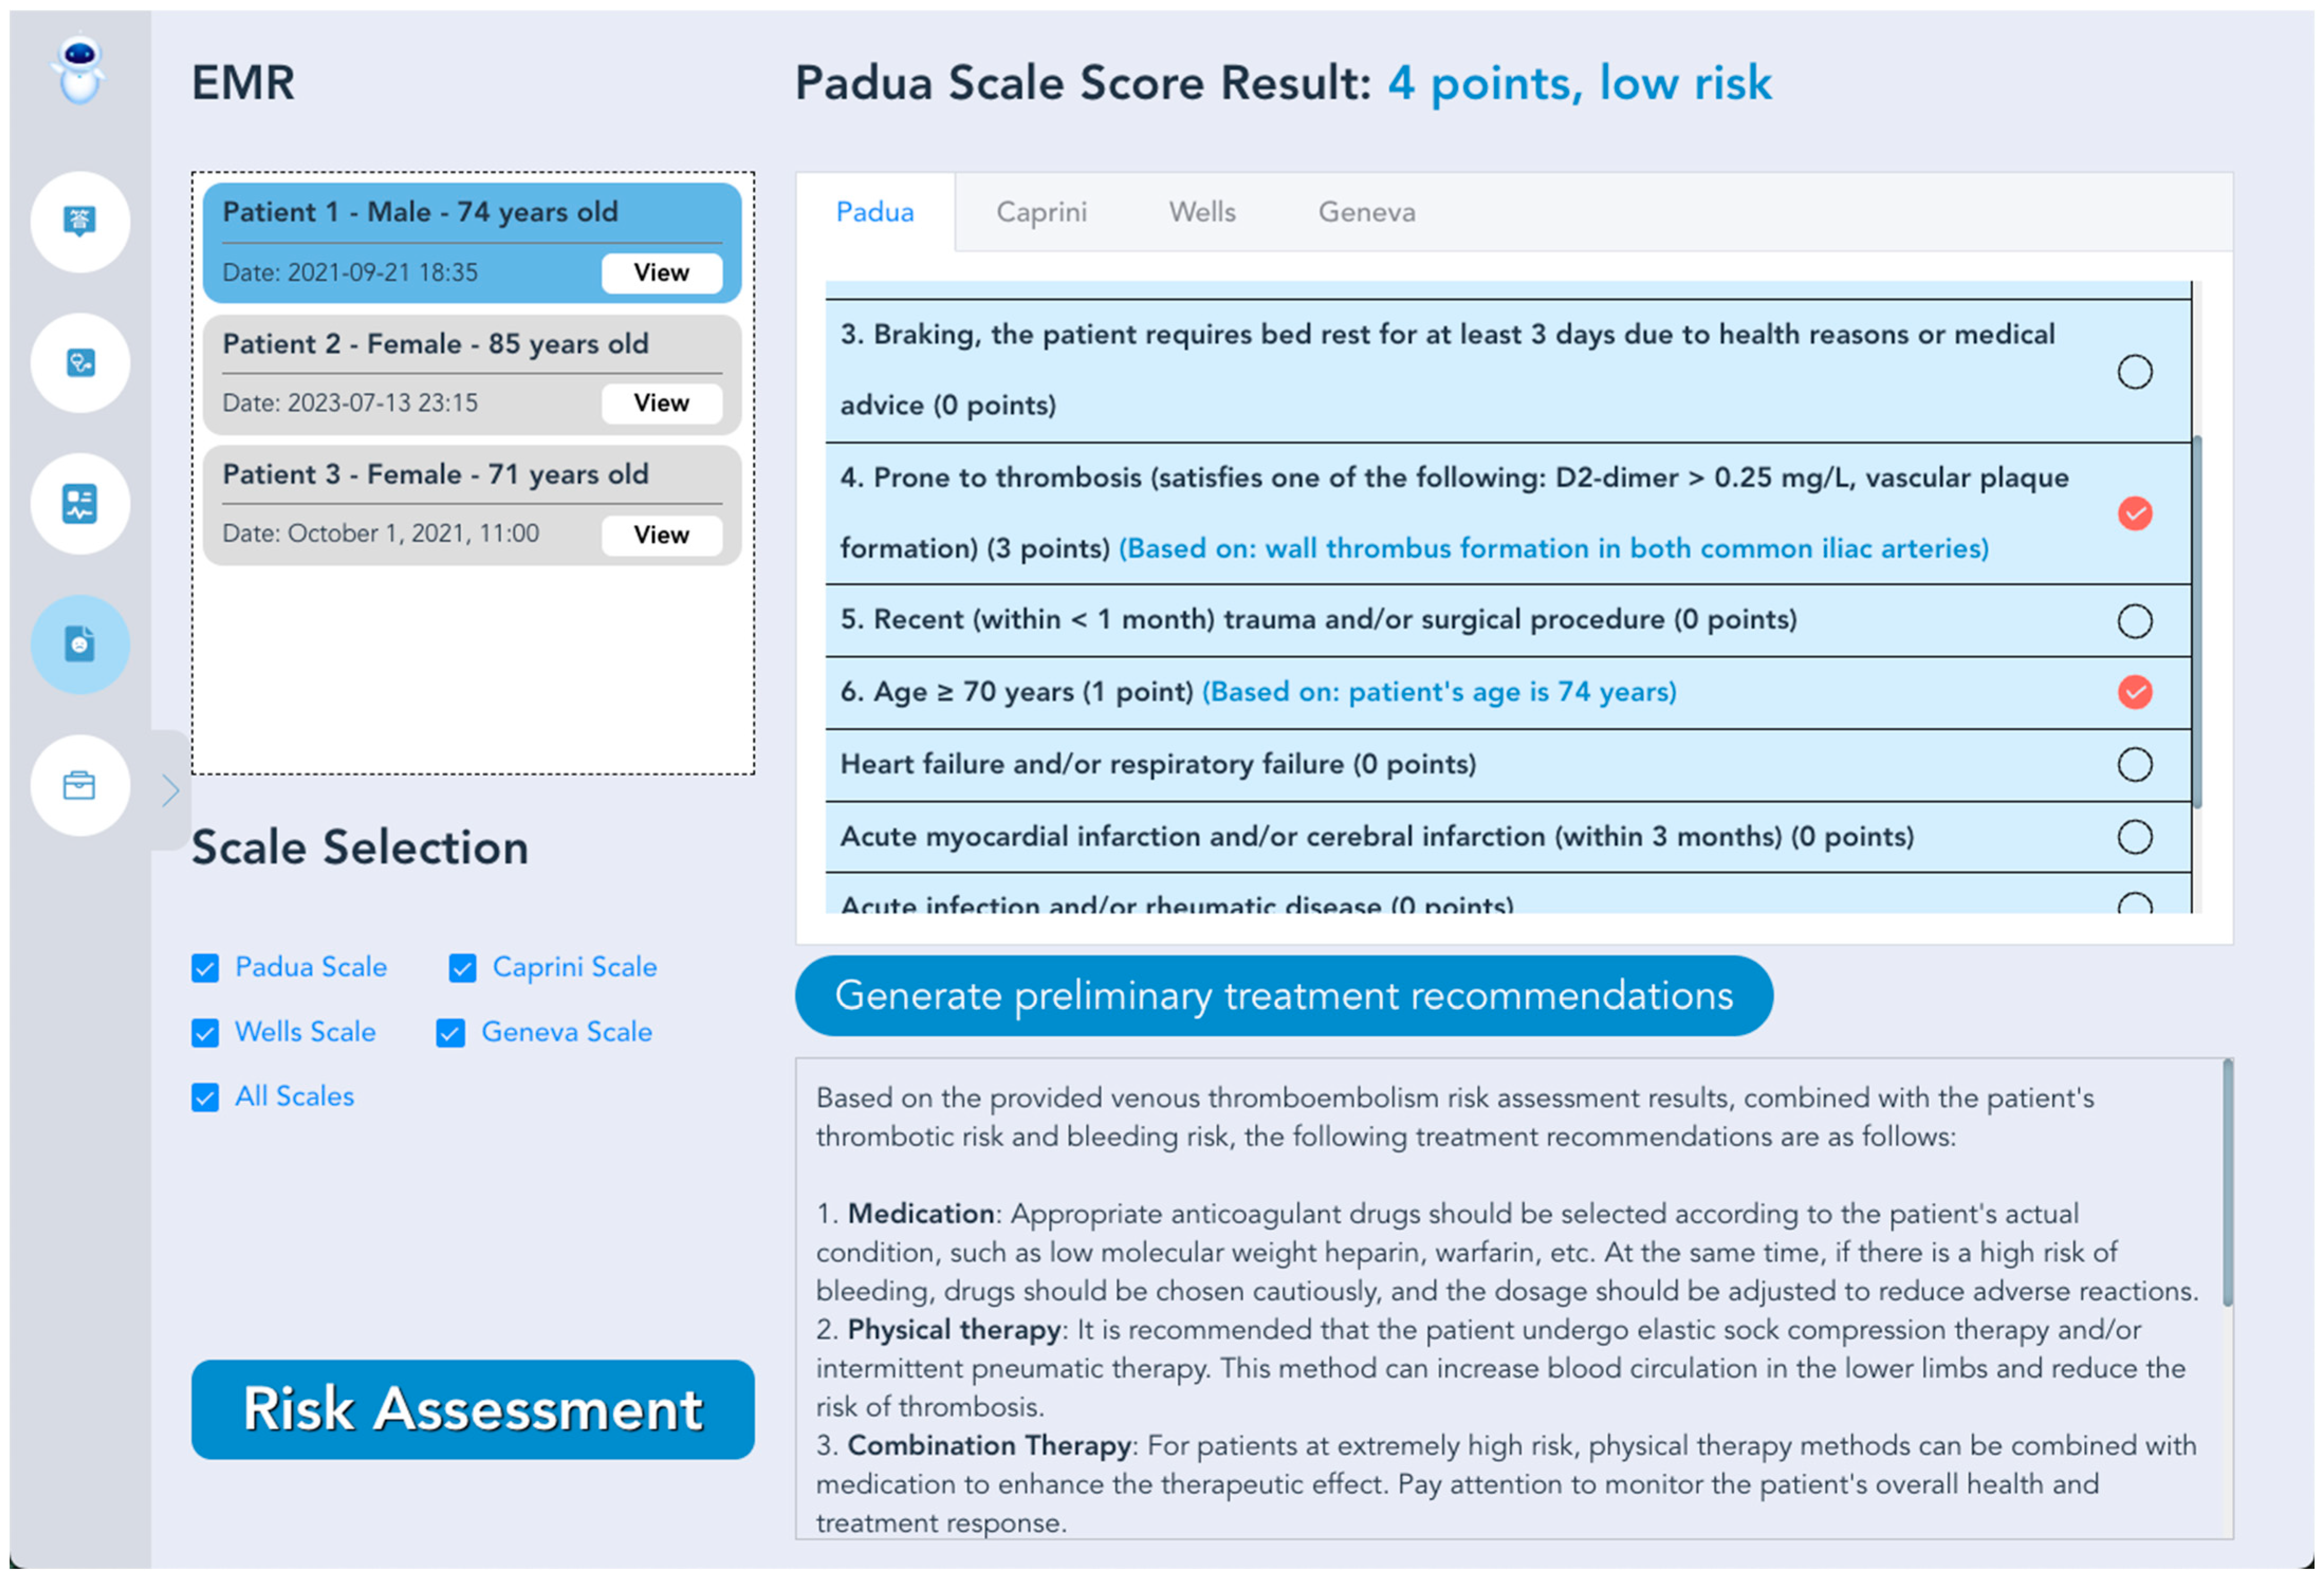
3.5. VTE Intelligent Prevention and Treatment LLMs System Prototype

In this study, we propose a VTE risk assessment method based on RAG, and a prototype of a VTE risk assessment system is constructed based on the proposed method, as shown in Figure 6, where the interface portion of the diagram is shown to focus on the scoring results of the Padua scale in the EMR system and its clinical applications.
First of all, the left column shows the basic information of the patient from the HIS (Hospital Information System) interface, including name, gender, and age. The design of this section is simple and clear, which makes it easy for healthcare professionals to quickly browse and check the basic information of the patient. At the same time, the patient’s corresponding “View” button provides easy access to the patient’s detailed medical records, thus ensuring the completeness and accuracy of the information.
At the bottom of the left side of the interface, there is a “Risk Assessment” function button, which, when clicked, generates and saves a complete assessment form for subsequent tracing and review. This function greatly improves the efficiency and convenience of clinical work and ensures the complete recording and storage of patients’ medical records and assessment results.
The right central area focuses on the results of the Padua scale scores. In this case, the total score on the Padua scale is 4, which is considered low-risk. Each item of the scale is listed individually, and the results of each item are clearly labeled. This design not only allows the user to fully understand the specific details of the assessment, but also enhances the transparency and credibility of the scoring process.
The bottom area on the right side mainly provides the scale selection function as well as initial treatment recommendations. Users can select different assessment scales according to their actual needs, such as Wells scale, Caprini scale, and Genava scale, and the system will adjust the assessment items according to the selected scales. This flexible scale selection mechanism enables the system to have a wider range of applications to meet different clinical needs. At the same time, based on the scoring results of the Padua scale, the system generates preliminary treatment recommendations, thus providing strong data support for healthcare professionals in formulating treatment plans. The recommendations are based on a large amount of clinical data and expert knowledge and have a certain degree of scientific validity and authority.

4. Discussion

As described in the previous section, there are some limitations in the methodological design of this study. Although a large number of current electronic medical records are still presented in the form of unstructured text, with the continuous development of medical informatization, electronic medical records are gradually evolving towards being multimodal, structured, and digital. The approach proposed in this study is mainly oriented to existing unstructured text processing scenarios and has not yet fully considered the adaptability issues brought by the evolution of electronic medical record systems. In this study, a question-and-answer format is used to guide an LLM through the task of risk identification and assessment. Although the task constraints are enhanced by presetting the format, there is still a certain degree of randomness in the content generation process of LLMs, and the results are still insufficient in terms of consistency, controllability, and verifiability compared to traditional procedural methods. This uncertainty is mainly manifested in the lack of input fault tolerance, the phenomenon of model hallucination, the inconsistency of the output content and the poor stability of the output, and other problems. In addition, the “black-box” inference mechanism of the large language model lacks sufficient interpretability under the current technological conditions, which poses a challenge to enhance the credibility of the model in healthcare scenarios.
There are also limitations in experimental validation. Clinical risk assessment usually unfolds at different time nodes, such as preoperative and postoperative. This paper did not refine the patient’s condition changes in the time dimension, and only used the final diagnosis and labeling, which has the loophole of past medical history affecting the assessment results. In addition, in clinical scenarios, it is necessary to specify the patient’s department and use a scale that meets the needs of the study, which does not distinguish between departments, but uses the patient’s electronic medical record using four scales for risk assessment, and does not accurately reflect the effectiveness of the method in a particular scenario.
This study is currently conducted only in the context of Chinese EHRs, and the implementation of risk assessment is completed. Cross-language adaptation still faces certain difficulties, especially when constructing knowledge bases in English or other languages; due to the differences in language structure, parameters such as text slicing granularity, semantic coverage and overlap length need to be adjusted accordingly to ensure the accuracy of retrieval and inference. Although the technology path of this research integrates the international widely used open-source tools and algorithm frameworks, it still needs to be adapted and optimized in different languages and application environments. This is the work we are going to do next.
In practical application scenarios, this study has some limitations. Compared with traditional machine learning or deep learning methods, the method of this study has a significant increase in runtime resource overhead. Although a lightweight LLM is used, it is difficult to support highly concurrent task processing because the single model is limited by arithmetic resources. Meanwhile, in order to safeguard the privacy of medical data, this system has to be deployed in a local private environment, which implies additional equipment investment and technical support pressure for most healthcare organizations. However, with the iteration of technology and the update of hardware resources, the model of locally deploying a large number of parameters has gradually become feasible.
In addition, during the clinical application of the system, clinical staff required a certain amount of learning and adaptation to achieve effective collaboration with the intelligent system. It is worth emphasizing that the proposed methodology has undergone preliminary validation in a real-world clinical setting. Specifically, a pilot test was conducted in the rehabilitation department of a tertiary-level hospital in Yunnan Province, China, involving 27 clinicians. We first examined the existing diagnosis and treatment workflows for VTE prevention and management, which revealed significant inefficiencies, including a heavy reliance on manual data processing and poor integration of risk assessment information across departments for clinical and administrative reporting. To address these issues, our risk assessment and data management system was deployed and evaluated over a two-week period. Table 11 presents selected publicly shareable statistical results from this trial. In the table, “Before” refers to the two weeks prior to the trial, during which traditional manual and fragmented systems were used. “After” reflects the two-week period following the system rollout. The symbol “–” indicates that the corresponding data were not collected or not applicable before deployment. The results demonstrate improvements in assessment efficiency, clinician satisfaction, and system adoption, suggesting that the proposed system is highly implementable and holds substantial practical value for clinical application.

5. Conclusions

In this study, a multi-modal adaptive assessment framework integrating RAG and SVA is proposed to address the problems of semantic fragmentation, insufficient interpretability, and model illusion in VTE risk assessment. By constructing entity–context dynamic indexing, multimodal retrieval optimization and domain-adaptive fine-tuning techniques, end-to-end interpretable reasoning from EHR text to risk assessment is achieved. The experimental results show that the Qwen2.5-7B model achieves an accuracy of 79.56%, 88.32%, 90.51%, and 84.67% on the Caprini, Padua, Wells, and Geneva scales, respectively, which is significantly better than the traditional supervised methods and other open-source big models. The ablation experiments verified the synergistic effects of the modules, with the entity–context dynamic association and the SVA mechanism contributing the most to improving the accuracy of risk assessment and suppressing hallucinations. This study provides a high-precision and traceable intelligent tool for VTE clinical decision-making, as well as a methodological reference for the grounded application of the big model in vertical medical scenarios. A prototype of the VTE intelligent prevention and treatment big model system developed based on the methodology proposed in this study is demonstrated, which verifies the feasibility of the proposed methodology in terms of technological integration. Future work will further explore the multimodal data fusion and incremental learning mechanism to cope with the dynamic risk assessment needs of complex cases.

Author Contributions

Conceptualization, J.H.; methodology, D.H.; validation, D.H. and H.P.; investigation, H.P.; resources, H.P.; data curation, H.P.; writing—original draft preparation, D.H.; writing—review and editing, D.H. and J.H.; supervision, J.H.; project administration, J.H. All authors have read and agreed to the published version of the manuscript.

Funding

This study received funding from the National Natural Science Foundation of China, No. 82160347; Yunnan Key Laboratory of Smart City in Cyberspace Security, No. 202102AE090031.

Institutional Review Board Statement

The study was conducted in accordance with the Declaration of Helsinki and approved by the Institutional Review Board (or Ethics Committee) of The First People Hospital of Anning City (protocol code No. 2017YYLH035 and date of approval 4 September 2017).

Informed Consent Statement

Written informed consent was obtained from the individual(s) for the publication of any potentially identifiable images or data included in this article.

Data Availability Statement

The data analyzed in this study are subject to the following licenses/restrictions: the datasets generated and analyzed during the current study are available from the corresponding author on reasonable request. Requests to access these datasets should be directed to Jianfeng He, jfenghe@kmust.edu.cn.

Acknowledgments

We sincerely appreciate the anonymous reviewers for their precious comments and valuable suggestions. Moreover, we genuinely thank my teacher for his constructive guidance. We sincerely thank Hongjiang Zhang who provided much medical knowledge in the writing process of the paper and gave guidance in the data annotation process.

Conflicts of Interest

The authors declare that the research was conducted in the absence of any commercial or financial relationships that could be construed as a potential conflict of interest.

Appendix A

This study is based on the Venous Thromboembolism Risk Assessment Scale, as shown in Table A1, Table A2 and Table A3. The contents of these scales are often mentioned in the text and cited in Section 3.1.2. They are only used as the basis for method design and experimental conduct. They are placed in the appendix to avoid affecting the continuity of the main text.
Table A1. Simplified Wells Rating Scale and Revised Geneva Rating Scale.
Simplified Wells Scoring ProgramMarkRevised Geneva Scoring ProgramMark
History of PTE or DVT1History of PTE or DVT1
Fracture or surgery within 4 weeks1Surgery or fracture within one month1
Active tumor1Active tumor1
Heart rate (beats/min) ≥ 1001Heart rate (beats/min) 75–941
Hemoptysis1Heart rate (beats/min) ≥ 952
DVT signs or symptoms1Hemoptysis1
Other differential diagnoses less likely than PTE1Unilateral lower extremity pain1
Deep vein tenderness and unilateral lower extremity edema in the lower extremities1
Age > 651
Table A2. Padua Rating Scale.
Padua Scoring ProgramMark
Active cancer3
Previous history of VTE (excluding superficial venous thrombosis)3
Reduced activity3
Known embolism vulnerability3
Recent (1 month) trauma and/or surgery2
Age ≥ 70 years1
Heart and/or respiratory failure1
Acute myocardial infarction or ischemic stroke1
Acute infectious and/or rheumatic diseases1
Obesity (BMI ≥ 30 kg/m²)1
Currently on hormone therapy1
Table A3. Caprini Rating Scale.
1 Point2 Points3 Points5 Points
Age 41–60Age 61–74Age ≥ 75 yearsStroke (<1 month)
Minor operationArthroscopic surgeryVTE HistoryElective arthroplasty
Body mass index > 25 kg/m²Major open surgery (>45 min)Family history of VTEFractures of the hip, pelvis or lower extremities
Swelling of the lower limbsLimb laparoscopy (>45 min)Coagulation Factor V Leiden MutationAcute spinal cord injury (<1 month)
Varicose veinsMalignant tumorThrombospondin G20210A mutation
Pregnancy or postpartumBedridden > 72 hLupus anticoagulant positive
History of unexplained or habitual miscarriagesPlaster cast (for a broken bone)Positive anticardiolipin antibodies
Oral contraceptives or hormone replacement therapyCentral venous routeElevated serum homocysteine
Infectious toxicosis (<1 month) Heparin-induced thrombocytopenia
Severe lung disease (<1 month) Other congenital or acquired thrombotic tendencies
Lung function abnormality
Acute myocardial infarction
Congestive heart failure (<1 month)
History of inflammatory bowel disease
Need bed rest.

References

  1. Wendelboe, A.; Weitz, J.I. Global health burden of venous thromboembolism. Arterioscler. Thromb. Vasc. Biol. 2024, 44, 1007–1011. [Google Scholar] [CrossRef] [PubMed]
  2. Khan, F.; Tritschler, T.; Kahn, S.R.; Rodger, M.A. Venous thromboembolism. Lancet 2021, 398, 64–77. [Google Scholar] [CrossRef]
  3. Lutsey, P.L.; Zakai, N.A. Epidemiology and prevention of venous thromboembolism. Nat. Rev. Cardiol. 2023, 20, 248–262. [Google Scholar] [CrossRef]
  4. Pandor, A.; Tonkins, M.; Goodacre, S.; Sworn, K.; Clowes, M.; Griffin, X.L.; Holland, M.; Hunt, B.J.; de Wit, K.; Horner, D. Risk assessment models for venous thromboembolism in hospitalised adult patients: A systematic review. BMJ Open 2021, 11, e045672. [Google Scholar] [CrossRef]
  5. Zhou, C.; Yi, Q.; Ge, H.; Wei, H.; Liu, H.; Zhang, J.; Luo, Y.; Pan, P.; Zhang, J.; Peng, L. Validation of risk assessment models predicting venous thromboembolism in inpatients with acute exacerbation of chronic obstructive pulmonary disease: A multicenter cohort study in China. Thromb. Haemost. 2022, 122, 1177–1185. [Google Scholar] [CrossRef] [PubMed]
  6. Hayssen, H.; Sahoo, S.; Nguyen, P.; Mayorga-Carlin, M.; Siddiqui, T.; Englum, B.; Slejko, J.F.; Mullins, C.D.; Yesha, Y.; Sorkin, J.D. Ability of Caprini and Padua risk-assessment models to predict venous thromboembolism in a nationwide Veterans Affairs study. J. Vasc. Surg. Venous Lymphat. Disord. 2024, 12, 101693. [Google Scholar] [CrossRef]
  7. Liu, J.; Dai, L.; Li, Z. Establishment of a prediction model for venous thromboembolism in patients with acute exacerbation of chronic obstructive pulmonary disease based on serum homocysteine levels and Wells scores: A retrospective cohort study. BMC Cardiovasc. Disord. 2024, 24, 586. [Google Scholar] [CrossRef] [PubMed]
  8. Häfliger, E.; Kopp, B.; Farhoumand, P.D.; Choffat, D.; Rossel, J.-B.; Reny, J.-L.; Aujesky, D.; Méan, M.; Baumgartner, C. Risk assessment models for venous thromboembolism in medical inpatients. JAMA Netw. Open 2024, 7, e249980. [Google Scholar] [CrossRef]
  9. Qiao, L.; Yao, Y.; Wu, D.; Xu, R.; Cai, H.; Shen, Y.; Xu, Z.; Jiang, Q. The validation and modification of the Caprini risk assessment model for evaluating venous thromboembolism after joint arthroplasty. Thromb. Haemost. 2024, 124, 223–235. [Google Scholar] [CrossRef]
  10. Nguyen, T.T.T.; Tong, H.T.; Nguyen, H.T.L.; Nguyen, T.D. A Call to Action for Anticoagulation Stewardship to Address Suboptimal Thromboprophylaxis Practices for at-Risk Non-Orthopedic Surgical Patients in Vietnam: An Explanatory Sequential Mixed-Methods Study. Vasc. Health Risk Manag. 2025, 21, 305–326. [Google Scholar] [CrossRef]
  11. Cook, N.; Biel, F.M.; Cartwright, N.; Hoopes, M.; Al Bataineh, A.; Rivera, P. Assessing the use of unstructured electronic health record data to identify exposure to firearm violence. JAMIA Open 2024, 7, ooae120. [Google Scholar] [CrossRef]
  12. Mubashar, A.; Asghar, K.; Javed, A.R.; Rizwan, M.; Srivastava, G.; Gadekallu, T.R.; Wang, D.; Shabbir, M. Storage and proximity management for centralized personal health records using an ipfs-based optimization algorithm. J. Circuits Syst. Comput. 2022, 31, 2250010. [Google Scholar] [CrossRef]
  13. Contreras-Luján, E.E.; García-Guerrero, E.E.; López-Bonilla, O.R.; Tlelo-Cuautle, E.; López-Mancilla, D.; Inzunza-González, E. Evaluation of machine learning algorithms for early diagnosis of deep venous thrombosis. Math. Comput. Appl. 2022, 27, 24. [Google Scholar] [CrossRef]
  14. Wang, X.; Yang, Y.-Q.; Hong, X.-Y.; Liu, S.-H.; Li, J.-C.; Chen, T.; Shi, J.-H. A new risk assessment model of venous thromboembolism by considering fuzzy population. BMC Med. Inform. Decis. Mak. 2024, 24, 413. [Google Scholar] [CrossRef]
  15. He, L.; Luo, L.; Hou, X.; Liao, D.; Liu, R.; Ouyang, C.; Wang, G. Predicting venous thromboembolism in hospitalized trauma patients: A combination of the Caprini score and data-driven machine learning model. BMC Emerg. Med. 2021, 21, 60. [Google Scholar] [CrossRef]
  16. Chen, J.; Yang, J.; He, J. Prediction of venous thrombosis Chinese electronic medical records based on deep learning and rule reasoning. Appl. Sci. 2022, 12, 10824. [Google Scholar] [CrossRef]
  17. Yang, J.; He, J.; Zhang, H. Automating venous thromboembolism risk assessment: A dual-branch deep learning method using electronic medical records. Front. Med. 2023, 10, 1237616. [Google Scholar] [CrossRef] [PubMed]
  18. Lewis, P.; Perez, E.; Piktus, A.; Petroni, F.; Karpukhin, V.; Goyal, N.; Küttler, H.; Lewis, M.; Yih, W.-t.; Rocktäschel, T.; et al. Retrieval-augmented generation for knowledge-intensive NLP tasks. In Proceedings of the 34th International Conference on Neural Information Processing Systems, Vancouver, BC, Canada, 6–12 December 2020; p. 793. [Google Scholar]
  19. Mansurova, A.; Mansurova, A.; Nugumanova, A. QA-RAG: Exploring LLM Reliance on External Knowledge. Big Data Cogn. Comput. 2024, 8, 115. [Google Scholar] [CrossRef]
  20. Hang, C.N.; Tan, C.W.; Yu, P.-D. MCQGen: A large language model-driven MCQ generator for personalized learning. IEEE Access 2024, 12, 102261–102273. [Google Scholar] [CrossRef]
  21. Hossain, E.; Rana, R.; Higgins, N.; Soar, J.; Barua, P.D.; Pisani, A.R.; Turner, K. Natural language processing in electronic health records in relation to healthcare decision-making: A systematic review. Comput. Biol. Med. 2023, 155, 106649. [Google Scholar] [CrossRef]
  22. Lam, B.D.; Zerbey, S.; Pinson, A.; Robertson, W.; Rosovsky, R.P.; Lake, L.; Dodge, L.E.; Adamski, A.; Reyes, N.; Abe, K. Artificial intelligence for venous thromboembolism prophylaxis: Clinician perspectives. Res. Pract. Thromb. Haemost. 2023, 7, 102272. [Google Scholar] [CrossRef] [PubMed]
  23. Chen, J.; Bao, R.; Zheng, H.; Qi, Z.; Wei, J.; Hu, J. Optimizing Retrieval-Augmented Generation with Elasticsearch for Enhanced Question-Answering Systems. arXiv 2024, arXiv:2410.14167. [Google Scholar]
  24. Topsakal, O.; Akinci, T.C. Creating large language model applications utilizing langchain: A primer on developing llm apps fast. Int. Conf. Appl. Eng. Nat. Sci. 2023, 1, 1050–1056. [Google Scholar] [CrossRef]
  25. Sun, Y.; Zeng, J.; Shan, S.; Chen, X. Cross-encoder for unsupervised gaze representation learning. In Proceedings of the IEEE/CVF International Conference on Computer Vision, Montreal, QC, Canada, 10–17 October 2021; pp. 3702–3711. [Google Scholar]
  26. Ma, X.; Zhang, X.; Pradeep, R.; Lin, J. Zero-shot listwise document reranking with a large language model. arXiv 2023, arXiv:2305.02156. [Google Scholar]
  27. Hu, E.J.; Shen, Y.; Wallis, P.; Allen-Zhu, Z.; Li, Y.; Wang, S.; Wang, L.; Chen, W. Lora: Low-rank adaptation of large language models. Int. Conf. Learn. Represent. 2022, 1, 3. [Google Scholar]
  28. Hao, P.; Zhang, L. Chinese Electronic Medical Records Named Entity Recognition Based on RoBERTa-wwm and MultiHead Attention. In Proceedings of the 2024 IEEE 3rd International Conference on Electrical Engineering, Big Data and Algorithms (EEBDA), Changchun, China, 27–29 February 2024; pp. 1022–1026. [Google Scholar]
  29. Wang, Q.; Dai, S.; Xu, B.; Lyu, Y.; Zhu, Y.; Wu, H.; Wang, H. Building chinese biomedical language models via multi-level text discrimination. arXiv 2021, arXiv:2110.07244. [Google Scholar]
  30. Vithana, S.; Cardone, M.; Calman, F.P. Private approximate nearest neighbor search for vector database querying. In Proceedings of the 2024 IEEE International Symposium on Information Theory (ISIT), San Francisco, CA, USA, 22–26 May 2024; pp. 3666–3671. [Google Scholar]
  31. Rognoni, C.; Lugli, M.; Maleti, O.; Tarricone, R. Clinical guidelines versus current clinical practice for the management of deep vein thrombosis. J. Vasc. Surg. Venous Lymphat. Disord. 2021, 9, 1334–1344.e1331. [Google Scholar] [CrossRef]
  32. Li, J.; Yuan, Y.; Zhang, Z. Enhancing llm factual accuracy with rag to counter hallucinations: A case study on domain-specific queries in private knowledge-bases. arXiv 2024, arXiv:2403.10446. [Google Scholar]
  33. Weng, Y.; Zhu, M.; Xia, F.; Li, B.; He, S.; Liu, S.; Sun, B.; Liu, K.; Zhao, J. Large language models are better reasoners with self-verification. arXiv 2022, arXiv:2212.09561. [Google Scholar]
  34. Kumar, S.; Alam, M.S.; Khursheed, Z.; Bashar, S.; Kalam, N. Enhancing Relational Database Interaction through Open AI and Stanford Core NLP-Based on Natural Language Interface. In Proceedings of the 2024 5th International Conference on Recent Trends in Computer Science and Technology (ICRTCST), Jamshedpur, India, 9–10 April 2024; pp. 589–602. [Google Scholar]
  35. Xu, L.; Li, A.; Zhu, L.; Xue, H.; Zhu, C.; Zhao, K.; He, H.; Zhang, X.; Kang, Q.; Lan, Z. Superclue: A comprehensive chinese large language model benchmark. arXiv 2023, arXiv:2307.15020. [Google Scholar]
Figure 1. Overall flow chart of the method.
Electronics 14 02164 g001
Figure 2. Multiple search optimization knowledge base architecture.
Electronics 14 02164 g002
Figure 3. Domain-adaptive fine-tuning process.
Electronics 14 02164 g003
Figure 4. Flow chart of self-validation enhancement mechanism.
Electronics 14 02164 g004
Figure 5. SuperCLUE’s 10 basic capabilities.
Electronics 14 02164 g005
Figure 6. System interface-VTE risk assessment.
Electronics 14 02164 g006
Table 1. Risk assessment prompt design.
StepDesign Description
CharacterSuppose you are an experienced clinician in the field of VTE.
TaskDetermine whether a patient has a particular risk factor for VTE in response to the patient’s relevant medical presentation.
OrderReturned in standard JSON format for direct code parsing;
“Format”: “{ “answer”: “(yes/no, one word)”, “basis”: “(give basis if answer is yes, leave no blank)”}”
Input“Reference case”: “{Top-5 text block}”,
“Risk Factors”: “{Current assessment items, e.g., history of PTE or DVT?}”,
Ouput{answer: “Yes”, hint: “DVT diagnosed during routine exam 2 years ago”.}
Table 2. Self-validating Prompt2 design.
StepDesign Description
CharacterSuppose you are an experienced clinician in the field of VTE.
TaskIn response to the relevant case presentation, determine whether the patient’s risk assessment conclusions are consistent with the presentation.
OrderReturned in standard JSON format for direct code parsing;
“Format”: “{“answer”: “(yes/no, one word)”}”
Input“Risk Factor”:”{History of PTE or DVT?}”,
“Related Cases”: “{Top-5 Text Block}”,
“Assessment Conclusion”: “{answer: ‘Yes’, hint: ‘DVT was diagnosed during a routine examination 2 years ago’.}”
Ouput{answer: “Yes”}
Table 3. Example quiz pairs and data cleaning results.
IndexQ&A SessionResults
1Q: Are cardiac biomarkers elevated?
A: Significantly associated with poor short-term prognosis in PTE.
Rule 1 out
2Q: What are the diagnostic criteria for low-risk PTE?
A: Patients with intermediate-risk PTE.
Rule 2 out
3Q: What is the definition of intermediate to high risk PTE?
A: Presence of right ventricular dysfunction.
Rule 3 out
4Q: What are the imaging criteria for CTPA to diagnose RVD?
A: A four-chambered cardiac plane showing a ventricular end-diastolic internal diameter >1.0 or 0.9.
Carry
5Q: What is the main purpose of the clinical application of the PESI/sPESI score?
A: To assess the prognosis of patients with PTE and to guide whether early discharge is possible.
Carry
Table 4. Experimental environment configuration.
EnvironmentsConfiguration Parameters
hardware environmentGPU: NVIDIA RTX 4090 (24 GB VRAM)
CPU: AMD EPYC 7742 (64 cores)
Memory: 512 GB DDR4
Storage: 8 TB NVMe SSDs
software environmentOperating System: Ubuntu Server 22.04 LTS
CUDA: 11.8
Python: 3.10.12
Core Framework: Ollama 0.5.4/PyTorch 2.1.0/Transformers 4.32.0
Table 5. Ollama Deployment LLMs.
LLMsOrganizationPerformance Advantages
DeepSeek-R1-7BDeepSeekChinese General + Code Generation
Qwen2.5-7BAlibabaMedical Dialogue + Physical Understanding
Llama2-7BMetaGeneric English + Open Source Community Optimization
Llama 3.1-8BMetaLong Text Comprehension + Enhanced Logical Reasoning
Table 6. SuperCLUE Chinese open-source model ranking.
RankLLMsOrganizationTotalsScienceLiteratureHardParameter
1DeepSeek-V3DeepSeek68.37278.254.8671 B
2Qwen2.5-72B-InstructAlibaba65.466.280.349.772 B
3Qwen2.5-32B-InstructAlibaba63.766.979.144.932 B
4DeepSeek-V2.5DeepSeek6367.676.145.3236 B
5TeleChat2-35BTeleAI57.155.678.237.635 B
6Qwen2.5-7B-InstructAlibaba55.554.476.435.77 B
7QwQ-32B-PreviewAlibaba54.359.876.526.632 B
8GLM-4-9B-ChatZHIPU AI52.450.675.131.69 B
9Yi-1.5-34B-ChatLingYiWanWu48.248.275.920.634 B
10360Zhinao2-7B36047.850.775.217.57 B
Table 7. Results of the multi-scale risk assessment.
ScalesPRF1 Clinical Specialist Accuracy Rate (%)
Caprini79.5676.8278.1682.52
Padua88.3285.718786.41
Wells90.5188.4689.4789.32
Geneva84.6782.1483.3885.44
Table 8. Comparative results of monitoring methods.
MethodsScalesPRF1
He et al. [15]Caprini79.9--
Chen et al. [16]Wells84.7--
Chen et al. [16]Geneva86.1--
Yang et al. [17]Padua--88.3
OurCaprini79.5676.8278.16
Wells90.5188.4689.47
Geneva84.6782.1483.38
Padua88.3285.7187
Table 9. Comparative experimental results of four LLMs deployed based on the Ollama framework.
MouldScalesPRF1Time (s)H (%)
DeepSeek-R1-7BCaprini73.7970.5972.159.118.4
Padua82.6179.4180.982.115.7
Wells85.4483.0284.212.117.2
Geneva79.6176.4778.016.119.3
Qwen2.5-7B (Our)Caprini79.5676.8278.169.33.1
Padua88.3285.71872.32.8
Wells90.5188.4689.472.32.5
Geneva84.6782.1483.384.33.4
Llama2-7BCaprini65.0562.7563.888.912.2
Padua74.7671.4373.061.910.8
Wells78.6476.1977.391.911.5
Geneva69.967.6568.75613.6
Llama 3.1-8BCaprini68.9366.6767.789.414.5
Padua77.3974.1275.712.413.2
Wells81.5579.2580.382.414
Geneva73.7971.5772.666.415.8
Table 10. Results of ablation experiments.
Ablation ModuleScalesPRF1Time (s)H (%)
Full modelCaprini79.5676.8278.169.33.1
Padua88.3285.71872.32.8
Wells90.5188.4689.472.32.5
Geneva84.6782.1483.384.33.4
Remove Entity–Context Dynamic AssociationCaprini72.8269.6171.1898.7
Padua81.5578.4379.9627.4
Wells84.4782.0883.2628.1
Geneva77.6774.5176.054.19.2
Remove RAG Caprini75.7372.5574.118.912.4
Padua84.4781.3782.891.911.2
Wells87.388586.17210.9
Geneva80.5877.4578.993.913.1
Remove reorderingCaprini77.6774.5176.059.26.8
Padua85.4482.3583.872.26.1
Wells88.3586.0487.182.25.7
Geneva82.5279.4180.934.27.3
Remove fine-tuningCaprini74.7671.5773.139.315.6
Padua83.480.3981.872.314.3
Wells86.4184.0985.242.314
Geneva80.5877.4578.994.316.1
Remove SVACaprini76.773.5375.079.114.8
Padua86.4183.3384.842.113.5
Wells88.3586.0487.182.112.9
Geneva82.5279.4180.934.115.4
Table 11. Evaluation results before and after system deployment in the rehabilitation “department”.
Evaluation MetricUnitBefore (Mean ± SD)After (Mean ± SD)
Average time per single risk assessmentminutes12.4 ± 2.12.1 ± 0.6
Average number of assessments per clinician per weektimes18.621.4
Average job satisfaction score (5-point Likert scale)score1.84.3
Average time to submit and review assessment resultshours14.8 ± 4.56.2 ± 2.1
Training time per clinicianhours0.5 ± 0.1
Total number of system crashes/errorstimes11
System uptime per clinician (cumulative over 2 weeks)hours2.1
Continuous usage rate (more than five days)%68%
Disclaimer/Publisher’s Note: The statements, opinions and data contained in all publications are solely those of the individual author(s) and contributor(s) and not of MDPI and/or the editor(s). MDPI and/or the editor(s) disclaim responsibility for any injury to people or property resulting from any ideas, methods, instructions or products referred to in the content.

