1. Introduction
In the current industrial environment, it is essential to effectively identify and manage business processes to ensure production efficiency and minimize all costs associated with the manufacturing process. A key factor is the workplace itself, which holds potential for ensuring production efficiency. Processes that maintain the operational reliability of the workplace—especially within maintenance departments, utilize various methods, tools, and analyses to optimize workplace performance and ensure maximum availability and efficiency for production.
Business process optimization is inherently linked to increasing the performance, quality, and flexibility of an organization. Commonly used approaches in the field of process optimization include Lean management, which focuses on eliminating waste and increasing customer value [
1]; Six Sigma, aimed at reducing variability and defects in production [
2]; and process mining, which enables detailed mapping, analysis, and optimization of actual processes based on data from systems such as Enterprise Resource Planning (ERP) and Manufacturing Execution System (MES) [
3].
These traditional approaches rely heavily on expert-driven evaluations and predefined improvement procedures. While effective for structured and stable environments, they often lack the flexibility to adapt to rapid changes in production or to analyze large volumes of heterogeneous process data in real time.
In contrast, AI-based optimization leverages real-time data streams and machine learning algorithms to detect hidden patterns, predict failures, and dynamically adjust decision-making. Unlike static process improvements in Lean and Six Sigma, AI continuously learns from incoming data, making it highly adaptable and capable of supporting predictive and autonomous maintenance strategies.
In recent years, the use of artificial intelligence (AI) and data-driven approaches has come to the forefront, enabling dynamic process management based on real-time data and predictive models. These tools include machine learning algorithms, predictive analytics, digital twins, and other technologies associated with the Industry 4.0 concept [
4]. Thanks to these innovations, it is possible to automate decision-making processes and identify optimization opportunities in real time.
Given the complexity of modern manufacturing systems, it is essential to employ proven methods that enable systematic analysis of risks and potential weaknesses. One of the most effective methods in this regard is failure modes and effects analysis (FMEA), which has historically been used to identify potential failures in systems, determine their causes, and assess their impact on operations.
According to Filz et al. (2021), FMEA is invaluable for the systematic identification of potential failures in industrial systems, enabling predictive risk management and increasing the reliability of production processes [
5]. Similarly, Liu et al. (2013) emphasize that FMEA is a key method for risk analysis in complex manufacturing environments, helping to reveal weak points and optimize maintenance strategies [
6]. These characteristics make it ideal for supporting production efficiency and minimizing downtime, as also confirmed by the study of Chemweno et al. (2020), which states that the application of FMEA in combination with data analysis improves equipment availability and reduces maintenance costs in industrial lines [
7].
Practical applications of FMEA across various industries have demonstrated significant benefits. In the automotive sector, a 2019 report by the Automotive Industry Action Group indicated that implementing FMEA led to a reduction of over 70% in product defects across manufacturers [
8]. For example, Toyota applied Design Failure Mode and Effects Analysis (DFMEA) to address issues with airbag deployment reliability. The analysis revealed potential material flaws and failure scenarios, enabling engineering modifications that significantly reduced the risk of airbag malfunction. As a result, warranty claims decreased and costly vehicle recalls were avoided.
In the aerospace industry, NASA employed rigorous FMEA procedures during the Apollo program for all critical spacecraft systems. In the Apollo 11 mission, FMEA helped identify the risk of computer overload in the lunar module; when this scenario occurred during descent, both the crew and mission control were prepared thanks to prior analysis, and the mission successfully landed on the Moon. This preventive approach contributed to 100% mission-critical success and established FMEA as a gold standard in aerospace risk management [
9].
With the advent of artificial intelligence (AI), new opportunities are emerging that lead to a more efficient approach to FMEA analysis, which is reflected in the optimization of workplace maintenance processes. Although traditional FMEA is effective, it often is time-consuming and relies on subjective expert estimates, which can result in inconsistent outcomes [
10]. The integration of AI—such as the use of machine learning algorithms—offers an opportunity to overcome these limitations by enabling automated and objective risk assessment based on real sensor data. Therefore, this paper identifies the application of AI to the FMEA method as a promising challenge for creating dynamic and data-driven analysis that can improve risk management and the efficiency of production processes in real time. The major contributions of this study are as follows.
A practical application of AI-supported FMEA in the glass manufacturing industry, utilizing real multi-year failure data and sensor-based parameters;
The implementation and evaluation of Random Forest and XGBoost models for both risk classification and numerical RPN prediction, with performance metrics demonstrating their applicability in an industrial setting;
The proposal of a dynamic FMEA system enabling automated risk prioritization, predictive maintenance planning, and integration with existing production systems.
1.1. Overview of Artificial Intelligence Applications in Failure Mode and Effects Analysis
Failure mode and effects analysis (FMEA) is an important tool for identifying and managing risks across various engineering and management domains. The implementation of artificial intelligence (AI) into FMEA represents a significant shift that accelerates the process while increasing the accuracy and efficiency of risk assessment. Several empirical studies have been published on this topic, a brief overview of which is provided below.
1.1.1. Automated Documentation Generation
The use of generative language models for creating FMEA documentation represents a revolutionary shift in the field of risk and failure analysis, as it allows for the fast and accurate capture of information about asset composition, their functions, and potential failures. These models, based on advanced artificial intelligence technologies, can process massive amounts of data and generate text that is consistent, structured, and tailored to the needs of a specific analysis. According to a study [
11], a system using large language models correctly generated more than half of the key content of the FMEA documentation, as confirmed by reliability experts. These experts appreciated the model’s ability not only to reproduce existing information but also to suggest relevant descriptions of failures and their effects based on available data, thereby reducing the risk of human errors such as overlooking critical details or inconsistent formulations.
This automated approach significantly reduces the time required to produce documentation, which is particularly important in industrial sectors where the speed of product development and deployment is critical [
12].
Traditional manual creation of FMEA documents often takes hours or even days, depending on system complexity. Generative models can accelerate this by automatically generating table suggestions, failure modes, effects, and recommended actions based on input data. The cited study [
12] demonstrates this using a ChatGPT-based model, though without specifying the exact version or training details. These findings are referenced as examples from existing research, not as our own implementation.
For example, if the input is a description of a production line, the model can identify typical failures (e.g., component wear, software errors) and propose their inclusion in the FMEA table along with estimated severity, occurrence, and detection scores [
13].
Another advantage is the improvement of documentation quality due to access to extensive databases of existing failure analyses. Large language models are trained on billions of texts, including technical reports, scientific articles, and industrial documents, enabling them to draw from a rich knowledge base. This means that the model can not only replicate previous analyses but also suggest new perspectives on risks that a human might overlook. For instance, in analyzing electric motor failures, the model could use historical data to highlight less obvious causes, such as vibration due to improper balancing, and automatically include this information in the documentation. This approach increases the consistency and comprehensiveness of the analysis by eliminating the subjective biases that arise during manual processing.
In addition, automation paves the way for dynamic documentation, where FMEA can be continuously updated based on new data. In practice, this could mean that once a product is deployed, the system automatically integrates feedback from service reports (e.g., failure notifications) and updates the documentation without the need for manual intervention. The result is not only time and resource savings but also more up-to-date and reliable documentation that better reflects real-world usage conditions. Although generative models are not yet perfect and still require expert oversight (e.g., for technical accuracy verification), their potential in optimizing FMEA processes is undeniable and represents a step toward more efficient risk management in modern industry.
1.1.2. Identification of Failure Modes Using Machine Learning
The combination of active learning and natural language processing (NLP) offers an innovative approach to identifying failure modes from unstructured maintenance records, such as service reports, failure logs, and technician notes. This approach significantly simplifies data analysis, which is often chaotic, inconsistent, and composed of various text formats—ranging from brief descriptions (“the motor stopped working”) to detailed reports (“performance drop detected after 500 h of operation”). According to the study [
14], a method based on active learning requires annotation of only 10% of records to achieve reliable results, dramatically reducing the need for manual data labeling. Traditionally, technicians or analysts would have to go through thousands of records and manually categorize them, which is time-consuming and error-prone. Active learning optimizes this process by allowing the AI model to select the most informative records for annotation and gradually learn to identify failure patterns based on human feedback.
The principle works as follows: NLP first extracts key information from the text—identifying entities (e.g., “motor”, “sensor”), actions (“failed”, “overheated”), and contexts (“after 500 h”)—and then converts it into structured data suitable for FMEA analysis. For example, if a service record states, “vibrations cause bearing wear”, the model can recognize “vibrations” as the failure cause and “bearing wear” as the failure mode, and assign corresponding effects, such as “line shutdown”, as the failure effect. Active learning ensures that the model focuses on the most problematic or unclear records, thus increasing learning efficiency. Once trained on a small sample (10%), it can automatically classify the remaining records with high accuracy, saving significant time and resources compared to fully manual processing.
In addition to simplifying failure identification, this approach also enables the prediction of future failures based on historical data. AI can analyze patterns in the texts—for example, recurring reports of motor overheating under certain conditions—and estimate the probability of similar events occurring in the future [
15,
16]. This predictive analysis is invaluable for maintenance planning, as it allows organizations to move from reactive (repair after failure) to proactive (failure prevention) strategies. For instance, if the model detects that pump failures are more frequent after 1000 h of operation, it may recommend preventive replacement of parts after 900 h, minimizing downtime and repair costs. Such a system could be integrated directly into a dynamic FMEA that updates risk tables in real time based on new maintenance insights.
Another advantage is scalability and adaptability. The combination of NLP and active learning can be applied to various systems and industries—from the automotive sector, analyzing sensor failures in autonomous vehicles, to the energy sector, predicting turbine failures based on service reports. Although the initial model setup requires some investment in training and validation, the long-term benefits of reduced manual work, higher accuracy, and improved maintenance planning far outweigh these costs. In practice, this approach could lead to the development of fully automated systems that not only identify failure modes but also suggest optimization strategies, thereby taking FMEA to a new level of efficiency and predictive power.
1.1.3. Optimization for Mechatronic Products
Optimization of failure modes and effects analysis (FMEA) for mechatronic products represents an advanced approach to identifying and managing risks in the field of mechatronics, which combines mechanical, electronic, and software components. In this case, the function movement analysis (FMA) method was used, which breaks down the motion functions of a mechatronic system into individual parts (e.g., robot arm movement, motor rotation) to precisely determine where failures may occur. This method was complemented by alternative approaches to the improved risk priority number (IRPN). Unlike the traditional RPN, which calculates risk as the product of severity (S), occurrence (O), and detection (D), IRPN introduces weighted factors, allowing better consideration of the specific needs of mechatronic systems—for example, assigning more weight to severity in critical components like a robot motor. For example, consider a robotic arm where a potential failure involves loss of grip during part handling. In traditional RPN, if severity = 6, occurrence = 4, and detection = 5, the RPN would be:
Using the improved RPN (IRPN) method with weighted importance—e.g., 50% weight to severity, 30% to occurrence, and 20% to detection—the normalized scores are:
This shows that while the original RPN is 120, the IRPN offers a normalized and weighted view, emphasizing severity more strongly, which is crucial for critical safety-related components like robotic arms in manufacturing.
These combined approaches led to more accurate identification and evaluation of potential failures, which is key to the safety and reliability of mechatronic products.
Furthermore, a combination of artificial intelligence (AI) and the analytic hierarchy process (AHP) was applied to improve the classification of critical failures. In this case, AI can analyze large volumes of data (e.g., historical failures, simulations) and automatically identify risk patterns, while AHP helps to structurally compare and weigh the importance of individual failures based on multiple criteria (e.g., impact on safety, repair cost, occurrence frequency). For example, if a robotic system fails during arm movement, AI may identify the failure as being related to a specific sensor, and AHP determines whether this failure is more critical than others (e.g., software malfunction), thus improving risk prioritization. According to source [
17], this methodology significantly improves the accuracy of risk analysis, especially in complex technologies such as robotic systems (e.g., industrial robots on production lines) and other mechatronic applications (e.g., autonomous vehicles). As a result, this combination not only enables the detection of risks but also allows for effective categorization and the proposal of mitigation measures.
1.1.4. Integration into Industrial Processes and Predictive Maintenance
The integration of failure modes and effects analysis (FMEA) into industrial processes and predictive maintenance brings significant benefits to modern manufacturing systems. Combining FMEA with equipment condition monitoring—such as in superthermal power plants—enables more accurate predictions of critical failures, thereby reducing the risk of unexpected downtimes and increasing overall system reliability [
4]. This approach minimizes downtime, optimizes maintenance scheduling, and reduces repair-related costs.
Artificial intelligence (AI) further enhances this methodology through the integration of IoT sensors that continuously monitor equipment operating parameters such as temperature, vibration, and pressure. As a result, AI can detect anomalies—such as abnormal turbine vibrations—early and propose preventive measures before a failure occurs.
1.1.5. Optimization Using Genetic Algorithms and Neural Networks
The use of genetic algorithms and neural networks represents an advanced approach to improving product reliability. In this case, a combination of several methods was used: classical FMEA, the Taguchi method, neural networks, and genetic algorithms to optimize the resilience of dynamic random access memory (DRAM) components. The Taguchi method is a statistical tool for design optimization that minimizes variability and improves product robustness by selecting the best parameter combinations (e.g., temperature, material). Neural networks, artificial intelligence algorithms inspired by the human brain, are used to model and predict complex relationships between inputs (e.g., manufacturing conditions) and outputs (e.g., DRAM failures). Genetic algorithms, inspired by biological evolution, iteratively search for optimal solutions through selection, crossover, and mutation of parameters—in this case, helping to find ideal configurations to reduce DRAM failure rates.
This hybrid model, which combines all four methods, brought significant improvements in efficiency. According to source [
18], it reduced the experimental scope—that is, the number of tests required to verify reliability—by a factor of 85.3. This means that instead of thousands of experiments, far fewer were needed, saving both time and cost. Further research shows that genetic algorithms are particularly useful in optimizing manufacturing processes, as they can identify and eliminate potential production defects in the early stages of product development. For example, in DRAM manufacturing, genetic algorithms can suggest production line settings that minimize errors in memory cells, thereby increasing the overall reliability of electronic devices.
1.1.6. Automation for Safety-Critical Systems
Automatization of failure modes and effects analysis (FMEA) for safety-critical systems represents a further advancement in risk management. Automated FMEA tools that integrate fault injection simulations have simplified risk analysis and accelerated fault diagnostics in electronic systems. Fault injection simulations are testing techniques in which faults (e.g., power failure, software error) are deliberately introduced into the system to verify its response and resilience.
This approach allows for rapid identification of system weaknesses—for instance, if an electronic controller fails during a simulated sensor outage, the FMEA tool records it as a critical failure mode and suggests mitigation measures.
According to [
19], this automation provides benefits in the form of faster and more accurate diagnostics, which is crucial for systems where failure could endanger safety (e.g., avionics, medical devices). This approach also has potential in the automotive industry, especially for improving the safety of autonomous vehicles. For example, by simulating a fault in the Light Detection and Ranging (LIDAR) sensor of an autonomous car, an automated FMEA tool may detect that the system does not respond correctly to an obstacle and propose improvements (e.g., a redundant sensor), thereby increasing the vehicle’s overall safety.
1.1.7. Application to Robotic Technologies in Logistics
The application of the failure modes and effects analysis (FMEA) method in the field of robotic technologies in logistics brings significant advantages, especially when introducing automated guided vehicles (AGVs) and autonomous mobile robots (AMRs) into corporate logistics systems. The combination of FMEA with software tools such as APIS or MS Excel enables a systematic identification of potential failures and their impact on processes, thereby improving risk management and the overall efficiency of logistics operations [
18]. This approach helps companies anticipate issues—such as robot breakdowns, navigation errors, and mechanical failures—before deployment in real-world operations. Reducing the error rate during the implementation of these technologies leads to higher operational reliability, which is crucial for the smooth operation of warehouses and distribution centers.
For example, if FMEA reveals a risk of AGV battery failure, the company can proactively plan preventive measures such as more frequent maintenance or having spare batteries available, thus avoiding downtime. The result is not only a reduction in repair and maintenance costs but also the optimization of logistics flows, which increases the company’s competitiveness. Therefore, this method becomes an invaluable tool for modern logistics systems that increasingly depend on automation and precision. Integrating FMEA into the planning of robotic technologies is thus a step toward a smarter and more sustainable future in logistics.
1.1.8. Machine Learning for Automated Risk Assessment
Machine learning is revolutionizing automated risk assessment within FMEA analysis, significantly enhancing its application across various industrial sectors, including agricultural machinery. Multi-class classification models that predict risk priority number (RPN) values achieve an accuracy between 86.6% and 93.2%, which greatly accelerates and improves the risk analysis process [
20]. This technology enables the rapid sorting of potential failures based on their severity, occurrence, and detectability, thus eliminating time-consuming manual evaluations.
For example, in agriculture, AI can predict failures of critical components such as tractor hydraulic systems by analyzing historical data and real-time sensor inputs. Furthermore, artificial intelligence enables continuous monitoring of production equipment in real time, allowing immediate risk detection and automated maintenance prioritization. This results in a significant reduction in the need for manual interventions, saving both time and human resources.
This approach not only improves efficiency but also reduces the likelihood of unexpected downtime, which could jeopardize seasonal agricultural operations. The integration of machine learning into FMEA represents an intelligent solution that combines predictive accuracy with process automation, thereby advancing maintenance to a new level and supporting the sustainability and reliability of manufacturing systems in modern industry.
The use of artificial intelligence in FMEA analysis has proven to be an effective tool for automating, accelerating, and improving the accuracy of risk assessment across sectors. The combination of AI with methods such as NLP, machine learning, genetic algorithms, and neural networks offers innovative approaches for predicting and managing risks.
2. Materials and Methods
As part of a study focused on optimizing workplace processes using artificial intelligence, we implemented machine learning algorithms with the goal of automating risk identification and the calculation of the risk priority number (RPN) according to the FMEA methodology. Special attention was given to three high-performance models: the Random Forest Classifier, the Random Forest Regressor, and XGBoost, which enabled accurate prediction and prioritization of risks based on available data. The procedure was designed according to the following steps.
Data collection from sensors, maintenance logs, and historical records;
System and process analysis using methods such as Total Productive Maintenance (TPM), Reliability Centered Maintenance (RCM), and system diagnostics;
Identification and assessment of failure modes using FMEA with traditional RPN evaluation;
Risk prediction and classification through AI models (Random Forest, XGBoost);
Model verification and validation based on real-world data and performance metrics;
Action planning based on AI outputs, leading to a structured maintenance plan;
Final analysis using methods such as Root Cause Failure Analysis (RCFA) and Fault Tree Analysis (FTA).
2.1. System Analysis
As part of addressing the issue of workplace process optimization, system analysis was used to understand the complex relationships between the various components of the production system, particularly in the area of maintenance. Thanks to this method, it was possible to identify areas with a higher occurrence of failures and propose systematic improvements. Process modeling (e.g., through structural breakdown of processes and the production line structure) enabled a more efficient allocation of inputs for AI analysis and subsequent processing of input data for FMEA.
2.2. Operations Research
Operational analysis was implicitly present in the article through the design of maintenance optimization models and the assessment of risk priorities. Algorithms such as Random Forest and XGBoost can be considered extensions of traditional optimization approaches from operations research—used in this case to calculate and predict the risk priority number (RPN), which supports decision-making regarding the order of preventive maintenance actions.
2.3. Total Productive Maintenance (TPM)
The TPM approach played a conceptual framework role in the study for establishing a failure-free workplace. The involvement of maintenance personnel in fault assessment, data collection, and failure classification created the foundation for generating FMEA data. TPM, in combination with FMEA, enabled the development of a system of continuous improvement through feedback from operations and predictive maintenance.
2.4. Reliability-Centered Maintenance (RCM)
Although the RCM method was not explicitly applied, its principles were present in the design of predictive maintenance. Using historical data and AI models, the probability of failure and its consequences were evaluated, thereby supporting a strategy focused on maintaining the functionality of the most critical components of the production line.
2.5. Failure Mode and Effects Analysis (FMEA)
The failure mode and effects analysis (FMEA) method represents a systematic approach to identifying potential failures in processes, products, or systems, evaluating their impacts, and designing preventive measures to reduce associated risks. Its main goal is to detect problems before they occur, thereby improving the quality, reliability, and safety of products and processes. FMEA is used across various industrial sectors and contributes to reducing repair and warranty costs by preventing errors in the early stages of development or production.
In practice, several types of FMEA exist—for example, system FMEA (FMEA-S), focused on the reliability of the overall system and its subsystems; design FMEA (FMEA-D), applied during the product design phase; process FMEA (FMEA-P), focused on manufacturing processes; and reverse FMEA (FMEA-R), used to validate analyses directly in the workplace. In the automotive sector, monitoring and system response FMEA (FMEA-MSR) is also used, monitoring the ability of systems to respond to potential risks during operation.
The application of FMEA follows a seven-step process. It begins with planning and preparation, where the scope of the analysis, including its objectives and the collection of necessary input data (e.g., historical data, technical documentation, process diagrams), is defined. This initial step often uses the 5T methodology—intent, timing, team, task, and tools. Next is the structure analysis, where the process is broken down into hierarchical levels: from the overall production system down to individual work activities and their influencing factors. In the following step, the functions of individual parts of the process are analyzed, and their required functions are defined. This phase is followed by the identification of potential failures (failure modes), their causes, and consequences, which form the basis for risk assessment.
Risks are evaluated from three perspectives—severity, occurrence, and detection. These three parameters are multiplied to calculate the so-called risk priority number (RPN). This index determines which failures require priority attention. In the next phase, based on the analysis, optimization measures are proposed, and their effectiveness is assessed, also from the perspective of action priority—low, medium, or high. The final step is the documentation of all findings, including the measures taken and recommendations, in a final report.
The FMEA method formed the foundation of the entire research. Its seven-step process was enhanced by the use of artificial intelligence, which enabled automated prediction of risk and RPN values based on historical data. Using Random Forest and XGBoost models, it was possible to classify individual cases as risky or non-risky, thereby streamlining the assessment of failure severity. The results demonstrated the potential of this approach for intelligent decision support and optimization of production processes.
2.6. Root Cause Failure Analysis (RCFA)
RCFA was used complementarily in validating the results of AI models, as the identified risky failure modes needed to be analyzed from the perspective of their causes. Cause-and-effect diagrams (e.g., 5 Whys, Ishikawa) were used to support the recommended measures for reducing the RPN. RCFA provided an important addition to FMEA in identifying deeper root causes.
2.7. Fault Tree Analysis (FTA)
FTA was not directly implemented, but in combination with FMEA, it can be considered a suitable complement for future work, particularly in the area of visualizing the causes of risk events. Its use is being considered for the automated generation of fault trees using AI, which could improve the clarity of analyses.
2.8. Evaluation of Production Process Capability
Random Forest is an algorithm based on an ensemble of decision trees, where each tree is trained on a random subset of the data and a random selection of attributes (e.g., severity, occurrence, detectability). The final predictions of individual trees are then combined through majority voting (in the case of classification), which reduces the risk of overfitting and increases the model’s accuracy. Key advantages include the following.
Robustness to noise: It can handle datasets with errors or missing values, which is useful for FMEA where input data (e.g., from maintenance records) may not always be complete;
High accuracy: Combining multiple trees leads to better predictions than a single tree;
Interpretability: The model provides feature importance values, e.g., whether severity (S) has a greater impact on risk than detectability (D);
Suitability for FMEA: It can predict risks based on multiple factors and adapt to dynamic data, such as user feedback.
The Random Forest Classifier is effective in risk prediction within complex systems due to its ability to handle nonlinear relationships and a large number of input variables. Our model was trained on historical FMEA data and then used to predict RPN values. For example, if the model received inputs like “S = 8, O = 3, D = 4”, it could classify the risk as “medium” and recommend a quality check. In the context of the dynamic FMEA we propose, the Random Forest Classifier could continuously learn from new data and automatically adjust risk evaluations.
The Random Forest Classifier is popular in industrial applications because it does not require extensive data preprocessing and it can work with both categorical and numerical variables. For FMEA, the model could be trained on datasets containing various failure modes and their effects, enabling the prediction of which failures are most critical. Compared to other models (e.g., logistic regression, SVM), it has the advantage of managing nonlinear relationships and providing greater flexibility in risk analysis.
A visualization of how the Random Forest Classifier works is shown in
Figure 1, illustrating the ensemble of decision trees where each tree predicts the risk (e.g., “high” or “low”) and how their combined output determines the final classification.
In our study, this model was used to classify failure modes into risk categories (e.g., low, medium, high) based on historical data from production lines. The model utilized input variables such as severity (S), occurrence (O), and detection (D), as well as process data like vibration, frequency of maintenance interventions, and temperature.
Thanks to the feature importance calculation, the Random Forest model enabled the identification of the most significant factors influencing the resulting risk. Another advantage lies in its ability to work with incomplete or inconsistent data, which is common in real manufacturing conditions. The model proved to be a suitable tool for the dynamic updating of risk assessments in FMEA based on continuously collected data from production and maintenance systems.
2.9. Random Forest Regressor
The Random Forest Regressor was used in this study as one of the key artificial intelligence tools for predicting the risk priority number (RPN), which is the central output of the FMEA method. It is a regression machine learning model based on an ensemble of decision trees, each built on randomly selected data subsets. Each tree provides a partial estimate, and the final prediction is the average of these outputs. This approach allows the model to handle complex and non-linear relationships between variables, thereby increasing the robustness and accuracy of the computation. The model was implemented in Python 3.10 using the Scikit-learn library. Default hyperparameters were used, including n_estimators = 100 (number of trees), max_depth = None (trees expand until all leaves are pure), and min_samples_split = 2. These settings were selected to maintain model interpretability and efficiency without extensive tuning, while still achieving robust performance in our use case.
The Random Forest Regressor was trained on historical data about production equipment failures, including traditional FMEA values (severity, occurrence, detection) as well as extended technical-process data—such as vibration, operating temperature, frequency of maintenance interventions, and downtime durations. This rich data input allowed the model to gain a better understanding of real operating conditions and to account for hidden factors affecting failure risk.
The advantage of using the Random Forest Regressor lies in its ability to objectively and consistently estimate the RPN value even with incomplete, slightly noisy, or diverse data, which is very common in industrial environments. Instead of manual and subjective assignment of RPN values by team members, the model provides a standardized, data-driven output that can be regularly updated and retrospectively validated.
The predicted RPN values were subsequently used as inputs for other analytical tools, especially the Random Forest Classifier, which categorized failures based on their risk level. The Random Forest Regressor thus served as a foundational component for automated and intelligent FMEA analysis, contributing to more efficient decision-making in maintenance and increased reliability of production processes.
2.10. XGBoost
To improve performance and prediction accuracy, the Extreme Gradient Boosting (XGBoost) model was also applied. This algorithm is optimized for processing large datasets and can efficiently model complex nonlinear relationships between variables. XGBoost is a scalable gradient boosting system [
21] that achieves high efficiency even on large datasets thanks to optimizations such as the sparsity-aware algorithm for handling sparse data [
22]. Unlike Random Forest, where decision trees are created independently, XGBoost builds trees iteratively, with each new tree learning from the errors of the previous ones.
In our study, XGBoost was used as a regression model for predicting specific RPN values. The model inputs were the same as in the case of Random Forest (S, O, D, process parameters, maintenance data). The output was a predicted RPN for each failure case, which allowed for more detailed differentiation between individual risk levels. The model also supported the visualization of the impact of each variable on the output, providing valuable insights for optimizing maintenance and production strategies. The XGBoost implementation was based on the xgboost Python package. We used typical baseline parameters: learning_rate = 0.1, max_depth = 6, n_estimators = 100, subsample = 0.8, and lambda=1.0 for L2 regularization. To prevent overfitting, early stopping was enabled with a patience of 10 rounds using a validation subset comprising 30% of the training data. No automated hyperparameter tuning (e.g., grid search) was performed in this study, but results showed stable and accurate predictions with this configuration.
Both models were part of the intelligent FMEA analysis framework, where they play a key role in the automated risk assessment and design of preventive measures. Their integration into the process monitoring system represents a step toward dynamic, data-driven reliability management of production equipment.
3. Results
In modern industry, the reliability of production equipment is crucial for maintaining competitiveness and efficiency. Unplanned downtimes caused by failures can lead to significant financial losses and disruptions in production schedules. Therefore, it is essential to implement methods that enable the prediction and prevention of failures. AI can significantly support FMEA at various stages of analysis, streamlining the process of identifying and addressing potential issues.
This study focuses on optimizing workplace processes using artificial intelligence, with the FMEA method employed as a key tool. The analysis was conducted using data from a manufacturing company (SK) operating in the glass industry with the following aims.
Ensure automatic risk identification: AI analyzes historical failure and error data, identifies patterns, and suggests possible failure modes. Based on past data, machine learning models predict which processes or components are at higher risk of failure.
Predict the probability of occurrence: AI evaluates the likelihood of errors based on large datasets from sensors, production logs, or maintenance records. Using data such as machine vibration or temperature, it predicts when a failure might occur.
Automatically assess severity: AI analyzes the impact of failures using simulations or historical data. It evaluates how a failure affects production, quality, and efficiency, assigning an appropriate severity level.
Automatically calculate RPN: AI dynamically recalculates the risk priority number and prioritizes the most critical issues based on real-time data.
3.1. Outputs for RPN Calculation and Automatic Risk Identification
The input data originate from identical production lines 1 to 5 and cover the period from January 2023 to December 2024. The database contains 731 failure records, with nearly every day registering at least one breakdown on one of the lines. For each failure, the following information was recorded: date, specific line, type of failure (problem category), failure cause, and the severity (S), occurrence (O), and detection (D) ratings according to the FMEA methodology. These values range from 1 to 10 and were assigned by maintenance personnel in accordance with the QS9000 standard.
The assignment of severity (S), occurrence (O), and detection (D) values was performed by trained maintenance personnel familiar with equipment behavior and failure impact. To ensure consistency and minimize subjectivity, the evaluation followed internal procedures based on the QS9000 standard, using predefined rating scales. This standardization allowed for uniform scoring across records and improved the reliability of the resulting RPN values for further machine learning analysis.
Subsequently, these three values were multiplied to calculate the RPN, a number that quantifies the risk level of the given failure (
Table 1).
In addition to these values, process parameters such as temperature, vibrations, production speed, and defect percentage were also recorded. All values were measured on the day of the failure for the given line.
The variables included in the model were selected based on their relevance to the production process and their availability in the company’s information system. The core FMEA parameters (S, O, D) were mandatory inputs, while additional process parameters (temperature, vibration, speed, defect rate, and number of interventions) were selected through expert consultation and were continuously monitored via sensors.
To check for multicollinearity, a correlation matrix was computed. The analysis showed that while S, O, and D correlate with RPN as expected, other variables showed only weak to moderate correlation. This confirmed that the input variables provide mostly independent information, and no dimensionality reduction or feature elimination was necessary.
3.2. Results of the Model for Predicting RPN Using Random Forest Regressor
The Random Forest Regressor was used to predict the numerical value of the risk priority number (RPN) indicator, which represents the product of the three basic parameters of the FMEA method: severity (S), occurrence (O), and detection (D). The model was implemented using the default settings of the Scikit-learn library in Python 3.10. This included 100 trees (n_estimators = 100), unlimited tree depth (max_depth = None), and minimum samples per split (min_samples_split = 2).
The XGBoost model was trained using the xgboost Python library with default hyperparameter values: learning_rate = 0.1, max_depth = 6, n_estimators = 100, subsample = 0.8, and lambda = 1.0 for L2 regularization.
The input data included not only these three variables but also additional process parameters such as vibrations, temperature, frequency of failures, maintenance interventions, and production speed, which enhanced the predictive power of the model.
The performance of the model was evaluated using standard regression metrics: × mean absolute error (MAE) = 2.18 × root mean squared error (RMSE) = 2.65 × R2 (coefficient of determination) = 0.999.
To train and evaluate the model, the dataset was randomly split into 70% training and 30% testing subsets. The model was trained on the training set, and all performance metrics (R2, MAE, RMSE) were computed on the hold-out test set to ensure that the model’s predictive ability generalizes to unseen data.
Although cross-validation (e.g., k-fold) was not applied in this study, we plan to include it in future work to further validate the model’s robustness and reduce the potential influence of dataset-specific characteristics.
MAE represents the average absolute error between the actual and predicted values. A value of 2.18 means that, on average, the model deviated by approximately 2 RPN units, which is exceptionally accurate for the typical RPN range (1–1000).
RMSE is more sensitive to larger errors than MAE and serves as an indicator of the overall stability of the model. A value of 2.65 confirms that the predictions do not show significant fluctuations. Considering that RPN values range from 1 to 1000, the observed prediction errors (MAE = 2.18, RMSE = 2.65) represent less than 0.3% of the total range. Such a low level of error is practically negligible for decision-making in industrial maintenance, where risk is typically interpreted in broader categories (e.g., low, medium, high). This confirms the practical applicability of the model.
R2 = 0.999 indicates that the model explains 99.9% of the variability in the target variable (RPN). This means that the model almost perfectly reflects the relationship between the input variables and the RPN value.
The extremely high R2 value (0.999) is primarily due to the deterministic nature of the RPN, which is calculated as the product of the S, O, and D parameters. Since these values were included as model inputs, the model essentially learned this direct relationship. Additionally, the dataset was clean, structured, and manually verified by experts, reducing variability. Random Forest inherently reduces the risk of overfitting due to its ensemble nature and use of random subsets of features.
The Random Forest Regressor model proved to be an exceptionally powerful tool for predicting RPN values. With a combination of high R2 and low errors (MAE, RMSE), the model can be considered reliable and practically useful in real-world industrial maintenance conditions. In this way, the priority for solving failures can be dynamically determined without the need for manual calculation of RPN for each individual case. Additionally, the automated prediction of RPN allows integration with other maintenance planning tools e.g., Computerized Maintenance management system (CMMS), thus streamlining asset management and reducing the risk of unexpected downtimes.
3.3. The Results of the Model for Risk Prediction Using the Random Forest Classifier
The results of the Random Forest Classifier show interesting behavior in distinguishing between low- and high-risk cases. The model achieved an overall accuracy of 82.9%, meaning it correctly classified more than three-quarters of the cases. However, this value alone does not provide a complete picture of the model’s performance, so it is necessary to analyze other metrics such as precision, recall, and F1-score for both classes.
Class 0—Low Risk is characterized by the following elements.
Precision (92.9%) means that when the model labels a case as low-risk, it is correct in most cases;
Recall (75.6%) is relatively low, indicating that the model missed a large portion of truly low-risk cases—meaning these cases were incorrectly classified as high-risk;
F1-score (83.4%) represents the balance between precision and the ability to capture all low-risk cases and is relatively weak.
The model is conservative with this class—when it labels something as low-risk, it is almost certainly correct, but many cases from this category are incorrectly inflated to high-risk.
Class 1—High Risk is defined by these criteria.
Recall (92.4%) is very high—the model captures almost all of the truly risky cases, which is extremely important from a safety and maintenance perspective;
Precision (74.4%) is lower, meaning that among the identified high-risk cases, there are quite a few false positives—meaning the model labels some non-risky cases as risky;
F1-score (82.4%) shows that the model has a good balance between capturing true risks and the reliability of decisions in this class.
The model has very strong detection of truly critical situations, which is a welcome property in FMEA analysis. Although it occasionally falsely classifies some cases as critical, this error is acceptable in terms of prevention, especially when the goal is to minimize the occurrence of overlooked severe failures.
In the context of industrial maintenance, recall is particularly important for the high-risk class, as it reflects the model’s ability to correctly identify critical failure modes. A high recall (92.4%) means that nearly all serious failures are detected and flagged for action, significantly reducing the risk of unplanned downtime.
From an operational standpoint, false negatives are the most dangerous, as they can result in missed critical maintenance and unexpected breakdowns. The low false-negative rate of our model ensures that almost all urgent issues are identified.
On the other hand, false positives may lead to preventive inspections that turn out to be unnecessary. However, in the context of safety and preventive maintenance, this trade-off is acceptable—especially when the primary goal is not to miss severe problems. Such conservatism is aligned with the FMEA philosophy, which favors over-prevention rather than underreaction.
3.3.1. Comparison of Results with Other Studies
The results achieved in this study were compared with selected applications of the Random Forest Classifier in other fields and research. The literature indicates that Random Forest often achieves very high accuracy and performance. For example, in sentiment classification on social networks, precision values ranged from 70–90%, recall from 65–85%, and accuracy from 80–95%, with less complex, text-oriented data [
23]. In botnet detection, the model achieved nearly 100% precision and recall, but worked with a very well-structured dataset [
24]. In medical applications, such as detecting eye disorders, the model’s performance ranged from precision of 76%, recall of approximately 70%, and accuracy around 75%, which is closer to typical performance in FMEA analysis [
25]. In industrial FMEA studies, especially in the automotive industry, common results show accuracy of 70–90%, with precision and recall in the range of 60–85%, especially with well-balanced data and hyperparameter optimization [
26].
When compared with the literature, it is clear that studies from various fields—such as sentiment analysis, botnet detection, medical applications, and industrial FMEA—suggest that the Random Forest Classifier typically achieves accuracy between 70 and 95%. Our model, with an accuracy of 82.9%, fits within this range, ranking it among standard-performing models. Precision for low risk (92.9%) is at a level considered very good in the literature, although recall (75.6%) is somewhat in the middle of typical values, influenced by the complexity of our data compared to simpler datasets in some studies. For high risk, our recall (92.4%) is among the higher results seen in the literature, while precision (74.4%) aligns with typical values, where a compromise is often accepted due to a focus on capturing risks. The literature suggests that models with well-structured data achieve top results, while performance in more complex applications, such as FMEA, tends to be closer to our values. Our model thus meets the expectations of industrial and similar analyses, with its strength in risk detection making it practically usable, although there is still room for improvement—such as reducing false positives.
3.3.2. Interpretation of Risk Classification Results
After the creation and training of the artificial intelligence model for failure modes and effects analysis (FMEA), the Random Forest Classifier was used to predict the risk level for individual production lines. The model classified each record as either low-risk (0) or high-risk (1) based on a combination of historical failure data and current process data.
Any situation where the risk priority number (RPN) value exceeded 100 was classified as high-risk. This threshold was chosen based on practical recommendations and literature, which consider an RPN higher than 100 as a value where more serious failures with increased impact on safety, quality, or production continuity may occur [
27]. Values below 100 were therefore classified as low-risk, meaning cases that do not require immediate intervention but should be monitored further. To illustrate the output of the model,
Table 2 shows a sample of predicted RPN values for selected failure records. The table includes the failure identifier, the corresponding production line, the date of occurrence, the FMEA parameters (S, O, D), the calculated RPN, and the binary risk classification (0 = low, 1 = high).
Table 2 serves as an example of how the data were processed and the format of the predictive model’s output. The complete database contained 731 records, but for clarity, only a representative sample is shown.
The analysis of the correlation matrix shows that the highest positive correlation with both the actual and predicted RPN values is found in the variables defining severity (S), occurrence (O), and detection (D), which is expected since RPN is their direct product. Among the process variables, temperature exhibits a slight positive correlation with RPN, which may indicate that higher temperatures could be an indicator of more serious or frequent failures.
On the other hand, vibration, production speed, error rate, and number of interventions show weaker or less significant correlations, suggesting that these variables themselves may not be reliable risk indicators. Their impact may be indirect or dependent on specific types of failures (
Table 3).
Based on the model results, we can conclude that all the production lines were classified as high-risk (
Table 4), which automatically recommends increasing control, focusing mainly on the factors contributing to high RPN.
From a practical perspective, this indicates that the process is technologically or operationally less stable, or that the equipment has more frequent failures or inadequate maintenance.
Refining and improving predictive maintenance planning and regular maintenance could reduce the occurrence of failures.
The next step in using the trained model is the prediction of failures for the first three months of 2025. Using the trained dataset, a prediction (RPN 2025 prediction) was generated for the first three months of 2025.
A prediction of 73 records was created, containing scanned process parameters; see
Table 5.
The prediction quality of the model reached satisfactory values of the monitored quality (
Table 6). A more detailed view of the RPN deviations for individual lines is shown in
Table 7.
The use of the trained risk prediction model enables the preparation of a predictive maintenance plan for individual production lines.
Required maintenance activities are scheduled based on the predicted RPN, when the risk value exceeds the set threshold of 100.
The daily schedule includes the line number, date, cause, predicted RPN value, and planned activity, as shown in
Table 8.
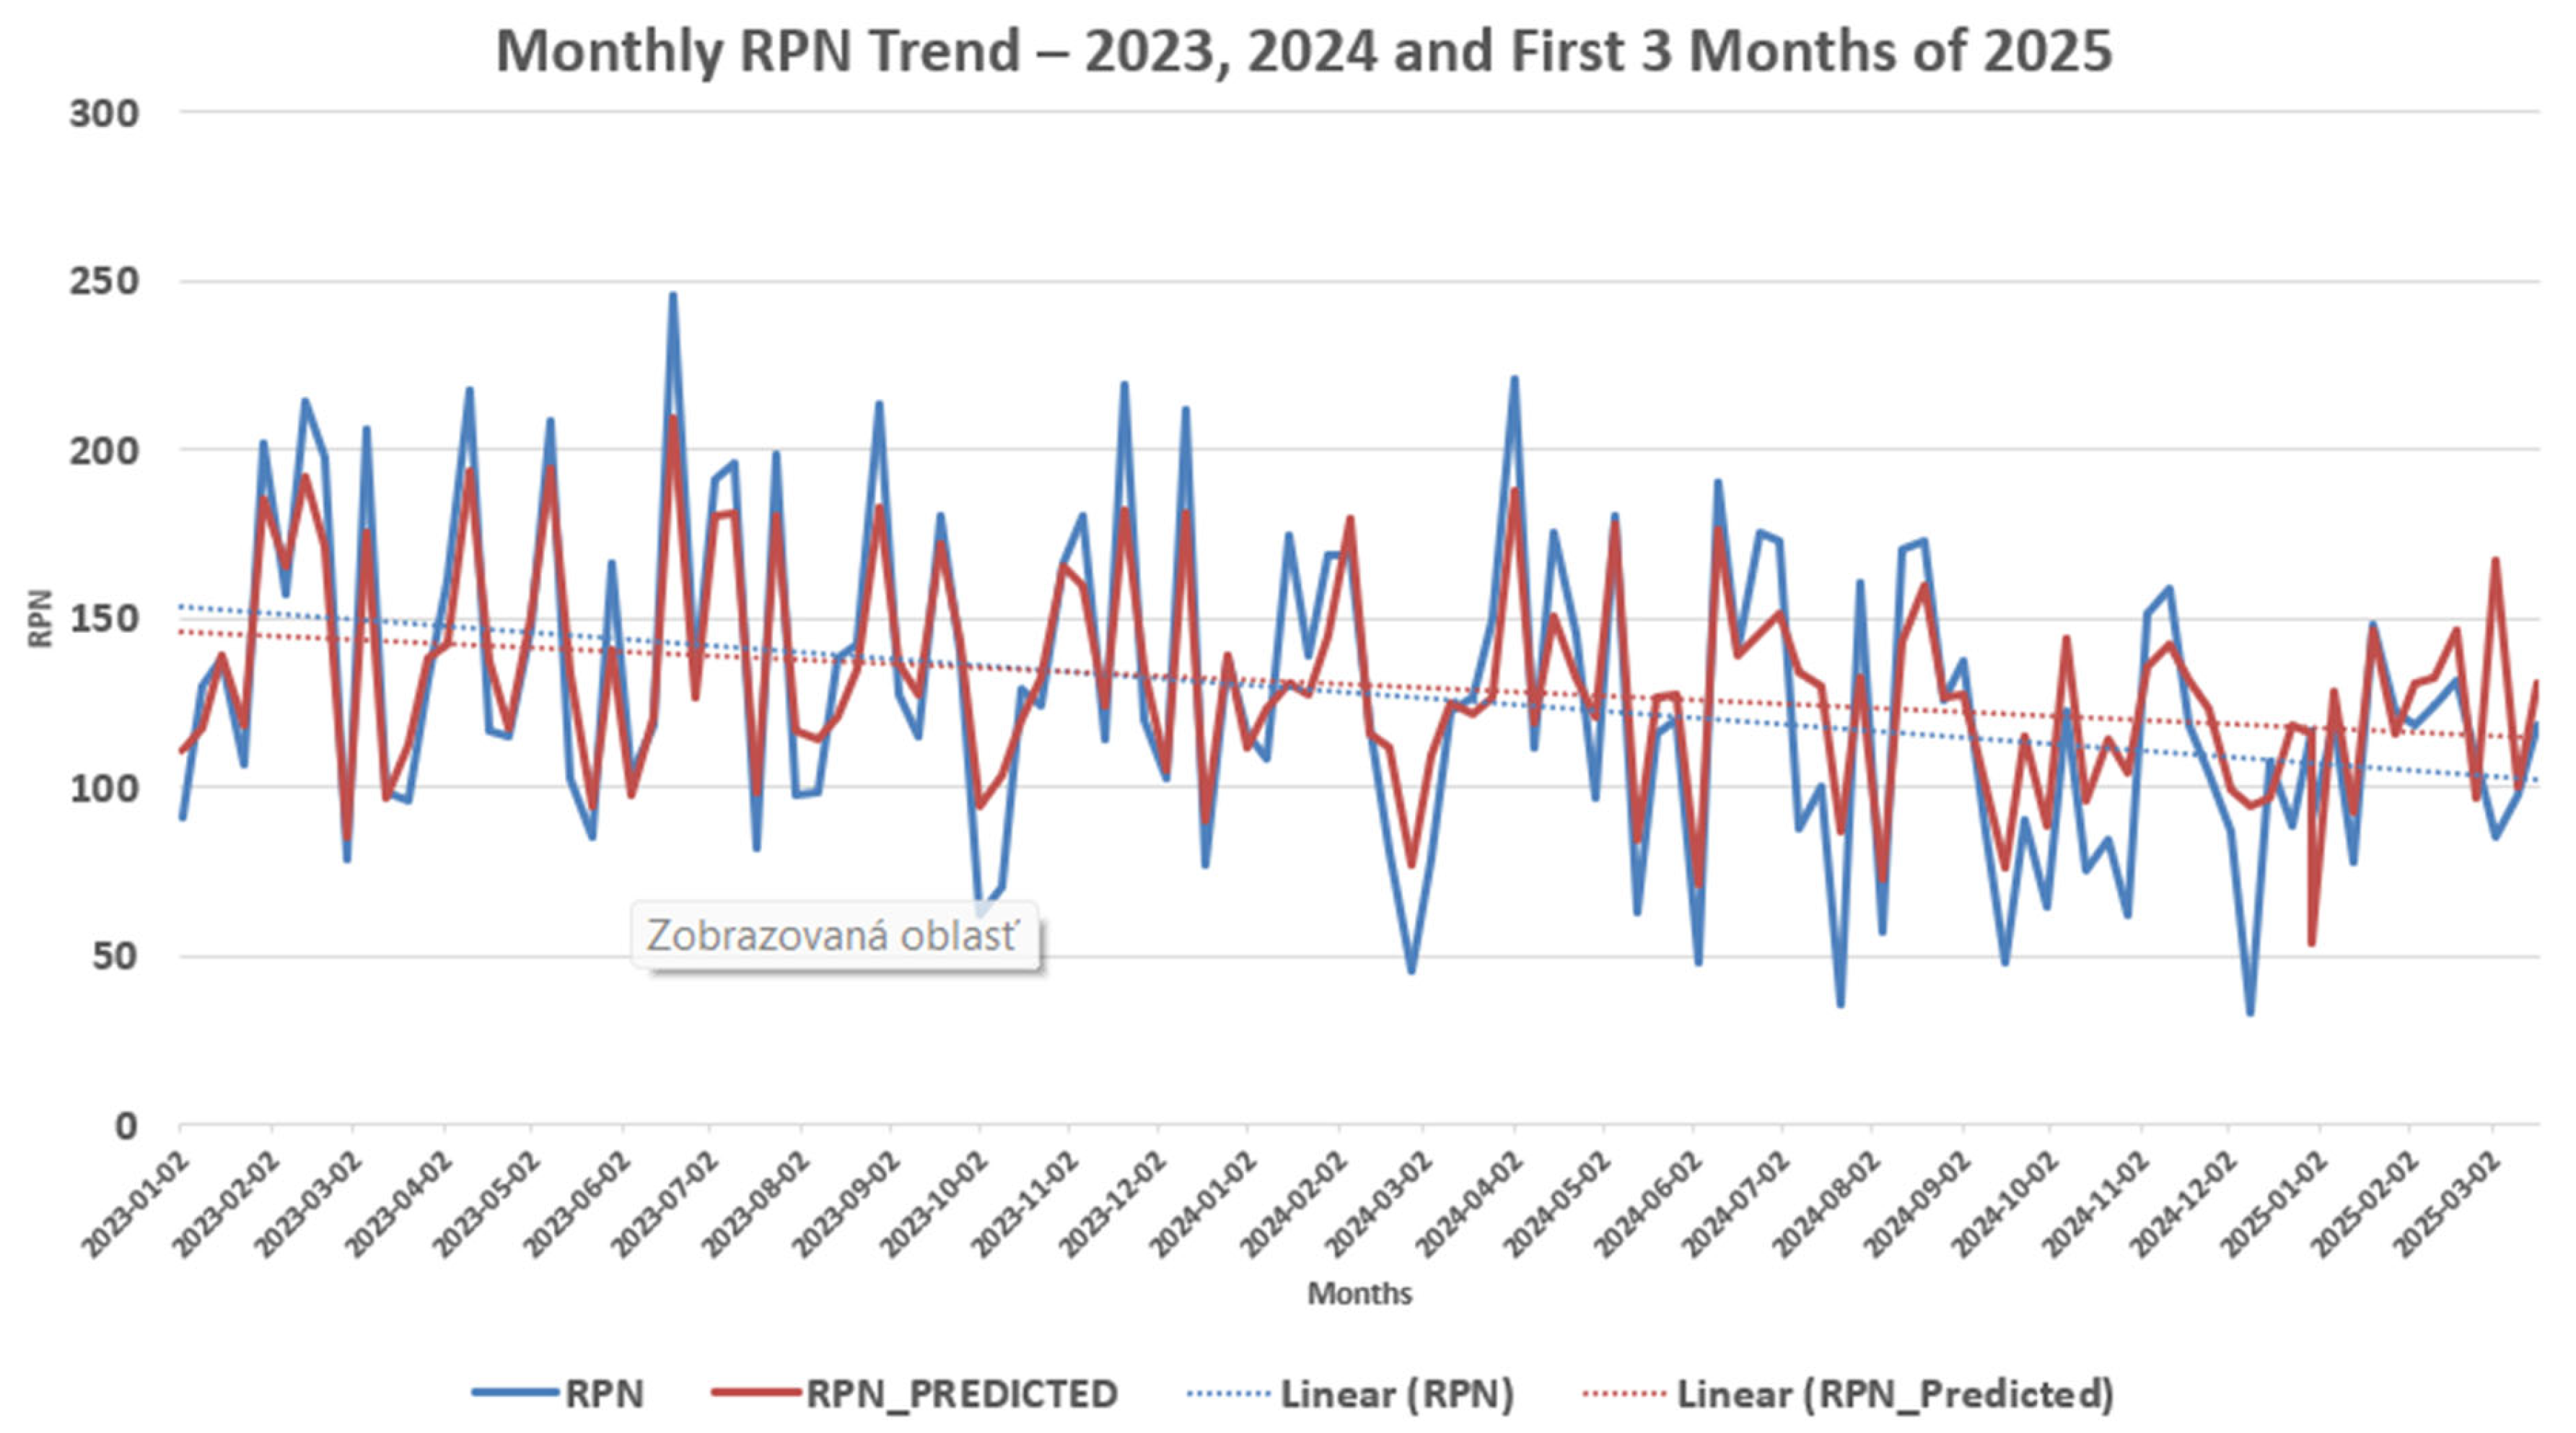
The resulting verification of the importance of scheduled preventive inspections, aimed at preventing the occurrence of failures, was continuously conducted by adding actual failures on the lines and their classification by maintenance workers (severity, occurrence, detection). The calculated actual RPN values and predicted RPN values are shown in
Figure 2.
From a practical perspective, these results are favorable for the purposes of FMEA analysis, as the goal is to capture as many potentially critical failure modes as possible, meaning a high recall is preferred, even at the cost of lower precision. In this regard, it can be said that the results achieved in this study are consistent with the requirements of real-world industrial deployment and provide a reliable foundation for future implementation and further improvement of the model (e.g., by balancing the data or advanced optimization of parameters).
4. Discussion
The study focuses on process optimization in the workplace using artificial intelligence to increase the accuracy and efficiency of risk assessment. The presented FMEA method is a key approach for risk analysis in complex manufacturing environments, where it helps identify weak points and optimize various maintenance strategies. Throughout the study, regular meetings were held with the project team and company management, where the results were positively evaluated and further improvements were suggested. AI analyzes historical data on failures and errors, identifies patterns, and suggests potential failure modes. The machine learning model, based on past data, predicts which processes or components have a higher risk of failure. The achieved results enabled the prediction of risks for the upcoming period.
An alternative approach is the use of regression models to predict precise RPN values instead of binary classification or the use of advanced methods such as deep learning or boosting models (XGBoost, LightGBM), which offer higher accuracy. Recent advances in natural language processing (NLP) have led to the development of frameworks aimed at automating failure mode identification directly from maintenance records. For instance, study [
12] proposes a semi-supervised active learning approach, where a human annotates a small portion of textual maintenance logs, and the model extrapolates from this to identify failure modes with over 90% accuracy. This method is particularly useful in environments where structured sensor data are limited, but historical records are available in text form.
In contrast, our study takes a fully data-driven approach based on structured, quantitative data collected from sensors and maintenance systems. Rather than extracting failure modes from unstructured text, we focus on predicting the risk priority number (RPN) and classifying risk levels based on measurable process parameters. This allows for higher integration into automated, real-time maintenance systems and complements NLP-based approaches by covering different data sources and use cases.
Other studies have introduced hybrid AI approaches combining fuzzy logic, expert rules, and neural networks to support FMEA. These approaches are useful for capturing uncertainty and human reasoning but often require significant manual configuration and are difficult to scale. By using Random Forest and XGBoost, our solution provides accurate results and better interpretability and is suitable for implementation in real-time systems.
Additionally, the trend toward real-time FMEA via IoT integration is growing rapidly in Industry 4.0. Our approach supports this shift by showing how live sensor inputs (e.g., temperature, vibration) can dynamically influence failure risk classification and prediction, making it possible to deploy continuous risk monitoring across industrial environments.
In the study, two models were tested: the Random Forest Classifier model and the XGBoost model, where the achieved results had negligible deviation (
Table 9).
Although only Random Forest and XGBoost were used in the final implementation, other commonly used baseline algorithms—such as logistic regression and support vector machines (SVMs)—were considered during the methodological planning phase. These models are often applied in classification tasks, but they are generally less suited for handling nonlinear interactions and mixed-type input variables like those used in this study (e.g., severity scores, sensor data). Logistic regression, being a linear model, may not capture complex relationships between failure indicators, while SVMs can be sensitive to feature scaling and require careful kernel selection. In contrast, Random Forest provides robustness against overfitting, handles both categorical and numerical data well, and automatically captures nonlinearities and feature interactions, making it a strong choice for industrial applications with structured data.
Achieving better results and bringing predictions closer to reality is influenced by the selection of monitored parameters and the definition of classifications for severity (S), occurrence (O), and detection (D). The basic model can be further improved by using additional input variables. Since this is a prediction based on trained data, if there are significant deviations in RPN, it is necessary to work with maintenance personnel to classify new types of failures and incorporate them into the training dataset.
The goal of improving the maintenance process is to optimize maintenance activities so that there is an improvement in the trend of RPN development compared to the baseline. In the study, where FMEA is combined with predictive models and data training, there was a reduction in RPN (
Figure 2). RPN on production lines shows a downward trend thanks to the dynamic preventive maintenance plan, which reduced the frequency of failures. The use of the model to improve the maintenance process through the Python programming tool, which has the training models implemented in external libraries, allows for the optimization of speed and memory usage on common computing devices. This enables maintenance personnel to perform the following tasks.
Provide an estimate of the risk of failures for each day ahead, for example, 1–3 months (within the application, the number of months to predict can be selected);
Plan preventive maintenance for each line that will have a “high-risk” status;
Evaluate the effectiveness of measures over months;
Evaluate the model with a recommendation to retrain with new data to improve the model, especially in the case of new causes of failures;
Propose an automated dashboard with a visualization of predicted risks on the lines.
Using the results of the model for maintenance processes allows for ensuring progress towards fault-free conditions at workstations to achieve the highest possible availability and efficiency in production. The failure modes and effects analysis (FMEA) method has proven to be an effective tool for identifying and assessing risks with the support of artificial intelligence. It is important to apply these results in the maintenance management process, which cannot function without monitoring risky lines (the model flags a line as high-risk), for which analysis and preventive actions are needed. Within predictive maintenance (the model identifies the correlation between failure rates and maintenance), maintenance should be planned before a failure occurs. In the context of optimizing production processes, if parameters (such as vibrations or temperature) influence failure rates, these factors need to be monitored and controlled.
The results showed that the model can provide the following benefits.
Automate risk analysis and assign maintenance priorities;
Alert to critical processes and recommend a maintenance plan;
Enable automatic generation of FMEA tables and reports;
Allow rapid evaluation of a large volume of historical failures;
Highlight recurring trends in maintenance;
Recommend corrective actions based on historical repairs and qualitative evaluations.
The implementation of an AI-supported FMEA system was validated using real data from a manufacturing environment. It is important to note that the proposed model was trained and validated using data from a specific industrial domain—glass manufacturing. As a result, the patterns of failure and process characteristics captured by the model reflect the conditions of this particular sector. In other industries, such as aerospace, automotive, and agriculture, failure mechanisms may differ significantly due to variations in technology, operational parameters, and safety requirements.
Therefore, while the methodology remains broadly applicable, the model itself must be adapted and retrained on industry-specific data to ensure accurate performance. Customization of input features, failure categories, and scoring criteria (S, O, D) is essential to effectively apply AI-supported FMEA in different production environments. The data included information on operational parameters of equipment, history of failures, and performed maintenance interventions.
To ensure generalizability across industries such as automotive, pharmaceuticals, and aerospace, the core methodology (i.e., combining AI with FMEA for risk prioritization and predictive maintenance) remains applicable, but the model must be adapted to reflect different operational contexts. This includes the following.
Redefining the scoring criteria (S, O, D) to align with industry-specific risk tolerances and regulatory standards (e.g., higher safety margins in aerospace or strict compliance in pharma);
Retraining machine learning models on domain-specific datasets, capturing failure patterns unique to the target industry;
Customizing monitored features, as process-critical parameters in pharmaceuticals (e.g., sterility, humidity) differ significantly from those in heavy manufacturing (e.g., mechanical wear, vibration).
Ultimately, while the specific implementation reflects the glass industry, the methodology itself is flexible and scalable and can be adapted to support predictive risk management across a variety of industrial domains.
The integration of artificial intelligence into FMEA represents a significant step forward in the field of maintenance. Intelligent FMEA enables failure prediction and proactive risk management, leading to increased equipment reliability and reduced maintenance costs. Implementing such a system requires investments in data collection and AI model development, but the benefits in terms of more efficient maintenance and higher productivity justify these investments.


 ,
, 


