Article

VAE-GAN-Guided Cross-Class Generation: A Class Imbalance Data Augmentation Method for Network Intrusion Detection

1
Institute of System Engineering AMS PLA, Beijing 100039, China
2
State Key Laboratory of Networking and Switching Technology, Beijing University of Posts and Telecommunications, Beijing 100080, China
*
Author to whom correspondence should be addressed.
Electronics 2025, 14(11), 2103; https://doi.org/10.3390/electronics14112103
Submission received: 14 March 2025 / Revised: 12 May 2025 / Accepted: 14 May 2025 / Published: 22 May 2025
(This article belongs to the Special Issue Recognition of Patterns and Trends in Multimedia Datasets)

Abstract

:
Network intrusion datasets often face class imbalance issues in intrusion detection tasks, where the number of majority class samples is much higher than minority class samples. Current solutions face notable limitations: traditional normalization weakens the multimodal distribution of continuous features, while mainstream generative models focus excessively on minority class mining while neglecting majority class information. To address these issues, we propose M2M-VAEGAN, which innovatively incorporates a Variational Gaussian Mixture (VGM) model to preserve multimodal characteristics of continuous features. We design a transfer learning framework, pre-training on majority classes to capture general attack patterns, followed by fine-tuning with balanced batches of majority and minority samples to prevent catastrophic forgetting. Additionally, we enhance the VAEGAN architecture with an auxiliary classifier to strengthen conditional information learning. On the NSL-KDD and CIC-IDS2017 datasets, M2M-VAEGAN outperforms methods such as SMOTE, CTGAN, and CTABGAN, achieving a 1.25% to 6.42% improvement in minority class recall. These results demonstrate the effectiveness of the proposed approach.

1. Introduction

With the explosive growth of network traffic, network security is facing unprecedented pressure. Intrusion Detection Systems (IDSs) [1] serve as critical defenses, effectively identifying both internal and external unauthorized access and malicious activities to safeguard network security.
Deep learning has demonstrated remarkable success across various domains and is now being applied to intrusion detection [2]. However, deep learning models require large-scale, high-quality training data with balanced class distributions [3]. Real-world network traffic datasets often exhibit severe class imbalance. This imbalance causes models to favor majority classes during training while neglecting minority attack classes, ultimately reducing detection accuracy for critical anomalies and degrading overall IDS performance.
Current methods addressing class imbalance in network intrusion datasets have notable limitations. First, continuous features in these datasets typically follow multimodal distributions. Traditional normalization methods tend to weaken the feature representation of minority class samples during data generation. Second, existing generative models focus excessively on mining minority class patterns while overlooking the valuable information contained in majority class samples.
To address these challenges, we propose M2M-VAEGAN-IDS, a cross-class generation model based on VAE-GAN for enhancing imbalanced datasets. Our key innovations include (1) introducing a Variational Gaussian Mixture (VGM) model that captures multimodal distributions of continuous features while preserving minority class characteristics, (2) applying transfer learning, where majority class samples are used for model pre-training [4] to guide the generation of diverse minority class samples, and (3) enhancing the VAE-GAN framework [5] with an auxiliary classifier to strengthen conditional information modeling and provide additional supervision for the discriminator.
New samples are generated using the fine-tuned model and are merged with the original training data to construct an expanded dataset for subsequent multi-class classification tasks. Experiments conducted on NSL-KDD [6] and CIC-IDS 2017 [7] demonstrate the effectiveness of the proposed method in improving minority class detection and enhancing overall intrusion detection performance.
This paper makes the following contributions:
  • A new class-balancing strategy: We propose M2M-VAEGAN, which uses pre-training on majority classes and fine-tuning on minority classes to generate balanced datasets.
  • Improved detection performance: By combining M2M-VAEGAN with Convolutional Neural Networks (CNNs) [8], we develop an intrusion detection model called M2M-VAEGAN-IDS, aiming to achieve higher detection accuracy.
  • Experimental validation: We test M2M-VAEGAN-IDS on two widely used datasets, NSL-KDD and CIC-IDS 2017. The results show that our method performs better than other existing intrusion detection approaches. The source code has been made publicly available at https://github.com/Kang-ian/M2M-VAEGAN-IDS (accessed on 13 May 2025).
The rest of this paper is organized as follows. Section 2 reviews the related work. Section 3 provides an overview of background knowledge. Section 4 details the design of M2M-VAEGAN-IDS. Section 5 describes the experimental evaluation process. Finally, Section 6 concludes the paper.

2. Related Work

2.1. Intrusion Detection Technology

In recent years, machine learning methods, like CNN [9], have made big strides in network intrusion detection [10]. Methods that use data augmentation to improve detection performance have also received a lot of attention.
Yun et al. [11] proposed KGSMOTE, a kernel density estimation-based Geometric-SMOTE technique, to address class imbalance in intrusion detection. First, random under-sampling (RUS) reduces majority-class samples. Then, Kernel Density Estimation (KDE) places a kernel function at each data point and combines them into a smoothed distribution curve, capturing underlying data patterns. Finally, Geometric-SMOTE refines synthetic samples to enhance quality and representativeness, improving detection of minority class attack anomalies.
Ahsan et al. [12] explored three resampling methods to address data imbalance. The Synthetic Minority Over-sampling Technique (SMOTE) generates new samples by interpolating between minority-class samples. NearMiss selects majority class samples closest to minority samples for undersampling. SMOTEENN combines SMOTE for oversampling minority samples with Edited Nearest Neighbor (ENN) to remove majority samples near minority samples. These were integrated with multiple machine learning models, achieving optimal decision performance.
Gu et al. [13] tackled the class imbalance problem by first applying RUS to reduce the number of majority class samples. They then used Borderline-SMOTE to focus on minority samples near the classification boundary and boost minority class representation. Subsequently, they employed a self-attention-enhanced Wasserstein GAN (WGAN) with gradient penalty to effectively capture the features and distribution of rare class samples, further oversampling the minority class. In the detection phase, focal loss was utilized to balance the focus across different classes, significantly improving detection performance for rare classes.
Shang et al. [14] proposed a GAN-based model that innovatively incorporates the Gumbel–Softmax activation function in the generator to handle non-numeric columns in the output layer. In the discriminator, they introduced an embedding layer to process non-numeric input columns. Additionally, they integrated a multi-head attention mechanism to enhance the network’s ability to capture information and extract features effectively.
Hu et al. [15] proposed a deep residual network architecture incorporating their custom-designed hybrid attention module (ESSAM). ESSAM combines the Efficient Channel Attention mechanism (ECA) and Hyperbolic Residual Spatial Attention mechanism. ECA lightly improves the modeling of channel importance in CNNs, while hyperbolic spatial attention, incorporating ideas from hyperbolic geometry and residual connections, enhances the modeling of spatial features. A bidirectional Long Short-Term Memory (Bi-LSTM) module was added to capture temporal patterns in the data, further improving detection performance.
Rao et al. [16] introduced the Imbalanced Generative Adversarial Network (IGAN) to generate data for addressing class imbalance. In their detection model, they used the classic convolutional neural network architecture LeNet-5 to extract features and incorporated an LSTM network to capture temporal patterns, significantly improving classification accuracy.
Yun et al. [17] enhanced GANs for data augmentation by incorporating the Wasserstein distance and gradient penalty. They employed a CNN-LSTM structure to extract hierarchical spatiotemporal features from network traffic.
Kamal et al. [18] addressed class imbalance using resampling techniques such as Adaptive Synthetic Sampling (ADASYN), SMOTE, and ENN. They combined Transformer and CNN models to improve the detection of unknown attacks.

2.2. Imbalance Processing Methods

Class imbalance is a classic challenge in the field of machine learning. As Aida et al. [19] pointed out, current approaches to addressing class imbalance can be broadly categorized into data-level and algorithm-level methods. At the algorithm level, Ling et al. [20] discussed the importance of cost-sensitive learning in addressing class imbalance. This approach assigns different costs to misclassifications across classes, encouraging the model to focus more on identifying the minority class. Wonji et al. [21] employed weighted support vector machines (SVMs) as weak learners within an adaptive boosting framework. Through iterative training, multiple weak learners are combined to form a robust classifier, significantly enhancing performance on imbalanced datasets.
Next, we will focus on data-level approaches, which can be categorized into three main types: undersampling, oversampling, and hybrid techniques. The most widely adopted approaches are RUS and Random Oversampling (ROS). Liu et al. [22] proposed integrating Classifier Chains (CC) with conventional RUS. The chained architecture sequentially constructs binary classifiers for each label, where predictions from preceding classifiers serve as additional features for subsequent ones. This design captures high-order label correlations while naturally balancing class distribution in each binary training subset. Salehpour et al. [23] used XGBoost for noise detection and ADASYN to dynamically generate samples, addressing class imbalance. They then applied Random Forest for intrusion detection. Rok Blagus [24] conducted a detailed analysis of the limitations of SMOTE in high-dimensional spaces.
Seo et al. [25] developed a GAN-based intrusion detection system for vehicular networks. And they used two discriminators and one generator to improve the model’s ability to detect unknown attacks. Xu et al. [26] addressed the challenge of multi-modal distributions in continuous columns of tabular data by introducing CTGAN, a generative model specifically designed for tabular data. The proposed VGM approach allows for more flexible handling of complex data distributions. Building on CTGAN, Zhao et al. [27] developed CTABGAN, incorporating a classifier to ensure the semantic validity of generated data and an information loss mechanism to align the statistical distributions of generated and real data. Liu et al. [28] introduced three balancing methods: VAE, Conditional VAE (CVAE), and a combination of CVAE with RUS. They validated the effectiveness of these methods on the CSE-CIC-IDS2018 dataset. Tian et al. [29] enhanced the VAE-GAN framework by incorporating the Wasserstein distance and gradient penalty from WGAN-GP and an auxiliary classifier from ACGAN to improve training stability and sample quality.
Traditional generative methods, such as SMOTE and ADASYN, typically create new samples only within the minority class, while neural approaches like VAEGAN, proposed by Tian et al., primarily rely on the distribution of minority class data. However, focusing solely on intra-class features neglects the rich associations between majority and minority classes. When minority samples are scarce, such methods often yield poor-quality generations with limited generalization and overfitting tendencies.
To address these challenges, we incorporate majority class data during pre-training to learn universal features, then fine-tune using majority samples semantically similar to minority instances to avoid bias. The model is built on the VAE-GAN framework, combined with VGM for capturing multi-modal distributions in tabular data. Additionally, the model integrates the dual-task design of ACGAN and the optimization mechanisms of WGAN-GP to enhance generation quality and model stability.

3. Background

3.1. Variational Autoencoder (VAE)

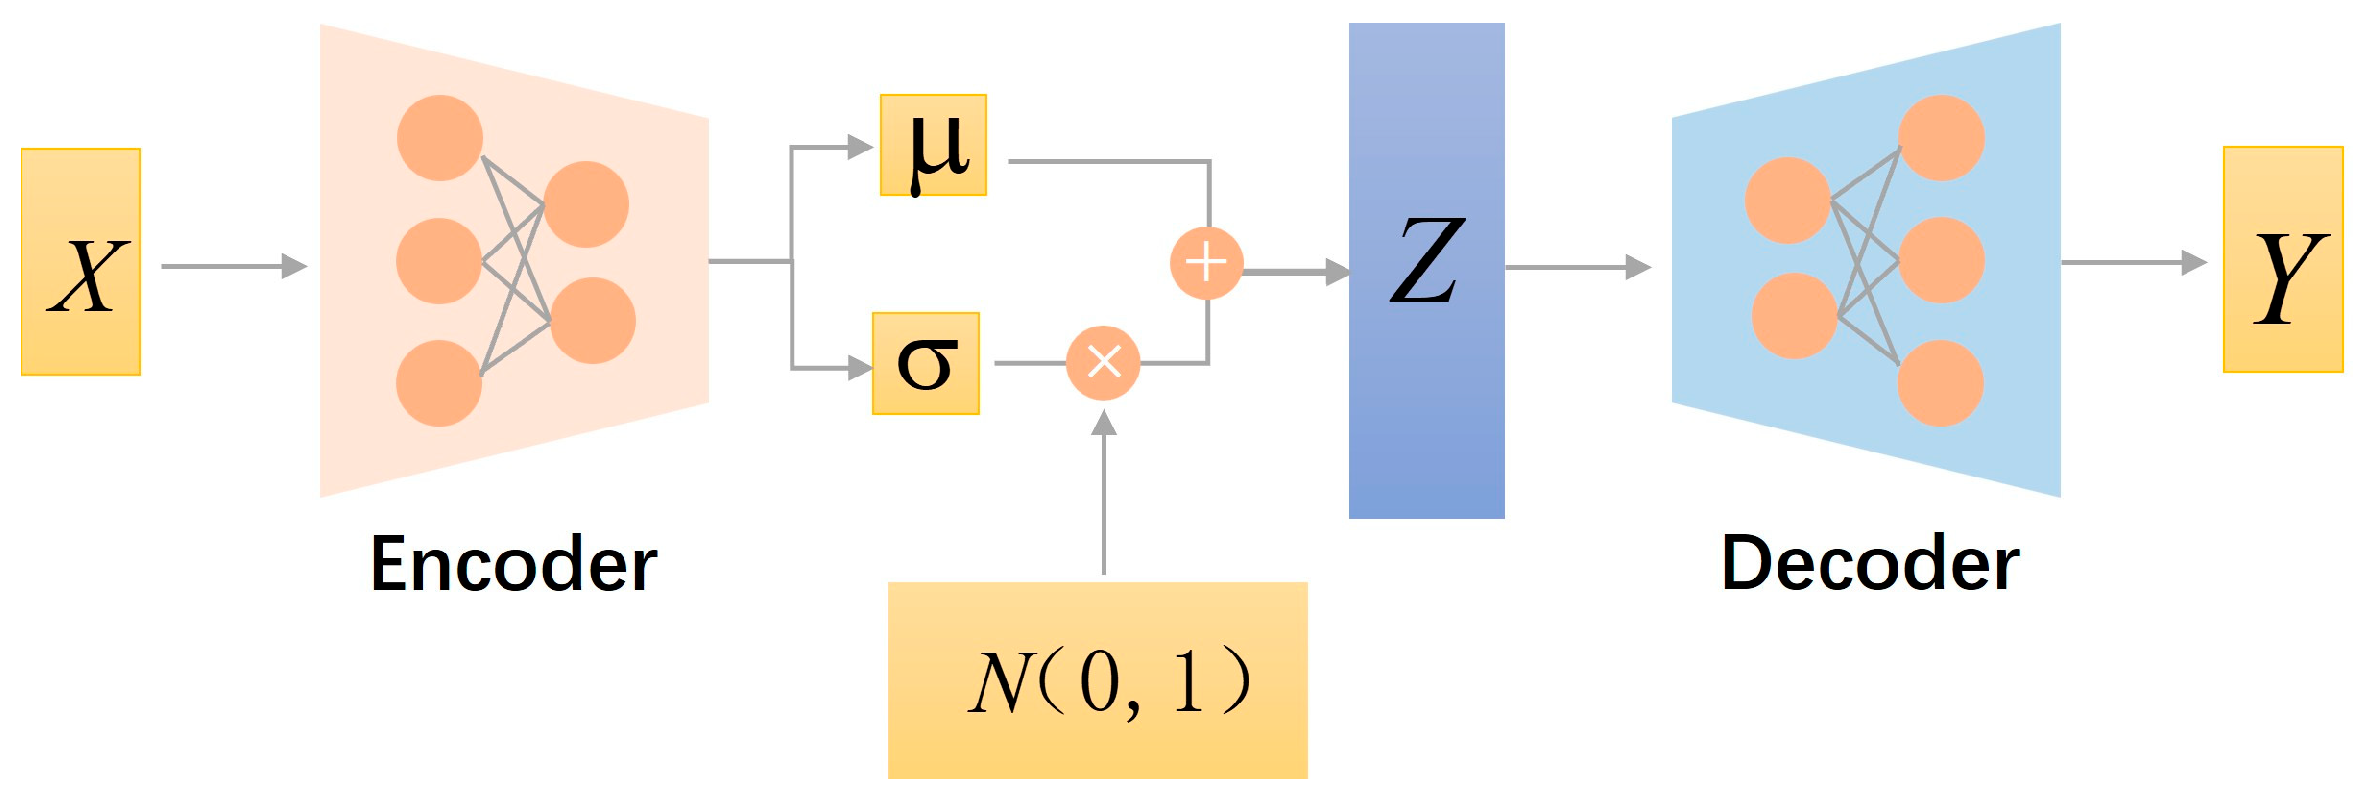
VAE (see Figure 1), introduced by Kingma et al. [30], is a probabilistic generative model that effectively combines deep learning with graphical models to represent data distributions. The encoder maps high-dimensional input data X to a low-dimensional latent space, generating parameters (mean μ and log-variance σ 2 ) for the latent variable distribution. The decoder then reconstructs the data from the latent representation Z , producing an output Y that approximates the original input X .
The optimization objective of VAE consists of two components: reconstruction loss and KL divergence loss [31]. The reconstruction loss measures the similarity between the reconstructed data Y and the input X by evaluating p x z , the likelihood of X given the latent variable Z . This is typically calculated using Mean Squared Error (MSE) [32]. The KL divergence loss enforces the latent distribution q z x to align with the prior distribution p z usually assumed to be a standard normal distribution, to ensure a well-structured latent space. The overall objective function can be formalized as
L v a e = L r e c + L K L = E q ( z | x ) l o g p ( x | z ) + D K L q ( z | x ) | | p ( z )

3.2. Generative Adversarial Network (GAN)

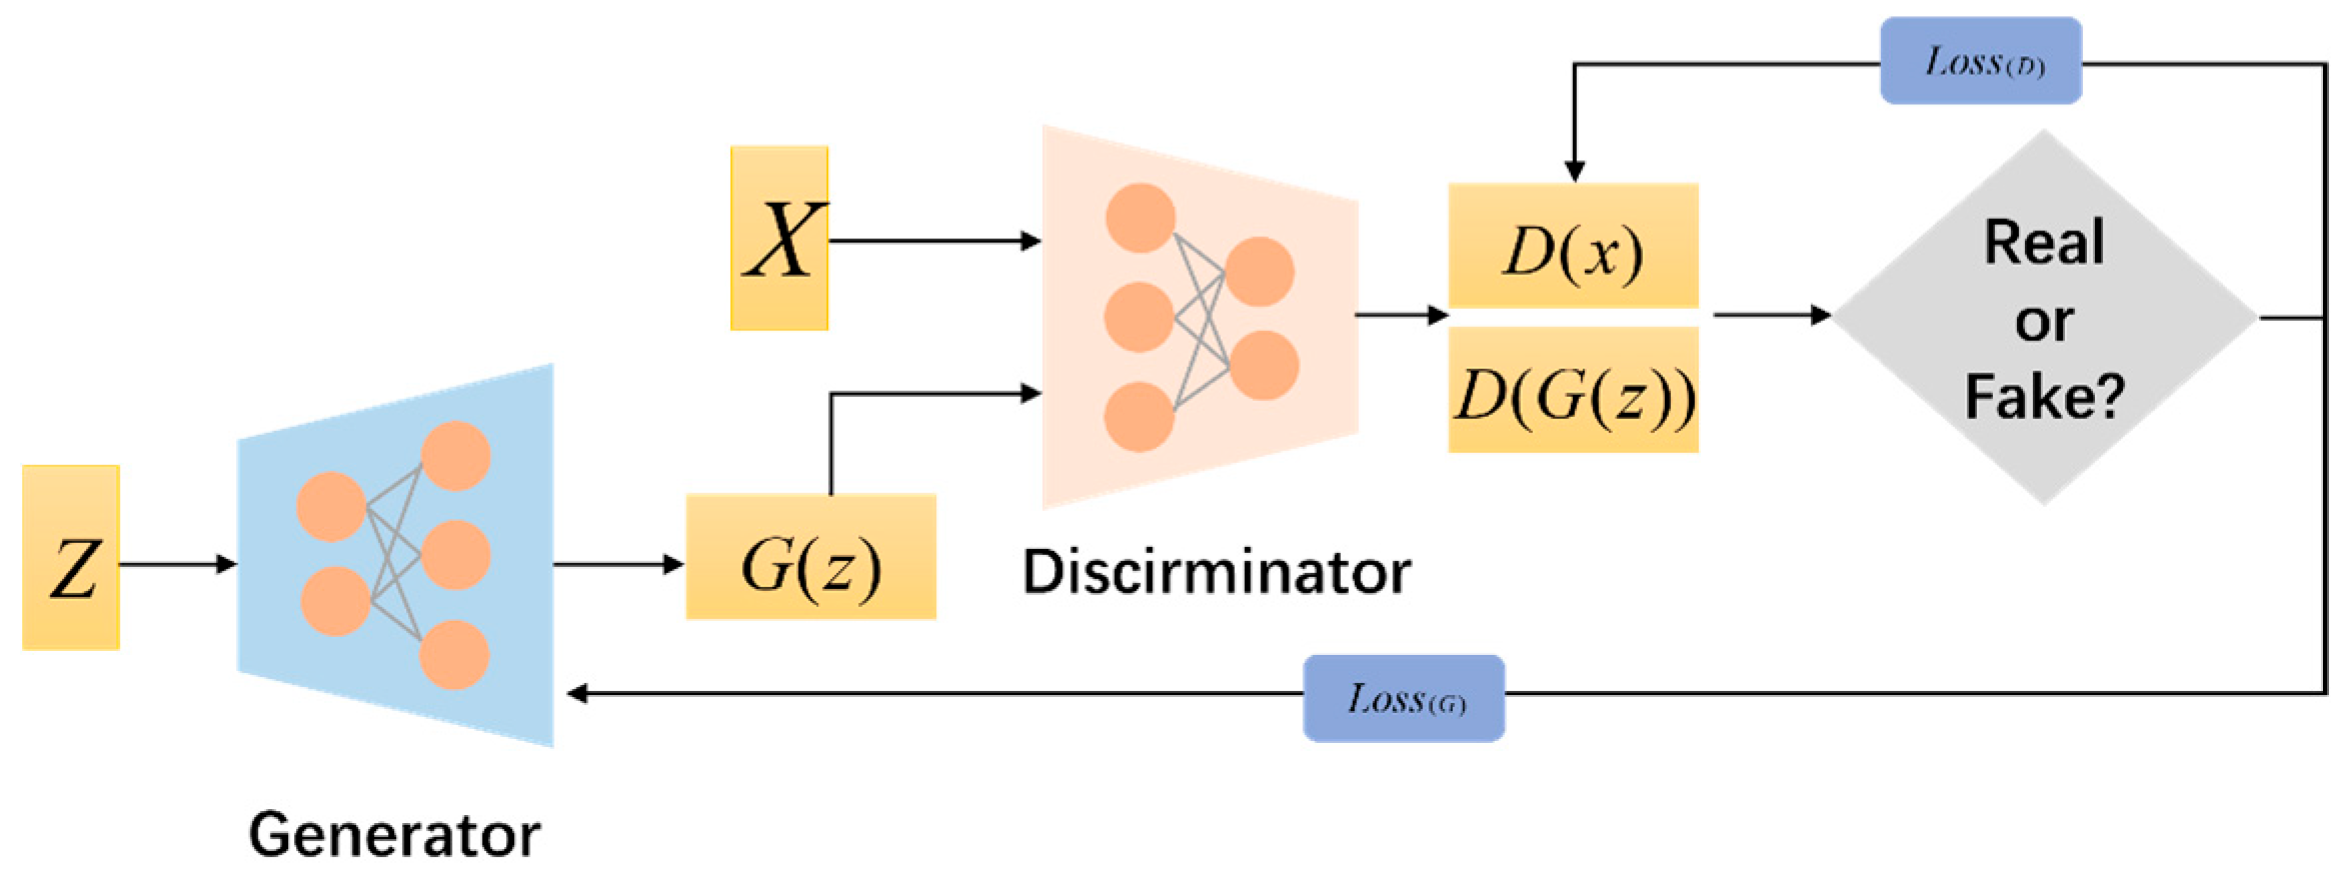
In a GAN (see Figure 2), introduced by McDermott et al. [33], the generator maps random noise Z into data samples, while the discriminator evaluates whether a given sample is real or generated. These components engage in an adversarial training process, forming a minimax game. The objective function is defined as
m i n G m a x D L adv = E x ~ p r [ D ( x ) ] E z ~ p g [ D ( G ( z ) ) ]
where p r denotes the distribution of real data X , while p g represents the distribution of the latent variable Z .

3.3. Wasserstein GAN (WGAN)

To address mode collapse and vanishing gradient issues in GANs, the Wasserstein GAN (WGAN) [34] introduced the Wasserstein distance, significantly improving training stability. Later, Gulrajani et al. [35] proposed WGAN-GP, which replaced weight clipping with Gradient Penalty (GP) to further optimize the training process. Its loss function is expressed as
L WGAN - GP = L adv + L GP       = E z ~ p g [ D ( G ( z ) ) ] E x ~ p r [ D ( x ) ] + λ E x ^ ~ Ω D ( x ^ ) p 1 2
where D ( x ^ ) p is the gradient of the discriminator and λ is the penalty weight.

3.4. Auxiliary Classifier GAN (ACGAN)

While standard GANs generate samples by mapping random noise to data space, they typically lack content control. To address this limitation, the Conditional GAN (CGAN) [36] introduces a method that incorporates conditional information (e.g., class labels) into the generator and discriminator. This approach establishes a relationship between the data distribution and the given conditions, enabling targeted sample generation.
ACGAN [37] extends this approach through an auxiliary classifier in the discriminator (see Figure 3), enabling simultaneous sample authenticity verification and category prediction. This dual-task design forces the generator to optimize both realism and class consistency, achieved via a joint loss combining adversarial loss and classification loss.
L S = E [ l o g P ( S = r e a l X ) ] + E [ l o g P ( S = f a k e G ( z ) ) ]
L C = E [ l o g P ( C = c X ) ] + E [ l o g P ( C = c G ( z ) ) ]

4. Methods

The proposed M2M-VAEGAN-IDS architecture is shown in Figure 4. It is briefly divided into three modules: (1) data preprocessing, (2) pre-training and fine-tuning, and (3) postprocessing with CNN classification.

4.1. Data Preprocessing

4.1.1. Data Classification

Different datasets require specific preprocessing methods. Specifically, for the CIC-IDS2017 dataset, the data are divided into five files representing five days of real network traffic. First, these files were combined into a single dataset. Then, we observed that the combined dataset contained a significant amount of “NaN” and “Infinity” values, which were consequently removed. Furthermore, due to the large size of CIC-IDS2017, we ultimately randomly sampled 10% of the data for our experiments.
For the NSL-KDD dataset, the data were categorized into five classes—‘Normal’, ‘DoS’, ‘Probe’, ‘U2R’, and ‘R2L’—based on the “Class” labels provided. The detailed distribution is shown in Table 1.
According to the number of categories, the NSL-KDD and CIC-IDS2017 datasets are divided into majority classes and minority classes. The distribution of these datasets is shown in Tables 5 and 6. Specifically, in NSL-KDD, the U2R and R2L categories, and in CIC-IDS2017, the categories accounting for less than 1%, are classified as minority classes. Notably, a majority class does not include a “normal” class. The main reason is that normal traffic accounts for a large proportion in real networks. If it is included in the majority classes for pre-training, the model may tend to learn coarse-grained discrimination between normal and abnormal while ignoring fine-grained recognition of attack types. Furthermore, the amount of data from attack classes in the majority class is already sufficient for pre-training, making it unnecessary to include normal traffic.

4.1.2. Variational Gaussian Mixture

Network traffic data often exhibit complex multimodal distributions across continuous and discrete features. Traditional normalization methods, such as min–max normalization, can linearly map data to a fixed range [0,1]. However, this simple transformation significantly weakens the distribution characteristics of minority class samples. While such normalization may be adequate for downstream CNN-based classification models, it falls short for generative models. Generative models require more precise capture of the original data distribution, including its multimodal nature and the characteristics of minority class samples, to ensure the authenticity and diversity of generated data.
Therefore, the Variational Gaussian Mixture (VGM) method in CTGAN [26] can be used as a reference to model continuous features. VGM identifies and fits multiple Gaussian components in the data and uses a Gaussian Mixture Model (GMM) to represent the distribution of continuous columns. Specifically, VGM encodes each continuous value as a composite representation of its “associated mode + normalized value”.
Discrete features undergo one-hot encoding before being concatenated with VGM-processed continuous features into a unified representation. Notably, this approach retains the full parameters of the GMM for continuous columns and the encoding rules for discrete columns. During data sampling, the original data format can be accurately reconstructed using inverse transformations.
This design allows the VGM module to be independently transferable to other related tasks. Additionally, by comparing the distribution alignment between generated and real data, the model’s performance can be intuitively evaluated. The specific VGM processing for continuous columns is as follows:
  • The VGM first estimates the number of modes k for each continuous column and fits a GMM as follows: P = k = 1 2 ω k N ( μ k , σ k ) , where ω k , μ k and σ k denote the weight, mean, and standard deviation of each mode, respectively.
  • For each value in the continuous column, VGM calculates its probability density across different modes. If a continuous value has two potential modes with probability densities ρ 1 and ρ 2 , and ρ 1 > ρ 2 , VGM selects the mode with the higher probability, and retrieves its weight, mean, and standard deviation.
  • When normalizing and encoding the continuous value τ , the mean and standard deviation of the selected mode m are scaled as follows: α = τ μ m 4 σ m . Meanwhile, the associated mode is recorded using one-hot encoding as β . Finally, the continuous feature is encoded as α β , where denotes vector concatenation, providing a precise representation that serves as the foundation for subsequent data processing and analysis.

4.2. VAE-GAN

The VAE-GAN framework effectively combines the complementary strengths of VAE and GAN through joint training to optimize both data reconstruction and generation quality. As illustrated in Figure 5, the encoder integrates input data X with class labels C , projecting them into a latent space. This produces Gaussian-distributed latent variables Z x , with gradient propagation ensured via the reparameterization trick. The generator then takes either Z x or random noise Z p as input, incorporating the target label C to reconstruct samples G ( z ) that align with the original data distribution.
The discriminator, enhanced with an auxiliary classifier, employs a dual-tasdesign for fine-grained class control. In the adversarial discrimination task, it measures the distribution discrepancy between real samples X and reconstructed samples G ( z ) using Wasserstein distance. Simultaneously, the auxiliary classification task predicts the class probability distributions C ( x ) and C ( G z ) , ensuring semantic consistency in the generated outputs.

4.2.1. Encoder

The encoder (see Table 2) transforms the original input into latent space variables using a reparameterization technique. This technique addresses the issue of non-differentiable sampling in the VAE by converting the random sampling process of latent variables into a deterministic transformation. This allows gradients to bypass stochastic nodes, enabling effective backpropagation during optimization.
The encoder’s loss function mirrors that of standard VAE, comprising reconstruction loss and KL divergence, and the loss function is defined as follows:
L E = L rec + L KL = E q ( z | x ) [ log p ( x | z ) ] + D K L ( q ( z | x ) | | p ( z ) )

4.2.2. Generator

The generator (see Table 3) reconstructs the latent variables or random noise into data, which are then passed to the discriminator. Its loss function combines reconstruction loss, classification loss, and the discriminator’s evaluation of the authenticity of the generated data. The loss function is defined as follows:
L G = L rec + L C L D ( G ( z ) ) = E q ( z | x ) [ log p ( x | z ) ] + CE C G ( z ) , c E z ~ p g [ D ( G ( z ) ) ]

4.2.3. Discriminator

The discriminator (see Table 4) adopts a dual-task design. Its loss function is based on WGAN-UP, incorporating the Wasserstein distance and a gradient penalty term. This approach significantly improves the stability and effectiveness of adversarial optimization, effectively mitigating convergence fluctuations and instability that may arise during the training of the VAE-GAN model.
The loss is composed as follows:
L D = L a d v + L C + L GP
L a d v = E x ~ p r [ D ( x ) ] + E z ~ p g [ D ( G ( z ) ) ]
L C = CE C ( x ) , c + CE C ( G ( z ) ) , c
L GP = λ E x ^ ~ Ω D ( x ^ ) p 1 2

4.2.4. Training Process of VAE-GAN

During the fine-tuning and training stages, the overall approach for training VAE-GAN stays consistent, as summarized below:
  • First, the discriminator undergoes multiple rounds of training. In this process, the encoder transforms input data X and class label C into the latent variable Z x . The generator then uses Z x or random noise Z p , incorporating target label C to generate data G ( z ) . The discriminator evaluates real data X and generated data G ( z ) using Wasserstein distance with gradient penalty constraints, while the auxiliary classifier simultaneously computes the cross-entropy loss between class probability distributions C ( x ) and C ( G z ) .
  • Second, the encoder and generator are jointly trained. During this process, the input data X and class label C are used as the input for the encoder, while the generator produces the output G ( z ) . The training objective combines four key components: (1) a reconstruction loss measuring the discrepancy between original and reconstructed data, (2) the KL divergence of the encoder’s output Z x , (3) the discriminator’s evaluation score of G ( z ) , and (4) the classification loss from the auxiliary classifier’s output.
  • Finally, the steps in (1) and (2) are alternated to train the discriminator and VAE. The Adam optimizer is used until the loss value reaches a predefined threshold.

4.3. Pre-Training and Fine-Tuning

In traditional generative models like GAN, VAE, and VAEGAN, if all the data are directly used for joint training, the data of the majority class, being abundant, are likely to dominate the model training process. Meanwhile, the scarcity of the minority class data can easily lead to overfitting. Simple class balancing techniques, such as undersampling, may reduce the overall dataset size, which could hinder the model’s ability to fully learn the underlying distribution. Therefore, by adopting the concept of transfer learning, we can gradually transfer learned weights, balancing the learning of class features while reducing the risk of overfitting caused by focusing solely on a single class.
In the pre-training phase, we randomly sample 10,000 examples from the majority class to train the model initially. During this phase, the dual properties of VAE-GAN play a critical role. The VAE’s reconstruction loss guides the model to learn the overall distribution of the majority class, effectively capturing the underlying structure of the data. Meanwhile, the adversarial loss from the GAN further regularizes the latent space, enabling the generator to produce more realistic samples. Additionally, the auxiliary classification loss strengthens the model’s ability to distinguish between class features, providing extra constraints to maintain an organized latent feature space. This multi-objective optimization enables comprehensive representation learning with strong generalization capability.
In the fine-tuning phase, we introduce minority class data, enabling the model to learn and capture the unique distribution characteristics of the minority class. However, due to the limited quantity of minority class data, direct training on it can lead to overfitting, focusing only on specific features of the minority class, while potentially forgetting the distribution learned from the majority class during pre-training. To address this, we propose a balanced training strategy: we randomly sample an equal number of examples from the majority class and combine them with the minority class data for fine-tuning. This memory replay mechanism plays a key role in ensuring effective learning of the minority class features while preventing class bias during training.
Through this staged training approach, the model strengthens its understanding of the overall distribution during pre-training and refines its learning of the minority class features in the fine-tuning phase, effectively mitigating issues related to data imbalance and forgetting. This results in improved performance on imbalanced datasets.

4.4. Data Postprocessing and CNN

4.4.1. Sample Generation and Format Conversion

After fine-tuning, the trained VAE-GAN generator is used to generate new minority class samples by inputting random noise. This stochastic generation approach enhances data diversity while preventing over-reliance on the training distribution.
The generated samples initially retain their VGM-processed representation. As detailed in Section 4.1.2, the VGM models each continuous feature column with multiple Gaussian distributions, enriching data expressiveness at the cost of increased dimensionality. Since the original network intrusion dataset is large, the increase in feature dimensions makes detection more challenging. Therefore, the conversion parameters stored in Section 4.1.2 are used for continuous features (the saved Gaussian mixture model parameters are applied for inverse transformation) and for discrete features, where decoding follows the encoding mapping rules. Finally, the converted new samples are merged with the original training set to create a balanced dataset.

4.4.2. Data Postprocessing

The balanced dataset requires additional preprocessing before CNN integration:
  • Deduplication: although VAE-GAN generates new samples through random noise, the generation process may lead to duplicate samples. Therefore, a strict deduplication process is applied to ensure that each record in the generated dataset is unique.
  • Max–min normalization: since neural networks are sensitive to the distribution of input data, normalization scales features to [0,1] to accelerate convergence and reduce feature-scale disparities.
  • One-hot encoding: For categorical features, one-hot encoding converts them into binary form. The NSL-KDD dataset includes three categorical features: protocol_type, service, and flag. The service feature has 70 classes in KDDTrain+ and 64 classes in KDDTest+, causing dimensional inconsistencies. To address this, missing category columns are set to zero, ensuring consistency between the training and testing sets.

4.4.3. CNN

For classification, we use a CNN. The CNN starts by extracting features using two convolutional layers with 64 and 128 filters, each followed by a ReLU activation function and a max-pooling layer. The features are then flattened and passed through four fully connected layers with ReLU activations and dropout to prevent overfitting. Finally, a softmax function is used to predict the class labels.

5. Experiments and Analysis

In this section, we test how well M2M-VAEGAN-IDS performs. We compare it with other methods for balancing classes and some of the best intrusion detection techniques available. These comparisons help us see how effective M2M-VAEGAN-IDS really is.

5.1. Datasets

We tested how well M2M-VAEGAN-IDS works using the NSL-KDD and CIC-IDS2017 datasets.
The NSL-KDD dataset [6] contains 41 feature columns and one label column per record, capturing comprehensive network traffic characteristics across three dimensions: basic connection attributes, content-based metrics, and time-series statistics. The label column identifies each sample as either normal traffic or one of the specific attack types classified in Section 4.1.1. In the experiments, the official KDDTrain+ and KDDTest+ datasets released by NSL-KDD are used, with the original dataset split maintained for training and testing to ensure the reproducibility and fairness of the results. Table 5 shows the distribution of different attack types in the dataset.
The CIC-IDS2017 dataset [7] simulates five days of real-world network traffic and is widely used in network intrusion detection research. Each record consists of seventy-eight feature columns and one class label column, covering basic network communication attributes, statistical information, and behavioral characteristics. This provides rich data support for exploring the relationship between multidimensional features and attack behaviors. Due to the large scale of the original dataset, a 10% random sample was selected for the experiments to improve efficiency. Additionally, categories with very few samples were removed to reduce the negative impact of sparse data on model training while ensuring data quality. After preprocessing, the sample distribution is shown in Table 6. The dataset was divided into training and testing sets at a 7:3 ratio to ensure the scientific and reasonable evaluation of model performance.

5.2. Evaluation Metrics

In this experiment, we use Accuracy, Precision, Recall, F1-score, and G-mean to see how well M2M-VAEGAN-IDS performs overall.
Accuracy = T P + T N T P + T N + F P + F N
P r e c i s i o n = T P T P + F P
R e c a l l = T P T P + F N
F 1 = 2 × P r e c i s i o n × R e c a l l P r e c i s i o n + R e c a l l = 2 × T P 2 × T P + F P + F N
G m e a n s = T P T P + F N × T N T N + F P

5.3. Experimental Setup and Parameters

All experiments were conducted on a Windows 11 laptop (Microsoft, Redmond, WA, USA) with a 13th Gen Intel(R) Core(TM) i9-13900H processor (Intel Corporation, Santa Clara, CA, USA), NVIDIA GeForce RTX 4060 Laptop GPU (NVIDIA Corporation, Santa Clara, CA, USA), and 32GB of RAM. Python 3.10 was used, along with TensorFlow 2.15.0 and PyTorch 2.4.0 for deep learning, NumPy 1.26.4 and Pandas 2.2.3 for data processing, Scikit-learn 1.6.1 for machine learning, and Matplotlib 3.10.1 and Seaborn 0.13.2 for visualization. The model parameters are listed in Table 7.

5.4. Experimental Details

5.4.1. Performance of Different Generative Models at Different Scales

This study reproduces SMOTE, CTGAN, and CTABGAN under consistent experimental conditions, including the same dataset, preprocessing steps, and detection model, and compares them with the proposed M2M-VAEGAN on a CNN-based multi-classification task. Four generation strategies were explored, generating 10,000, 5000, 2000/5000, and 1000/3000 samples for the U2R and R2L classes, respectively, to systematically evaluate the impact of sample size on model performance. Table 8, Table 9, Table 10 and Table 11 present the performance of each model at different sample sizes, and Table 12 summarizes the best results, offering a clear comparison of overall performance. Key metrics such as recall, F1-score, and G-means highlight the effectiveness of the generation models in enhancing the detection of minority classes within the CNN framework.
In Table 8, SMOTE achieves its best performance across all metrics—Precision, Recall, F1-score, G-means, and Accuracy—when generating 5000 samples for both U2R and R2L. However, increasing the sample size to 10,000 results in a notable decline, with F1-score dropping by 2.3%, indicating that the linear interpolation mechanism is sensitive to noise. Conversely, generating fewer samples (e.g., U2R: 2000) leads to reduced performance due to insufficient data coverage.
In Table 9, CTGAN achieves a Precision of 86.02% at Both-10,000, but Recall is limited to 80.68%. This suggests that while the generated samples improve detection precision, the model struggles to effectively generate minority class samples. When the generation ratio is balanced at U2R:2000 and R2L:5000, G-means increases to 84.96%, highlighting the importance of maintaining a balanced generation strategy.
In Table 10, CTABGAN enhances CTGAN by incorporating a semantic classifier. The model achieves the best overall performance under the Both-5000 setting, with the highest G-means of 85.36% and F1-score of 81.14%. Although the semantic classifier helps to mitigate generation drift, generating excessive samples at the Both-10,000 setting results in a decline in the F1-score to 80.00%.
Table 11 shows that M2M-VAEGAN achieves its highest Precision of 83.31% and F1-score of 82.40% under the U2R 1000 and R2L 3000 settings. The model also demonstrates strong performance in G-means at 85.96% and Accuracy at 82.93%. Variations in the number of generated samples have minimal impact on performance, with F1-score fluctuations remaining below 0.4%. The model effectively combines its cross-category generation strategy with the VGM module to integrate majority-class knowledge while preserving the multimodal distribution of minority classes.
Table 12 provides a clear comparison of the overall performance of different generation models at their optimal sampling levels. M2M-VAEGAN-IDS demonstrates the best overall performance, achieving the highest Recall at 82.93%, F1-score at 82.40%, and G-means at 85.96%, making it well-suited for scenarios requiring balanced detection of majority and minority classes. CTGAN stands out in precision, with a Precision of 86.02%, making it a suitable choice for tasks sensitive to false positives, though its capability for minority class detection is limited. SMOTE and CTABGAN deliver moderate performance but significantly outperform the baseline CNN. This comparative analysis highlights the applicability of generation models in different contexts: CTGAN is preferable for high-precision needs, while M2M-VAEGAN is the optimal choice for balanced performance. Additionally, the study explores the complex relationship between the number of generated samples and model performance across different generation models.
To maintain brevity, Table 13 presents the results of different generation models at their optimal sampling levels on the CIC-IDS2017 dataset.
SMOTE showed a slight improvement in precision at 98.94% when generating 20,000 samples, while maintaining a high F1-score at 98.89% and recall at 98.87%. This indicates that SMOTE is effective in balancing class distribution. However, increasing the sample size further yielded limited performance gains, showing no significant improvement overall.
CTGAN performed less effectively on CIC-IDS2017 compared to NSL-KDD. With 10,000 generated samples, it achieved a precision of 98.41%, but recall slightly declined, and G-means dropped significantly to 97.10%.
CTABGA achieved its best results with 15,000 generated samples, where precision and recall were comparable to the CNN baseline at 98.88% and 98.85%, respectively, with a minor increase in G-means to 98.68%. However, the overall improvement remained modest.
M2M-VAEGAN demonstrated outstanding performance with 10,000 generated samples, achieving Precision, Recall, and F1-score of 99.46% and a G-means of 99.54%. These results highlight M2M-VAEGAN’s ability to generate high-quality balanced samples, effectively aligning the minority class distribution with the real data and significantly improving overall model performance.
The performance differences of generative models between the smaller-scale NSL-KDD dataset with 41 features and the larger-scale CIC-IDS2017 dataset with 78 features highlight their varying adaptability to high-dimensional data. SMOTE, which relies on linear interpolation, struggles to capture the complex class distributions in CIC-IDS2017, resulting in limited performance improvements. CTGAN and CTABGAN, faced with the eight attack classes in CIC-IDS2017, require more robust conditional constraints, leading to less pronounced effectiveness compared to their performance on NSL-KDD. While the semantic classifier in CTABGAN enhances generative performance, its impact on CIC-IDS2017 remains limited.
In contrast, M2M-VAEGAN’s cross-class generation mechanism effectively incorporates majority-class features, significantly improving the diversity and realism of minority class samples. This enhances the classifier’s ability to recognize minority classes. Furthermore, the combination of VAE and GAN not only preserves sample diversity but also optimizes sample quality through ACGAN, thereby delivering superior performance.

5.4.2. Ablation Experiment

This study includes ablation experiments to evaluate the contribution of key components in the M2M-VAEGAN model, including the pre-training–fine-tuning strategy (P&F), auxiliary classifier (AC), and VGM. Table 14 and Table 15 present the performance comparisons on the NSL-KDD and CIC-IDS2017 datasets, respectively.
In the NSL-KDD dataset, incorporating the P&F-VAEGAN model improved the F1-score by 1.22%, with Recall reaching 78.92%, indicating that pre-training and finetuning contribute to generating more accurate minority class samples. Adding the auxiliary classifier (P&F-VAEGAN-AC) further increased Recall to 79.66% and significantly boosted the G-means to 83.37%, highlighting the classifier’s importance in minority class recognition. The VGM-P&F-VAEGAN model showed limited gains in low-dimensional feature scenarios, with an F1-score of 78.77%, suggesting a lower need for complex distribution modeling. Ultimately, the combined model integrating VGM, P&F-VAEGAN, and the auxiliary classifier (VGM-P&F-VAEGAN-AC) achieved the best performance, significantly enhancing G-means and overall effectiveness.
In the CIC-IDS2017 dataset, P&F-VAEGAN improved both precision and recall, demonstrating its effectiveness in generating balanced samples. Adding the auxiliary classifier (P&F-VAEGAN-AC) boosted G-means to 99.44%, emphasizing the classifier’s crucial role in maintaining semantic consistency for high-dimensional features. Although VGM preprocessing improved precision and recall, it led to a decrease in G-means, indicating that the complexity of high-dimensional data requires additional balancing methods. Ultimately, the VGM-P&F-VAEGAN-AC model achieved the best performance, further enhancing the model’s ability to address class imbalance.
The improvement from CNN to P&F-VAEGAN demonstrates that the generative model effectively mitigates class imbalance issues. With the addition of the auxiliary classifier, recall and F1-score were significantly enhanced, improving the model’s ability to identify minority class samples. VGM preprocessing improved model performance in some cases, but it also had some impact on balancing precision and recall. Ultimately, the combination of all modules greatly boosted the model’s performance across both datasets, particularly in addressing class imbalance, and significantly enhanced the model’s generalization ability and overall performance.

5.4.3. Model Complexity

In the comparison of generative models, model complexity directly impacts computational resource consumption and runtime efficiency. Since SMOTE is not a neural network model, it is not included in this comparison. We focus on comparing three generative models: CTGAN, CTABGAN, and M2M-VAEGAN, and concentrate solely on the complexity of the generative models, excluding the computational cost of subsequent classification tasks. The complexity is typically measured by two indicators: (1) FLOPs, which represent the computational complexity of a single forward pass, reflecting the demand on hardware resources; (2) the number of parameters, which indicates the total number of trainable parameters in the model, reflecting the storage complexity and the risk of overfitting. The experimental results are shown in the Table 16.
The discriminator and generator of CTGAN consist of fully connected layers, with the layer dimensions of both the generator and discriminator fixed, regardless of the input feature dimensions. As a result, the number of parameters and FLOPs remain consistent across both high-dimensional and low-dimensional datasets. The CTABGAN model converts tabular data into images, causing FLOPs to increase quadratically with input dimensions. For NSL-KDD, with one-hot encoding resulting in 123 dimensions, FLOPs reach approximately 6.0 G, while for CIC-IDS2017, with 78 input dimensions, FLOPs drop to around 3.1G. In M2M-VAEGAN, the model structure consists of 1D convolution and fully connected layers, and its complexity is linearly related to the input dimensions. For NSL-KDD, the model has 5.2 M parameters and 18M FLOPs. For CIC-IDS2017, the parameters decrease to 3.3 M (a 37% reduction) and FLOPs to 10 M (a 44% reduction).
Thus, CTGAN is suitable for high-dimensional data and resource-limited scenarios. CTABGAN is more appropriate for low-dimensional data, particularly in tasks where high generation quality is required. M2M-VAEGAN strikes a good balance between complexity and performance and performs excellently in comparison experiments. Furthermore, if training a generative model is not required, the traditional SMOTE method remains the preferred choice.

5.4.4. Comprehensive Evaluation Compared with Other IDS

In the comparison with other IDS models (see Section 2.1), we used the NSL-KDD and CIC-IDS2017 datasets and referenced performance metrics reported in the related literature to produce the experimental results shown in Table 17 and Table 18. All compared methods employed data augmentation techniques to improve intrusion detection performance, ensuring consistency in the technical background and research objectives of the experiments. Additionally, we consistently adopted Precision, Recall, F1-score, and Accuracy as evaluation metrics and carefully selected studies with detailed experimental setups and well-documented data sources to ensure the credibility and comparability of the results.
In Table 16, the performance of M2M-VAEGAN-IDS on the NSL-KDD dataset is well-balanced, with Recall of 82.93% and F1-score of 82.40%, significantly outperforming other models. This indicates that it demonstrates a balanced classification ability for both majority and minority classes. In comparison to KGMS-IDS, although KGMS-IDS has a higher Accuracy of 86.39%, its Recall of 70.22% and F1-score of 71.49% are lower, suggesting that the model may be overly biased toward the majority class. The F1-score of KGMS-IDS is higher than that of our model, but its Recall is noticeably lower, indicating that its overall performance is not sufficient to handle complex class imbalance tasks. This suggests that M2M-VAEGAN-IDS still has room for improvement.
In the CIC-IDS2017 dataset, M2M-VAEGAN-IDS stands out with an Accuracy of 99.46%, Recall of 99.45%, and F1-score of 99.45%, outperforming all the other models and demonstrating exceptional overall performance. Transformer-CNN shows slightly lower Accuracy of 99.22% and Recall of 99.13%, indicating that its generated data quality is somewhat insufficient. However, it still performs better than other models.
6. Conclusions

To address the class imbalance issue in network intrusion detection, this paper introduces a cross-class generation model based on VAE-GAN, called M2M-VAEGAN-IDS. Our approach incorporates a VGM model to effectively preserve the multimodal distribution of continuous features. By integrating a transfer learning strategy, the model learns general attack patterns during majority-class pre-training and combines majority and minority class samples during balanced fine-tuning, significantly reducing the model’s tendency to overfit the minority class. Furthermore, an auxiliary classifier is embedded within the VAE-GAN framework and joint optimization of adversarial and classification losses enhances the quality of synthesized multi-type attack data.
In experiments on the NSL-KDD and CIC-IDS2017, M2M-VAEGAN is compared with various generative models across different sampling levels, revealing the complex relationship between sample size and model performance. The adaptability of different models in various scenarios is also explored. Ablation experiments further validate the collaborative improvement in model performance through the VGM module, auxiliary classifier, and transfer learning strategy. These results demonstrate that M2M-VAEGAN effectively balances class distribution and provides a new approach for anomaly detection in real-world network environments. While M2M-VAEGAN performs excellently on static datasets, its application in dynamic network environments requires further exploration.

Author Contributions

Conceptualization, F.K. and T.F.; methodology, F.K.; software, F.K.; validation, F.K., formal analysis, F.K.; data curation, F.K.; writing—original draft preparation, F.K.; writing—review and editing, T.F. and J.L.; funding acquisition, T.F. All authors have read and agreed to the published version of the manuscript.

Funding

This research received no external funding.

Data Availability Statement

NSL-KDD dataset: https://www.unb.ca/cic/datasets/nsl.html (accessed on 13 May 2025). CIC-IDS2017 dataset: https://www.unb.ca/cic/datasets/ ids-2017.html (accessed on 13 May 2025).

Conflicts of Interest

The authors declare no conflicts of interest.

Abbreviations

The following abbreviations are used in this manuscript:
IDSIntrusion Detection System
VAE-GANVariational Autoencoder and Generative Adversarial Network
VGMVariational Gaussian Mixture
GMMGaussian Mixture Model
CNNConvolutional Neural Networks
SMOTESynthetic Minority Oversampling Technique
RUSRandom Under-Sampling
WGANWasserstein Generative Adversarial Network
WGAN-GPWasserstein Generative Adversarial Network with Unrolled Optimization
VAEVariational Autoencoder
GANGenerative Adversarial Network
LSTMLong Short-Term Memory
ENNEdited Nearest Neighbor
ADASYNAdaptive Synthetic Sampling
CTGANConditional Tabular Generative Adversarial Network
CTABGANConditional Table Generative Adversarial Network

References

  1. Mukherjee, B.; Heberlein, L.T.; Levitt, K.N. Network Intrusion Detection. IEEE Netw. 1994, 8, 26–41. [Google Scholar] [CrossRef]
  2. Ahmad, Z.; Shahid Khan, A.; Wai Shiang, C.; Abdullah, J.; Ahmad, F. Network Intrusion Detection System: A Systematic Study of Machine Learning and Deep Learning Approaches. Trans. Emerg. Telecommun. Technol. 2021, 32, e4150. [Google Scholar] [CrossRef]
  3. Najafabadi, M.M.; Villanustre, F.; Khoshgoftaar, T.M.; Seliya, N.; Wald, R.; Muharemagic, E. Deep Learning Applications and Challenges in Big Data Analytics. J. Big Data 2015, 2, 1. [Google Scholar] [CrossRef]
  4. Radford, A.; Narasimhan, K.; Salimans, T.; Sutskever, I. Improving Language Understanding by Generative Pre-Training. 2018. Available online: https://api.semanticscholar.org/CorpusID:49313245 (accessed on 5 May 2025).
  5. Larsen, A.B.L.; Sønderby, S.K.; Larochelle, H.; Winther, O. Autoencoding Beyond Pixels Using a Learned Similarity Metric. In Proceedings of the 33rd International Conference on Machine Learning, New York City, NY, USA, 19–24 June 2016. [Google Scholar]
  6. Tavallaee, M.; Bagheri, E.; Lu, W.; Ghorbani, A.A. A Detailed Analysis of the KDD CUP 99 Data set. In Proceedings of the 2009 IEEE Symposium on Computational Intelligence for Security and Defense Applications, Ottawa, ON, Canada, 8–10 July 2009; IEEE: Ottawa, ON, Canada, 2009; pp. 1–6. [Google Scholar]
  7. Sharafaldin, I.; Habibi Lashkari, A.; Ghorbani, A.A. Toward Generating a New Intrusion Detection Dataset and Intrusion Traffic Characterization. In Proceedings of the 4th International Conference on Information Systems Security and Privacy, Funchal, Portugal, 22–24 January 2018; SCITEPRESS—Science and Technology Publications: Funchal, Madeira, Portugal, 2018; pp. 108–116. [Google Scholar]
  8. Lecun, Y.; Bottou, L.; Bengio, Y.; Haffner, P. Gradient-Based Learning Applied to Document Recognition. Proc. IEEE 1998, 86, 2278–2324. [Google Scholar] [CrossRef]
  9. Mohammadpour, L.; Ling, T.C.; Liew, C.S.; Aryanfar, A. A Survey of CNN-Based Network Intrusion Detection. Appl. Sci. 2022, 12, 8162. [Google Scholar] [CrossRef]
  10. Liao, H.-J.; Richard Lin, C.-H.; Lin, Y.-C.; Tung, K.-Y. Intrusion Detection System: A Comprehensive Review. J. Netw. Comput. Appl. 2013, 36, 16–24. [Google Scholar] [CrossRef]
  11. Yang, Y.; Gu, Y.; Yan, Y. Machine Learning-Based Intrusion Detection for Rare-Class Network Attacks. Electronics 2023, 12, 3911. [Google Scholar] [CrossRef]
  12. Ahsan, R.; Shi, W.; Corriveau, J. Network Intrusion Detection Using Machine Learning Approaches: Addressing Data Imbalance. IET Cyber-Phys. Syst. Theory Appl. 2022, 7, 30–39. [Google Scholar] [CrossRef]
  13. Gu, Y.; Yang, Y.; Yan, Y.; Shen, F.; Gao, M. Learning-based intrusion detection for high-dimensional imbalanced traffic. Comput. Commun. 2023, 212, 366–376. [Google Scholar] [CrossRef]
  14. Shang, W.; Huang, Z.; Gu, Z.; Cao, Z.; Ding, L.; Wang, S. CWMAGAN-GP-Based Oversampling Technique for Intrusion Detection. In Advanced Intelligent Computing Technology and Applications; Huang, D.-S., Chen, W., Pan, Y., Eds.; Lecture Notes in Computer Science; Springer Nature: Singapore, 2024; Volume 14869, pp. 318–330. ISBN 978-981-9756-02-5. [Google Scholar]
  15. Hu, X.; Meng, X.; Liu, S.; Liang, L. An Improved Algorithm for Network Intrusion Detection Based on Deep Residual Networks. IEEE Access 2024, 12, 66432–66441. [Google Scholar] [CrossRef]
  16. Rao, Y.N.; Suresh Babu, K. An Imbalanced Generative Adversarial Network-Based Approach for Network Intrusion Detection in an Imbalanced Dataset. Sensors 2023, 23, 550. [Google Scholar] [CrossRef] [PubMed]
  17. Yun, X.; Xie, J.; Li, S.; Zhang, Y.; Sun, P. Detecting Unknown HTTP-Based Malicious Communication Behavior via Generated Adversarial Flows and Hierarchical Traffic Features. Comput. Secur. 2022, 121, 102834. [Google Scholar] [CrossRef]
  18. Kamal, H.; Mashaly, M. Advanced Hybrid Transformer-CNN Deep Learning Model for Effective Intrusion Detection Systems with Class Imbalance Mitigation Using Resampling Techniques. Future Internet 2024, 16, 481. [Google Scholar] [CrossRef]
  19. Ali, A.; Shamsuddin, S.M.; Ralescu, A.L. Classification with Class Imbalance Problem: A Review. Int. J. Adv. Soft Comput. Appl. 2013, 5, 176–204. [Google Scholar]
  20. Ling, C.X.; Sheng, V.S. Cost-Sensitive Learning and the Class Imbalance Problem. Encycl. Mach. Learn. 2008, 2011, 231–235. [Google Scholar]
  21. Wonji, L. Instance Categorization by Support Vector Machines to Adjust Weights in AdaBoost for Imbalanced Data Classification. Inf. Sci. 2017, 381, 92–103. [Google Scholar]
  22. Liu, B.; Tsoumakas, G. Dealing with Class Imbalance in Classifier Chains via Random Undersampling. Knowl.-Based Syst. 2020, 192, 105292. [Google Scholar] [CrossRef]
  23. Salehpour, A.; Norouzi, M.; Balafar, M.A.; SamadZamini, K. A Cloud-Based Hybrid Intrusion Detection Framework Using XGBoost and ADASYN-Augmented Random Forest for IoMT. IET Commun. 2024, 18, 1371–1390. [Google Scholar] [CrossRef]
  24. Blagus, R.; Lusa, L. SMOTE for High-Dimensional Class-Imbalanced Data. BMC Bioinform. 2013, 14, 106. [Google Scholar] [CrossRef]
  25. Seo, E.; Song, H.M.; Kim, H.K. GIDS: GAN based Intrusion Detection System for In-Vehicle Network. In Proceedings of the 2018 16th Annual Conference on Privacy, Security and Trust (PST), Belfast, Ireland, 28–30 August 2018; IEEE: Belfast, Ireland, 2018; pp. 1–6. [Google Scholar]
  26. Xu, L.; Skoularidou, M.; Cuesta-Infante, A.; Veeramachaneni, K. Modeling Tabular data using Conditional GAN 2019. arXiv 2019. [Google Scholar] [CrossRef]
  27. Zhao, Z.; Kunar, A.; der Scheer, H.V.; Birke, R.; Chen, L.Y. CTAB-GAN: Effective Table Data Synthesizing 2021. arXiv 2019. [Google Scholar] [CrossRef]
  28. Liu, C.; Antypenko, R.; Sushko, I.; Zakharchenko, O. Intrusion Detection System After Data Augmentation Schemes Based on the VAE and CVAE. IEEE Trans. Reliab. 2022, 71, 1000–1010. [Google Scholar] [CrossRef]
  29. Tian, W.; Shen, Y.; Guo, N.; Yuan, J.; Yang, Y. VAE-WACGAN: An Improved Data Augmentation Method Based on VAEGAN for Intrusion Detection. Sensors 2024, 24, 6035. [Google Scholar] [CrossRef] [PubMed]
  30. Kingma, D.P.; Welling, M. Auto-Encoding Variational Bayes 2022. arXiv 2022. [Google Scholar] [CrossRef]
  31. Van Erven, T.; Harremoes, P. Rényi Divergence and Kullback-Leibler Divergence. IEEE Trans. Inf. Theory 2014, 60, 3797–3820. [Google Scholar] [CrossRef]
  32. Chicco, D.; Warrens, M.J.; Jurman, G. The Coefficient of Determination R-Squared Is More Informative Than SMAPE, MAE, MAPE, MSE and RMSE in Regression Analysis Evaluation. PeerJ Comput. Sci. 2021, 7, e623. [Google Scholar] [CrossRef]
  33. Goodfellow, I.; Pouget-Abadie, J.; Mirza, M.; Xu, B.; Warde-Farley, D.; Ozair, S.; Courville, A.; Bengio, Y. Generative adversarial networks. Commun. ACM 2020, 63, 139–144. [Google Scholar] [CrossRef]
  34. Arjovsky, M.; Chintala, S.; Bottou, L. Wasserstein Generative Adversarial Networks. In Proceedings of the 34th International Conference on Machine Learning, Sydney, Australia, 6–11 August 2017. [Google Scholar]
  35. Gulrajani, I.; Ahmed, F.; Arjovsky, M.; Dumoulin, V.; Courville, A.C. Improved Training of Wasserstein GANs. Adv. Neural Inf. Process. Syst. 2017, 30. [Google Scholar]
  36. Mirza, M.; Osindero, S. Conditional Generative Adversarial Nets 2014. arXiv 2014. [Google Scholar] [CrossRef]
  37. Odena, A.; Olah, C.; Shlens, J. Conditional Image Synthesis with Auxiliary Classifier GANs. In Proceedings of the 34th International Conference on Machine Learning, Sydney, Australia, 6–11 August 2017. [Google Scholar]
Figure 1. VAE model architecture.
Electronics 14 02103 g001
Figure 2. GAN model architecture.
Electronics 14 02103 g002
Figure 3. ACGAN model architecture.
Electronics 14 02103 g003
Figure 4. M2M-VAEGAN-IDS model architecture.
Electronics 14 02103 g004
Figure 5. VAEGAN model architecture.
Electronics 14 02103 g005
Table 1. Classification table of attack types in NSL-KDD.
TypeClass
DoSmailbomb, back, land, neptune, pod, smurf, teardrop, apache2, udpstorm, processtable
Probeipsweep, satan, nmap, portsweep, mscan, saint
U2Rbuffer_overflow, loadmodule, httptunnel, rootkit, perl, sqlattack, xterm, ps
R2Lguess_passwd, ftp_write, imap, phf, multihop, warezmaster, warezclient, spy, xlock, xsnoop, snmpguess, snmpgetattack, sendmail, named, worm
Table 2. Network structure of encoder.
ModelLayerFiltersKernel SizeOutput ShapeActivation
EncoderInput--[B, 1, dimensions]-
Conv1d323[B, 32, dimensions]Relu
Conv1d643[B, 64, dimensions]Relu
Flatten--[B, 64 * dimensions]-
Linear--[B, 256]Relu
Linear--[B, 128]-
Linear--[B, 128]-
- represents no data. * represents the multiplication operation, subsequent tables also follow this rule.
Table 3. Network structure of generator.
ModelLayerFiltersKernel SizeOutput ShapeActivation
GeneratorInput--[B, 128]-
Linear--[B, 64 * dimensions]Relu
Unflatten--[B, 64, dimensions]-
ConvTranspose1d643[B, 64, dimensions]Relu
ConvTranspose1d323[B, 32, dimensions]Relu
ConvTranspose1d11[B, 1, dimensions]-
Table 4. Network structure of discriminator.
ModelLayerFiltersKernel SizeOutput ShapeActivation
Discriminator common layersInput--[B, 128]-
Conv1d323[B, 32, dimensions]Relu
Conv1d643[B, 64, dimensions]Relu
Flatten--[B, 64 * dimensions]-
Linear--[B, 512]Relu
Adversarial DiscriminativeLinear--[B, 1]Relu
Auxiliary classificationLinear--[B, N]Relu
Table 5. Sample distribution of NSL-KDD.
ClassKDDTrain+KDDTest+Total Percentage
Normal67,343971151.89%
DoS45,927745835.95%
Probe11,65624219.48%
R2L99527542.52%
U2R522000.17%
Sum125,97322,544100%
Table 6. Sample distribution of CIC-IDS2017.
ClassTraining SetTesting SetTotal Percentage
BENIGN476,864204,58381.04%
DoS Hulk48,54020,6878.23%
PortScan33,50414,3905.69%
DDoS26,88811,4134.55%
DoS GoldenEye21799200.37%
FTP-Patator17017210.29%
SSH-Patator12505260.21%
DoS slowloris12365110.21%
DoS Slowhttptest11115100.19%
Sum593,273254,261100%
Table 7. Parameters of M2M-VAEGAN-IDS.
ModuleParameter Settings
Pre-train
Model
B a t c h S i z e 0 = 300
E p o c h 0 = 500
L r e n c o d e r = 0.00001
L r d e c o d e r = 0.00001
L r d i s c r i m i n a t o r = 0.00001
Fine-tuning
Model
B a t c h S i z e 1 = 250
E p o c h 1 = 100
L r e n c o d e r = 0.00001
L r d e c o d e r = 0.00001
L r d i s c r i m i n a t o r = 0.00001
CNN B a t c h S i z e 2 = 64/128
E p o c h 2 = 30
L r c n n = 0.001
Table 8. Effect of SMOTE sampling on NSL-KDD performance.
SMOTEBoth 10,000Both 5000U2R: 2000
R2L: 5000
U2R: 1000
R2l: 3000
Precision80.61%82.66%79.69%78.33%
Recall79.42%81.54%78.25%77.84%
F1-score78.85%81.15%77.31%76.48%
G-means83.15%85.12%81.77%81.08%
Accuracy79.42%81.54%78.25%77.84%
Bold indicates optimal values; subsequent tables follow the same rule.
Table 9. Effect of CTGAN sampling on NSL-KDD performance.
CTGANBoth 10,000Both 5000U2R: 2000
R2L: 5000
U2R: 1000
R2l: 3000
Precision86.02%85.90%81.01%80.28%
Recall80.68%80.59%80.58%80.78%
F1-score82.01%81.77%80.42%80.05%
G-means80.68%84.95%84.96%84.65%
Accuracy85.28%80.59%80.58%80.78%
Table 10. Effect of CTABGAN sampling on NSL-KDD performance.
CTABGANBoth 10,000Both 5000U2R: 2000
R2L: 5000
U2R: 1000
R2l: 3000
Precision83.40%82.29%77.13%81.54%
Recall80.47%81.62%77.17%80.20%
F1-score80.00%81.14%76.38%79.37%
G-means83.51%85.36%81.88%83.37%
Accuracy80.47%81.62%77.17%80.20%
Table 11. Effect of M2M-VAEGAN sampling on NSL-KDD performance.
M2M-VAEGANBoth 10,000Both 5000U2R: 2000
R2L: 5000
U2R: 1000
R2l: 3000
Precision80.04%80.16%81.25%83.31%
Recall79.10%79.13%80.82%82.93%
F1-score78.26%78.24%80.01%82.40%
G-means83.28%82.72%84.27%85.96%
Accuracy79.10%79.13%80.82%82.93%
Table 12. Performance of different generative models at optimal sampling sizes on NSL-KDD.
ModelNumberPrecisionRecallF1-ScoreG-MeansAccuracy
CNN-79.93%77.78%75.98%80.53%77.78%
SMOTEBoth 500082.66%81.54%81.15%85.12%81.54%
CTGANBoth 10,00086.02%80.68%82.01%80.68%85.28%
CTABGANBoth 500082.29%81.62%81.14%85.36%81.62%
M2M-VAEGAN1000/300083.31%82.93%82.40%85.96%82.93%
Table 13. Performance of different generative models at optimal sampling sizes on CIC-IDS2017.
ModelNumberPrecisionRecallF1-ScoreG-MeansAccuracy
CNN-98.89%98.88%98.88%98.64%98.88%
SMOTEBoth 20,00098.94%98.87%98.89%98.97%98.87%
CTGANBoth 10,00098.41%98.39%98.39%97.10%98.39%
CTABGANBoth 15,00098.88%98.85%98.86%98.68%98.85%
M2M-VAEGANBoth 10,00099.46%99.45%99.45%99.54%99.45%
Table 14. Ablation experiment results of each module on NSL-KDD.
ModelPrecisionRecallF1-ScoreG-MeansAccuracy
CNN79.93%77.78%75.98%80.53%77.78%
P&F-VAEGAN80.05%78.92%77.20%81.69%78.92%
P&F-VAEGAN-AC80.85%79.66%78.94%83.37%79.66%
VGM-P&F-VAEGAN80.86%79.57%78.77%83.27%79.57%
VGM-P&F-VAEGAN-AC83.31%82.93%82.40%85.96%82.93%
Table 15. Ablation experiment results of each module on CIC-IDS2017.
ModelPrecisionRecallF1-ScoreG-MeansAccuracy
CNN98.89%98.88%98.88%98.64%98.88%
P&F-VAEGAN98.96%98.91%98.93%98.77%98.91%
P&F-VAEGAN-AC99.16%99.08%99.10%99.44%99.08%
VGM-P&F-VAEGAN99.23%99.23%99.21%98.16%99.23%
VGM-P&F-VAEGAN-AC99.46%99.45%99.45%99.54%99.45%
Table 16. Complexity performance of different generative models on datasets.
DatasetModelParametersFLOPs
NSL-KDDCTGAN~623,562~1.24 M
CTABGAN~1.5 M~6.0 G
M2M-VAEGAN~5.2 M18 M
CIC-IDS2017CTGAN~623,562~1.24 M
CTABGAN~1.5 M~3.1 G
M2M-VAEGAN~3.3 M~10 M
Table 17. Performance of different classification models on the NSL-KDD.
ModelPrecisionRecallF1-ScoreAccuracy
SMOTEENN [12]83.00%82.00%80.00%82.00%
KGMS-IDS [11]73.62%70.22%71.49%86.39%
DWGF-IDS [13]70.92%65.11%66.67%85.05%
CWMAGAN-UP [14]-71.31%83.74%81.80%
M2M-VAEGAN-IDS83.31%82.93%82.40%82.93%
Table 18. Performance of different classification models on the CIC-IDS2017.
ModelPrecisionRecallF1-ScoreAccuracy
HMCD [17]96.62%95.32%90.69%-
IGAN-IDS [16]-96.13-98.96%
ESSAM-DRN [15]98.52%98.33%98.34%98.12%
Transformer-CNN [18]99.22%99.13%99.16%99.13%
M2M-VAEGAN-IDS99.46%99.45%99.45%99.45%
Disclaimer/Publisher’s Note: The statements, opinions and data contained in all publications are solely those of the individual author(s) and contributor(s) and not of MDPI and/or the editor(s). MDPI and/or the editor(s) disclaim responsibility for any injury to people or property resulting from any ideas, methods, instructions or products referred to in the content.