Abstract
To overcome the limitations of characteristic parameter identification and inadequate fault recognition rates in bearings, a bearing fault diagnosis method combining the improved whale optimization algorithm (IWOA), variational mode decomposition (VMD), and kernel extreme learning machine (KELM) is proposed. Firstly, to improve the convergence behavior and global search capability of the WOA, we introduced adaptive weight, a variable spiral shape parameter, and a Cauchy neighborhood perturbation strategy to improve the performance of the original algorithm. Secondly, to enhance the effectiveness of feature extraction, the IWOA was used to optimize the number of modal components and penalty coefficients in the VMD algorithm; then, we could obtain the optimal modal components and construct feature vectors based on the optimal modal components. Next, we used the IWOA to optimize the two key parameters, the regularization coefficient C and kernel parameter γ of KELM, and the feature vector was used as the input of KELM to achieve fault diagnosis. Finally, data collected from different experimental platforms were used for experimental analysis. The results indicate that the IWOA-VMD-KELM bearing fault diagnosis model significantly improved its accuracy compared to other models, achieving accuracies of 98.8% and 98.4% on the CWRU dataset and Southeast University dataset, respectively.
1. Introduction
As one of the fundamental and critical components in modern industry, bearings are prone to varying degrees of failure due to long-term high-intensity rotational friction during operation, which may result in significant losses [1,2,3]. Consequently, the real-time condition monitoring and fault diagnosis of bearing operations have significant engineering value. Since bearing failures inevitably change the vibration signals in a motor system, detecting these signals can diagnose bearing faults [4]. To identify fault characteristics, Cao Li and colleagues [5] applied wavelet packet decomposition to analyze wind turbine bearing vibrations, enabling effective feature extraction. This method can have a certain noise reduction effect and extract effective features. Meng D.B. et al. [6] used empirical mode decomposition (EMD) to process vibration signals and filtered the intrinsic mode function through the kurtosis criterion, providing an efficient diagnostic method. However, in the above methods, the wavelet basis of the wavelet packet transform needs to be manually judged through experience, which increases the threshold for use. Empirical mode decomposition suffers from mode aliasing, which can result in unclear extracted features. Variational mode decomposition (VMD) is widely used due to its ability to effectively avoid mode overlap issues and can effectively compensate for the aforementioned shortcomings [7].
Variational mode decomposition can be used to decompose input signals into multiple IMFs, which is superior to other approaches, such as local mean decomposition (LMD), in improving mode aliasing. The whale optimization algorithm (WOA) has powerful global search capabilities and can effectively avoid solutions falling into a local optimal solution, making it widely used in deep learning hyperparameter tuning [8]. This research employs the IWOA to determine optimal VMD parameters (the decomposition mode number and quadratic penalty factor), effectively addressing its parameter selection challenge.
Due to its structural simplicity, the kernel extreme learning machine (KELM) offers higher computational efficiency and simpler implementation compared to complex deep learning approaches like the convolutional neural network (CNN) [9]. KELM adds a kernel function to extreme learning machines (ELMs), which enables it to solve nonlinear problems. Due to the mentioned advantages, KELM has been widely used in the fields of fault classification and time series prediction [10,11].
At present, owing to the progress in computational technologies, an increasing number of AI-powered diagnostic approaches for bearings have emerged [12]. Wang Xin et al. [13] proposed a bearing detection method based on multi-sensor data fusion and the one-dimensional convolutional neural network (1D-CNN). The proposed method achieved higher diagnostic accuracy than algorithms based on single modal sensors, but it was greatly affected by the sample data size and performed poorly on small sample datasets. Chen X.H.’s team [14] developed a multi-scale CNN-LSTM hybrid model that demonstrated high diagnostic accuracy but limited generalization capability. In reference [15], Liu R.J.’s team introduced an integrated VMD and particle swarm optimization technique for fault detection, but it required manual experience to identify faults in the decomposed components. In response to the shortcomings in the above research, this paper offers a new fault diagnosis model of bearing named IWOA-VMD-KELM. We used data collected from different experimental platforms for experimental analysis. The proposed model’s diagnostic performance was verified by comparing it with other diagnostic models.
2. Fundamental Principles
2.1. Variational Mode Decomposition
VMD is a signal decomposition algorithm with superior performance, which was first proposed in 2014, and has good results for the processing of nonlinear and non-stationary signals [16]. VMD decomposes the input signal into a series of intrinsic mode functions (IMF), the expression of which is the following:
where is the envelope amplitude of signal , and is the non monotonically decreasing phase function of signal .
Assuming that the frequency components contained in each mode are all around the center frequency, , Hilbert transform is performed on the modal function to obtain and modulate the analytical signal. The modulated fundamental frequency signal, , is obtained, which is expressed as follows:
The squared gradient of the baseband signal is calculated to obtain the bandwidth of each component, and obtain the expression with constraints as follows:
where represents the number of modes; represents the modal components; and represents the center frequency.
By introducing the quadratic punishment factor and the Lagrange Multiplier, the original constrained variational model can be converted into an unconstrained variational model, and the expression of the augmented Lagrange function is obtained as follows:
where is the quadratic penalty factor and is the multiplier of the Lagrange algorithm [17].
The alternative direction multiplier method and Parseval theorem are used to optimize Formula (4), and signal components are finally obtained. The number of models, and the penalty coefficient, are the key parameters of the algorithm, which are optimized by the same optimization algorithm as the KELM parameters below.
2.2. Whale Optimization Algorithm
WOA is a metaheuristic approach inspired by humpback whales’ hunting patterns; it can optimize complex optimization problems by modeling its predation behavior [18,19,20,21]. According to the hunting characteristics of whales, the WOA employs three updating strategies to its position: prey encircling, spiral foraging, and random exploration.
2.2.1. Hunting Model
Humpback whales can identify the location of their prey and form a circle around them. However, due to their unknown optimal location in the search space, the WOA will assume that the present best candidate position is the location of the target prey. After defining the target prey’s location, other whales will attempt to surround the target prey’s location. The mathematical model of this process is described as follows:
where is the current iteration count; is the present location; is the globally optimal position; and are the coefficient matrices; and the expression of and is as follows:
where and is the convergence factor, decreasing linearly from 2 to 0, and the expression of is as follows:
where is the maximum number of iterations.
2.2.2. Spiral Search
After encircling the prey with a bubble net, whales swim along a spiral shape toward the center to locate their prey, as shown in Figure 1. We formulated this process mathematically as follows:
where is a constant, usually set to 1, which controls the spiral shape; .
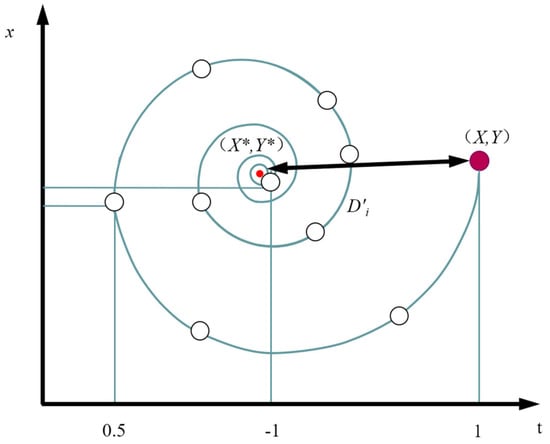
Figure 1.
Spiral updating position.
Whales also shrink their enclosures as they spiral for prey; to simulate this behavior, the encircling and spiral search would need to be synchronized. We updated the formula as follows:
where .
2.2.3. Random Search
When the variable vector , which means that the whale is outside the enclosure, the whale will adopt a new way of hunting. In this way, the whale swims in a random path, as shown in Figure 2. The expression for a random search is the following:
where is the random location of the whale.
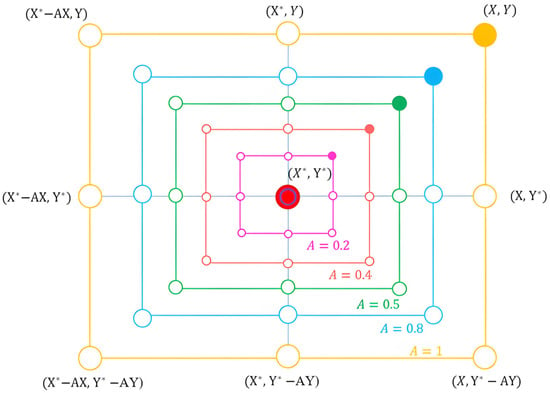
Figure 2.
The exploration mechanism implemented in WOA.
2.3. Kernel Extreme Learning Machine
ELM has an innovative training method, which only needs to adjust the weight of the output layer without repeatedly adjusting the weight of all layers like traditional neural networks; this greatly improves the training speed [22]. In essence, it is a feedforward neural network with a single hidden layer, which is mathematically described as follows:
where is the network input and is the weight between the hidden layer and the output layer. is the output matrix of the hidden layer.
In ELM, is expressed as follows:
where is the input sample flag vector matrix; is the regularization coefficient; and is the identity matrix.
Based on ELM, the kernel extreme learning machine maps the data to a high-dimensional feature space by introducing a kernel function to solve nonlinear problems, and the output is the following:
where is the kernel function.
The KELM model configuration is displayed in Figure 3.
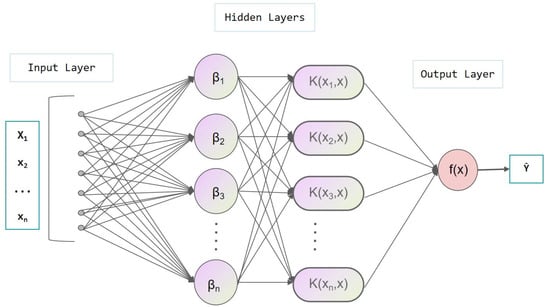
Figure 3.
The model structure of KELM.
Rodrigue et al. [23] found through experiments that using the Gaussian radial basis kernel function (RBF) can significantly improve the performance of KELM. Therefore, RBF was chosen as the kernel function of KELM in this study, and its expression is as follows:
where is the kernel parameter.
The diagnostic output function of KELM is the following:
Based on the description above, the regularization coefficient, and the kernel parameter, serve as critical factors governing the predictive performance of the KELM algorithm [24]. In the subsequent research of this paper, the selection of the corresponding parameters of KELM will be optimized by the IWOA [25].
3. Improved Whale Optimization Algorithm
This study improves the WOA to solve its problems of insufficient global searches and slow convergence speeds. Firstly, we designed an adaptive weight function as a factor of the optimal position so that the influence of the optimal position on the next position would change dynamically, improving the convergence speed of the algorithm. Secondly, we also designed a variable helix parameter instead of the helix shape constant in the original model, which strengthened the global search ability of the algorithm. Lastly, we also devised and added a Cauchy neighborhood perturbation function to the algorithm, which randomly perturbed the algorithm near the optimal position, thus reducing the possibility of the algorithm falling into the local optimal solution and solving the problem of premature convergence in the algorithm [26].
3.1. Adaptive Weight
We designed an adaptive weight function that changed with iterations and used it as a factor for the optimal position. At the initial stage of the search, the influence of the value of was reduced on the moving distance. As iterations progress, the influence of the optimal position is increased to enhance convergence speed in later stages. The expression of is as follows:
Due to the nature of the function between , changes nonlinearly between with the increase in iterations. When the value of is gradually increased from to , the value of is also gradually increased, and this change shows a fast-to-slow trend. This property of balances the convergence speed of the algorithm with the search capability. The image of is shown in Figure 4.
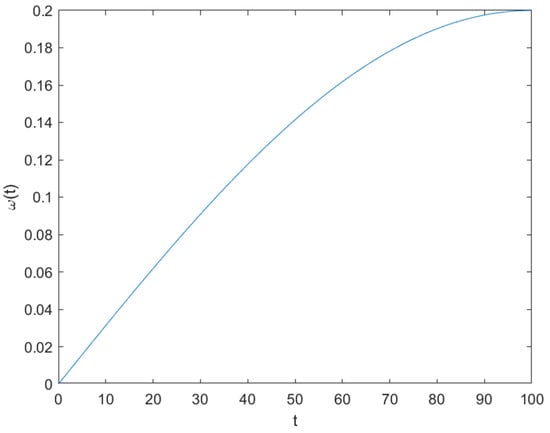
Figure 4.
The function graph of at .
Adding to Formula (9), the new expression is as follows:
3.2. Variable Spiral Shape Parameter
In the spiral search mode, there is a parameter, , which is used to control the spiral shape. In the past, people usually set it as a constant. However, this may lead to an overly simple motion pattern when searching for prey, making the algorithm prone to locally optimal solutions and its global search capability too homogeneous. To solve this problem, we set as a variable that is associated with iterations. The mathematical expression of parameter is as follows:
The design inspiration of parameter comes from the mathematical model of the logarithmic helix. Based on the helix model, this paper realizes the dynamic adjustment of the helix shape by associating the value of with iterations. The spiral shape is inversely proportional to iterations by designing the parameter in this way. At the beginning of the iteration, the whale will search for the target using a large spiral shape to improve the non-local search capacity of the algorithm. When the number of iterations is about to reach the set value, the whale searches in the shape of a small spiral, thus improving the optimization accuracy of the algorithm.
3.3. Cauchy Neighborhood Perturbation Strategy
When updating the position, the whale will generally use the optimal position calculated at this point as the target of their movement.
During this process, using traditional gradient descent methods may easily lead to the process becoming stuck in local optima. By introducing the Cauchy neighborhood perturbation strategy, the algorithm can perform a certain degree of random perturbation on the current solution at each iteration. In this way, the solution of the function still gradually approaches the optimal value, but perturbations can help the algorithm avoid staying in the local optimal region for too long, which effectively avoids the premature maturity of the algorithm. The Cauchy neighborhood perturbation formula is the following:
where is a randomly generated number between [0, 1]; is the generated new position; and is a custom Cauchy random number.
3.4. Performance Test of IWOA
In order to verify the performance of the IWOA, this paper conducted comparative experiments using five algorithms: the Sparrow Search Algorithm (SSA), Particle Swarm Optimization (PSO), Grey Wolf Optimizer (GWO), Whale Optimization Algorithm (WOA), and IWOA. The selected algorithms were applied to four standard test functions for comparative experiments to test their optimization ability for problems with an optimal value of 0. We set the population size to 40 and the maximum iteration to 500 and optimized each test to function 30 times. The expressions of each test function are shown in Table 1; the convergence curves are shown in Figure 5; and the optimized results of each algorithm are shown in Table 2.

Table 1.
Test functions.
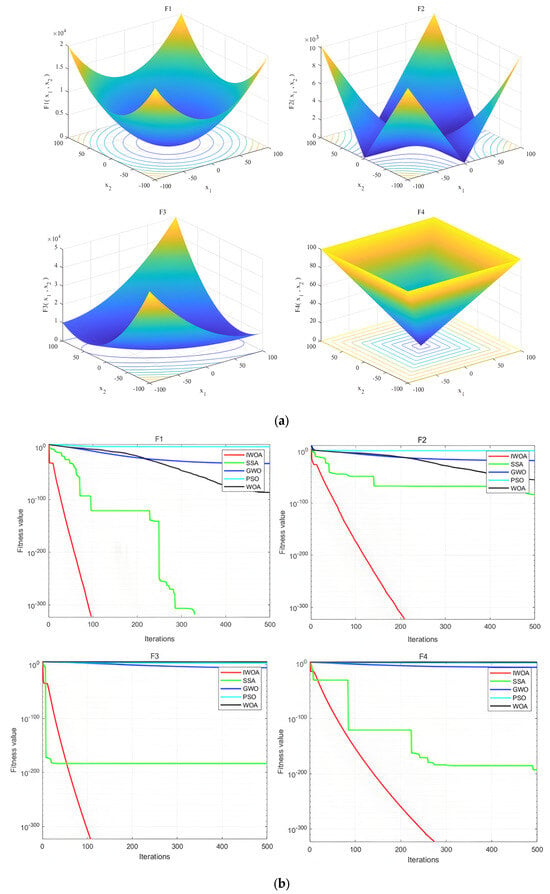
Figure 5.
Convergence curves of test functions for each algorithm: (a) test function image; (b) Algorithm convergence curve image.

Table 2.
Optimization results of each algorithm.
4. IWOA-VMD-KELM Fault Diagnosis Model
The working process of the IWOA-VMD-KELM model is as follows. Firstly, the collected vibration signals are preprocessed. Then, the IWOA is used to optimize and replace the two key parameters of VMD. The preprocessed vibration signal is decomposed, and feature vectors are extracted using the optimized VMD algorithm. Finally, the IWOA is used to optimize KELM, and the feature vectors are used as inputs to the optimized KELM for training and testing to complete the bearing fault classification. Figure 6 presents the diagnostic workflow.
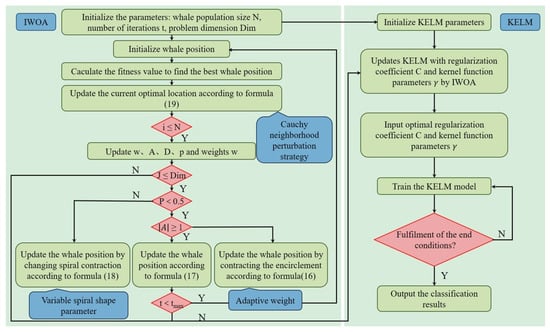
Figure 6.
Diagnostic flow chart of IWOA-VMD-KELM model.
4.1. Experimental Comparison
Firstly, we used the rolling bearing dataset disclosed by the Case Western Reserve University (CWRU) to verify the diagnostic performance of IWOA-VMD-KELM. The experimental setup comprises a motor, a torque sensor, and a force-measuring machine. The drive end is equipped with SKF6205 bearings, where single-point faults of three different diameters (0.007, 0.014, and 0.021 inches) were introduced on the inner rings, outer rings, and rolling elements, respectively. The CWRU dataset includes the rotational speeds of the bearing under three different operational conditions: 1750 rpm, 1772 rpm, and 1797 rpm. Among these, 1797 rpm is the load-end-corrected value, and it was chosen by us because it accounts for belt transmission efficiency (approximately 1.5% slippage) and reflects the bearing’s actual operational speed, making it the closest representation of real-world working conditions. We also used the bearing dataset of Southeast University to test the generalization ability of the IWOA-VMD-KELM. The device diagram of the experimental platform is shown in Figure 7.
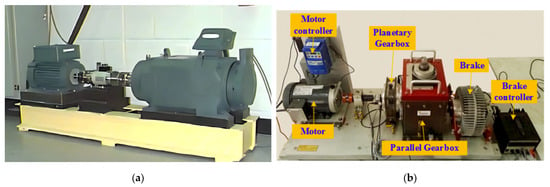
Figure 7.
(a) CWRU Data Experiment Platform; (b) Southeast University Data Experiment Platform.
The computer specifications used in this experiment are as follows: Processor (CPU): AMD Ryzen 7 5800H with Radeon Graphics 3.20 GHz; memory (RAM): 16.0 GB; hard drive: 512 GB; GPU: NVIDIA GeForce RTX 3060 Laptop GPU. Operating System: Windows 11 Home Chinese Edition 26100.3775; software environment: MATLAB R2024a; programming language: MATLAB R2024a.
4.2. Feature Extraction
In this experiment, the dataset was driven at the sampling frequency of 12 kHz and a rotation speed of 1797 r/min. Ten different signal characteristics of the normal state, inner ring fault, rolling element fault, and outer ring fault were chosen. The size of each fault was 0.007 inches, 0.014 inches, and 0.021 inches, respectively. In total, 125 samples were selected for each signal feature, the data collection point of each sample was set to 2048, and sample labels were made for the corresponding samples. The specific experimental sample data are shown in Table 3.

Table 3.
Data settings for different types of experimental samples.
We took a set of inner ring fault data with a fault size of 0.007 inches as an example; the IWOA was used to optimize the mode number k and penalty coefficient (α) of VMD, and we chose to use the sample entropy function as the objective function of VMD. The value of sample entropy is an indicator used to measure the complexity and self-similarity of time series data. For VMD, the sample entropy function helps evaluate whether the decomposed signal has low complexity and high predictability, which can help avoid redundant information in the modal function. After optimization, k = 8 and α = 1992.
By substituting the above values into the VMD algorithm, the vibration signal is decomposed into k-modal components. Figure 8 shows the time domain and frequency domain diagrams of each component after decomposition. As can be seen from Figure 8, the vibration signal exhibits distinct periodic amplitudes. The high-frequency IMFs demonstrate broadband spectral characteristics without noticeable mode mixing, which verifies the fact that the VMD algorithm with IWOA-optimized parameters achieves the effective decomposition of the original signal.
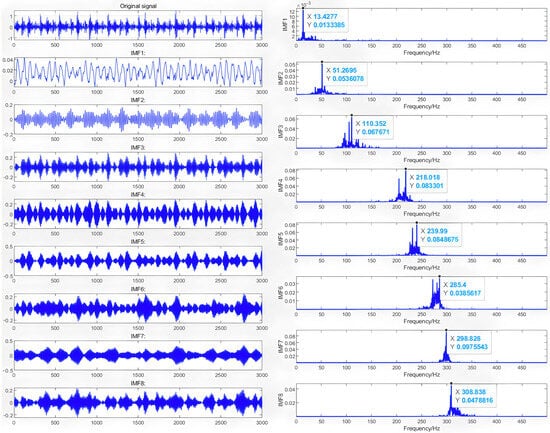
Figure 8.
Time domain diagram and spectrum.
4.3. Experimental Results and Analysis
Firstly, to verify the necessity of using the VMD algorithm before fault classification, ablation experiments were conducted between the IWOA-KELM model and the IWOA-VMD-KELM model under the same conditions. The diagnostic results of the two models are shown in Table 4 and Figure 9. The specific formula for calculating the accuracy of the model is the following:
where represents the number of correctly classified samples in category and is the number of all samples.

Table 4.
Diagnostic results.
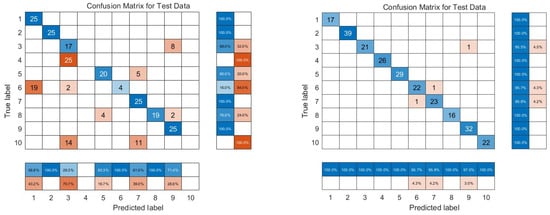
Figure 9.
Diagnostic results.
The diagnostic results demonstrate a significant improvement in accuracy with the IWOA-VMD algorithm, confirming its effectiveness.
To verify the superiority of the IWOA in practical applications under the same conditions, GWO-VMD-KELM, SSA-VMD-KELM, and PSO-VMD-KELM were compared with the IWOA-VMD-KELM. Among them, the monitoring variables included the regularization coefficient and the kernel parameter of KELM. The population size of the optimization algorithm was set to 30, and the maximum iteration was set to 100. The specific diagnosis results are shown in Table 5, and the confusion matrix of the test set for each model is shown in Figure 10.

Table 5.
Diagnostic results of each model.
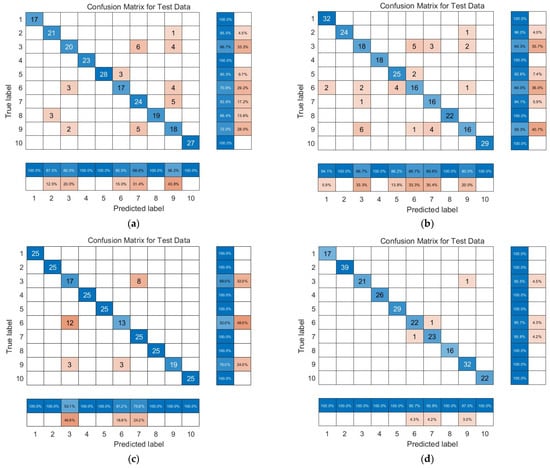
Figure 10.
The confusion matrix of each model: (a) GWO-VMD-KELM; (b) SSA-VMD-KELM; (c) PSO-VMD-KELM; and (d) IWOA-VMD-KELM.
Combined with Figure 10 and Table 5, it is evident that under the same conditions, the accuracy of the IWOA-VMD-KELM model significantly improved compared with other diagnosis models, which proves the superiority of this improved algorithm.
The bearing data in the Southeast University dataset were collected from a working condition with a speed of 30 Hz (1800 rpm); the sampling frequency was 5120 Hz; and the vibration sensor model was 608A11. This dataset contains five states of bearings, which are normal, rolling element fault, inner ring fault, outer ring fault, and composite fault. The sample number of each state is 125, and each set of samples contains 1000 sampling points. In total, 625 sample groups were selected, and the diagnosis results of each model are shown in Table 6.

Table 6.
Diagnostic results of each model.
As can be seen from the above table, after replacing the dataset, the IWOA-VMD-KELM model also had high accuracy and still possessed advantages compared with the other models, which demonstrates its robust generalization performance.
Additionally, to demonstrate the overall superiority of the proposed model, we compared the IWOA-VMD-KELM model with two other hybrid fault diagnosis approaches (WOA-VMD-SVM and IWOA-VMD-LSSVM). The experimental results confirm that IWOA-VMD-KELM achieves significantly higher accuracy than the other two models. Figure 11 displays the confusion matrices of WOA-VMD-SVM and IWOA-VMD-LSSVM, and the detailed experimental results are provided in Table 7.
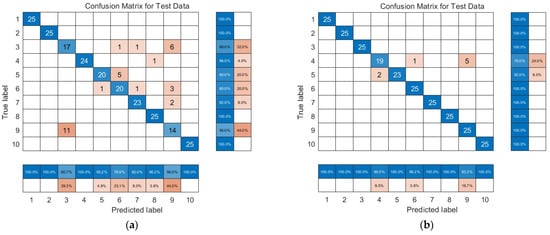
Figure 11.
The confusion matrix of each model: (a) WOA-VMD-SVM; (b) IWOA-VMD-LSSVM.

Table 7.
Accuracy of each model.
5. Conclusions
To improve the accuracy of rolling bearing fault diagnosis, a fault diagnosis model based on machine learning and optimization algorithms is proposed. This study proposes an innovative improvement to the traditional whale optimization algorithm by introducing adaptive weight, variable spiral parameters, and Cauchy neighborhood disturbance. The enhanced algorithm (IWOA) is then integrated with variational mode decomposition (VMD) and kernel extreme learning machine (KELM) to establish the IWOA-VMD-KELM model. The ablation experiments were conducted under the same experimental conditions to verify the effectiveness of the optimized VMD algorithm. The accuracy, generalization, and superiority of the model in rolling bearing fault diagnosis were verified through comparison experiments with different datasets and diagnosis models under the same experimental conditions. This paper provides a new idea and solution for the research of bearing fault diagnoses.
Author Contributions
All authors contributed to the study’s conception and design. Material preparation, data collection, and analysis were performed by L.L., B.Y. and S.C. The first draft of the manuscript was written by L.L., and all authors commented on previous versions of the manuscript. All authors have read and agreed to the published version of the manuscript.
Funding
This work was supported by the Zhejiang Province “spearhead” “Leading wild goose” R&D public relations plan project (Grant numbers [2023C02008]) and Zhejiang Province “spearhead Leading wild goose +X” R&D research project (Grant numbers [2024C04037]).
Data Availability Statement
The data that support the findings of this study are available upon reasonable request to the corresponding author [S.C.].
Conflicts of Interest
The authors declare no conflicts of interest.
References
- Xu, F.N.; Ding, N.; Li, N.; Liu, L.; Hou, N.; Xu, N.; Guo, W.M.; Tian, L.N.; Xu, H.X.; Wu, C.M.L.; et al. A review of bearing failure Modes, mechanisms and causes. Eng. Fail. Anal. 2023, 152, 107518. [Google Scholar] [CrossRef]
- Xin, J.; Yiming, C.; Lei, W.; Huali, H.; Peng, C. Failure prediction; monitoring and diagnosis methods for slewing bearings of large-scale wind turbine: A review. Measurement 2021, 172, 108855. [Google Scholar] [CrossRef]
- He, F.; Xie, G.; Luo, J. Electrical bearing failures in electric vehicles. Friction 2020, 8, 4–28. [Google Scholar] [CrossRef]
- Ma, M.; Mao, Z. Deep convolution-based LSTM network for remaining useful life prediction. IEEE Trans. Ind. Inform. 2020, 1, 1658–1667. [Google Scholar] [CrossRef]
- Cao, L.; Sun, W. Research on bearing fault identification of wind turbines’ transmission system based on wavelet packet decomposition and probabilistic neural network. Energies 2024, 17, 2581. [Google Scholar] [CrossRef]
- Meng, D.; Wang, H.; Yang, S.; Lu, Z.; Hu, Z.; Wang, Z. Fault analysis of wind power rolling bearing based on EMD feature extraction. Comput. Model. Eng. 2022, 130, 543–558. [Google Scholar] [CrossRef]
- Li, J.; Luo, W.; Bai, M. Review of research on signal decomposition and fault diagnosis of rolling bearing based on vibration signal. Meas. Sci. Technol. 2024, 35, 092001. [Google Scholar] [CrossRef]
- Marco, C.; Cecilia, S. A comparative analysis of signal decomposition techniques for structural health monitoring on an experimental benchmark. Sensors 2021, 21, 1825. [Google Scholar] [CrossRef]
- Liu, L.; Wei, Y.; Song, X.; Zhang, L. Fault diagnosis of wind turbine bearings based on CEEMDAN-GWO-KELM. Energies 2022, 16, 48. [Google Scholar] [CrossRef]
- Li, X.; Zhao, H. Performance Prediction of Rolling Bearing Using EEMD and WCDPSO-KELM Methods. Appl. Sci. 2022, 12, 4676. [Google Scholar] [CrossRef]
- Wang, J.; Ye, C.; Jiang, M.; Zhang, F.; Sui, Q. SWT-KELM-based rolling bearing fault diagnosis method under noise conditions with different SNRs. Meas. Sci. Technol. 2023, 34, 015007. [Google Scholar] [CrossRef]
- Lei, Y.; Yang, B.; Jiang, X.; Jia, F.; Li, N.; Nandi, A.K. Applications of machine learning to machine fault diagnosis: A review and roadmap. Mech. Syst. Signal Process. 2020, 138, 106587. [Google Scholar] [CrossRef]
- Wang, X.; Mao, D.; Li, X. Bearing fault diagnosis based on vibro-acoustic data fusion and 1D-CNN network. Measurement 2020, 173, 108518. [Google Scholar] [CrossRef]
- Chen, X.; Zhang, B.; Gao, D. Bearing fault diagnosis based on multi-scale CNN and LSTM model. J. Intell. Manuf. 2020, 32, 971–987. [Google Scholar] [CrossRef]
- Liu, R.; Wang, X.; Su, C.; Kang, Z.; Li, Y.; Yu, S.; Zhang, H. Bearing fault diagnosis method based on variational mode decomposition optimized by CS-PSO. J. Vib. Control 2024, 30, 973–987. [Google Scholar] [CrossRef]
- Dragomiretskiy, K.; Zosso, D. Variational Mode Decomposition. IEEE Trans. Signal Process. 2014, 62, 531–544. [Google Scholar] [CrossRef]
- Lian, J.J.; Liu, Z.; Wang, H.J.; Dong, X.F. Adaptive variational mode decomposition method for signal processing based on mode characteristics. Mech. Syst. Signal Process. 2018, 107, 53–77. [Google Scholar] [CrossRef]
- Majid, A.; Alrasheedi, M.A.; Alharbi, A.A.; Allohibi, J.; Lee, S.W. Modified Whale Optimization Algorithm for Multiclass Skin Cancer Classification. Mathematics 2025, 13, 929. [Google Scholar] [CrossRef]
- Ramos-Frutos, J.; Casas-Ordaz, A.; Zapotecas-Martínez, S.; Oliva, D.; Valdivia-González, A.; García-Nájera, A.; Pérez-Cisneros, M. Enhancing Multi-Objective Optimization: A Decomposition-Based Approach Using the Whale Optimization Algorithm. Mathematics 2025, 13, 767. [Google Scholar] [CrossRef]
- Shafieenejad, I. Maximizing the velocity deflection of asteroid Didymos using the Whale Optimization Algorithm. Planet. Space Sci. 2025, 258, 106075. [Google Scholar] [CrossRef]
- Lee, C.Y.; Le, A.; Chu, T.H.; Hsu, S.C. A motor fault diagnosis using hybrid binary differential evolution algorithm and whale optimization algorithm with storage space. IET Control Theory Appl. 2025, 19, e12783. [Google Scholar] [CrossRef]
- Li, Q.C.; Zhang, X.; Liang, H.B.; Li, A.G.; Ding, X.X.; Huang, W.B.; Mechefske, C. Variational Mode Feature Construction-Based Improved Kernel Extreme Learning Machine for Rotating Machinery Intelligent Diagnosis. IEEE Sens. J. 2025, 25, 8124–8133. [Google Scholar] [CrossRef]
- Rodriguez, N.; Barba, L.; Alvarez, P.; Cabrera-Guerrero, G. Stationary Wavelet-Fourier Entropy and Kernel Extreme Learning for Bearing Multi-Fault Diagnosis. Entropy 2019, 21, 540. [Google Scholar] [CrossRef]
- Chen, Z.C.; Wu, L.J.; Cheng, S.Y.; Lin, P.J.; Wu, Y.; Lin, W.C. Intelligent fault diagnosis of photovoltaic arrays based on optimized kernel extreme learning machine and I-V characteristics. Appl. Energy 2017, 204, 912–931. [Google Scholar] [CrossRef]
- Liang, R.J.; Chen, Y.; Zhu, R.P. A Novel Fault Diagnosis Method Based on the KELM Optimized by Whale Optimization Algorithm. Machines 2022, 10, 93. [Google Scholar] [CrossRef]
- Hu, Q.; Zhou, H.T.; Wang, C.C.; Zhu, C.X.; Shen, J.P.; He, P. Time-Frequency Fusion Features-Based GSWOA-KELM Model for Gear Fault Diagnosis. Lubricants 2024, 12, 10. [Google Scholar] [CrossRef]
Disclaimer/Publisher’s Note: The statements, opinions and data contained in all publications are solely those of the individual author(s) and contributor(s) and not of MDPI and/or the editor(s). MDPI and/or the editor(s) disclaim responsibility for any injury to people or property resulting from any ideas, methods, instructions or products referred to in the content. |
© 2025 by the authors. Licensee MDPI, Basel, Switzerland. This article is an open access article distributed under the terms and conditions of the Creative Commons Attribution (CC BY) license (https://creativecommons.org/licenses/by/4.0/).