1. Introduction
The rapid advancement of internet technologies has resulted in substantial enhancements in the digital transformation capabilities of higher education institutions. For example, European universities have pioneered IoT-integrated campus networks to optimize energy consumption [
1], while U.S. institutions leverage behavioral analytics for adaptive learning platforms [
2]. In Asia, studies on large-scale educational data (e.g., [
3] on Chinese MOOC platforms) reveal similar challenges in handling heterogeneous user behavior. However, existing solutions remain siloed: European efforts prioritize sustainability over pedagogical insights, U.S. frameworks lack scalability for resource-constrained environments, and Asian studies focus on content delivery rather than network dynamics. This global fragmentation underscores the urgency of developing a universally adaptable yet context-sensitive framework. As universities increasingly adopt comprehensive information service management ecosystems, campus network users now generate exponentially expanding volumes of multi-modal data characterized by significant heterogeneity. This exponential growth has intensified academic and operational demands for extracting actionable intelligence from complex datasets. Within this paradigm, network user behavior analysis emerges as a critical methodology, systematically decoding behavioral signatures through the computational examination of network-derived feature vectors to establish both quantitative metrics and qualitative interpretations of user group dynamics.
Campus networks possess distinctive characteristics that set them apart from typical corporate or home networks. These systems exhibit pronounced tidal traffic patterns (e.g., predictable surges during academic hours versus dormitory usage peaks at night), uneven access distribution across educational and recreational services, and massive data volumes generated by diverse network applications ranging from online learning platforms to IoT devices. By analyzing campus network user behavior, educational institutions can dynamically allocate bandwidth resources in real time, prioritizing critical academic activities such as video lectures and research data transfers while maintaining overall network efficiency. This optimization not only fulfills the evolving digital demands of teaching and learning workflows but also lays the foundation for personalized services, such as recommending discipline-specific educational resources based on observed user behavior patterns.
Moreover, the study of user behavior is instrumental in identifying network faults and bottlenecks, enabling timely adjustments and optimizations to ensure stable and unobstructed network operations. It also plays a critical role in detecting abnormal or malicious activities, offering data support for the refinement of network strategies. This is vital for preventing data breaches and information security issues that could arise from cyberattacks.
The study of online user behavior is facilitated by a variety of clustering algorithms, which can be broadly classified into partitioning clustering, hierarchical clustering, density-based clustering, grid-based clustering, and model-driven clustering, among others. Selecting the appropriate clustering algorithm is crucial for achieving effective research outcomes, as each method caters to specific needs and data characteristics. Internationally, the exploration of user behavior commenced relatively early, with the United States [
4] employing statistical methods to analyze user behavior on networks in the early 1980s. The authors of [
5] advanced this field by extracting subgraphs that represent users’ primary interests, thereby revealing user interests based on website keyword graphs. In [
6], the authors contributed to the understanding of user behavior through the analysis of user sessions, proposing a session-based analysis method that focuses on the duration of user visits to specific web pages. These methodologies have significantly enhanced our ability to comprehend and predict user behavior in online environments. Building upon the foundational work in understanding user behavior through various clustering methodologies, as outlined above, the field has progressed to incorporate more sophisticated techniques to better capture the nuances of user interactions online. This evolution in research methodologies has set the stage for the development of more advanced algorithms tailored to the complexities of modern user behavior data.
Recent advancements in machine learning have introduced novel approaches to address the challenges of multi-modal campus network data. While traditional clustering methods such as k-means [
7] and DBSCAN [
8] remain foundational, graph neural networks (GNNs) have demonstrated superior performance in capturing topological dependencies among heterogeneous user behaviors [
9]. The authors of [
10] explored using a hidden Markov model to predict human mobility from GPS tracking data. Their work emphasizes the importance of accurate modeling in complex data scenarios, which aligns with our goal of improving the accuracy of user behavior clustering in the context of multi-modal campus network data. In particular, temporal graph attention mechanisms [
11] show promise in modeling the tidal traffic patterns inherent to academic schedules. However, existing studies often overlook two critical aspects of campus networks: the ethical implications of behavioral data utilization under evolving regulations and the need for explainable AI frameworks to bridge technical optimization with pedagogical outcomes [
12].
The increasing dimensionality of web user behavior data introduces significant analytical challenges. In high-dimensional spaces, data points exhibit sparse distributions with clusters of varying geometries and densities, fundamentally undermining the ability of conventional clustering algorithms to discern meaningful similarities. This phenomenon is compounded by exponentially growing computational complexity, leading to prohibitive resource consumption. Critical limitations emerge across mainstream approaches: Euclidean distance metrics lose discriminative power in high-dimensional manifolds; K-means clustering fails to autonomously eliminate redundant features, thereby degrading cluster purity; spectral and hierarchical clustering algorithms face computational intractability with large-scale high-dimensional datasets; and density-based methods like DBSCAN prove inadequate for clusters exhibiting substantial density heterogeneity.
While recent machine learning innovations have demonstrated potential in multi-modal campus network analysis, emerging hybrid paradigms that unify graph-theoretic principles with deep sparse learning offer enhanced capabilities to tackle high-dimensional behavioral data challenges. For instance, graph convolutional networks (GCNs) [
13] and hypergraph-based clustering [
14] have demonstrated success in modeling relational data, yet they often fail to balance computational efficiency with interpretability in high-dimensional subspaces. Meanwhile, sparse subspace clustering with low-rank transformation [
15] provides theoretical guarantees for dimensionality reduction but lacks integration with deep feature learning.
The primary aim of this work is to address three critical limitations in current behavioral analytics frameworks:
Inadequate handling of high-dimensional sparsity: Traditional subspace clustering relies on linear representations, failing to capture hierarchical feature interactions in campus network data.
Neglect of structural semantics: Graph-based methods (e.g., GCNs [
13], hypergraphs [
14]) model relational dependencies but ignore attribute heterogeneity and ethical interpretability.
Computational inefficiency: Spectral clustering algorithms (e.g., normalized cut) suffer from O(n3) complexity, limiting scalability for large-scale logs.
In order to overcome these challenges, we propose an enhanced algorithm, which integrates deep sparse auto-encoders with graph-theoretic subspace partitioning. Utilizing behavioral data provided by the Information Office at Henan University of Technology, our study delves into the online behavior of campus network users. Our approach improves upon the literature in two key areas:
Unified sparse-graph representation: Unlike standalone methods (e.g., SSC or GCNs [
13]), our method enforces sparsity constraints via DSAE while embedding graph Laplacians to preserve topological semantics, as inspired by hybrid frameworks in [
16].
Ethically aligned optimization: By incorporating normalized cut criteria, our method balances intra-cluster cohesion and inter-cluster separation, enabling explainable resource allocation—a gap identified in recent studies on educational AI [
12].
The main contributions of this paper are summarized as follows:
A four-layer deep sparse auto-encoder model is employed to process behavioral data, extracting deep internal data structures and integrating different attributes to achieve dimensionality reduction.
A graph theory subspace method is utilized to transform data objects, enabling subspace clustering and yielding campus network user behavior clustering results.
The comparative analysis of performance on a user behavior dataset demonstrates that the algorithm presented in this study outperforms existing methods in terms of accuracy.
2. Related Work
2.1. Deep Sparse Auto-Encoder
The inherent sparsity and nonlinear relationships in high-dimensional behavioral data necessitate advanced feature learning techniques beyond conventional dimensionality reduction. In this paper, a deep sparse auto-encoder is employed to perform dimensionality reduction on high-dimensional data. Within the realm of deep learning, the auto-encoder (AE) [
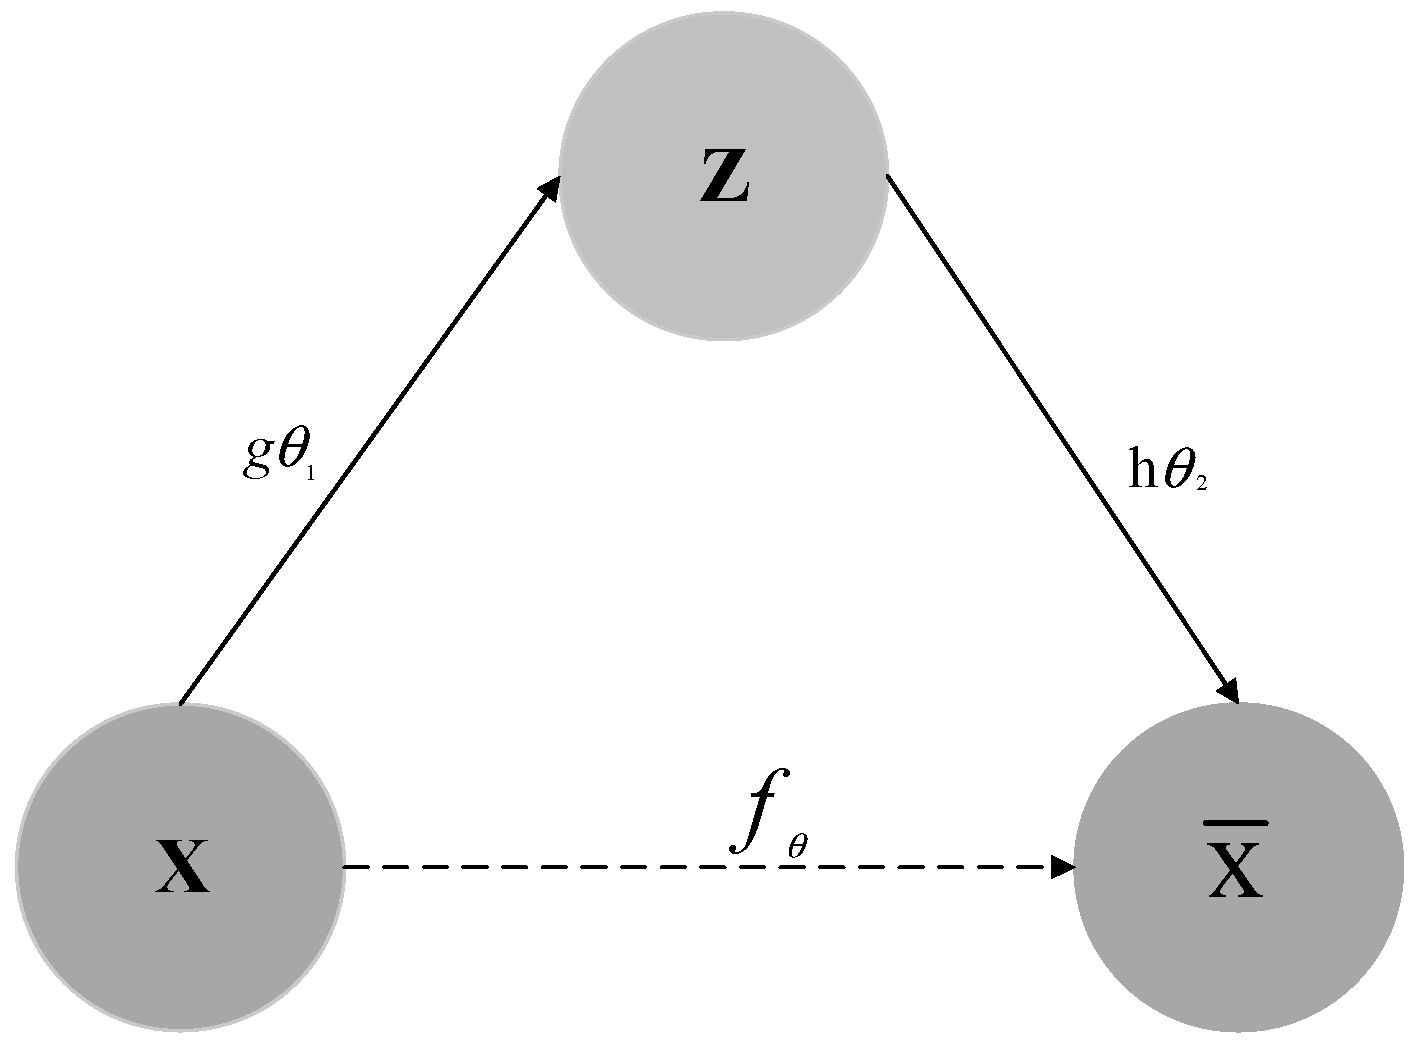
17] is a deep learning model that learns a low-dimensional representation of the input data and then reconstructs the original input from this representation. It is widely used in data compression, feature learning, and generative modeling. An auto-encoder consists of an encoder and a decoder; the encoder maps the input data to a low-dimensional space, while the decoder maps the low-dimensional data back to the original input data. During the auto-encoder learning process, let X denote the original data, Z represent the encoded data, and
signify the decoded data.
(X) =
,
is referred to as an auto-encoder, and the specific process is illustrated in
Figure 1.
In this figure, represents the mapping function from the original data to the latent variable , commonly known as the encoder. It encodes high-dimensional original data into a low-dimensional latent variable space, and this process can be understood as extracting the key features of the data. represents the mapping function from the latent variable to the reconstructed data , also called the decoder. usually represents a function that measures the difference between the original data and the reconstructed data , which is used to guide the model training to optimize parameters so that the reconstructed data is as close as possible to the original data.
When the input capacity of the encoder and decoder is too large, the input data are copied entirely to the hidden layer, rendering the dimensionality reduction function of the auto-encoder ineffective. Therefore, certain improvements to the auto-encoder are necessary. The sparse auto-encoder (SAE) [
18] addresses the issues inherent in auto-encoders by incorporating sparsity constraints to control the number of neurons in the AE’s hidden layer. The learning process of the sparse auto-encoder is described by Equation (1), with the activation function typically being the sigmoid function:
In this equation,
represents the output of the encoder,
represents the output of the decoder, and
denotes the sparsity penalty term. Stacking multiple sparse auto-encoders forms a deep sparse auto-encoder (DSAE) [
19]. Here, we incorporate regularization into its objective function, making the data more prone to sparsity. Details are given in Equation (2):
where
represents the objective function for optimization,
denotes the loss function, and
signifies the regularization parameter.
DSAE is based on the traditional self-encoder. By calculating the error between the self-encoded output and the original input, the traditional self-encoder continuously adjusts the parameters to train the model, aiming to approximate the constant function so that the output is close to the input. The deep sparse self-encoder, on the other hand, imposes sparsity constraints on the hidden layer neurons on this basis. When the number of hidden layer nodes is large or even exceeds the input nodes, in order to avoid the self-encoder losing the ability to learn the sample features, the sparsity effect is achieved by restricting the activity of the hidden layer neurons so that they are in an inhibited state most of the time. During the training process, the parameters are adjusted by a back propagation algorithm to minimize the overall cost function.
2.2. Graph Theory
Graph structures serve as fundamental mathematical abstractions for modeling relational data across diverse applications [
20,
21], particularly excelling in scenarios requiring explicit representation of entity interactions. Formally, an undirected weighted graph is defined as
, a non-empty set of vertices
, and a non-empty set of edges
, where each edge is a pair of points
, with
. In mathematical formulations, graphs adopt dual representations: set-theoretic notation captures topological relationships, while matrix representations (e.g., adjacency or similarity matrices) enable computational manipulation. For instance, consider a set of samples with m attributes, which implies the existence of a graph with m vertices. The similarity matrix of this graph is represented by Equation (3):
where
and
represent the vectors
i and
j, respectively, and
represents the similarity between
and
. The elements of this matrix allow for the construction of a diagonal matrix and a degree matrix, as detailed in Equation (4):
The non-standard Laplacian matrix is given in Equation (5):
The Laplacian matrix plays a crucial role in our graph partitioning step. The Laplacian matrix captures the relationships between data points in the graph. When performing graph partitioning, we aim to divide the graph into distinct clusters. The eigenvalues and eigenvectors of the Laplacian matrix provide valuable information for this task. The small non-zero eigenvalues of the Laplacian matrix correspond to the partitions of the graph that minimize the cut between clusters while maintaining a balance in cluster sizes. This is essential for our model as it helps in identifying densely connected user subgroups corresponding to coherent behavioral patterns in campus network behavior analytics. In other words, the Laplacian matrix transformation allows us to better represent the topological structure of the data in the graph, enabling the model to effectively partition the data into meaningful clusters, which is fundamental for analyzing complex campus network user behavior data.
Our methodology incorporates spectral graph theory through Laplacian embedding, a strategic preprocessing step that encodes structural partitioning information prior to clustering. Unlike conventional approaches that operate directly on raw feature spaces, this graph-theoretic transformation preserves pairwise similarity relationships via spectral decomposition, thereby reducing computational complexity through low-dimensional manifold projection while maintaining topological fidelity.
The theoretical foundation of our subspace clustering framework draws inspiration from the graph partitioning paradigm. By constructing an undirected weighted graph where vertices represent data objects and edges encode similarity metrics, we reformulate the clustering task as an optimal graph partition problem. Crucially, the graph Laplacian matrix guarantees positive semi-definiteness, ensuring non-negative eigenvalue decomposition—a mathematical property that aligns with the non-negative interaction patterns inherent in campus network behavior analytics. This algebraic stability enables robust identification of densely connected user subgroups corresponding to coherent behavioral patterns.
2.3. Subspace Clustering
Deep clustering algorithms refer to the integration of deep learning with traditional clustering methods, a combination that is termed deep clustering [
22,
23,
24,
25]. While these hybrid approaches demonstrate improved feature representation capabilities, their effectiveness in ultra-high-dimensional spaces remains constrained by the inherent limitations of Euclidean-based clustering paradigms. This critical gap motivates the adoption of subspace clustering principles to bridge deep representation learning with geometric-aware dimensionality reduction.
Addressing the issue of clustering high-dimensional data, the clustering algorithms are conducted within the subspace [
26,
27,
28,
29,
30]. This method maps high-dimensional data onto various low-dimensional subspaces to accomplish clustering, effectively mitigating the issues of poor accuracy and low efficiency that are prevalent in high-dimensional clustering problems. The objective of subspace clustering is to accurately allocate N samples into their respective k subspaces, label the high-dimensional data through the low-dimensional subspace, and perform clustering operations. Subspace clustering extends traditional N-dimensional clustering analysis by allowing the simultaneous grouping of features and observations through the creation of row and column clusters.
Given a matrix X = [x1, x2, x3, …, xn] ∈ Rm*n, xi ∈ Rm, constructed from N samples, where each of the N samples originates from k subspaces, this implies that the dimensions of these k subspaces indicate the eventual production of k clusters. Currently, some of the classic subspace clustering methods primarily include the algorithmic approaches listed below.
2.3.1. CLIQUE (Clustering in QUEst)
The CLIQUE algorithm [
31] synergizes grid-based and density-based clustering techniques, adept at uncovering clusters of diverse shapes and adeptly managing large-scale, high-dimensional data. It segments data based on temporal dimensions, allocating them into designated regions to assess local densities. A region is classified as dense if the density of data objects within it surpasses a predefined threshold.
2.3.2. Sparse Subspace Clustering
Sparse subspace clustering (SSC) algorithms leverage the correlations between data points within subspaces to facilitate the task of subspace clustering [
16,
32]. Elhamifar introduced the concept of sparsity into subspace clustering algorithms to further enhance their effectiveness, proposing the sparse subspace clustering algorithm (SSC) [
33]. This method employs sparse representation learning to express data points as linear combinations within a low-dimensional space and utilizes similarity matrices to identify the optimal subspace representations, thereby achieving dimensionality reduction and the clustering of high-dimensional data.
Let X be the matrix X = [x
1, x
2, x
3, …, x
n] ∈ R
m*n, x
i ∈ R
m, constructed from N samples. A dictionary is constructed based on the samples in the matrix, denoted as
. If
is the coefficient matrix, the sparse model representation is defined as follows:
2.3.3. Low-Rank Subspace Clustering
The low-rank subspace representation model [
34,
35,
36,
37,
38] is nearly identical to the sparse subspace representation model, with the primary distinction lying in the constraints imposed on the sparse matrix. Mathematically, this can be described as follows:
Equation (7) represents the low-rank representation model, where denotes the rank of matrix Z. The SSC algorithm incorporates a noise regularization term during matrix learning, which transforms the elements of the entire similarity matrix, leading to a block diagonal structure that reveals the internal structure of the subspace. This process is akin to reducing the multidimensional features of the original data to n dimensions followed by a K-means operation, thereby enhancing the clustering performance and improving the accuracy of the clustering results.
2.4. Literature Gaps and Motivations
While existing studies have made significant strides in integrating deep learning with clustering algorithms, critical gaps remain unaddressed in the context of campus network behavioral analytics. First, conventional deep clustering frameworks (e.g., SSC, DSSC) predominantly rely on Euclidean-based similarity metrics, which inadequately capture the topological dependencies inherent in user interaction patterns, such as temporal traffic dynamics and heterogeneous attribute correlations. Second, sparse subspace methods often neglect the ethical implications of behavioral data utilization and fail to provide explainable partitioning mechanisms that align with pedagogical objectives. Additionally, graph-theoretic approaches in prior work [
20,
21,
29] primarily focus on static graph representations, overlooking the need to balance intra-cluster cohesion and inter-cluster separation in high-dimensional subspaces—a limitation exacerbated by the sparsity and redundancy of campus network data. Lastly, while some studies incorporate auto-encoders for dimensionality reduction [
17,
18,
19], they lack a unified framework that synergizes sparse feature learning with normalized graph partitioning to optimize both computational efficiency and cluster interpretability. Our algorithm bridges these gaps by (1) embedding graph Laplacian constraints into deep sparse representations to preserve structural semantics, (2) integrating normalized cut optimization for globally balanced clustering, and (3) enabling behavior-aware resource allocation through explainable subspace partitioning, thereby addressing the unique challenges of campus network analytics.
3. Model
The inherent limitations of shallow models in capturing hierarchical feature representations from complex data necessitate the adoption of deep learning architectures. While shallow models suffer from constrained expressive power due to their inability to extract deep semantic features, deep clustering algorithms provide adaptive layer-wise feature abstraction, where the learned high-fidelity representations intrinsically enhance clustering robustness. Building upon foundational deep clustering and sparse subspace clustering frameworks, we propose an enhanced graph-theoretic subspace deep clustering algorithm (GTSDC) specifically tailored for campus network behavioral analytics.
Building upon foundational deep clustering frameworks [
22], we propose GTSDC to specifically address the limitations of prior work in three areas:
Hierarchical sparsity learning: While SSC and DSAE [
19] enforce sparsity, they lack mechanisms to align sparse features with graph structures. GTSDC bridges this gap through the joint optimization of sparse reconstruction loss and graph Laplacian regularization, as formalized in Equation (2).
Dynamic graph adaptation: Unlike static graph methods, our similarity matrix is iteratively refined through subspace representations, adapting to behavioral shifts—an innovation inspired by temporal GNNs.
Scalable partitioning: By approximating the graph Laplacian with randomized SVD [
39], we reduce the spectral decomposition complexity from O(n
3) to O(n log n), enabling the efficient processing of 238 k entries in USER_DATA.
3.1. Behavioral Data Characteristics and Preprocessing
Campus network user access logs constitute a vast and comprehensive record of behavioral data. In response to the nonlinear characteristics of the data, experts both domestically and internationally have conducted research on this topic. Murthy et al. [
40] utilized URLs and the DOM tree target tags of accessed pages to establish a knowledge base, achieving a semantic structure for recognizing access behavior through matching, which resulted in a classification accuracy of 97%.
Given the correlations between user access log attributes, specific preprocessing of the logs is necessary to integrate and analyze attributes comprehensively. We introduce the norm-weight (normalized weighting) method for preprocessing user behavior. Initially, data are preprocessed using Z-score standardization, which largely preserves the inherent characteristics of different attributes. Subsequently, attributes with close relationships but non-comparable data are processed through a weighted approach. The normalized weighting formula is defined as follows:
where
represents the weighting coefficient, and x, y, …, z denotes the different attributes under analysis.
3.2. Deep Representation Learning with Sparsity Constraints
Deep clustering algorithms effectively transform nonlinear data into linear forms, which can be viewed as an alternative manifestation of principal component analysis (PCA). These methods employ auto-encoders to learn a lower-dimensional representation of the data, significantly reducing the dimensionality of the input by minimizing reconstruction loss to achieve an optimal latent space. However, this does not necessarily correlate with the performance of clustering.
Empirical studies indicate that feedforward neural networks with multi-layer encoders achieve >90% reconstruction accuracy when sufficiently wide. However, single-layer AEs exhibit critical limitations: they cannot enforce the structural constraints (e.g., sparsity) essential for handling high-dimensional behavioral data. Considering the characteristics of the campus network user behavior log data provided by the Information Office at Henan University of Technology, which include redundancy, diverse attributes, and high dimensionality, we construct a deep sparse auto-encoder by stacking multiple sparse auto-encoders. Using Equation (2) for specific processing, we extract deeper-level features between attributes in the log data, achieving the desired dimensionality reduction effect. The deep sparse auto-encoder model is depicted in
Figure 2.
3.3. Graph Theory Subspace Partitioning
The clustering task is fundamentally reformulated as a graph partitioning problem by representing each data point as a vertex in an undirected graph, where edge weights encode pairwise similarity metrics derived from the DSAE-refined subspace. Among prevalent partitioning criteria, including normalized cut (NCut), ratio cut, minimum cut, and average cut, each exhibits distinct theoretical emphases: ratio cut prioritizes inter-cluster dissimilarity, minimum cut maximizes intra-cluster cohesion, and average cut minimizes partition boundary loss. However, these approaches suffer from imbalanced partitioning tendencies, either neglecting cluster size equilibrium or overemphasizing localized similarities. In contrast, the NCut criterion optimally balances global structural preservation with cluster coherence by minimizing the normalized inter-cluster disassociation:
where
quantifies the cumulative edge weights between clusters A and B, while
denotes the total edge weights incident to cluster A. This formulation inherently prevents skewed partitions containing undersized clusters—a critical requirement for analyzing campus network behavior patterns where both individual user anomalies and collective activity trends hold significance. Crucially, our implementation computes edge weights through attribute-wise correlations within the sparse subspace rather than conventional user similarity metrics, thereby amplifying latent behavioral signatures while attenuating high-dimensional noise. The resultant graph structure not only preserves intrinsic attribute relationships but also enables efficient spectral partitioning through the graph Laplacian eigen decomposition framework.
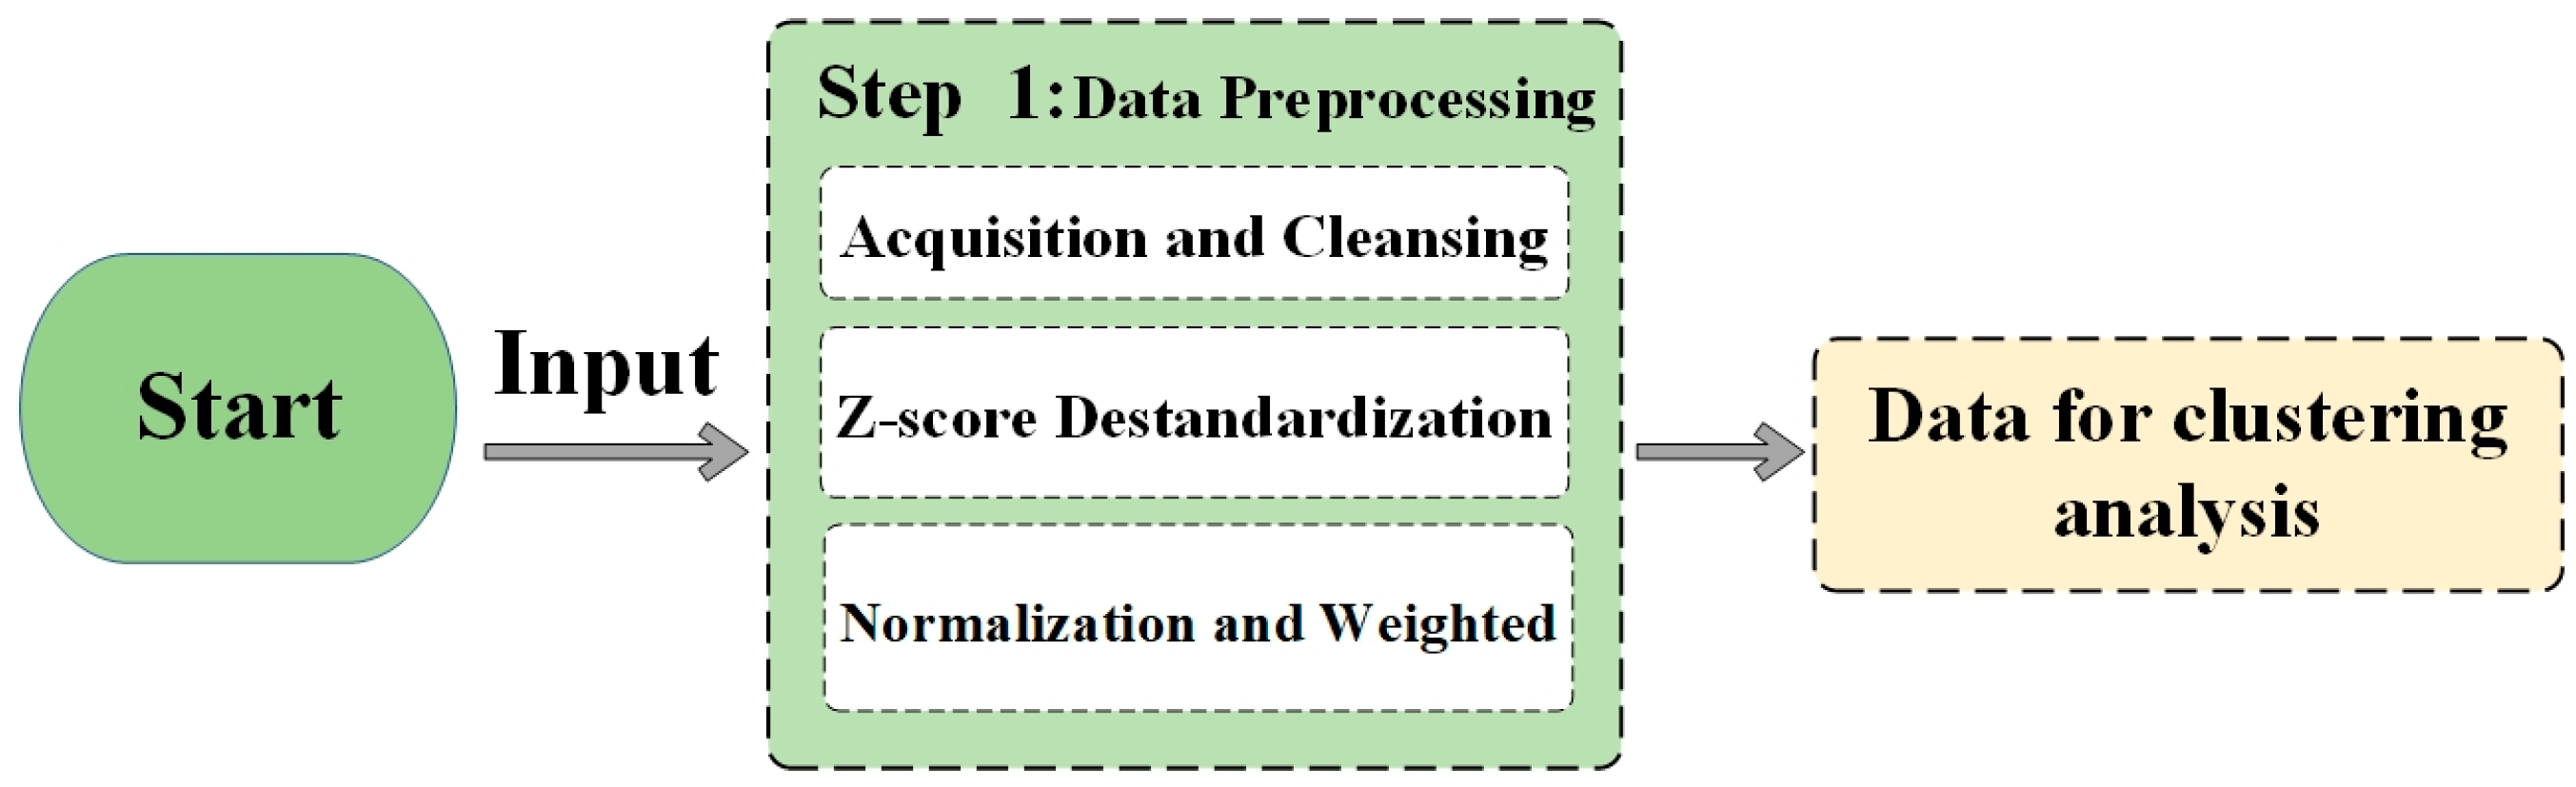
The clustering model for campus network user behavior analysis is presented through data preprocessing and a clustering process.
Figure 3 focuses on the data preprocessing steps. As shown in
Figure 3, the process starts with the acquisition and cleansing of the relevant data sources. This is followed by Z-score standardization, which standardizes the data to a common scale, ensuring that different attributes are comparable. Subsequently, weighted normalization is carried out to handle attributes with close relationships but non-comparable data, as described in
Figure 3.
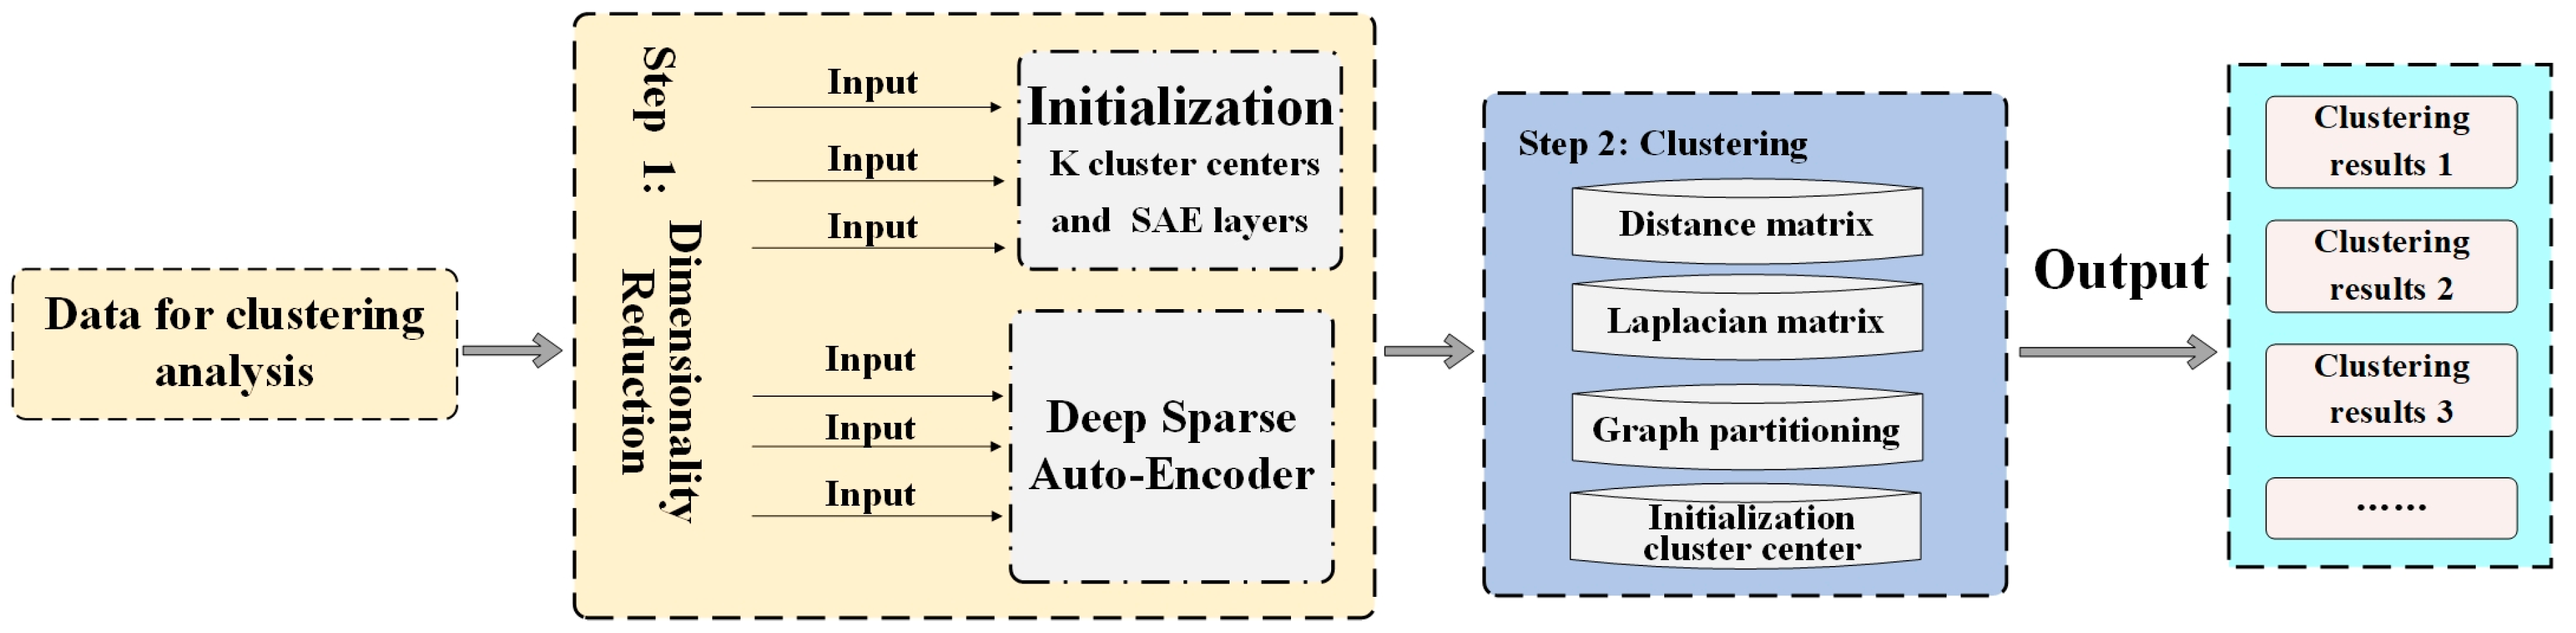
After preprocessing, the data are ready for the clustering process, which is depicted in
Figure 4. In
Figure 4, the preprocessed data first undergoes dimensionality reduction using a deep sparse auto-encoder. This step helps in reducing the complexity of the data while retaining their most important features. The matrix is then converted into a graph, which is further processed through a Laplacian matrix transformation. Finally, graph partitioning is performed to divide the data into distinct clusters, enabling the identification of user behavior patterns in the campus network. These two figures together comprehensively illustrate the entire clustering model for campus network user behavior analysis.
4. Algorithm
The top-level steps of the algorithm are shown in Algorithm 1. The dataset is preprocessing by Algorithm 2. Then it will be subjected to dimensionality reduction (Lines 2–3). The next is the core clustering process (Lines 4–10), then the clustering result is returned as the approximation of the final result (Line 11).
| Algorithm 1 All Steps of GTSDC |
Input dataset; n; k
Output clustering results
- 1.
The result of Algorithm 2 - 2.
// Dimensionality reduction - 3.
// Regularization into its objective function - 4.
// Distance matrix - 5.
Matrix converted to graph - 6.
// Laplacian matrix transformation - 7.
- 8.
for all v in L(i, j) - 9.
S ← Preprocesseddata ⟷ URLs - 10.
RVec → Construct feature vectorspace - 11.
use RVec→ Clustering Result - 12.
end
|
The data preprocessing of the algorithm is shown in Algorithm 2.
| Algorithm 2 Web Log Attribute Fusion Preprocessing |
Input web access log database
Output preprocessed data
- 1.
gen_data(database) - 2.
f var misrate ≥ 80%→ delate var - 3.
for each null in alldata - 4.
all null ⟷ fill (dummy variable, other) - 5.
f P(|x − μ | > 3σ) ≤ 0.003 - 6.
ioutliers ← find information loss - 7.
noise processing ⟷ obs = x + ε - 8.
metadata ← non-empty(datavase)// Data integration - 9.
// Z-score standardization - 10.
s = c1x + c2y + …+ cnz// Weighted normalization - 11.
end
|
This section may be divided by subheadings. It should provide a concise and precise description of the experimental results and an interpretation of the results, as well as the experimental conclusions that can be drawn.
5. Experiments
During our experiments, all analyses were conducted on an Inspur NF8460M4 high-performance server within a controlled laboratory environment. The server was equipped with an Intel Xeon E5-4607 v4 CPU (8 cores, 2.2 GHz), with 16 GB of RAM, and an NVIDIA GeForce GT 1030 GPU with 2 GB of DDR4 VRAM, providing robust computational capabilities. Additionally, the system featured 120 TB of storage, ensuring ample space to accommodate the datasets used in our study. We leveraged the Python 3.11 programming language to implement our algorithms and models. For this experiment, we utilized the MNIST dataset from the National Institute of Standards and Technology (NIST), the COIL20 dataset from Columbia University, and the USER_DATA, which consists of campus network user access log data from 1 March to 1 April 2024, provided by the Information Office at Henan University of Technology. Dataset information is presented in
Table 1.
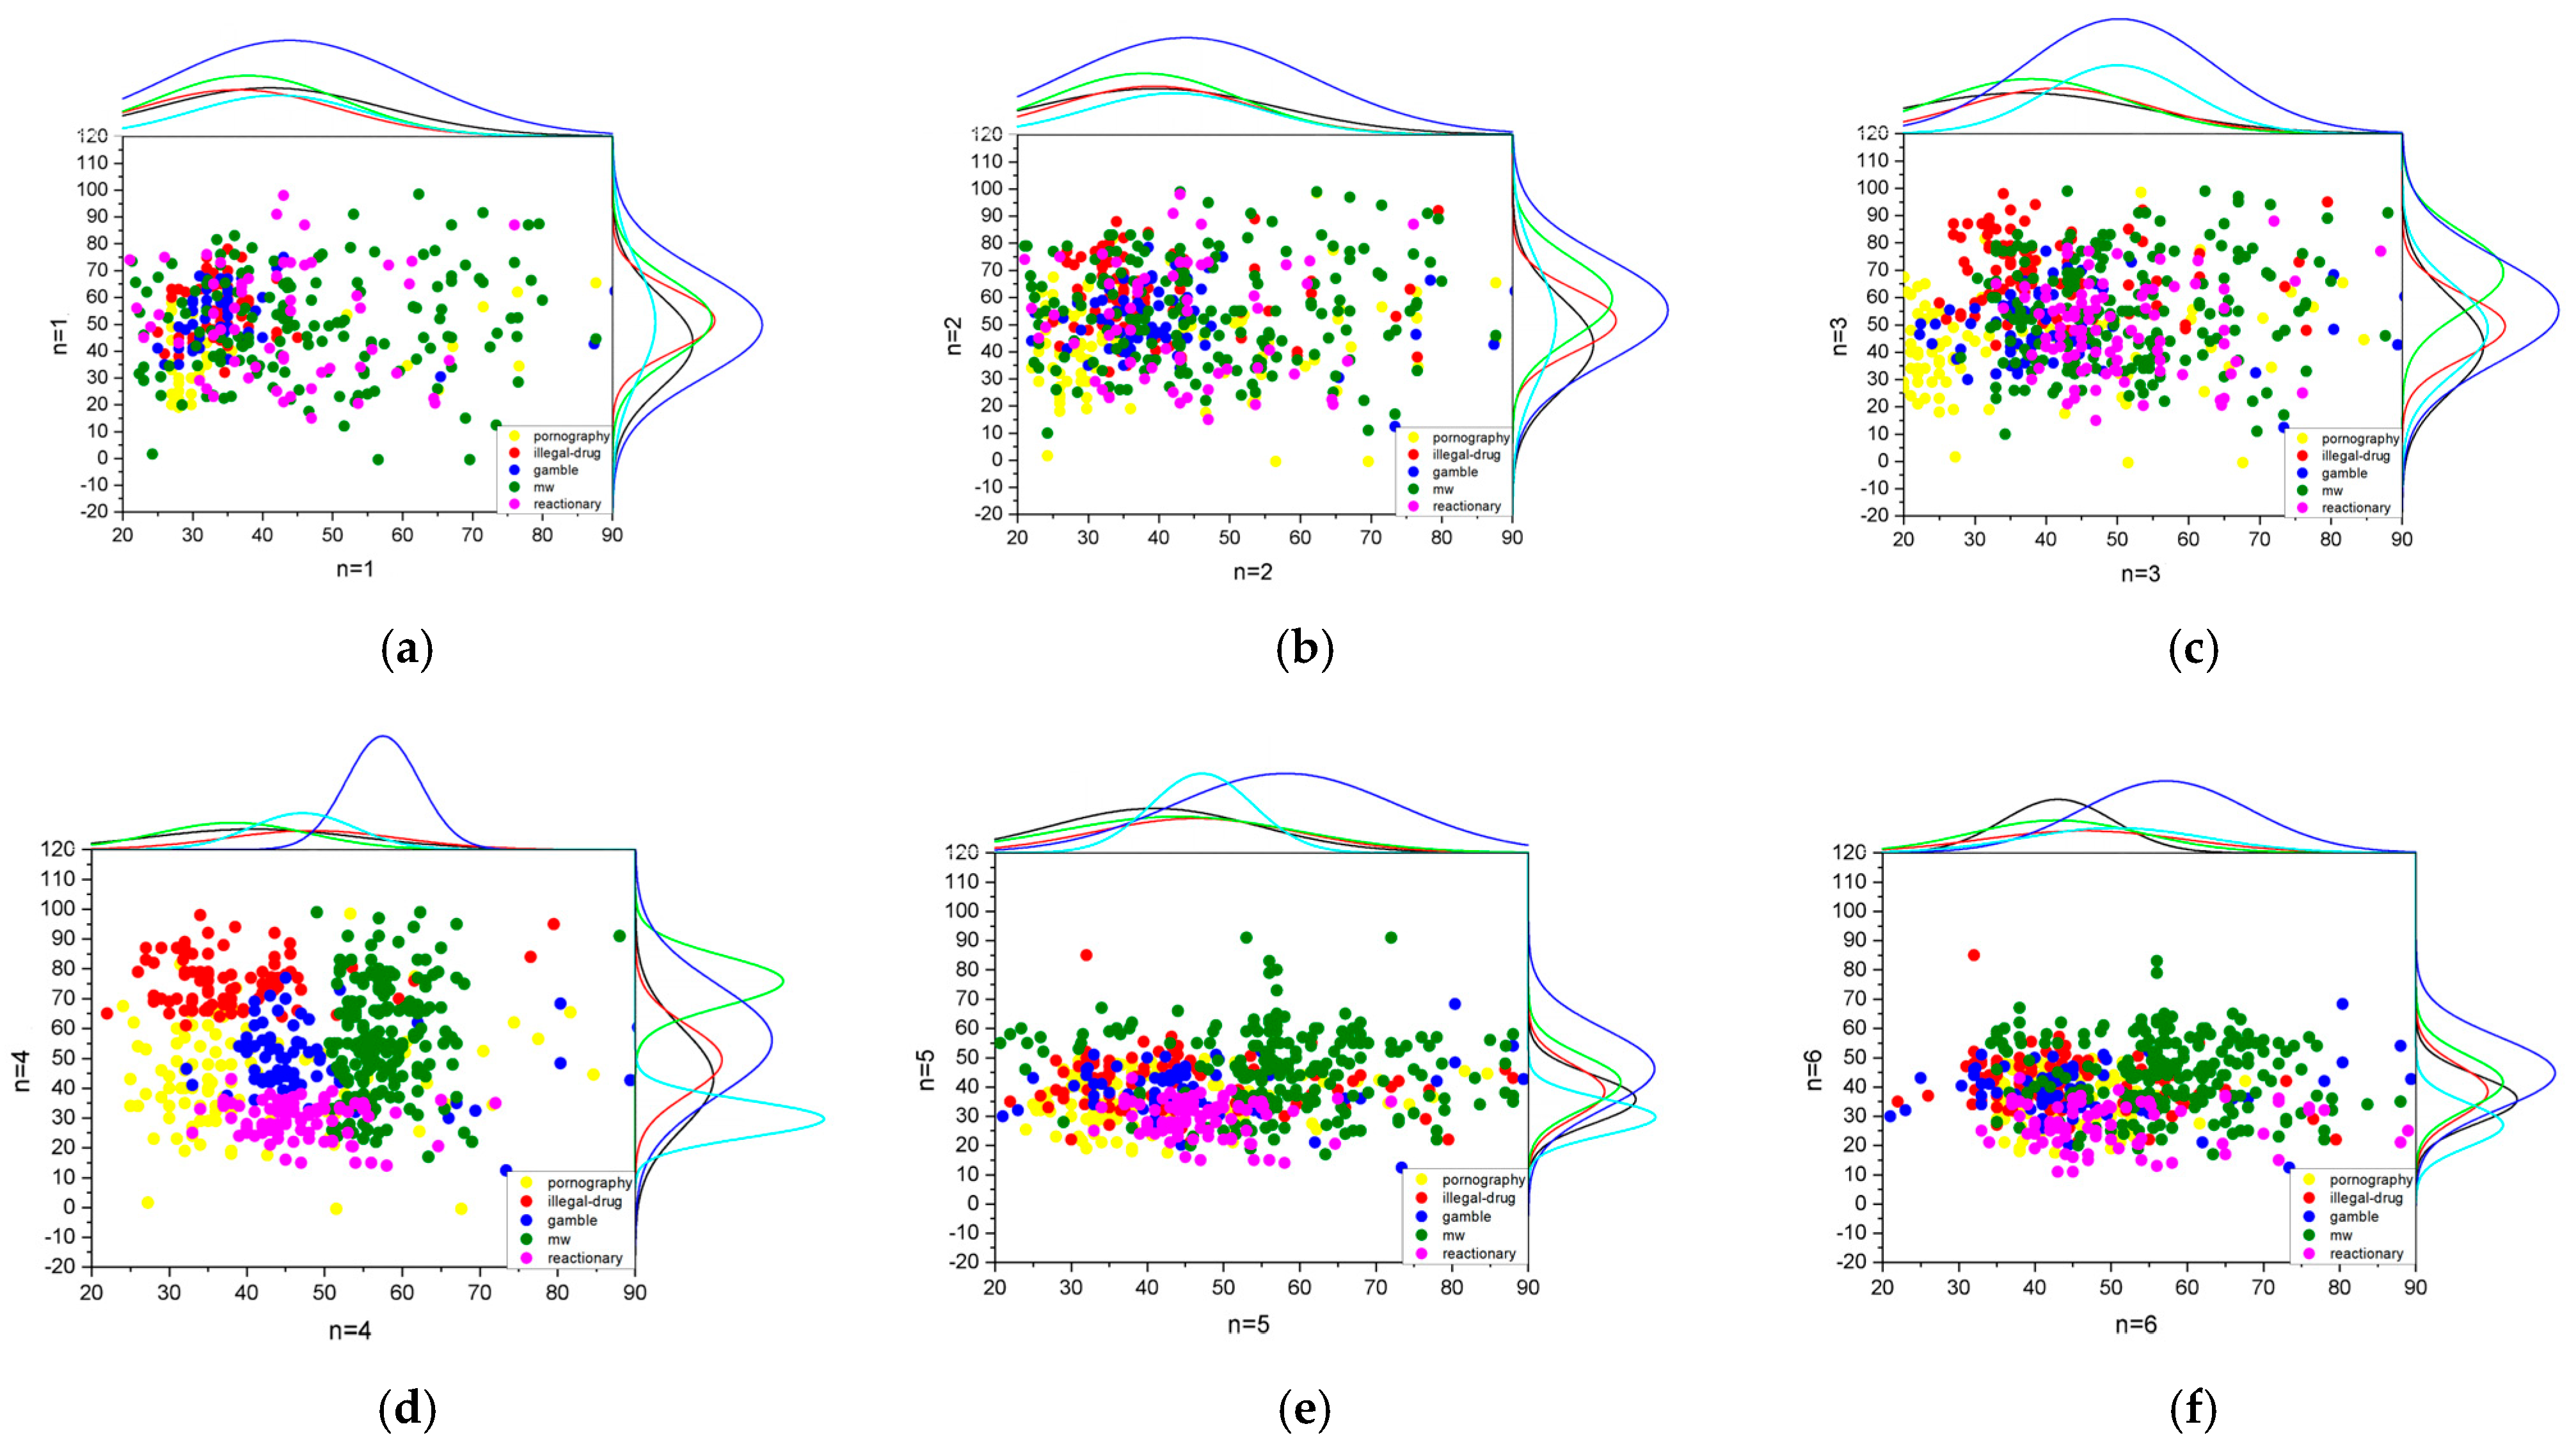
To demonstrate the superiority of the improved GTSDC algorithm in data dimensionality reduction compared to common dimensionality reduction methods, we conducted the following experiments. We compared the dimensionality reduction effects of DSAE models with different numbers of layers on the USER_DATA dataset to determine the optimal number of layers for the model. The experimental results are depicted in
Figure 5; n refers to the total number of layers in the GTSDC model.
Figure 5 illustrates the visualization results using a subset of users’ undesirable behavior data, highlighting the varying effectiveness of dimensionality reduction with different numbers of layers. When
n = 1, 2, and 6, the dimensionality reduction leads to a poor segregation, with the five categories intermingling. When
n = 3 and 5, there is a moderate improvement in the reduction outcome, though considerable overlap persists. The optimal dispersion of distinct data samples is observed when
n = 4, indicating the superior performance of the DSAE model at this layer depth. Consequently, we have determined that a four-layer configuration is optimal for the DSAE model.
Assessment metrics for experimental models are instrumental in determining whether the models meet expectations. Precision and Recall are two widely used metrics for evaluating model performance, and the F1-Score, representing the harmonic mean of Precision and Recall [
41,
42,
43], is also a commonly employed indicator. Below is a detailed explanation and analysis of the model evaluation metrics.
Precision. Precision indicates the proportion of true instances among the positive samples identified by the experimental model. There are two scenarios in which the model predicts positive samples: one is correctly predicted, denoted as True Positive (TP), and the other is incorrectly predicted, where a negative sample is falsely categorized as positive, denoted as False Positive (FP).
Recall. Recall represents the proportion of positive samples that are correctly predicted out of the total samples. There are two outcomes in calculating recall: one is the correct prediction of the originally positive class, and the other is the incorrect prediction of the positive class as negative.
F1-Score. In order to assess the performance of an algorithm, certain threshold criteria must be established. For instance, in linear regression models like Logistic Regression (LR), which takes multiple numerical input and output values only between 0 and 1, it is easy to determine if the output is sufficiently good. Therefore, for the GTSDC clustering algorithm proposed in this paper, there should be a scientific threshold standard for judgment. Establishing an appropriate threshold standard requires a one-to-one correspondence between each threshold and both Precision and Recall. We understand the importance of comprehensively justifying our choice of evaluation metrics. While accuracy is a commonly used metric in many classification tasks, in the context of our study on campus network user behavior analysis, it has limitations. Given the likely class imbalance in behavior categories, accuracy can be misleading. For example, if a vast majority of the data belong to one dominant class (such as normal web-browsing behavior), a model that simply predicts this dominant class for all instances can achieve a high accuracy. However, this does not necessarily mean that the model is effectively identifying the minority classes, such as those related to abnormal or sensitive behaviors. By using the F1-Score, we can better evaluate the performance of our model across different behavior categories, regardless of their prevalence in the dataset. This gives us a more accurate picture of the model’s effectiveness in identifying both common and rare behavior patterns, which is essential for our goal of understanding and managing campus network user behavior. However, in practice, it is challenging to enhance Precision and Recall simultaneously. Typically, the choice of threshold is based on the specific requirements of the algorithm model being constructed. If the model emphasizes Precision, then Recall may not be considered concurrently, and vice versa. The F1-Score provides a balance between Precision and Recall, taking both into account to achieve the highest possible values while maintaining equilibrium. The F1-Score formula is presented as follows:
With this experimental setup in mind, we can now discuss the scalability of the GTSDC method. Regarding scalability, we anticipate that GTSDC would remain efficient on larger datasets. The GTSDC method is designed with an optimized structure. Its dimensionality reduction step using the deep sparse auto-encoder not only reduces the complexity of the data but also speeds up the subsequent processing steps. As the dataset size increases, the Laplacian matrix transformation and graph partitioning algorithms used in GTSDC can scale relatively well because they are based on efficient matrix operations. Although the computational time will increase with larger datasets, the rate of increase is expected to be manageable due to the algorithm’s inherent properties. However, further extensive testing on extremely large-scale datasets is needed to fully validate this hypothesis.
Clustering algorithms are inherently unsupervised, but, when integrated with deep learning, they can become either supervised or unsupervised methods. This paper evaluates the quality of clustering results under the premise of known true labels, effectively using supervised data to assess the outcomes of unsupervised training. The primary concept is to employ the clustering results as pseudo-labels for self-supervised signals to guide the training task; that is, when deep learning is combined with clustering algorithms to form a supervised approach, it typically requires some labeled data for training, and, in such cases, its accuracy can be calculated by comparing the differences between the clustering results and the known labels. Consequently, the experimental model evaluation metrics in this paper are Precision, Recall, and the F1-Score.
Analyzing the online behavior information of users within the campus network, the clustering calculations are performed according to the GTSDC algorithm. The resulting confusion matrices are presented as
Figure 6.
The confusion matrix provides a summary of the predicted outcomes in clustering problems, aggregating quantities through count values. In
Figure 6, K1–K17 represent 17 categories of themes. The meanings corresponding to each value are detailed in
Table 2. Test1–Test11 denote the number of test trials. These reflect the precision of the clustering to varying degrees.
To validate the effectiveness of the GTSDC algorithm in clustering undesirable behaviors among user groups, this paper compares the improved GTSDC algorithm with 10 other clustering methods, including the dynamic sparse subspace clustering (DSSC) algorithm, deep subspace clustering (dlsc) algorithm, k-nearest neighbors subspace clustering (ksc) algorithm, and the CLIQUE algorithm.
Table 3 displays the experimental conditions of the three datasets under the same layer model.
The results presented in
Table 3 demonstrate that the proposed GTSDC algorithm exhibits a more pronounced advantage in accuracy compared to other algorithms. Clustering experiments conducted across three different types of datasets show that the GTSDC algorithm yields stable clustering outcomes with accuracy rates higher than most clustering algorithms, confirming the universal applicability of the GTSDC algorithm presented in this paper.
In the large-scale dataset USER_DATA, methods such as DSSC, DT, and KSC exhibit excessive fluctuations. In conjunction with
Table 3, the clustering methods DC, DLSC, and RF yield comparatively promising clustering precision. However, upon holistic consideration, the GTSDC algorithm surpasses the aforementioned clustering algorithms in both accuracy and operational efficiency. The algorithm’s performance is generally stable, demonstrating enhanced capabilities in processing large datasets. Within the MINIST dataset, the visualization results more clearly reveal the volatility of clustering algorithms, with the GTSDC algorithm showing commendable performance and the strongest combined accuracy and time efficiency. In the COIL20 dataset, due to the smaller total amount of data, all 11 clustering algorithms perform admirably, with the GTSDC algorithm achieving a clustering accuracy as high as 93%.
6. Discussion
The experimental results demonstrate the superiority of GTSDC across diverse datasets, yet several critical insights warrant further elaboration. First, the 91% accuracy achieved on USER_DATA can be attributed to the synergy between the four-layer DSAE architecture and normalized cut optimization. The DSAE effectively reduces dimensionality while preserving discriminative behavioral features, whereas the NCut criterion balances intra-cluster cohesion and inter-cluster separation, mitigating the “curse of dimensionality” inherent in high-dimensional behavioral data. Second, the stable performance of GTSDC on MNIST and COIL20 (74% and 90% F1-Score, respectively) underscores its generalizability. Unlike DSSC and DLSC, which rely on Euclidean metrics, our graph-theoretic approach captures topological dependencies (e.g., temporal traffic patterns in campus networks), enabling robust clustering even under attribute heterogeneity. This aligns with findings in [
20,
29], where graph-based representations improved clustering stability.
Two limitations should be noted, however: (1) The current framework assumes static user behavior patterns, overlooking dynamic shifts in network usage (e.g., seasonal exam periods); (2) While GTSDC enhances interpretability through subspace partitioning, it does not fully address ethical concerns related to behavioral profiling, such as privacy preservation in personalized educational services. Future work could integrate differential privacy mechanisms [
39] to reconcile utility and confidentiality.
Compared to prior studies, our method advances the field in three areas:
Integration of sparse and graph constraints: Unlike sparse subspace clustering [
33] or standalone graph partitioning [
29], GTSDC unifies these paradigms, optimizing both feature sparsity and structural semantics.
Explainability: The normalized cut-based partitioning provides transparent cluster boundaries, facilitating behavior-aware resource allocation—a gap in existing deep clustering frameworks [
17,
18,
19].
Scalability: The adoption of sparse Laplacian matrices (
Section 3.3) ensures computational tractability for large-scale datasets, despite the inherent cubic complexity of exact spectral decomposition.
These advancements position GTSDC as a versatile tool for behavioral analytics beyond campus networks, such as IoT device management or e-commerce user profiling.
7. Conclusions
This study proposes the graph-theoretic subspace deep clustering (GTSDC) algorithm, a novel framework that synergizes deep sparse auto-encoders with graph partitioning to address high-dimensional behavioral pattern recognition in campus networks. To overcome the attribute incompatibility inherent in raw user access logs, we implement a two-stage preprocessing strategy: Z-score standardization preserves intrinsic data distributions, followed by normalized weighting to reconcile heterogeneous feature scales. Leveraging the sparsity-inducing properties of deep auto-encoders, the architecture adaptively reduces data dimensionality while retaining discriminative behavioral signatures. Crucially, the integration of normalized cut (NCut) graph partitioning circumvents local optima traps endemic to conventional clustering methods, enabling globally coherent cluster identification.
Experimental results indicate that the proposed GTSDC algorithm significantly outperforms existing methods. Specifically, on the USER_DATA benchmark, the algorithm achieves 91% accuracy—a 120% improvement over traditional CLIQUE subspace clustering. Comparable enhancements are observed in MNIST (79% precision gain) and COIL20 (60% performance increase), underscoring its universal applicability under standardized experimental conditions. These outcomes validate the model’s dual capability to optimize network resource allocation through behavior-aware bandwidth management and to facilitate personalized educational services via refined user profiling.
While demonstrating broad utility, the current study acknowledges limitations in subject granularity. Future investigations will incorporate demographic dimensions—including gender, academic discipline, and educational level—to enable fine-grained behavioral stratification. For example, by analyzing historical data, we can identify the typical time periods when STEM majors conduct lab simulations, which often require significant computational resources and high-speed network connections. This allows us to prioritize bandwidth allocation during these peak times, ensuring a seamless learning experience. In terms of personalized educational services, we can analyze the research interests and academic requirements of students from different disciplines. For humanities students, we might recommend digital archives, online literary resources, and collaborative writing platforms. For science students, we could suggest advanced research databases, data visualization tools, and simulation software.
To address the associated data integration challenges while safeguarding user privacy, we will employ privacy-aware techniques such as secure hashing for anonymized demographic data linkage. This method encrypts personal information, ensuring that data privacy is maintained throughout the integration process. Additionally, we will develop attention-based fusion methods, such as transformer encoders. These methods leverage self-attention mechanisms to effectively analyze and combine sparse behavioral traces with demographic attributes. By focusing on the most relevant features within the data, the model can better understand the behavior patterns of different student groups, enabling more accurate predictions and insights.
Author Contributions
Conceptualization, J.L. and Q.H.; Data curation, J.L.; Formal analysis, Q.H.; Funding acquisition, Y.T.; Investigation, J.W.; Methodology, J.L.; Project administration, Q.H.; Resources, J.L.; Software, J.W.; Supervision, Y.T. and J.Y.; Validation, J.Y.; Visualization, Q.H.; Writing—original draft, Q.H.; Writing—review & editing, J.L. All authors have read and agreed to the published version of the manuscript.
Funding
This research was funded by the Henan Province Major Public Welfare Special Project, grant number 201300311200.
Data Availability Statement
Due to the nature of this research, participants of this study did not agree for their data to be shared publicly, so supporting data are not available.
Conflicts of Interest
Author Jing Wang was employed by the company “Beijing Taiji Information System Technology Co., Ltd.”. The remaining authors declare that the research was conducted in the absence of any commercial or financial relationships that could be construed as a potential conflict of interest.
References
- Oberascher, M.; Kinzel, C.; Kastlunger, U.; Schöpf, M.; Grimm, K.; Plaiasu, D.; Rauch, W.; Sitzenfrei, R. Smart water campus—A testbed for smart water applications. Water Sci. Technol. 2022, 86, 2834–2847. [Google Scholar] [CrossRef] [PubMed]
- Yalcin, A.; Kaw, A.; Clark, R. On learning platform metrics as markers for student success in a course. Comput. Appl. Eng. Educ. 2023, 31, 1412–1432. [Google Scholar] [CrossRef]
- Hu, H.; Zhang, G.; Gao, W.; Wang, M. Big data analytics for MOOC video watching behavior based on Spark. Neural Comput. Appl. 2020, 32, 6481–6489. [Google Scholar] [CrossRef]
- Howard, P.E.; Rainie, L.; Jones, S. Days and Nights on the Internet: The Impact of a diffusing Technology. Am. Behav. Sci. 2001, 45, 383–404. [Google Scholar] [CrossRef]
- Murata, T.; Saito, K. Extracting Users’ Interests from Web Log Data. In Proceedings of the ACM international Conference on Web Intelligence, Hong Kong, China, 18–22 December 2006; pp. 343–346. [Google Scholar]
- Neelima, G.; Rodda, S. Predicting user behavior through session using the web log mining. In Proceedings of the International Conference on Advances in Human Machine Interaction, Kodigehalli, India, 3–5 March 2016; pp. 1–5. [Google Scholar]
- Yang, X.; Zhang, H.; Chen, R.; Li, S.; Zhang, N.; Wang, B.; Wang, X. Research on Forecasting of Student Grade Based on Adaptive K-Means and Deep Neural Network. Wirel. Commun. Mob. Comput. 2022. [Google Scholar] [CrossRef]
- Hamdipour, A.; Basiri, A.; Zaare, M.; Mirjalili, S. Artificial rabbits optimization algorithm with automatically DBSCAN clustering algorithm to similarity agent update for features selection problems. J. Supercomput. 2024, 8, 150. [Google Scholar] [CrossRef]
- Liu, G.; Sun, X.; Li, H.; Guo, Z.; Li, Y.; Pi, S. Knowledge-enhanced heterogeneous graph attention networks for privacy co-disclosure detection in online social network. Expert Syst. Appl. 2025, 268, 126266. [Google Scholar] [CrossRef]
- Sadeghian, P.; Han, M.; Håkansson, J.; Zhao, M.X. Testing feasibility of using a hidden Markov model on predicting human mobility based on GPS tracking data. Transp. B-Transp. Dyn. 2024, 12, 2336037. [Google Scholar] [CrossRef]
- Liu, A.; Li, B.; Wang, Y.; Yang, Z. Friend Link Prediction Method Based on Heterogeneous Multigraph and Hierarchical Attention. Appl. Artif. Intell. 2025, 39, 2427545. [Google Scholar] [CrossRef]
- Johansson, U.; Sonstrod, C.; Lofstrom, T.; Bostrom, H. Rule extraction with guarantees from regression models. Pattern Recognit. 2022, 126, 108554. [Google Scholar] [CrossRef]
- Zhang, H.; Lu, G.; Zhan, M.; Zhang, B. Semi-Supervised Classification of Graph Convolutional Networks with Laplacian Rank Constraints. Neural Process. Lett. 2022, 54, 2645–2656. [Google Scholar] [CrossRef]
- Maity, A.; Das, K.; Samanta, S.; Mondal, S.; Dubey, V. A study of cluster hypergraphs and its properties. Social network analysis and mining. 2021, 11, 20. [Google Scholar] [CrossRef] [PubMed]
- Xu, G.; Yang, M.; Wu, Q. Sparse subspace clustering with low-rank transformation. Neural Comput. Appl. 2019, 31, 3141–3154. [Google Scholar] [CrossRef]
- Heckel, R.; Bolcskei, H. Robust Subspace Clustering via Thresholding. IEEE Trans. Inf. Theory 2015, 61, 6320–6342. [Google Scholar] [CrossRef]
- Liu, C. Deep Clustering with Reinforcement Strategy. In Proceedings of the 2nd European Symposium on Computer and Communications (ESCC21), New York, NY, USA, 16–18 April 2021; pp. 54–57. [Google Scholar]
- Jiang, L.; Ge, Z.; Song, Z. Semi-supervised fault classification based on dynamic Sparse Stacked auto-encoders model. Chemom. Intell. Lab. Syst. 2017, 168, 72–83. [Google Scholar] [CrossRef]
- Qureshi, A.S.; Khan, A.; Shamim, N.; Durad, M.H. Intrusion detection using deep sparse auto-encoder and self-taught learning. Neural Comput. Appl. 2020, 32, 3135–3147. [Google Scholar] [CrossRef]
- Lao, L.; Wu, X.M.; Wu, K.; Zhu, X.F. Graph theory with Modify-edge Clustering Algorithm Based on Maximum Weighted Entropy. In Proceedings of the 2006 6th World Congress on Intelligent Control and Automation, Dalian, China, 21–23 June 2006; pp. 9730–9733. [Google Scholar] [CrossRef]
- Fan, X.; Xie, Y.; Liao, Z.; Li, X.; Liu, L. A Weighted Cluster Ensemble Algorithm Based on Graph. In Proceedings of the IEEE 10th International Conference on Trust, Security and Privacy in Computing and Communications, Changsha, China, 16–18 November 2011; pp. 1519–1523. [Google Scholar] [CrossRef]
- Zhang, Y.; Liu, X.; Liu, W.; Zhu, C. Hybrid Recommender System Using Semi-supervised Clustering Based on Gaussian Mixture Model. In Proceedings of the 2016 International Conference on Cyberworlds (CW), Chongqing, China, 28–30 September 2016; pp. 155–158. [Google Scholar] [CrossRef]
- Zeng, S.; Duan, X.; Li, H.; Bai, J.; Tang, Y.; Wang, Z. A Rare Framework for Robust Possibilistic K-Subspace Clustering. IEEE Trans. Fuzzy Syst. 2022, 31, 1124–1138. [Google Scholar] [CrossRef]
- Peng, X.; Feng, J.; Xiao, S.; Yau, W.-Y.; Zhou, J.T.; Yang, S. Structured AutoEncoders for Subspace Clustering. IEEE Trans. Image Process. 2018, 27, 5076–5086. [Google Scholar] [CrossRef]
- Peng, X.; Xiao, S.; Feng, J.; Yau, W.; Yi, Z. Deep subspace clustering with sparsity prior. In Proceedings of the Twenty-Fifth International Joint Conference on Artificial Intelligence (IJCAI’16), New York, NY, USA, 9–15 July 2016; AAAI Press: Palo Alto, CA, USA; pp. 1925–1931. [Google Scholar]
- Wen, X.; Juan, H. PSubCLUS: A Parallel Subspace Clustering Algorithm Based On Spark. IEEE Access 2021, 9, 2535–2544. [Google Scholar] [CrossRef]
- Huang, H.; Xue, F.; Yan, W.; Wang, T.; Yoo, S.; Xu, C. Learning Associations between Features and Clusters: An Interpretable Deep Clustering Method. In Proceedings of the 2021 International Joint Conference on Neural Networks (IJCNN), Shenzhen, China, 18–22 July 2021; pp. 1–10. [Google Scholar] [CrossRef]
- Das, S.; Kyal, C.; Pratiher, S. On Sparsity Measures In Deep Subspace Clustering. In Proceedings of the 2022 Second International Conference on Power, Control and Computing Technologies (ICPC2T), Raipur, India, 1–3 March 2022; pp. 1–6. [Google Scholar] [CrossRef]
- Bu, Z.; Li, H.J.; Cao, J.; Wang, Z.; Gao, G. Dynamic Cluster Formation Game for Attributed Graph Clustering. IEEE Trans. Cybernetics 2019, 49, 328–341. [Google Scholar] [CrossRef]
- Hai, Y.; Wang, D.; Liu, Z.; Zheng, J.; Ding, C. A Study of Recommendation Methods Based on Graph Hybrid Neural Networks and Deep Crossing. Electronics 2024, 13, 4224. [Google Scholar] [CrossRef]
- Santhisree, K.; Damodaram, A. CLIQUE: Clustering based on density on web usage data: Experiments and test results. In Proceedings of the 2011 3rd International Conference on Electronics Computer Technology, Kanyakumari, India, 8–10 April 2011; pp. 233–236. [Google Scholar] [CrossRef]
- Yin, M.; Guo, Y.; Gao, J.; Xie, S.; He, Z. Kernel sparse subspace clustering on symmetric positive definite manifolds. In Proceedings of the IEEE Conference on Computer Vision and Pattern Recognition, Las Vegas, NV, USA, 27–30 June 2016; pp. 5157–5164. [Google Scholar]
- Elhamifar, E.; Vidal, R. Sparse subspace clustering: Algorithm, theory, and applications. IEEE Trans. Pattern Anal. Mach. Intell. 2013, 35, 2765–2781. [Google Scholar] [CrossRef]
- Kriegel, H.P.; Kröger, P.; Zimek, A. Subspace clustering. WIREs Data Min. Knowl Discov. 2012, 2, 351–364. [Google Scholar] [CrossRef]
- Patel, V.M.; Nguyen, H.V.; Vidal, R. Latent Space Sparse and Low-Rank Subspace Clustering. IEEE J. Sel. Top. Signal Process. 2015, 9, 691–701. [Google Scholar] [CrossRef]
- Zhang, Y.; Li, M. Motion Segmentation Using Collaborative Low-Rank and Sparse Subspace Clustering. In Proceedings of the 2017 13th International Conference on Computational Intelligence and Security (CIS), Hong Kong, China, 15–18 December 2017; pp. 409–414. [Google Scholar] [CrossRef]
- You, H.; Li, Y. Correlation Structured Low-Rank Subspace Clustering. In Proceedings of the 2020 IEEE 4th Information Technology, Networking, Electronic and Automation Control Conference (ITNEC), Chongqing, China, 12–14 June 2020; pp. 710–714. [Google Scholar] [CrossRef]
- Feng, J.S.; Lin, Z.C.; Xu, H.; Yan, S.C. Robust subspace seg-mentation with block-diagonal prior. In Proceedings of the 2014 IEEE Computer Society Conference on Computer Vision and Pattern Recognition (CVPR), Columbus, OH, USA, 23–28 June 2014; pp. 3818–3825. [Google Scholar]
- Halko, N.; Martinsson, P.G.; Tropp, J.A. Finding Structure with Randomness: Probabilistic Algorithms for Constructing Approximate Matrix Decompositions. Siam Rev. 2011, 53, 217–288. [Google Scholar] [CrossRef]
- Murthy, A.K. XML URL classification based on their semantic structure orientation for web mining applications. Procedia Comput. Sci. 2015, 46, 143–150. [Google Scholar] [CrossRef]
- Goutte, C.; Gaussier, E. A probabilistic interpretation of precision, recall and F-score, with implication for evaluation. In Advances in Information Retrieval: 27th European Conference on IR Research, ECIR 2005, Santiago de Compostela, Spain, 21–23 March 2005. Proceedings 27; Springer: Berlin/Heidelberg, Germany, 2005; pp. 345–359. [Google Scholar]
- Hemdan, E.E.D.; Shouman, M.A.; Karar, M.E. Covidx-net: A framework of deep learning classifiers to diagnose covid-19 in x-ray images. arXiv 2020, arXiv:2003.11055. [Google Scholar]
- Deshpande, H.S.; Ragha, L. A hybrid random forest-based feature selection model using mutual information and F-score for preterm birth classification. Int. J. Med. Eng. Inform. 2023, 15, 84–96. [Google Scholar]
| Disclaimer/Publisher’s Note: The statements, opinions and data contained in all publications are solely those of the individual author(s) and contributor(s) and not of MDPI and/or the editor(s). MDPI and/or the editor(s) disclaim responsibility for any injury to people or property resulting from any ideas, methods, instructions or products referred to in the content. |
© 2025 by the authors. Licensee MDPI, Basel, Switzerland. This article is an open access article distributed under the terms and conditions of the Creative Commons Attribution (CC BY) license (https://creativecommons.org/licenses/by/4.0/).


