
How Do Incentive Policy and Benefit Distribution Affect the Cooperative Development Mechanism of Intelligent Connected Vehicles? A Tripartite Evolutionary Game Approach


Abstract
1. Introduction
- (1)
- Does high government investment in infrastructure contribute to the long-term cooperative development of ICVs?
- (2)
- How does the amount of government subsidies affect the cross-border innovation cooperation between carmakers and technology companies?
- (3)
- How do carmakers and technology companies decide on the profit distribution to achieve the best combination of strategies, with the government’s industrial incentive policies? Who holds the dominant position during the cooperation process?
2. Related Studies
3. Methodology
4. Evolutionary Game Model
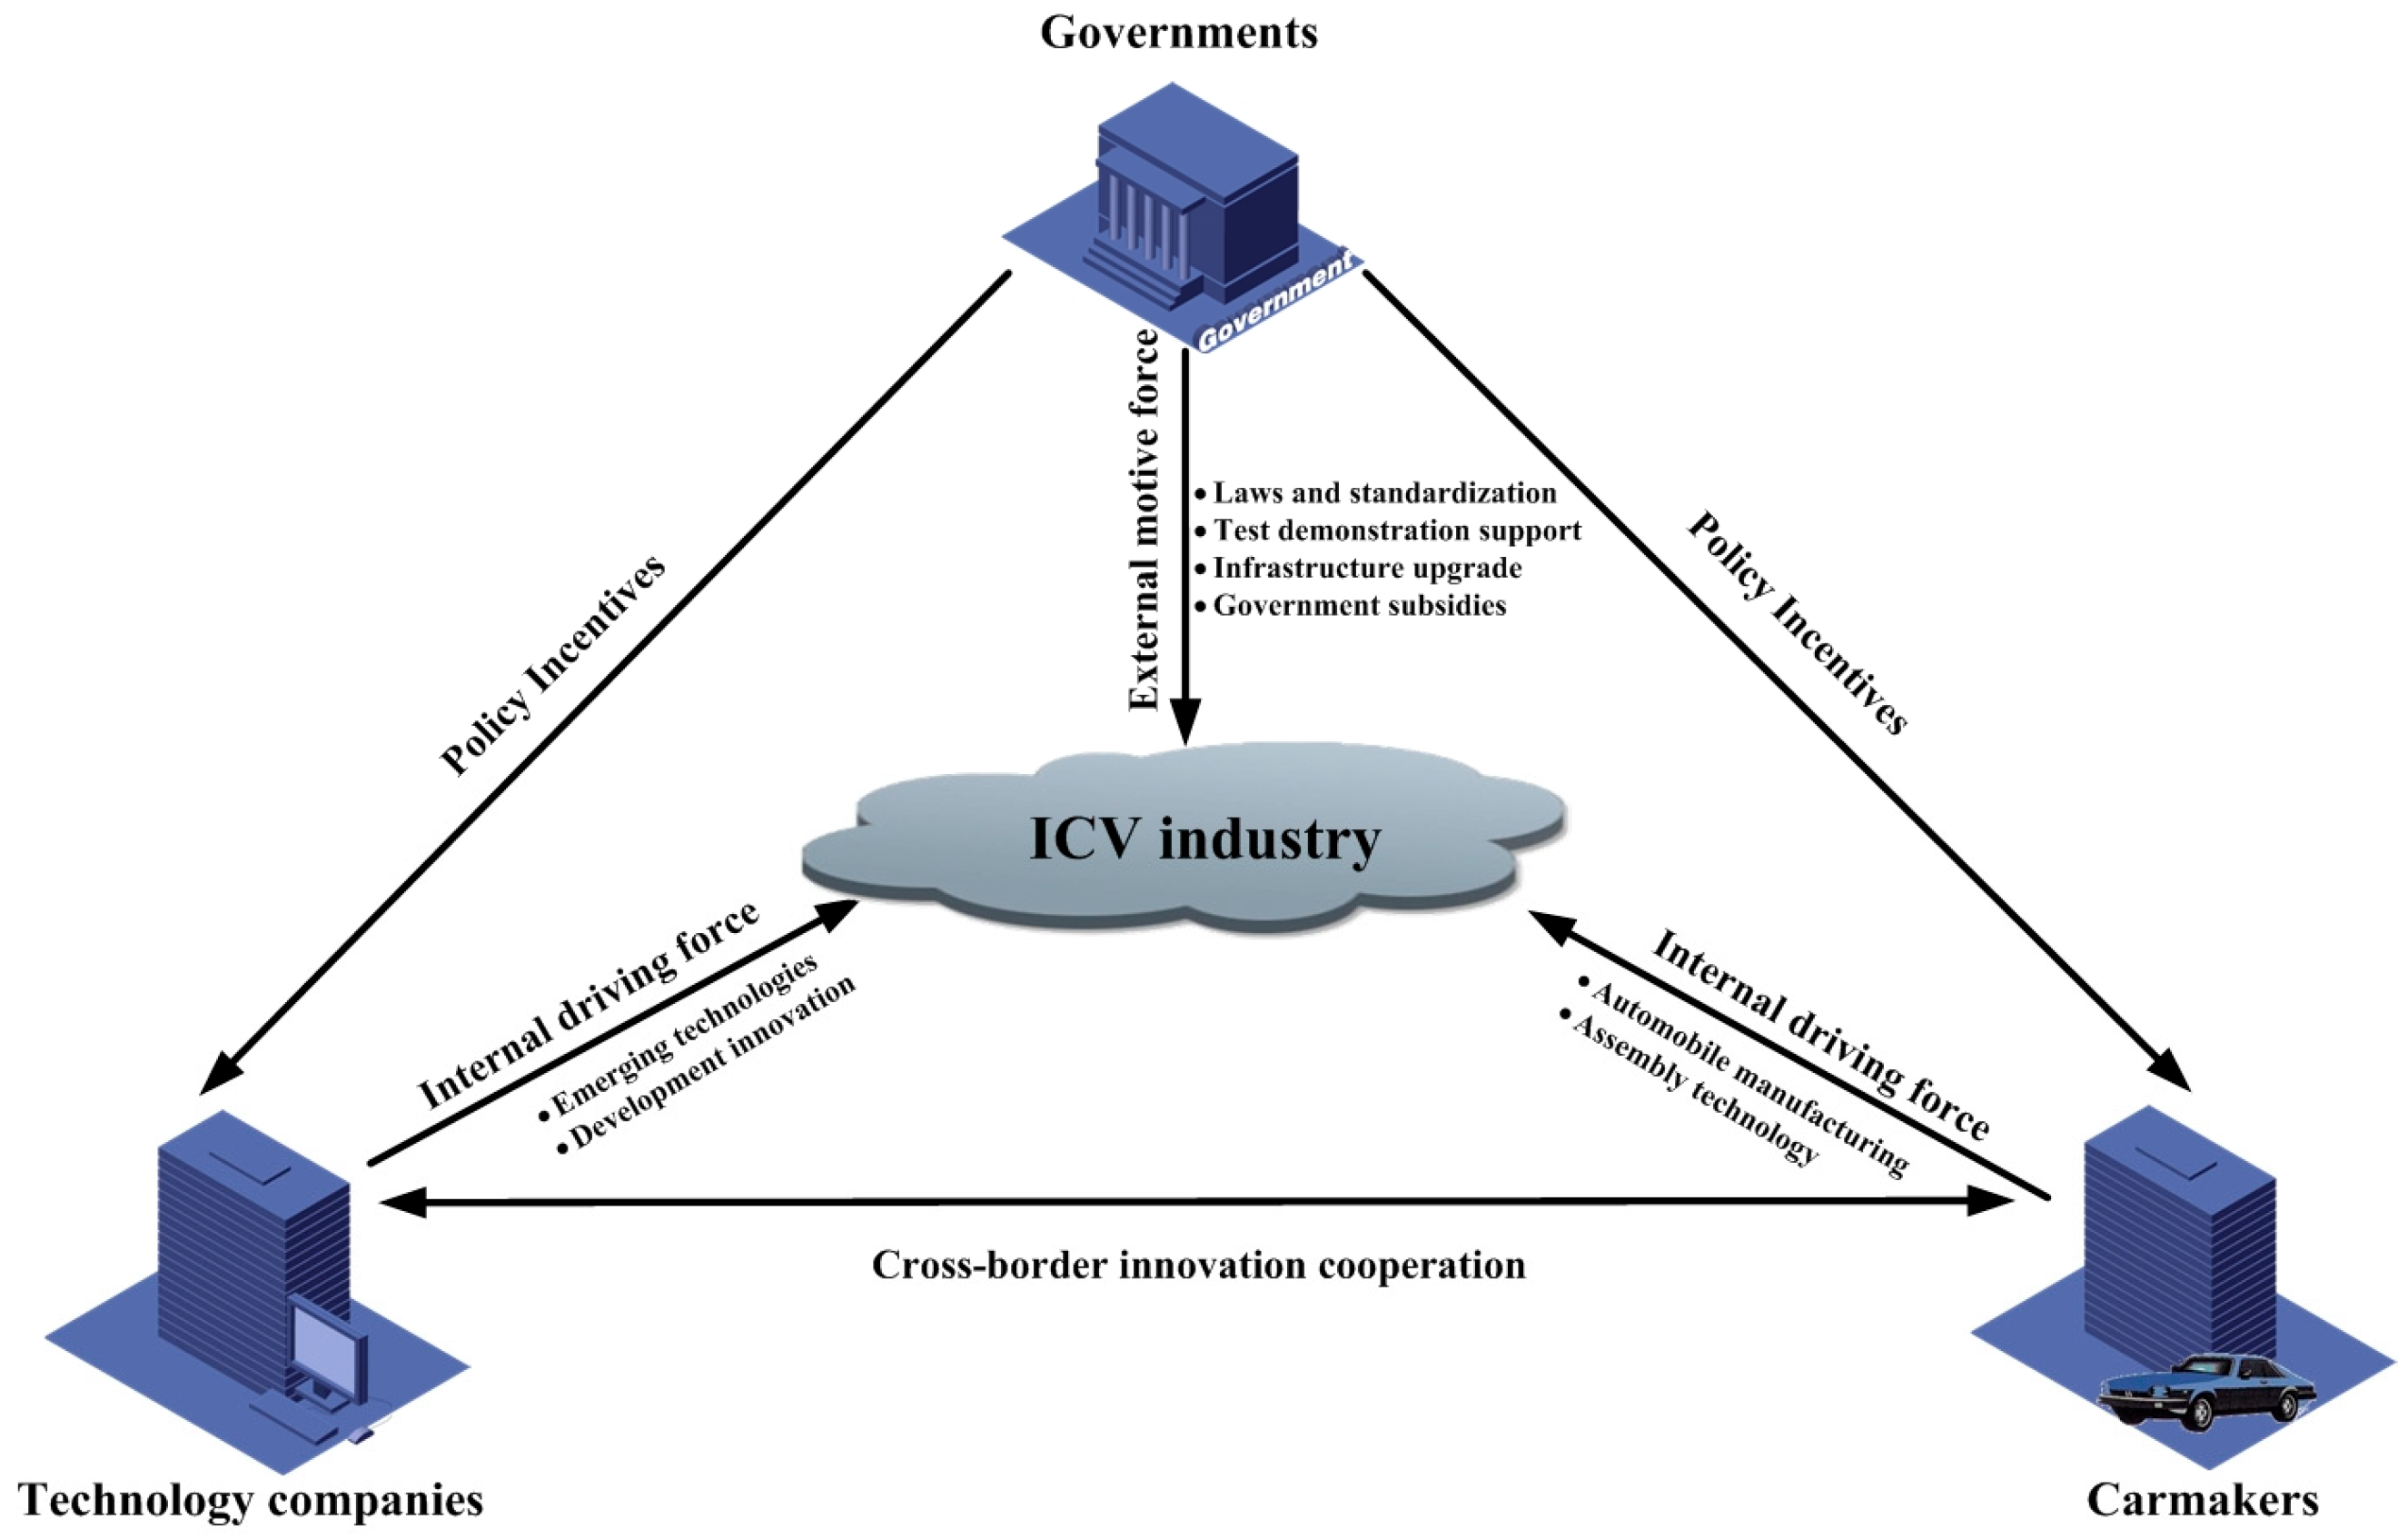
4.1. Market Structure
4.2. Model Assumptions
4.3. Model Framework
5. Model Analysis
5.1. Equilibrium Points
5.2. ESS Analysis
- ,
- ,
- ,
- ,
- ,
- ,
- , and
- .
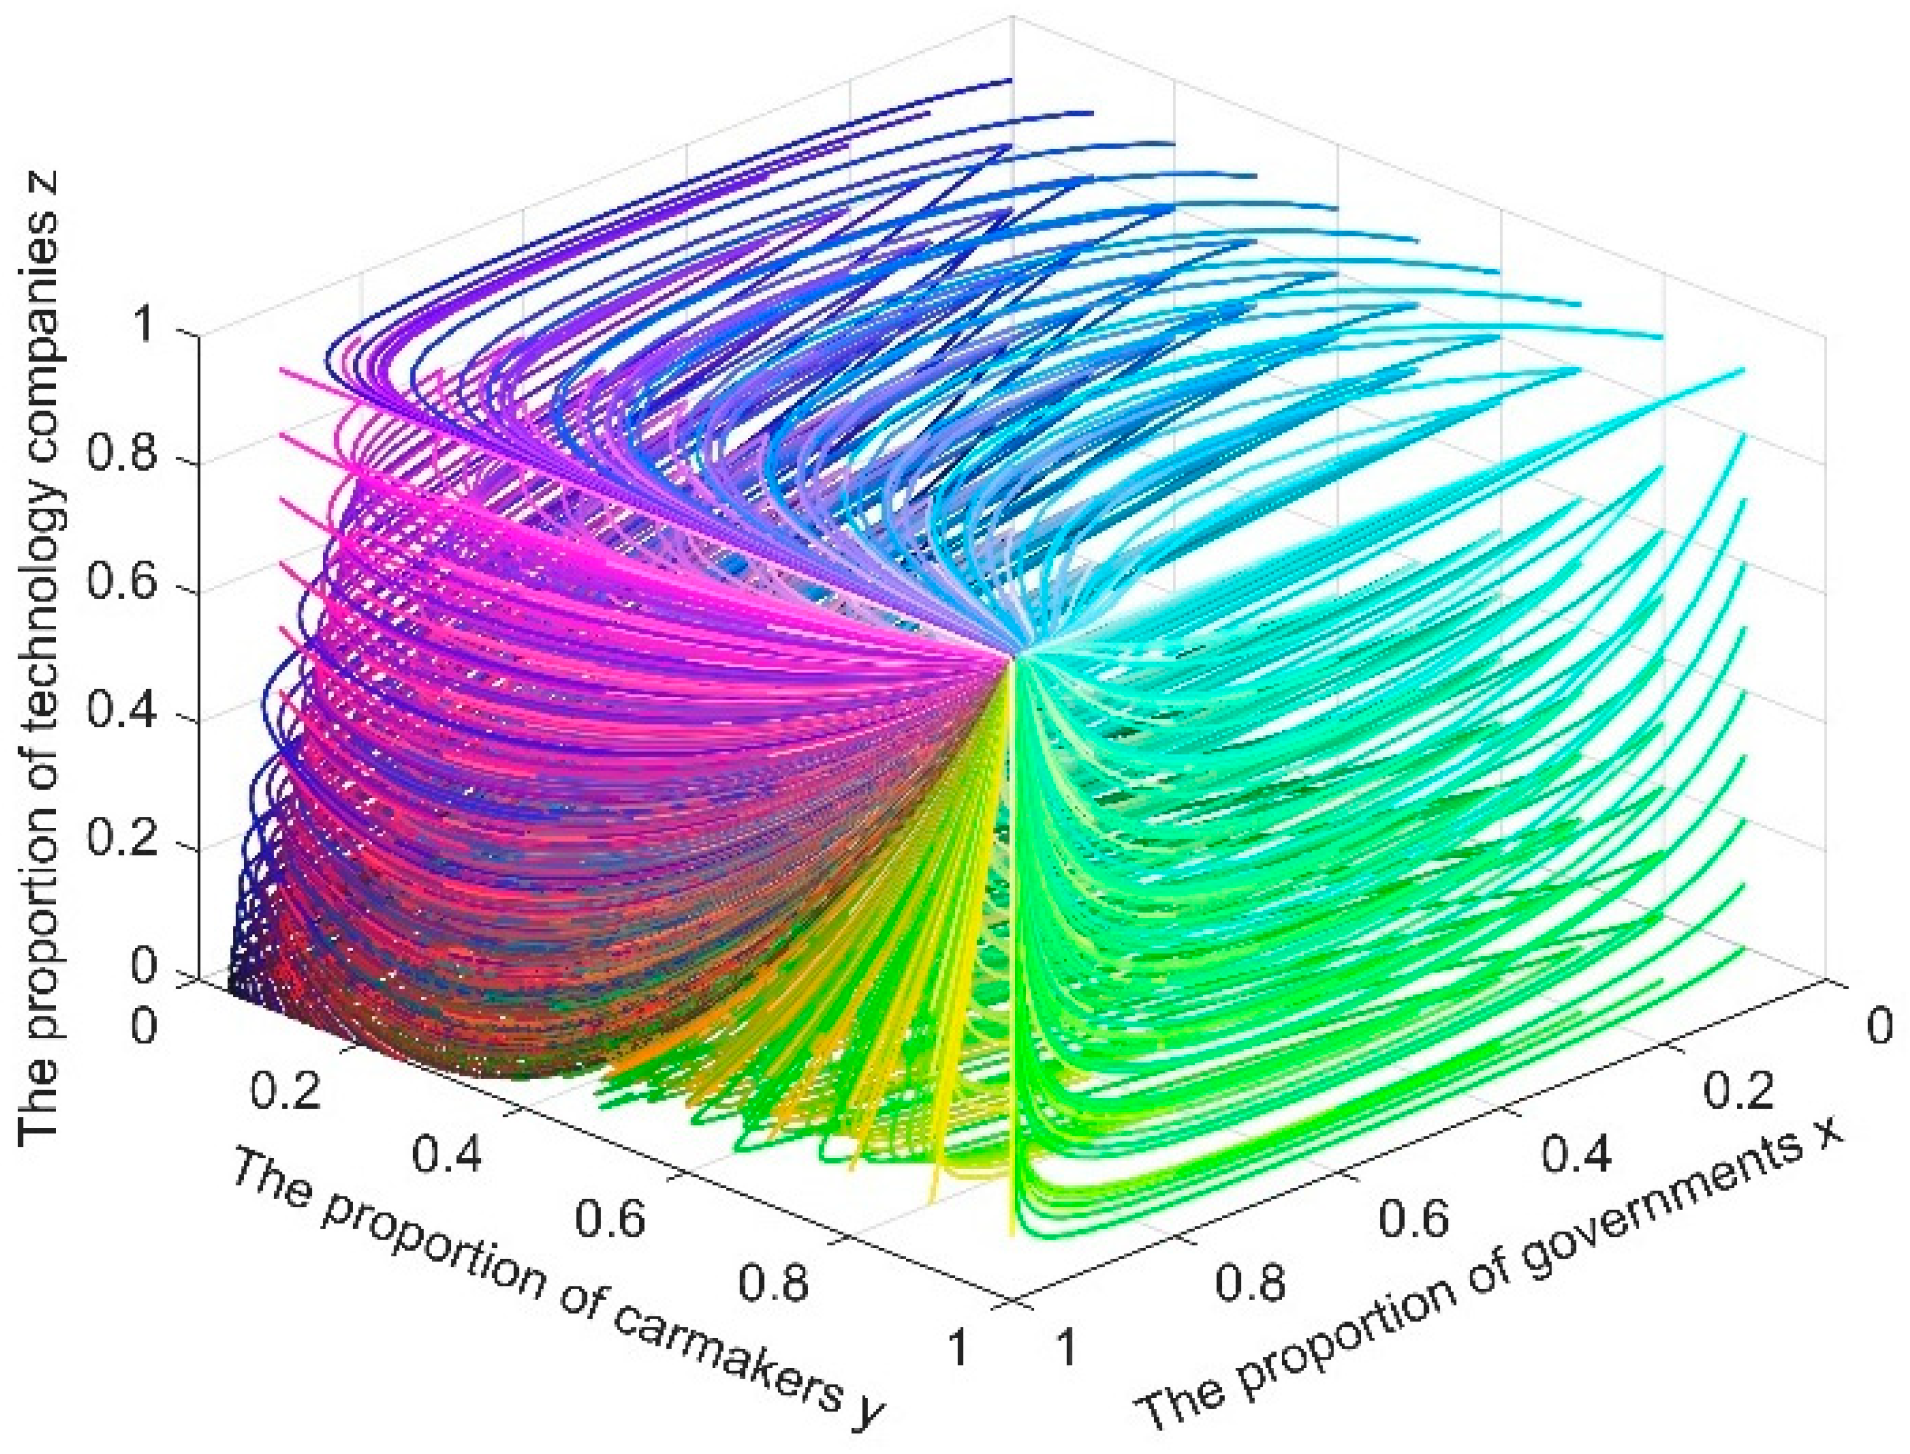
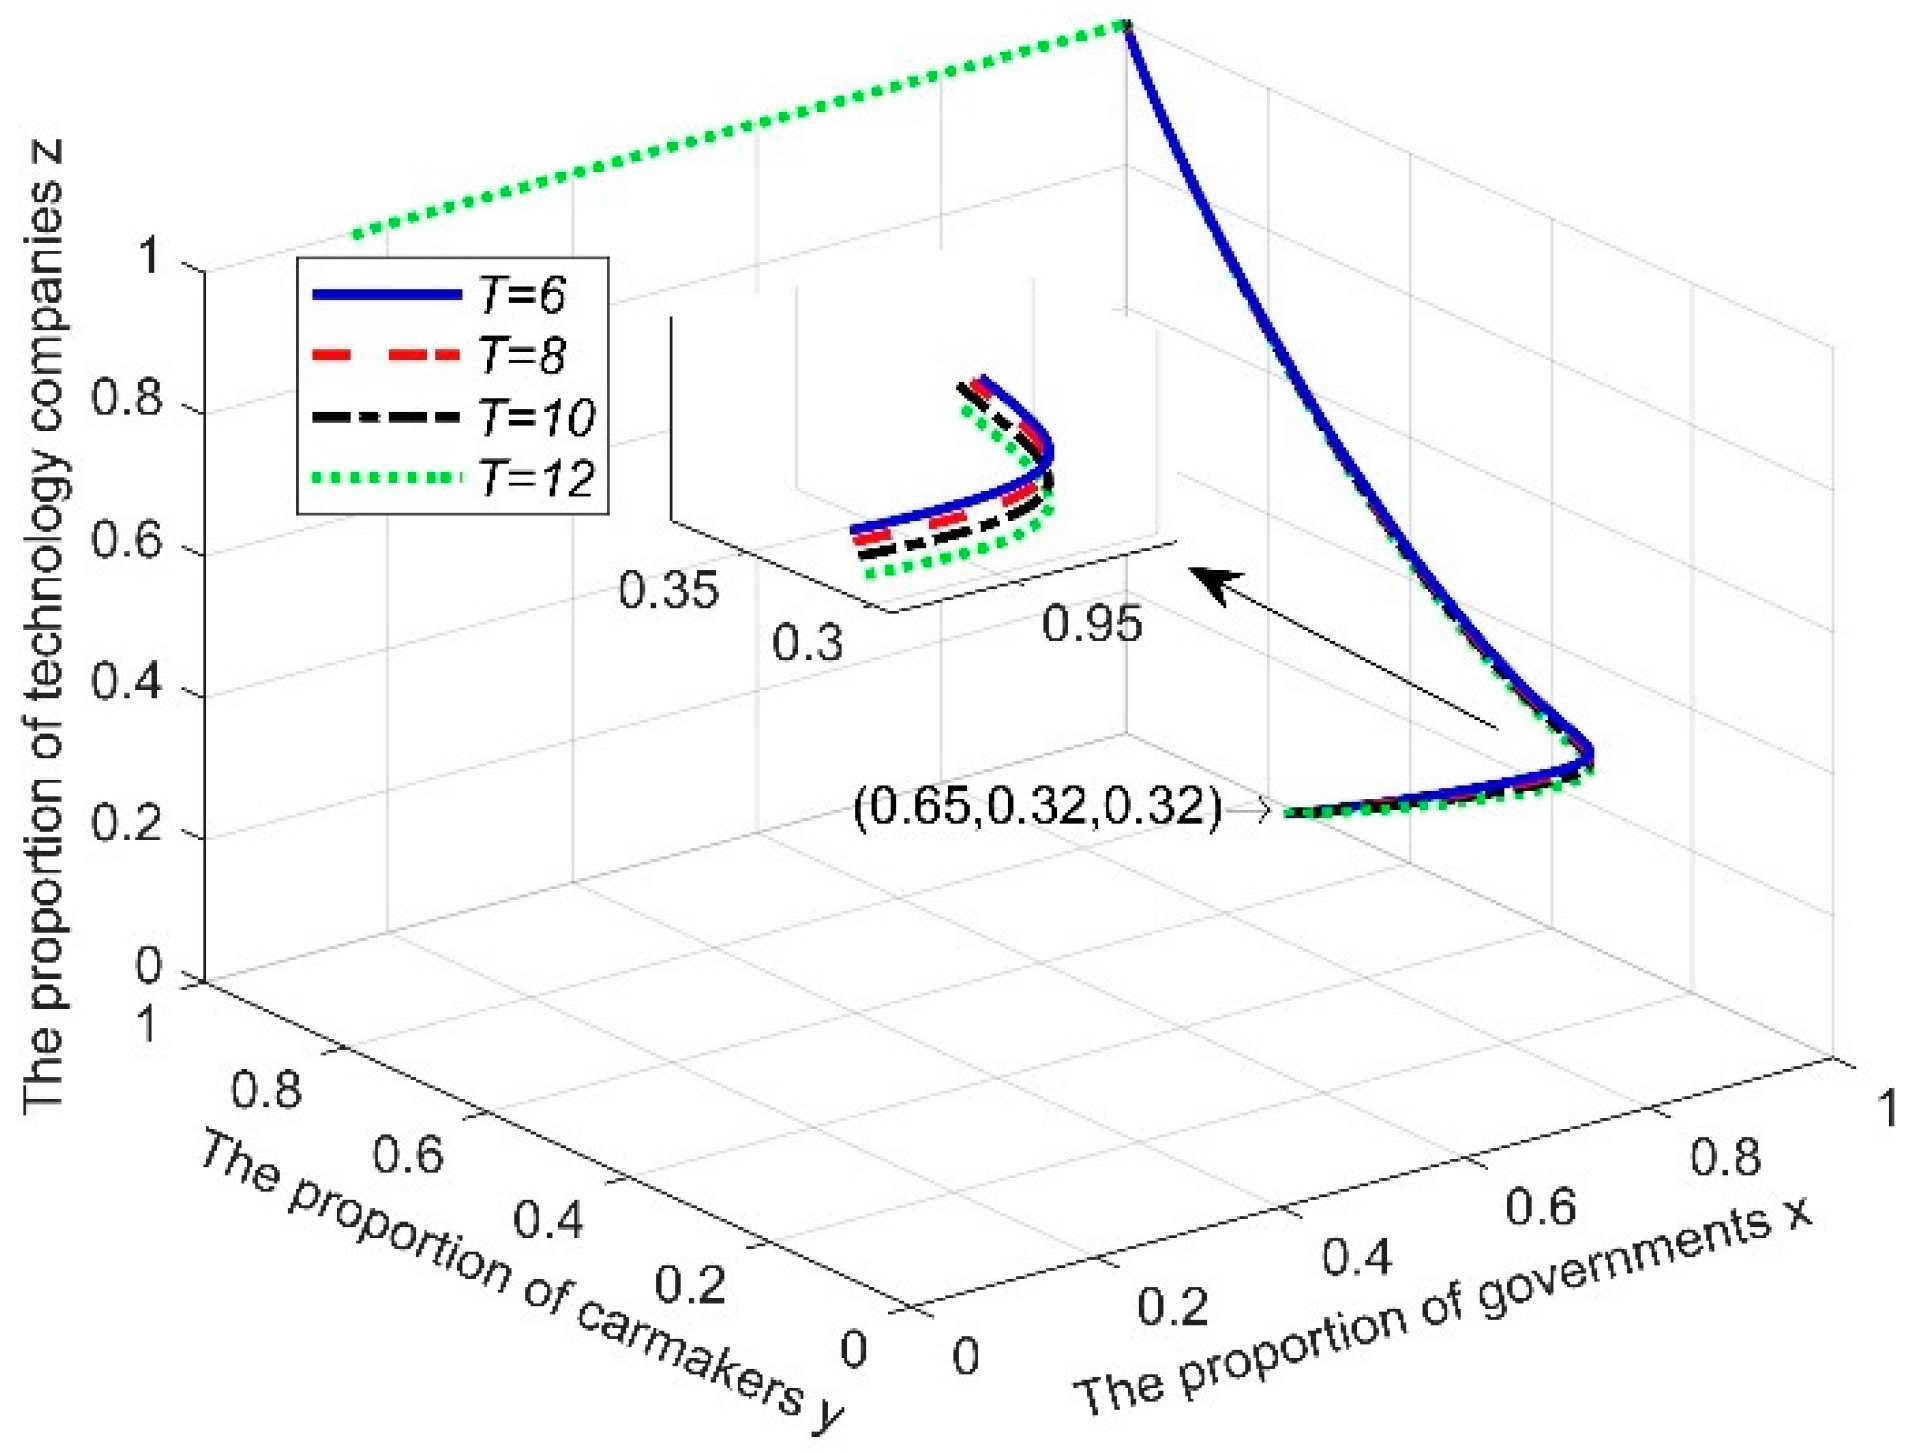
5.3. Empirical Analysis and Simulation
6. Sensitivity Analysis and Discussion
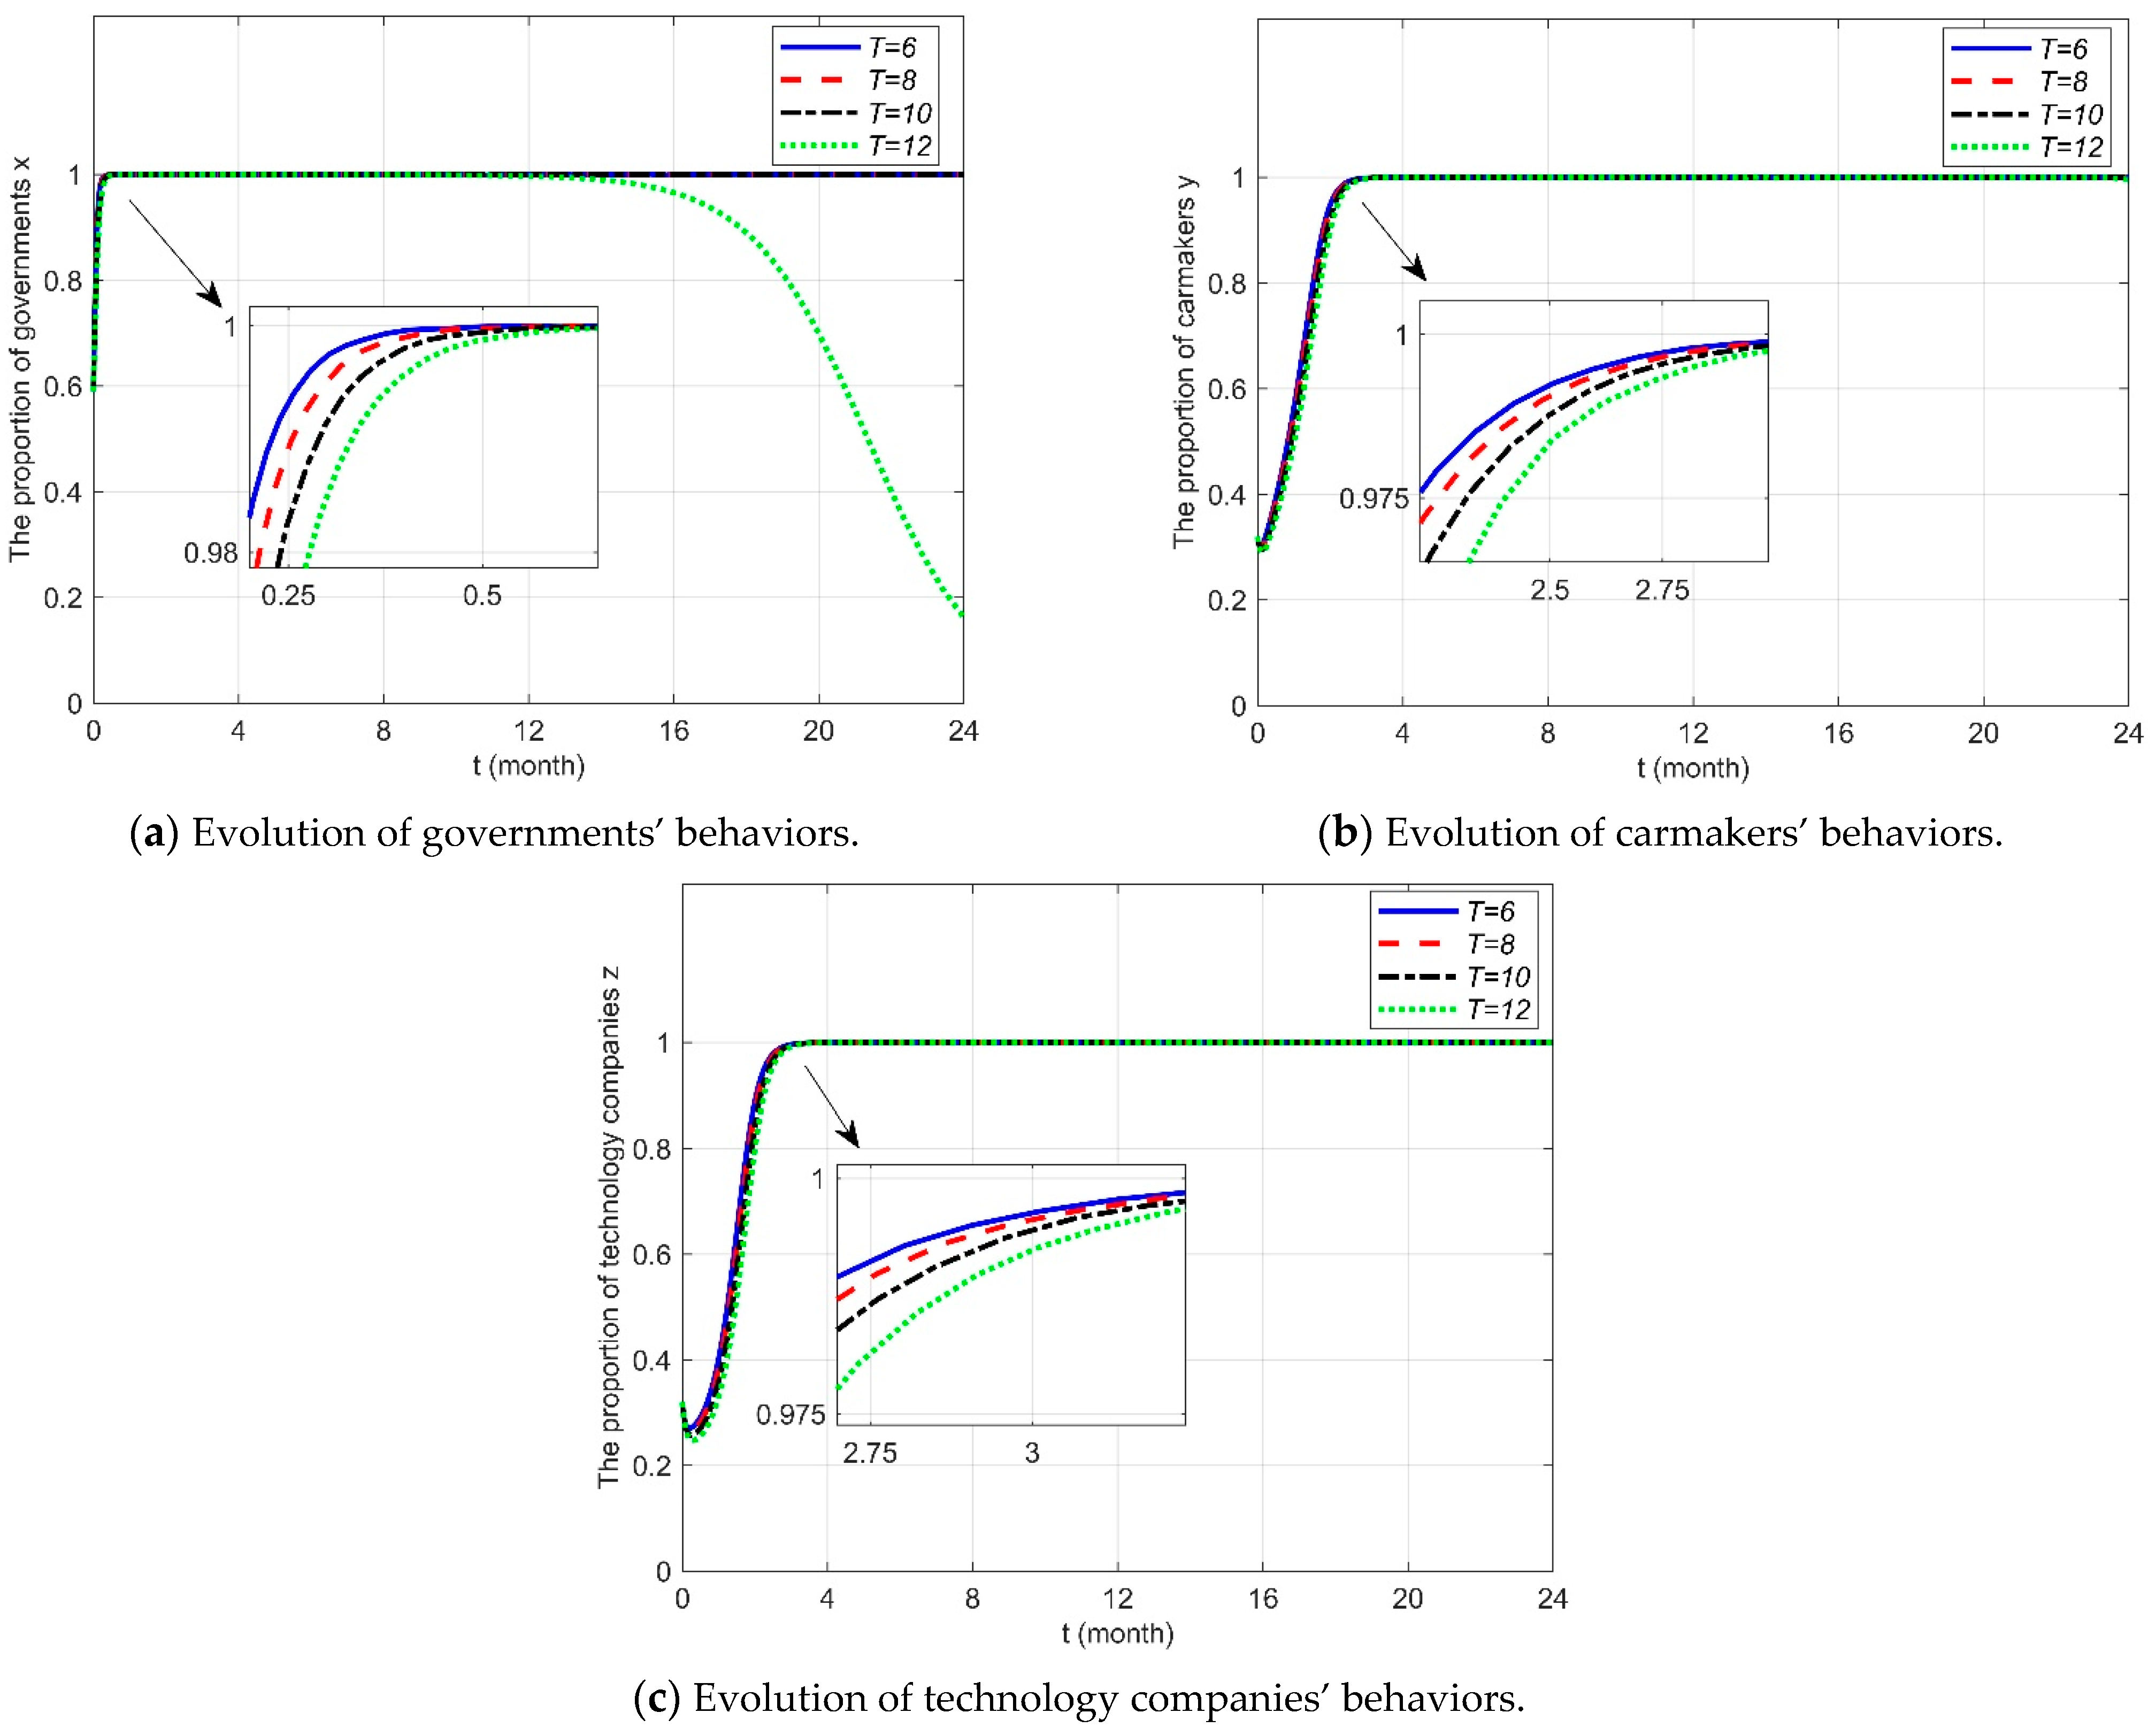
6.1. Infrastructure Investment
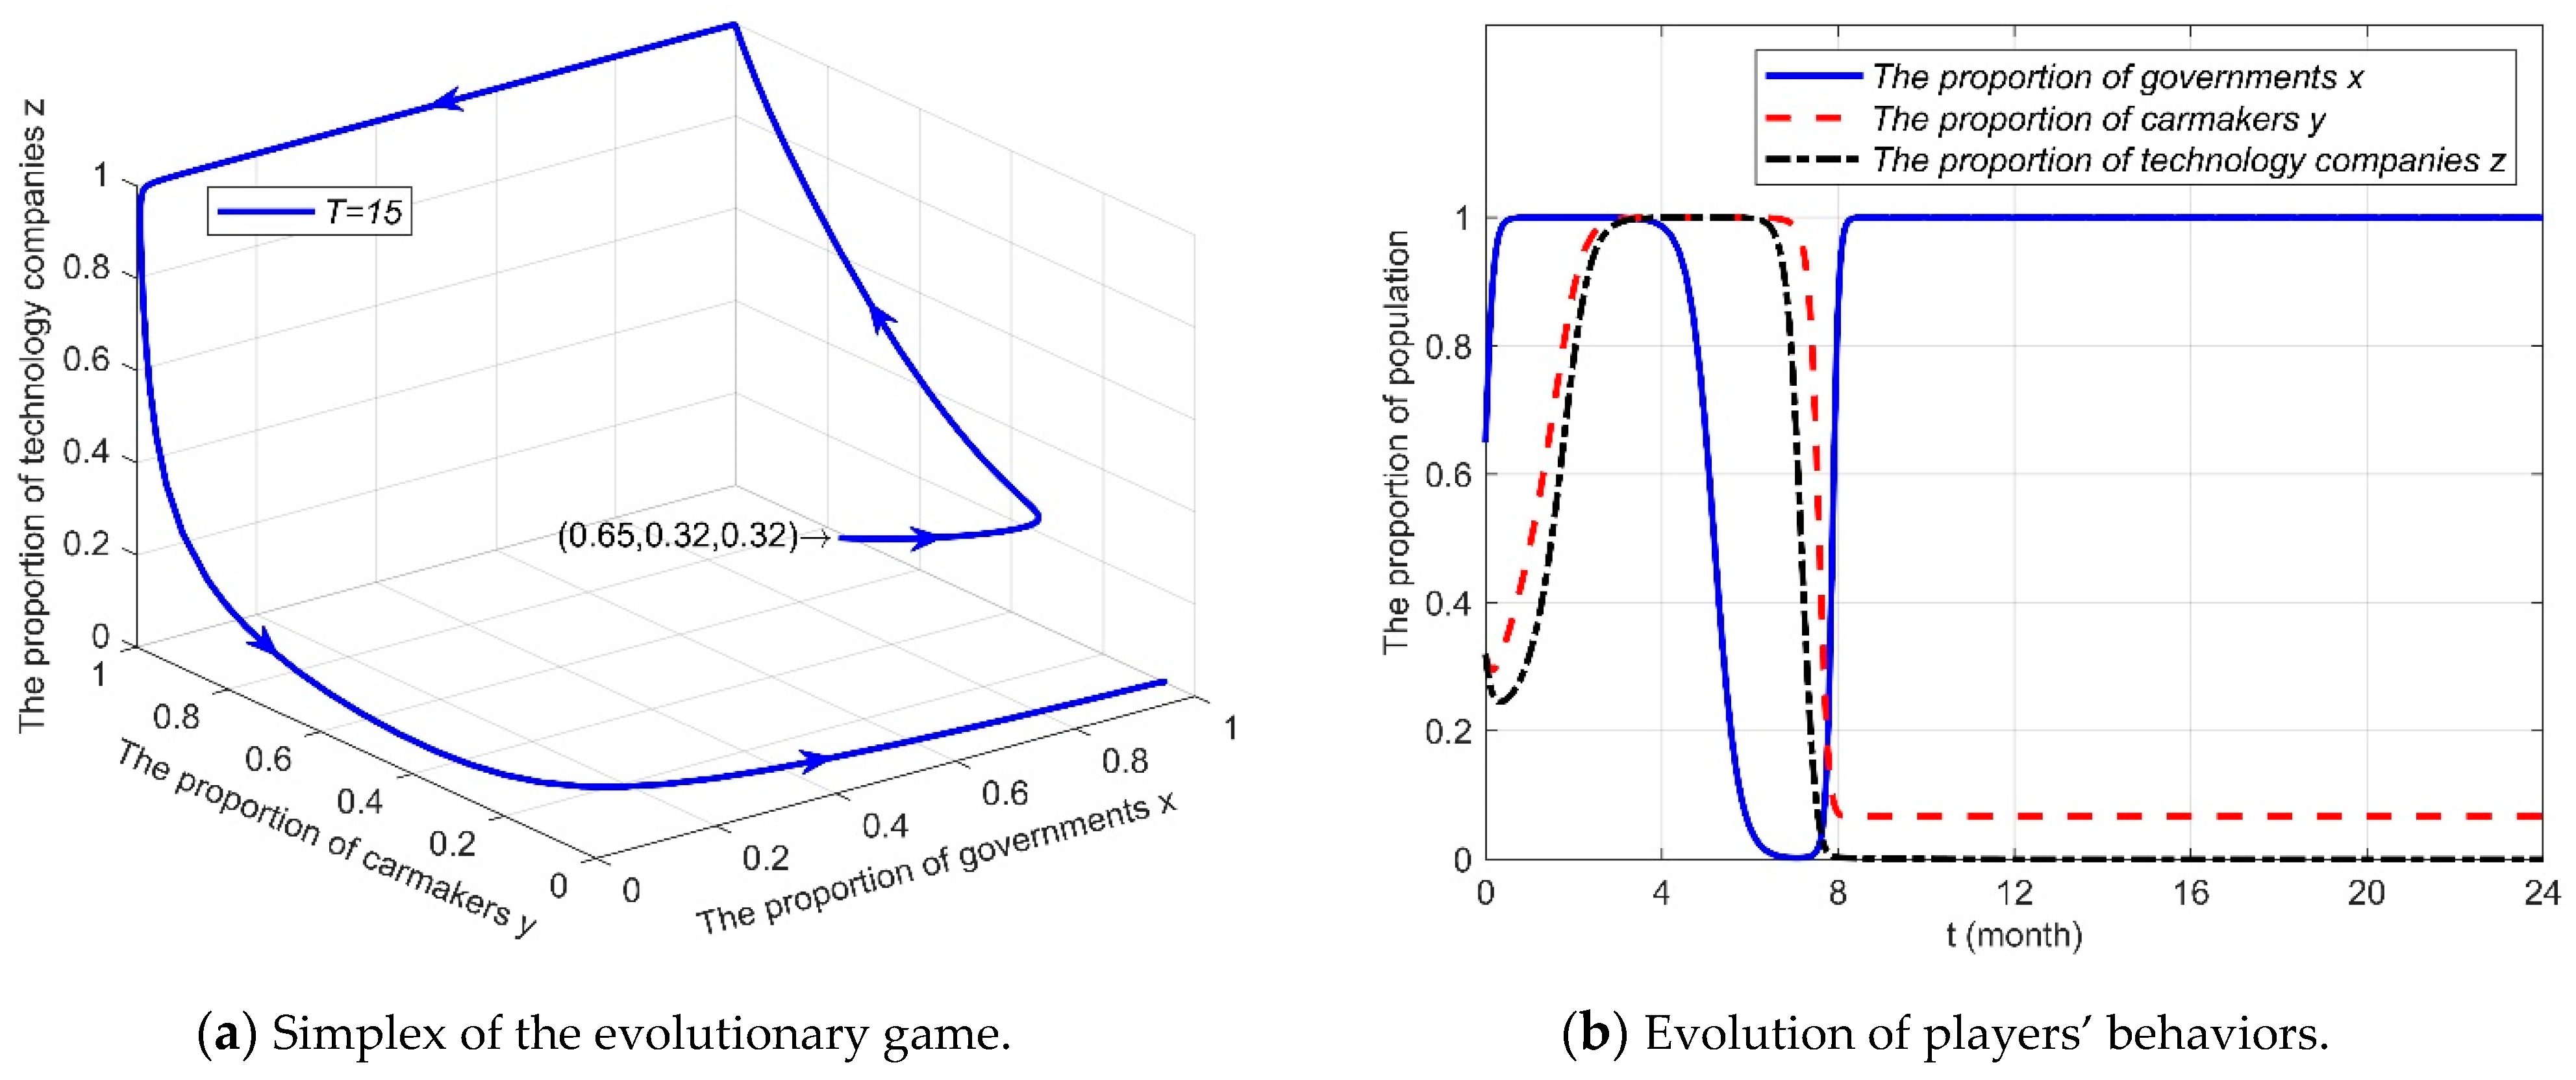
6.2. Subsidy Intensity
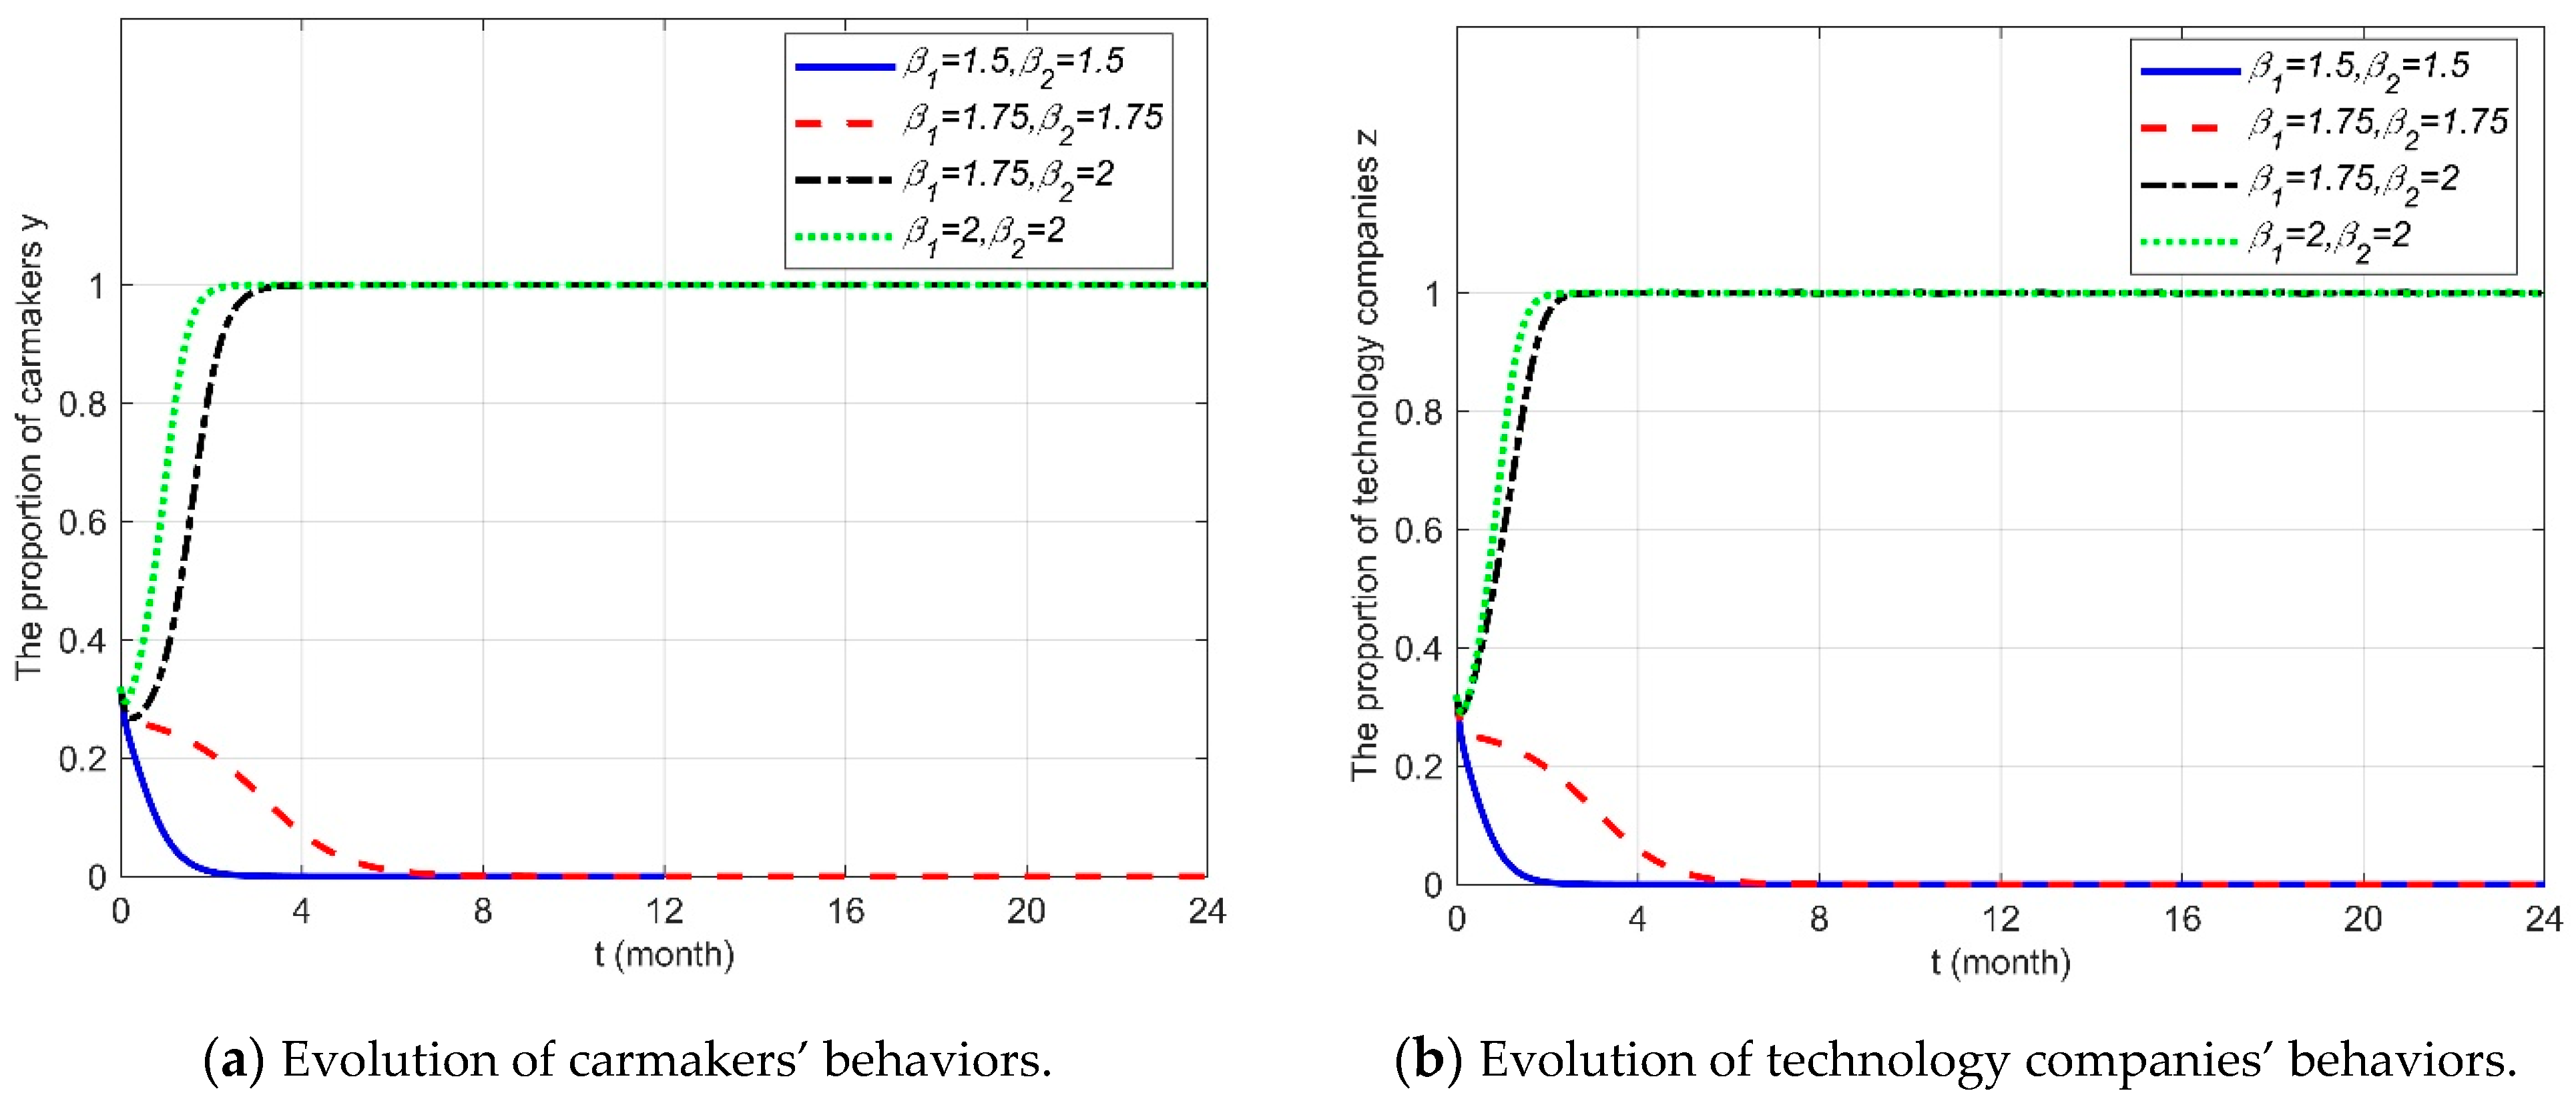
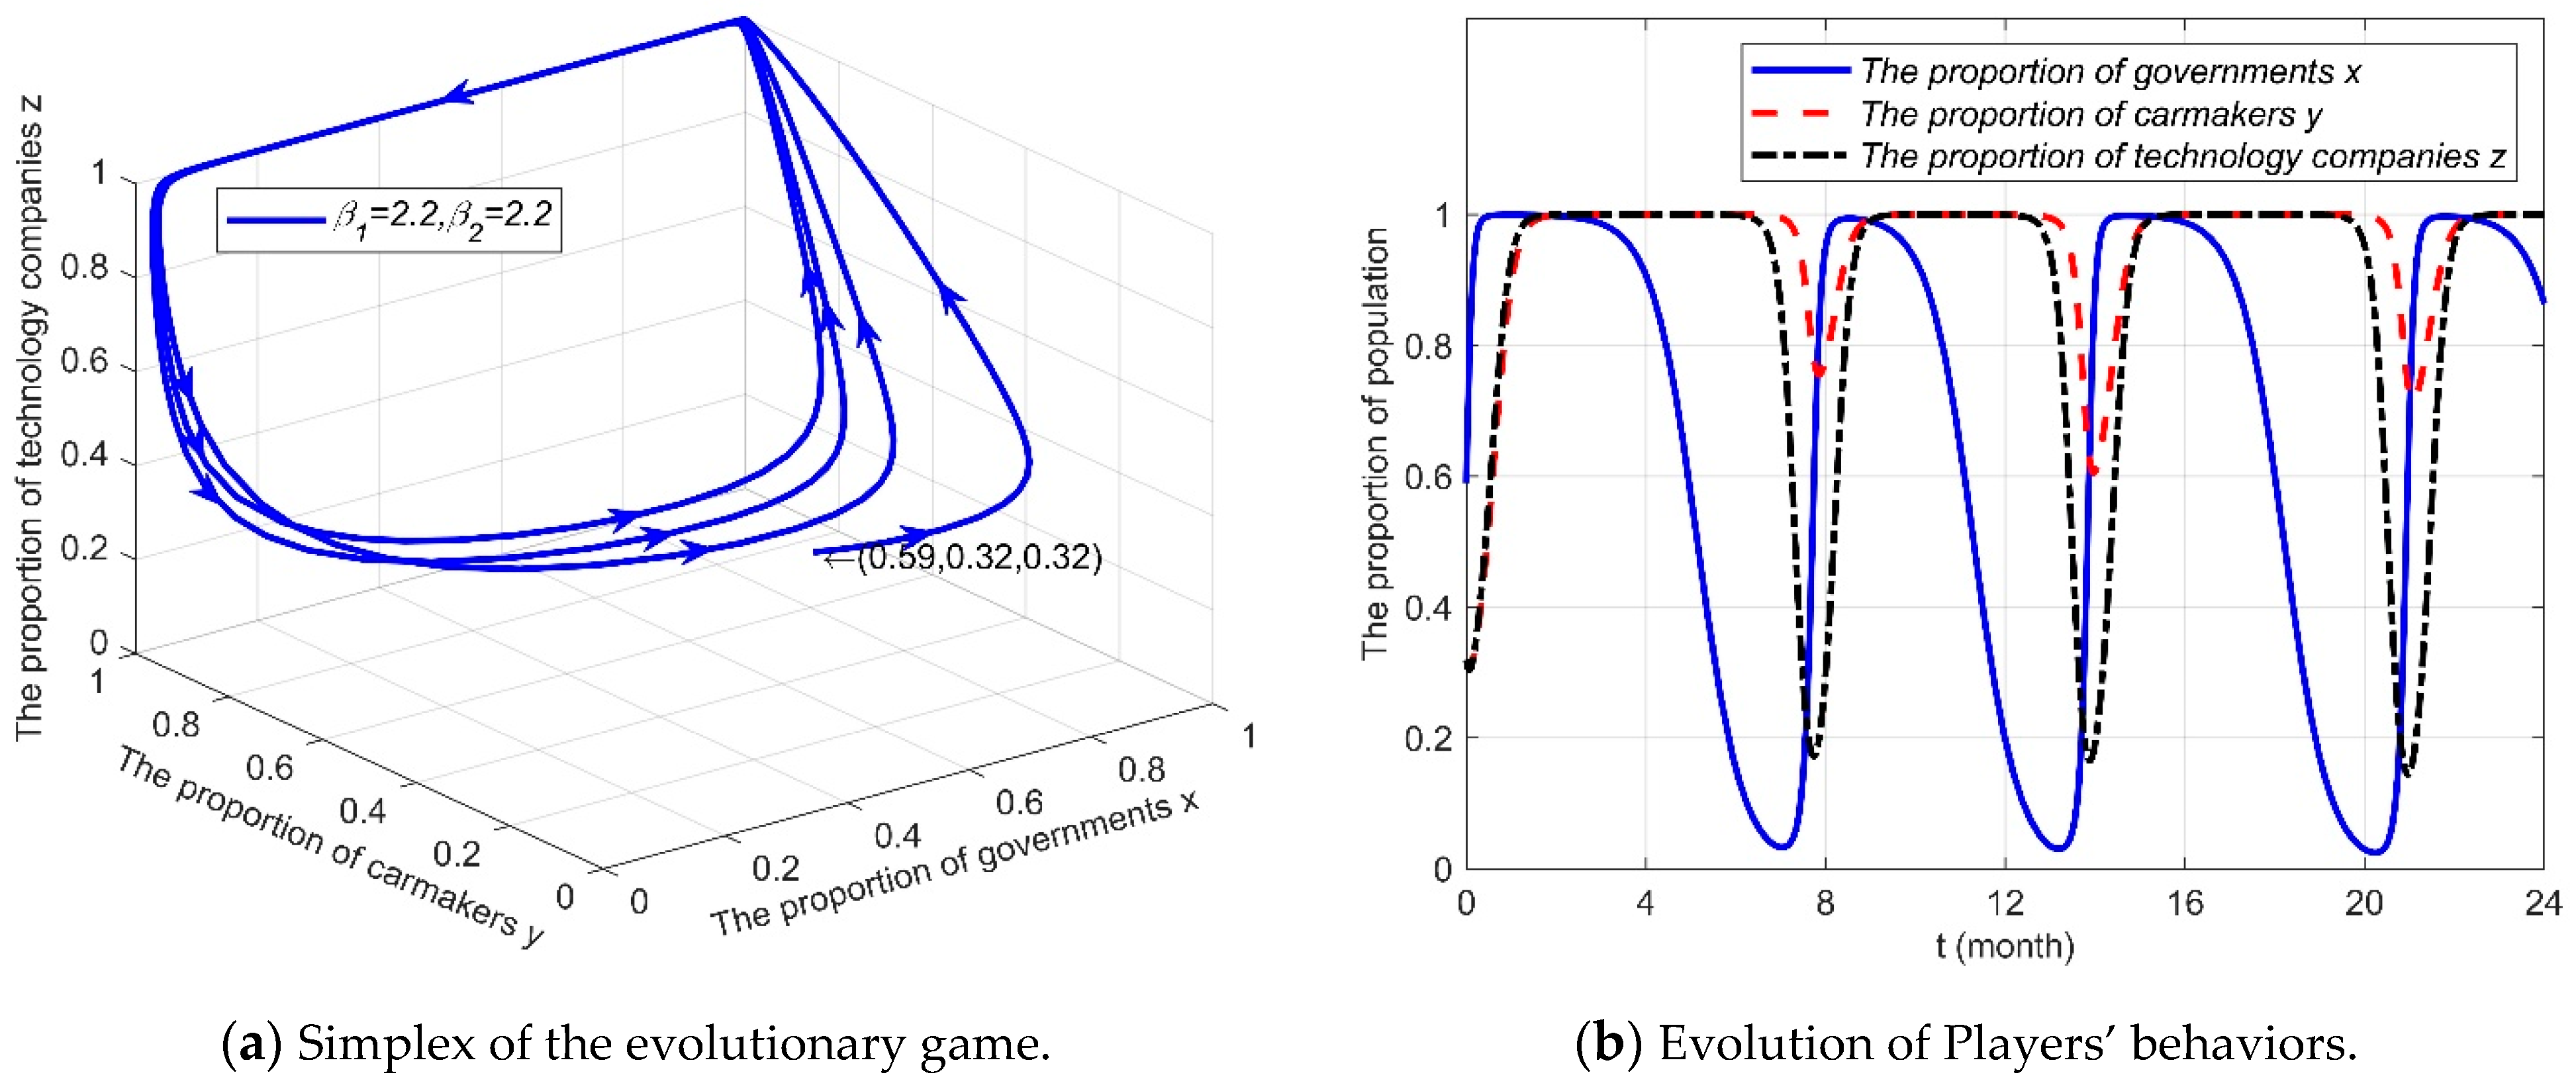
6.3. Benefit Distribution Ratio
7. Conclusions and Management Implications
Author Contributions
Funding
Data Availability Statement
Conflicts of Interest
References
- Chan, C.C.; Han, W.; Tian, H.; Liu, Y.; Ma, T.; Jiang, C.Q. Automotive Revolution and Carbon Neutrality. Front. Energy 2023, 17, 693–703. [Google Scholar] [CrossRef]
- Yang, D.; Jiang, K.; Zhao, D.; Yu, C.; Cao, Z.; Xie, S.; Xiao, Z.; Jiao, X.; Wang, S.; Zhang, K. Intelligent and Connected Vehicles: Current Status and Future Perspectives. Sci. China-Technol. Sci. 2018, 61, 1446–1471. [Google Scholar] [CrossRef]
- Wang, Y.; Cai, Y.; Chen, L.; Wang, H.; He, Y.; Li, J. Design of Intelligent and Connected Vehicle Path Tracking Controller Based on Model Predictive Control. J. Mech. Eng. 2019, 55, 136–144. [Google Scholar] [CrossRef]
- Placek, M. Share of Connected Cars in Total New Car Shipments Globally 2020&2030. Available online: https://www.statista.com/statistics/1276018/share-of-connected-cars-in-total-new-car-sales-worldwide/ (accessed on 23 October 2024).
- AskCI Corporation Forecast and Analysis of the Market Size and Enterprise Characteristics of China’s Intelligent Connected Vehicles in 2024. Available online: https://www.askci.com/news/chanye/20240122/083845270588392427328485.shtml (accessed on 23 October 2024).
- Intelligence Research Group Analysis and Prediction of the Development Prospects and Innovation Direction of China’s Intelligent Connected Vehicle Industry in 2022. Available online: https://www.chyxx.com/industry/201912/819671.html (accessed on 23 October 2024).
- Li, X.; Li, B.; Xing, R. Technology Licensing Contract Design Considering Royalty Transparency and Demand Information Asymmetry with Downstream Co-Opetition. Expert Syst. Appl. 2024, 238, 122183. [Google Scholar] [CrossRef]
- Zhao, D.; Li, Y.; Wang, J.; Tang, J. How to Promote Traditional Automobile Companies’ Intelligent-Connected Transformation under the New Dual-Credit Policy? A Tripartite Evolutionary Game Analysis Combined with Funding Time Delay. Systems 2024, 12, 319. [Google Scholar] [CrossRef]
- Ma, M.; Sun, W.; Zhao, J.; Li, X. Strategic Interactions and Market Dynamics in the Intelligent Connected Vehicle Industry: An Analysis of Technology Sharing, Value Co-Creation, and Market Competition. Manag. Decis. Econ. 2024, 45, 4795–4813. [Google Scholar] [CrossRef]
- SAIC MOTOR Banma Network Becomes Unicorn Company After First Financing Round. Available online: https://www.saicmotor.com/e/latest_news/saic_motor/51426.shtml (accessed on 4 November 2024).
- SAIC MOTOR World’s First Electric Internet-Connected SUV Hits Market. Available online: https://www.saicmotor.com/english/latest_news/roewe/48856.shtml (accessed on 4 November 2024).
- Shapiro, D. IM AI: China Automaker SAIC Unveils IM Brand Electric Vehicles Powered by NVIDIA DRIVE Orin. Available online: https://blogs.nvidia.com/blog/saic-im-ev-nvidia-drive-orin/ (accessed on 4 November 2024).
- Gasgoo Changan Automobile, Baidu Bolster Cooperation in Autonomous Driving. Available online: https://autonews.gasgoo.com/Detail2020.aspx?ArticleId=70015070 (accessed on 4 November 2024).
- Gasgoo Changan Lamore Becomes First Mass-Produced Model to Carry Baidu’s ERNIE Bot. Available online: https://autonews.gasgoo.com/Detail2020.aspx?ClassId=11&ArticleId=70022485 (accessed on 4 November 2024).
- Gasgoo Dongfeng Motor, Tencent Join Hands to Deepen Deployment in Smart Mobility Service, ICV. Available online: https://autonews.gasgoo.com/m/70016100.html (accessed on 4 November 2024).
- Dongfeng Motor What? The Intelligent Connected System of DongFeng Forthing T5 Can Actually Play like This! Available online: https://www.fxauto.com.cn/index.php/news/newsinto?id=673 (accessed on 4 November 2024).
- BAIC Group Launching Arcfox αS HI—High-End Smart Pure Electric Car Jointly Developed by BAIC and Huawei. Available online: https://www.baicgroup.com.cn/en/news/22.1000.html (accessed on 4 November 2024).
- Wei, Y.; Huang, Z. Current status and developing strategy of the internet of vehicles industry. China Natl. Cond. Strength 2019, 28, 59–61. [Google Scholar] [CrossRef]
- Chen, Y.; Lin Lawell, C.-Y.C.; Wang, Y. The Chinese Automobile Industry and Government Policy. Res. Transp. Econ. 2020, 84, 100849. [Google Scholar] [CrossRef]
- Jiang, X.; Wang, L.; Cao, B.; Fan, X. Benefit Distribution and Stability Analysis of Enterprises’ Technological Innovation Cooperation Alliance. Comput. Ind. Eng. 2021, 161, 107637. [Google Scholar] [CrossRef]
- Doll, S. Geely Restructures JIDU Partnership with Baidu as ‘JI YUE’ to Bring ROBO-01 EV to Market. Available online: https://electrek.co/2023/08/15/geely-stake-baidu-jidu-robo-01-ev-market-new-ji-yue-brand-china/ (accessed on 4 November 2024).
- Bian, C.; Yin, G.; Xu, L.; Zhang, N. Bidirectional Adaptive Cruise Control for Intelligent Vehicles. Int. J. Heavy Veh. Syst. 2021, 28, 467–486. [Google Scholar] [CrossRef]
- Chu, W.; Wuniri, Q.; Du, X.; Xiong, Q.; Huang, T.; Li, K. Cloud Control System Architectures, Technologies and Applications on Intelligent and Connected Vehicles: A Review. Chin. J. Mech. Eng. 2021, 34, 139. [Google Scholar] [CrossRef]
- Song, X.; Lou, X.; Zhu, J.; He, D. Secure State Estimation for Motion Monitoring of Intelligent Connected Vehicle Systems. Sensors 2020, 20, 1253. [Google Scholar] [CrossRef]
- Zhou, C. Algorithm Design of Early Warning Seatbelt Intelligent Adjustment System Based on Neural Network and Big Data Analysis. Math. Probl. Eng. 2020, 2020, 7268963. [Google Scholar] [CrossRef]
- Paden, B.; Čáp, M.; Yong, S.Z.; Yershov, D.; Frazzoli, E. A Survey of Motion Planning and Control Techniques for Self-Driving Urban Vehicles. IEEE Trans. Intell. Veh. 2016, 1, 33–55. [Google Scholar] [CrossRef]
- Silva, J.A.R.; Grassi, V. Clothoid-Based Global Path Planning for Autonomous Vehicles in Urban Scenarios. In Proceedings of the 2018 IEEE International Conference on Robotics and Automation (ICRA), Brisbane, Australia, 21–25 May 2018; pp. 4312–4318. [Google Scholar]
- Yanumula, V.K.; Typaldos, P.; Troullinos, D.; Malekzadeh, M.; Papamichail, I.; Papageorgiou, M. Optimal Path Planning for Connected and Automated Vehicles in Lane-Free Traffic. In Proceedings of the 2021 IEEE International Intelligent Transportation Systems Conference (ITSC), Indianapolis, IN, USA, 19–22 September 2021; pp. 3545–3552. [Google Scholar]
- Katrakazas, C.; Quddus, M.; Chen, W.-H.; Deka, L. Real-Time Motion Planning Methods for Autonomous on-Road Driving: State-of-the-Art and Future Research Directions. Transp. Res. Part C Emerg. Technol. 2015, 60, 416–442. [Google Scholar] [CrossRef]
- Jiang, H.; Shi, K.; Cai, J.; Chen, L. Trajectory Planning and Optimisation Method for Intelligent Vehicle Lane Changing Emergently. IET Intell. Transp. Syst. 2018, 12, 1336–1344. [Google Scholar] [CrossRef]
- Sheng, P.; Ma, J.; Wang, D.; Wang, W.; Elhoseny, M. Intelligent Trajectory Planning Model for Electric Vehicle in Unknown Environment. J. Intell. Fuzzy Syst. 2019, 37, 397–407. [Google Scholar] [CrossRef]
- Yang, Y.; Ma, F.; Wang, J.; Zhu, S.; Gelbal, S.Y.; Kavas-Torris, O.; Aksun-Guvenc, B.; Guvenc, L. Cooperative Ecological Cruising Using Hierarchical Control Strategy with Optimal Sustainable Performance for Connected Automated Vehicles on Varying Road Conditions. J. Clean. Prod. 2020, 275, 123056. [Google Scholar] [CrossRef]
- Yuan, C.; Weng, S.; Shen, J.; Chen, L.; He, Y.; Wang, T. Research on Active Collision Avoidance Algorithm for Intelligent Vehicle Based on Improved Artificial Potential Field Model. Int. J. Adv. Robot. Syst. 2020, 17, 1729881420911232. [Google Scholar] [CrossRef]
- Zhu, Y.; Zhao, K.; Li, H.; Liu, Y.; Guo, Q.; Liang, Z. Trajectory Planning Algorithm Using Gauss Pseudo-Spectral Method Based on Vehicle-Infrastructure Cooperative System. Int. J. Automot. Technol. 2020, 21, 889–901. [Google Scholar] [CrossRef]
- Wu, B.; Qian, L.; Lu, M.; Qiu, D.; Liang, H. Optimal Control Problem of Multi-Vehicle Cooperative Autonomous Parking Trajectory Planning in a Connected Vehicle Environment. IET Intell. Transp. Syst. 2019, 13, 1677–1685. [Google Scholar] [CrossRef]
- ITF/OECD. Leveraging Digital Technology and Data for Human-Centric Smart Cities; ITF/OECD: Paris, France, 2020.
- Yang, L.; Liu, S. Analysis on the Development Status of ICV. In Proceedings of the 2021 International Wireless Communications and Mobile Computing (IWCMC), Harbin, China, 28 June–2 July 2021; pp. 2153–2156. [Google Scholar]
- European Commission. A European Strategy on Cooperative Intelligent Transport Systems, a Milestone Towards Cooperative, Connected and Automated Mobility; European Commission: Brussels, Belgium, 2016.
- European Commission. Sustainable and Smart Mobility Strategy—Putting European Transport on Track for the Future; European Commission: Brussels, Belgium, 2020.
- United States. Joint Program Office for Intelligent Transportation Systems. ITS National Intelligent Transportation Systems Program Plan: Five Year Horizon Plan; United States. Joint Program Office for Intelligent Transportation Systems: Washington, DC, USA, 2000.
- U.S. Department of Transportation. Saving Lives with Connectivity: A Plan to Accelerate V2X Deployment; U.S. Department of Transportation: Washington, DC, USA, 2024.
- Gavanas, N.; Anastasiadou, K.; Nathanail, E.; Basbas, S. Transport Policy Pathways for Autonomous Road Vehicles to Promote Sustainable Urban Development in the European Union: A Multicriteria Analysis. Land 2024, 13, 1807. [Google Scholar] [CrossRef]
- Andraško, J.; Hamuľák, O.; Mesarčík, M.; Kerikmäe, T.; Kajander, A. Sustainable Data Governance for Cooperative, Connected and Automated Mobility in the European Union. Sustainability 2021, 13, 10610. [Google Scholar] [CrossRef]
- dos Santos, F.L.M.; Duboz, A.; Grosso, M.; Raposo, M.A.; Krause, J.; Mourtzouchou, A.; Balahur, A.; Ciuffo, B. An Acceptance Divergence? Media, Citizens and Policy Perspectives on Autonomous Cars in the European Union. Transp. Res. Part A Policy Pract. 2022, 158, 224–238. [Google Scholar] [CrossRef]
- Li, Y.; Cao, Y.; Qiu, H.; Gao, L.; Du, Z.; Chen, S. Big Wave of the Intelligent Connected Vehicles. China Commun. 2016, 13, 27–41. [Google Scholar] [CrossRef]
- Zhang, R.; Zhong, W.; Wang, N.; Sheng, R.; Wang, Y.; Zhou, Y. The Innovation Effect of Intelligent Connected Vehicle Policies in China. IEEE Access 2022, 10, 24738–24748. [Google Scholar] [CrossRef]
- Kuang, X.; Zhao, F.; Hao, H.; Liu, Z. Intelligent Connected Vehicles: The Industrial Practices and Impacts on Automotive Value-Chains in China. Asia Pac. Bus. Rev. 2018, 24, 1–21. [Google Scholar] [CrossRef]
- Tang, J.; Wu, W.; Zhao, D.; Chen, X. Evolutionary Game and Simulation Analysis of Intelligent Connected Vehicle Industry with Cross-Border Collaborative Innovation. IEEE Access 2023, 11, 17721–17730. [Google Scholar] [CrossRef]
- Tang, H.; Zhang, R.; Li, D.; Tang, B. Research on cooperation development mechanism of intelligent & connected vehicles based on evolutionary game theory. J. Nat. Sci. Heilongjiang 2021, 38, 387–393. [Google Scholar] [CrossRef]
- Hao, X.; Liu, G.; Zhang, X.; Dong, L. The Coevolution Mechanism of Stakeholder Strategies in the Recycled Resources Industry Innovation Ecosystem: The View of Evolutionary Game Theory. Technol. Forecast. Soc. Change 2022, 179, 121627. [Google Scholar] [CrossRef]
- Ning, J.; Xiong, L. Analysis of the Dynamic Evolution Process of the Digital Transformation of Renewable Energy Enterprises Based on the Cooperative and Evolutionary Game Model. Energy 2024, 288, 129758. [Google Scholar] [CrossRef]
- Cao, J.; Chen, X.; Wu, S.; Kumar, S. Evolving Remanufacturing Strategies in China: An Evolutionary Game Theory Perspective. Environ. Dev. Sustain. 2021, 23, 14827–14853. [Google Scholar] [CrossRef]
- Feng, C. The development dilemma and coping strategy of China’s intelligent network automobile industry. Contemp. Econ. Manag. 2018, 40, 64–70. [Google Scholar] [CrossRef]
- Luo, J.; Hu, M.; Huang, M.; Bai, Y. How Does Innovation Consortium Promote Low-Carbon Agricultural Technology Innovation: An Evolutionary Game Analysis. J. Clean. Prod. 2023, 384, 135564. [Google Scholar] [CrossRef]
- Zhang, J.; Wu, M. Cooperation Mechanism in Blockchain by Evolutionary Game Theory. Complexity 2021, 2021, 1258730. [Google Scholar] [CrossRef]
- Vincent, T.L. Evolutionary Games. J. Optim. Theory Appl. 1985, 46, 605–612. [Google Scholar] [CrossRef]
- Friedman, D. Evolutionary Games in Economics. Econometrica 1991, 59, 637–666. [Google Scholar] [CrossRef]
- Fu, Z.-L.; Wang, L.; Xue, S.-J.; Ma, J.; Zhang, J.; Guo, W. Tripartite Evolutionary Game Analysis of the Collective Intelligence Design Ecosystem. J. Clean. Prod. 2022, 381, 135217. [Google Scholar] [CrossRef]
- Ritzberger, K.; Weibull, J.W. Evolutionary Selection in Normal-Form Games. Econometrica 1995, 63, 1371–1399. [Google Scholar] [CrossRef]
- Chen, J.; Sun, C.; Shi, J.; Liu, J. Technology R&D and Sharing in Carbon Emission Reduction in a Duopoly. Technol. Forecast. Soc. Change 2022, 183, 121936. [Google Scholar] [CrossRef]
- Zhang, C.; Zhang, T.; Zhao, Y.; Qiu, C.; Wang, X.; Lan, S.; Cao, J. SemanticICV: Endogenous Secure Full-Scenario Learning for Intelligent Connected Vehicles Driven by Semantics. IEEE Netw. 2024, 38, 156–163. [Google Scholar] [CrossRef]
- Dietzenbacher, E.; Los, B. Externalities of R&D Expenditures. Econ. Syst. Res. 2002, 14, 407–425. [Google Scholar] [CrossRef]
- Zhou, S.; Wang, J.; Xu, B. Innovative Coupling and Coordination: Automobile and Digital Industries. Technol. Forecast. Soc. Change 2022, 176, 121497. [Google Scholar] [CrossRef]
- Gasgoo JIDU Launches Limited ROBO-01 Lunar Edition Priced at 399,800 Yuan. Available online: https://autonews.gasgoo.com/Detail2020.aspx?ClassId=2&ArticleId=70021584 (accessed on 4 November 2024).
- Jiading District Shanghai’s Jiading Attracts 17 New Intelligent Connected Vehicle Projects. Available online: http://english.jiading.gov.cn/2024-04/09/c_978046.htm (accessed on 4 November 2024).
- National Development and Reform Commission. The Innovative Development Strategy for Intelligent Vehicles; National Development and Reform Commission: Beijing, China, 2020.
- Ministry of Finance of the People’s Republic of China; State Taxation Administration; Ministry of Science and Technology of the People’s Republic of China. Notice of the Ministry of Finance, the State of Taxation Administration and the Ministry of Science and Technology on Improving the Pre-Tax Super Deduction Ratio of R&D Expenses; Ministry of Finance of the People’s Republic of China; State Taxation Administration; Ministry of Science and Technology of the People’s Republic of China: Beijing, China, 2018.
- Ministry of Finance of the People’s Republic of China; State Taxation Administration. Announcement of the Ministry of Finance and the State Taxation Administration on Further Improving the Policy for Pre-Tax Additional Deductions for R&D Expenses; Ministry of Finance of the People’s Republic of China; State Taxation Administration: Beijing, China, 2021.
- Ministry of Science and Technology of the People’s Republic of China; Ministry of Public Security of the People’s Republic of China; Ministry of Transport of the People’s Republic of China. Notice of the Ministry of Industry and Information Technology, the Ministry of Public Security, and the Ministry of Transport on Issuing the “Specification for Road Test Management of Intelligent Connected Vehicles (for Trial Implementation)”; Ministry of Science and Technology of the People’s Republic of China; Ministry of Public Security of the People’s Republic of China; Ministry of Transport of the People’s Republic of China: Beijing, China, 2021.
- iResearch China Automotive Lidar Market Insight Report. Available online: https://www.iresearch.com.cn/Detail/report?id=3983&isfree=0 (accessed on 5 November 2024).
- UNECE (China) Beijing’s Initiatives on Autonomous Driving Industry in the Era of Interconnection of Everything. Available online: https://unece.org/transport/documents/2024/01/informal-documents/china-beijings-initiatives-autonomous-driving (accessed on 5 November 2024).
- Ministry of Industry and Information Technology of the People’s Republic of China; Ministry of Public Security of the People’s Republic of China; Ministry of Natural Resources of the People’s Republic of China; Ministry of Housing and Urban-Rural Development of the People’s Republic of China; Ministry of Transport of the People’s Republic of China. Notice of the Ministry of Industry and Information Technology, the Ministry of Public Security, the Ministry of Natural Resources, the Ministry of Housing and Urban-Rural Development, and the Ministry of Transport on Launching Pilot Cities for the Application of “Vehicle-Road-Cloud Integration” for Intelligent Connected Vehicles; Ministry of Industry and Information Technology of the People’s Republic of China; Ministry of Public Security of the People’s Republic of China; Ministry of Natural Resources of the People’s Republic of China; Ministry of Housing and Urban-Rural Development of the People’s Republic of China; Ministry of Transport of the People’s Republic of China: Beijing, China, 2024.
- Cao, Y. Testing on Public Roads a Leap Forward for L3 Autonomous Vehicles in China. Available online: https://europe.chinadaily.com.cn/a/202406/17/WS666f8a64a31095c51c5092fb.html (accessed on 5 November 2024).
- European Commission. Industrial Action Plan for the European Automotive Sector; European Commission: Brussels, Belgium, 2025.
- Beijing E-Town E-Town Capital: Capital Engine Supports Intelligent Connected Vehicles in Enhancing Performance. Available online: https://www.ncsti.gov.cn/kjdt/scyq/bjjjjskfq/jkdt/202410/t20241022_183007.html (accessed on 5 May 2025).
- State Taxation Administration. Notice of the State Taxation Administration on Administrative Measures for the Pre-Tax Deduction of Enterprise R&D Expenses (for Trial Implementation); State Taxation Administration: Beijing, China, 2008.
- Ministry of Finance of the People’s Republic of China; State Taxation Administration. Announcement of the Ministry of Finance and the State Taxation Administration on Further Improving the Pre-Tax Super Deduction Policy for R&D Expenses; Ministry of Finance of the People’s Republic of China; State Taxation Administration: Beijing, China, 2023.
- Gasgoo GAC Group Discontinues Joint Development with Huawei on AH8 Project. Available online: https://autonews.gasgoo.com/m/70022554.html (accessed on 5 November 2024).
- Beijing E-Town. Several Policies of Beijing E-Town on Promoting High Quality Development of Intelligent Connected Vehicle Industry; Beijing E-Town: Beijing, China, 2024. [Google Scholar]
- Thomas, V.J.; Maine, E. Market Entry Strategies for Electric Vehicle Start-Ups in the Automotive Industry—Lessons from Tesla Motors. J. Clean. Prod. 2019, 235, 653–663. [Google Scholar] [CrossRef]
- Andrews, M. Baidu Apollo Powered Jiyue 07 Electric Sedan Launches, Claims L4 Autonomous Driving. Available online: https://carnewschina.com/2024/09/11/baidu-apollo-powered-jiyue-07-electric-sedan-launches-and-claims-to-offer-l4-autonomous-driving/ (accessed on 5 November 2024).
- He, M.; Zhang, J.; Zhang, L.; Zhang, R. Evaluating User Experience for Intelligent Connected Vehicles: A Qualitative Study. In Engineering Psychology and Cognitive Ergonomics, Proceedings of the 21st International Conference, EPCE 2024, Held as Part of the 26th HCI International Conference, HCII 2024, Washington, DC, USA, 29 June–4 July 2024; Harris, D., Li, W.-C., Eds.; Springer Nature: Cham, Switzerland, 2024; Volume 14693, pp. 3–14. [Google Scholar]


| Carmakers | Technology Companies | The Specifics and Forms of Cooperation |
|---|---|---|
| SAIC Motor | Alibaba |
|
| Chana Automobile | Baidu | |
| Dongfeng Motor | Tencent | |
| BAIC Group | Huawei |
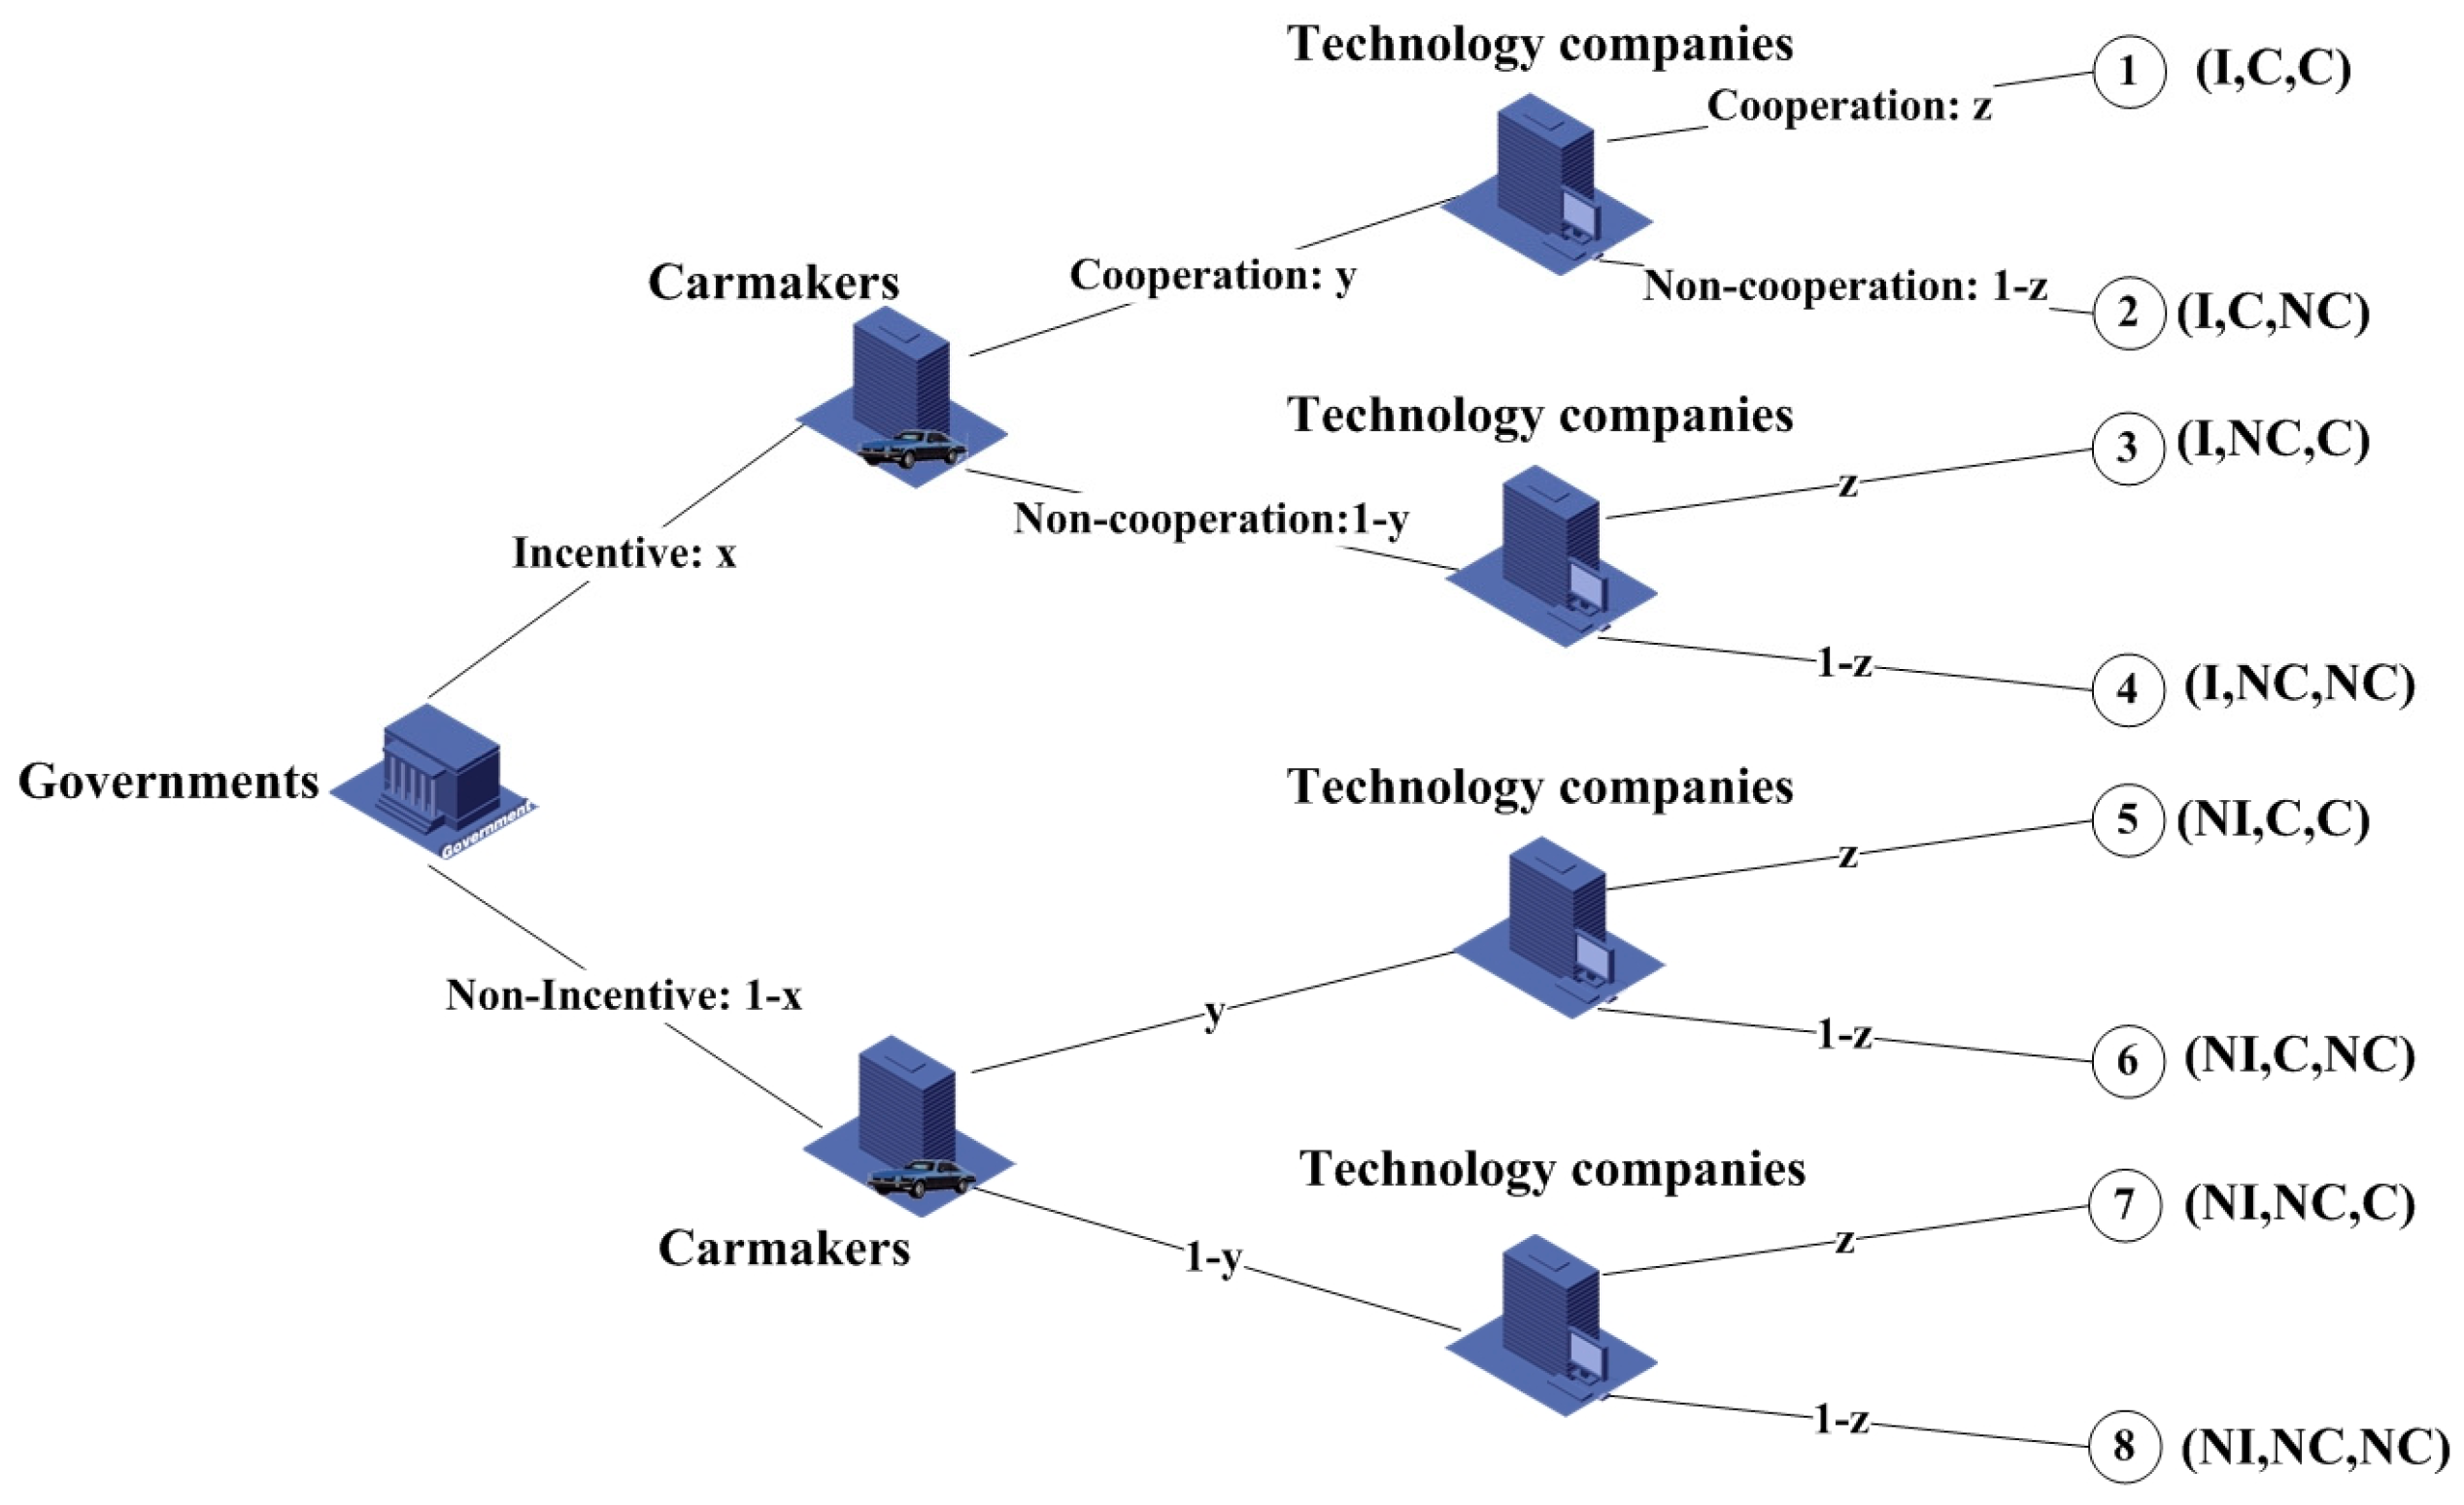
| Selections | Governments | Carmakers | Technology Companies |
|---|---|---|---|
| (I, C, C) | |||
| (I, C, NC) | |||
| (I, NC, C) | |||
| (I, NC, NC) | |||
| (NI, C, C) | |||
| (NI, C, NC) | |||
| (NI, NC, C) | |||
| (NI, NC, NC) |
| EPs | |||
|---|---|---|---|
| Key Parameter | Initial Value | Unit |
|---|---|---|
| 30 | hundred million yuan | |
| 10 | hundred million yuan | |
| 0.45 | % | |
| 2 | % | |
| 1.75 | % | |
| 0.5 | % | |
| 0.5 | % | |
| 8 | hundred million yuan | |
| 9 | hundred million yuan | |
| 11 | hundred million yuan | |
| 5.4 | hundred million yuan | |
| 6.6 | hundred million yuan | |
| 0.65 | % | |
| 0.65 | % | |
| 3.6 | hundred million yuan | |
| 4.4 | hundred million yuan | |
| 0.5 | % | |
| 0.3 | % |
| NO | Date | Policy | Key Points | Parameter Setting |
|---|---|---|---|---|
| 1 | 2008 | Notice of the State of Taxation Administration on Administrative Measures for the Pre-Tax Deduction of Enterprise R&D Expenses (for Trial Implementation) (Guo Shui Fa [2008] No. 116) [76] | Allows enterprises to deduct eligible R&D expenses plus 50% in the current year. | |
| 2 | 2018 | Notice of the Ministry of Finance, the State Taxation Administration and the Ministry of Science and Technology on Improving the Pre-Tax Super Deduction Ratio of R&D Expenses (Caishui [2018] No. 99) [67] | Expand the super deduction rate of eligible R&D expenses from 50% to 75% for all enterprises. | |
| 3 | 2021 | Announcement of the Ministry of Finance and the State Taxation Administration on Further Improving the Policy for Pre-Tax Additional Deductions for R&D Expenses (MOF STA Announcement [2021] No. 13) [69] | Increase the ratio of additional deductions on manufacturing enterprises’ R&D expenses from 75% to 100%. | |
| 4 | 2023 | Announcement of the Ministry of Finance and the State Taxation Administration on Further Improving the Pre-Tax Super Deduction Policy for R&D Expenses (STA MOF Announcement [2023] No. 7) [77] | Increase the pre-tax additional deduction ratio of R&D expenses for eligible enterprises from 75% to 100%. |
Disclaimer/Publisher’s Note: The statements, opinions and data contained in all publications are solely those of the individual author(s) and contributor(s) and not of MDPI and/or the editor(s). MDPI and/or the editor(s) disclaim responsibility for any injury to people or property resulting from any ideas, methods, instructions or products referred to in the content. |
© 2025 by the authors. Licensee MDPI, Basel, Switzerland. This article is an open access article distributed under the terms and conditions of the Creative Commons Attribution (CC BY) license (https://creativecommons.org/licenses/by/4.0/).
Share and Cite
Zhang, R.; Xie, Y.; Li, Y.; Chen, Q.; Wang, Q. How Do Incentive Policy and Benefit Distribution Affect the Cooperative Development Mechanism of Intelligent Connected Vehicles? A Tripartite Evolutionary Game Approach. Electronics 2025, 14, 2042. https://doi.org/10.3390/electronics14102042
Zhang R, Xie Y, Li Y, Chen Q, Wang Q. How Do Incentive Policy and Benefit Distribution Affect the Cooperative Development Mechanism of Intelligent Connected Vehicles? A Tripartite Evolutionary Game Approach. Electronics. 2025; 14(10):2042. https://doi.org/10.3390/electronics14102042
Chicago/Turabian StyleZhang, Rui, Yanxi Xie, Yuewen Li, Qingfeng Chen, and Qiaosong Wang. 2025. "How Do Incentive Policy and Benefit Distribution Affect the Cooperative Development Mechanism of Intelligent Connected Vehicles? A Tripartite Evolutionary Game Approach" Electronics 14, no. 10: 2042. https://doi.org/10.3390/electronics14102042
APA StyleZhang, R., Xie, Y., Li, Y., Chen, Q., & Wang, Q. (2025). How Do Incentive Policy and Benefit Distribution Affect the Cooperative Development Mechanism of Intelligent Connected Vehicles? A Tripartite Evolutionary Game Approach. Electronics, 14(10), 2042. https://doi.org/10.3390/electronics14102042