
Efficient Steel Surface Defect Detection via a Lightweight YOLO Framework with Task-Specific Knowledge-Guided Optimization


Abstract
1. Introduction
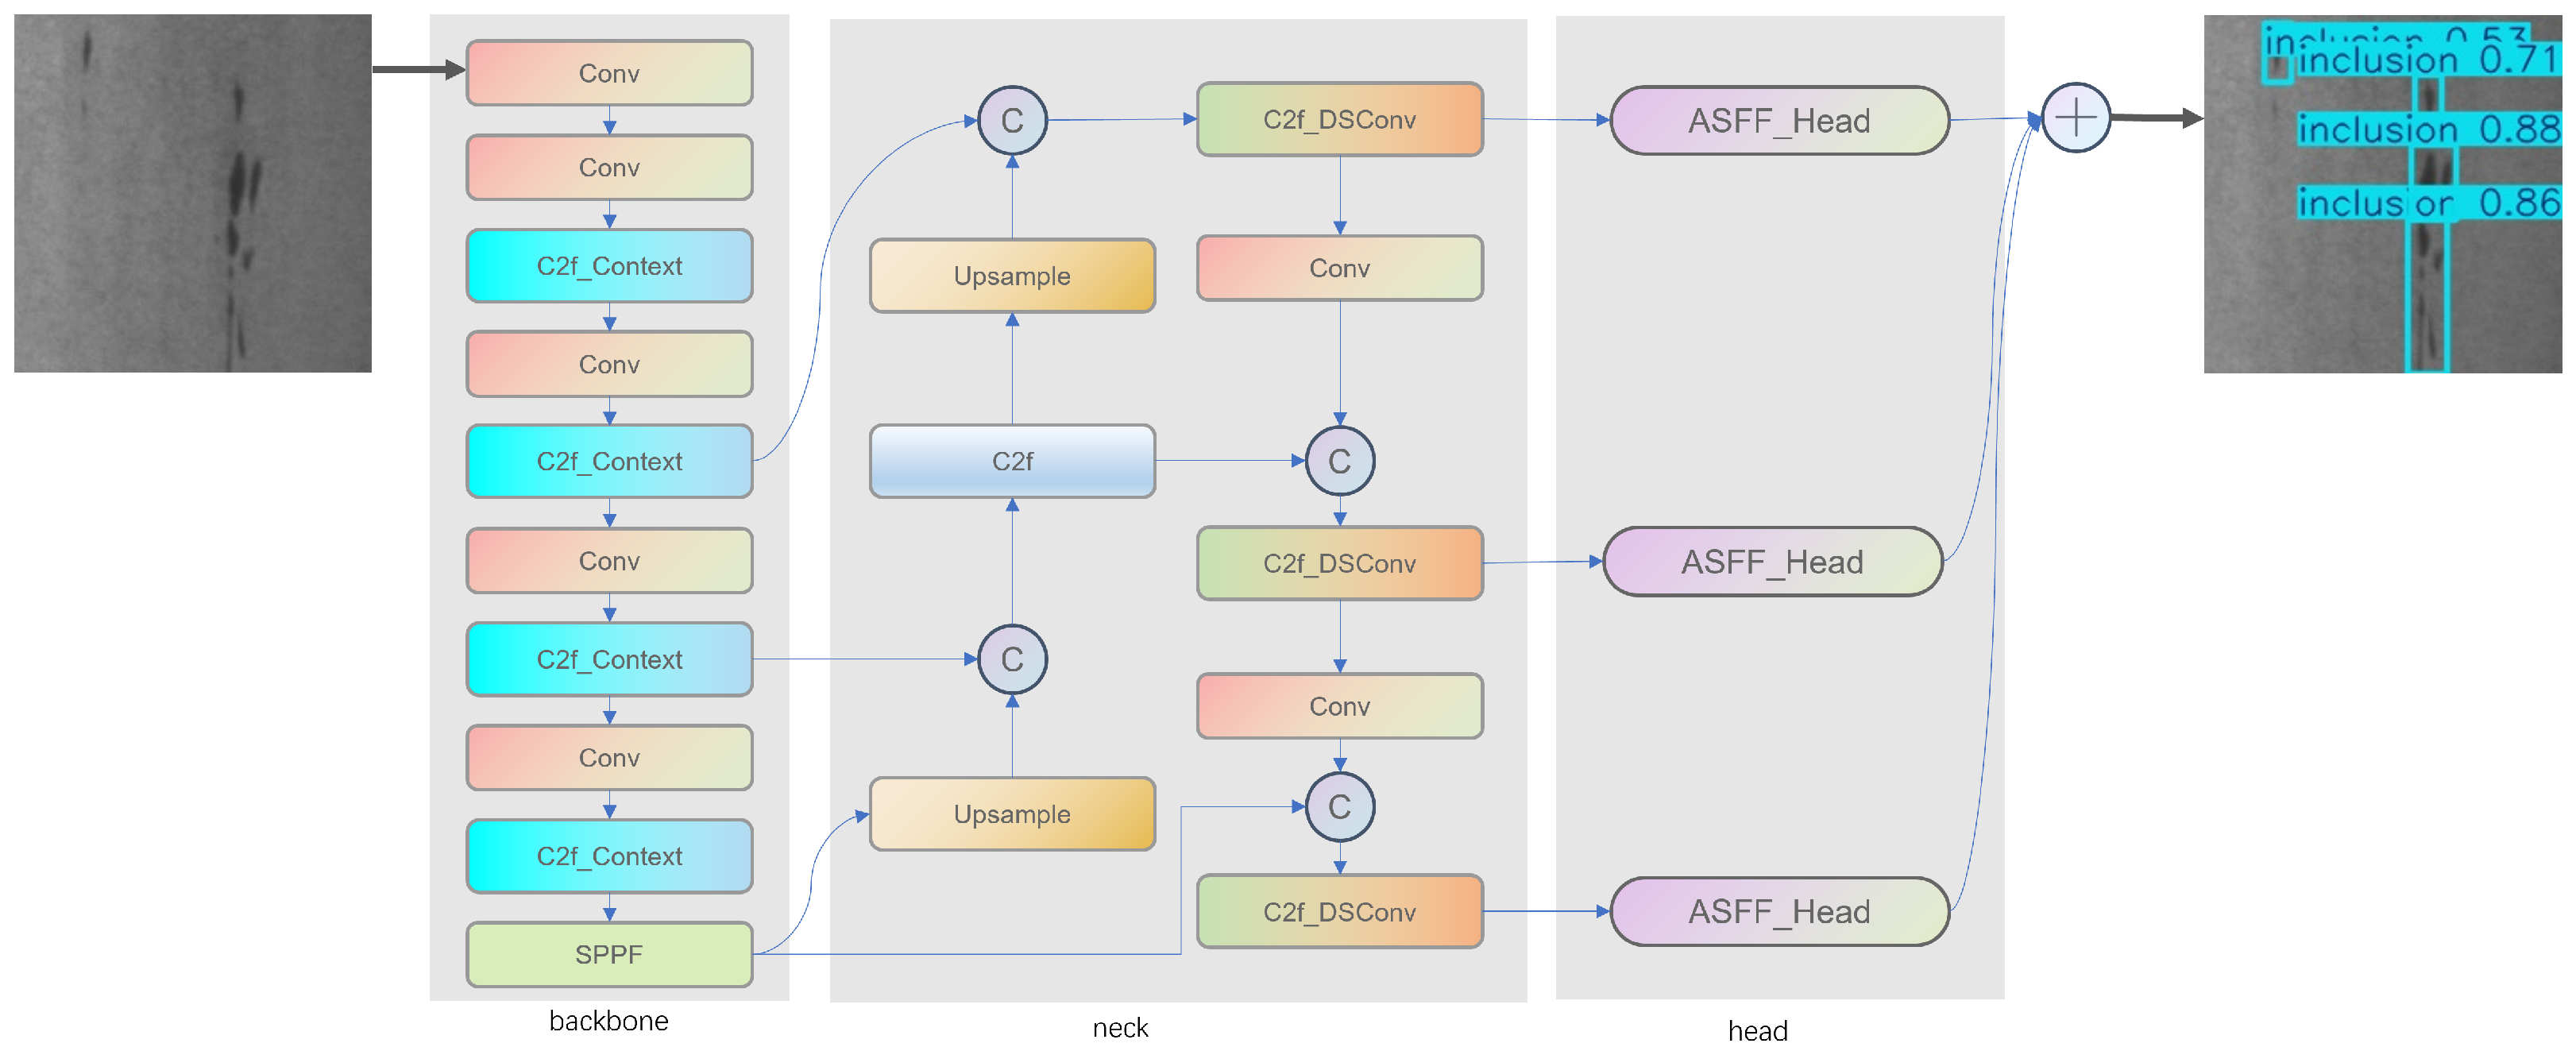
- For steel surface defects exhibiting linear characteristics (e.g., scratches), we optimized a dedicated convolution module (DSConv) that employs a dynamic convolution strategy for continuous sampling and linear feature extraction, thereby significantly enhancing the detection performance for these difficult-to-detect defects by up to 15%.
- In complex environments where different defect types may occur simultaneously and often cluster in the same region, the introduced Context-Guided module effectively improves local feature extraction by leveraging contextual information, resulting in enhanced identification of densely distributed defects.
- In the detection head, the use of the ASFF mechanism ensures scale invariance and enables efficient adaptive weighted fusion of multi-scale features, further boosting overall detection performance.
- By employing a nanoscale YOLO model as the baseline, our modular optimizations not only reduce computational complexity but also achieve detection performance comparable to the large-scale baseline model, thereby validating the efficiency of combining lightweight design with task-specific optimization.
2. Related Work
2.1. CNNs
2.2. YOLO Model
2.3. Surface Defect Detection
3. Method
3.1. Context-Guided Module
3.2. DSConv
3.3. Detect_ASFF
4. Experiment
4.1. Experiment Details
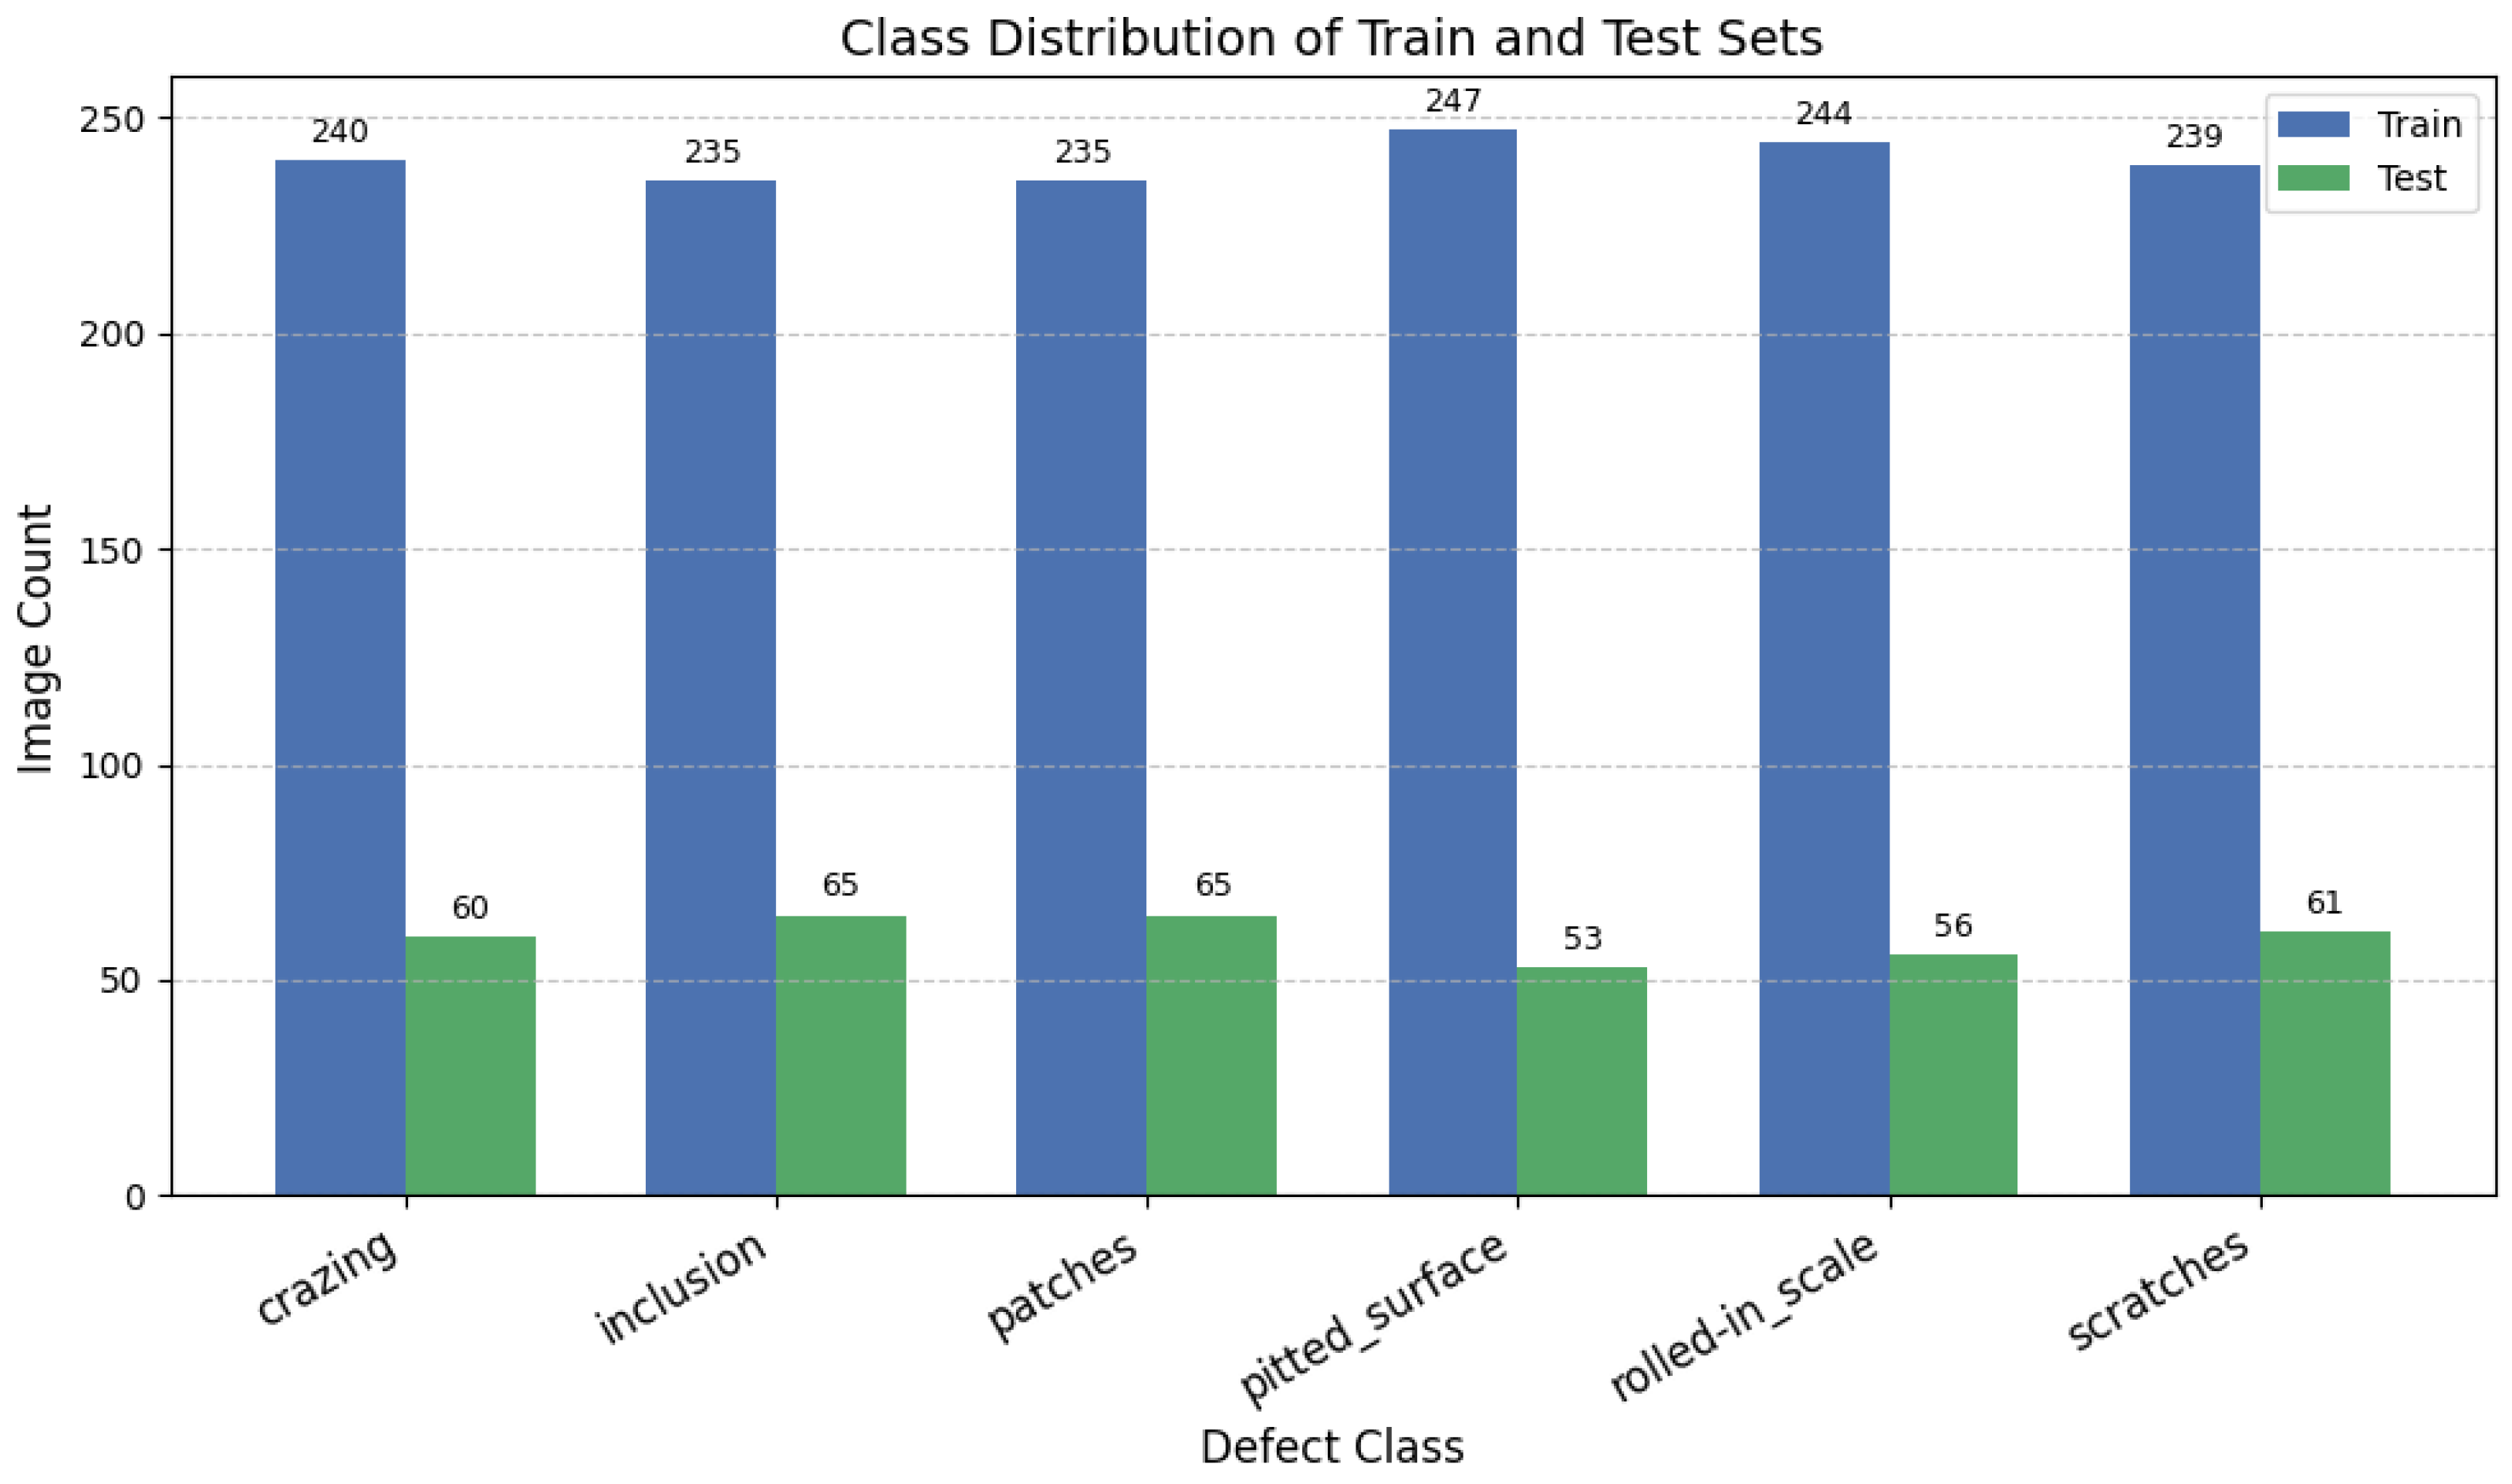
4.2. Dataset
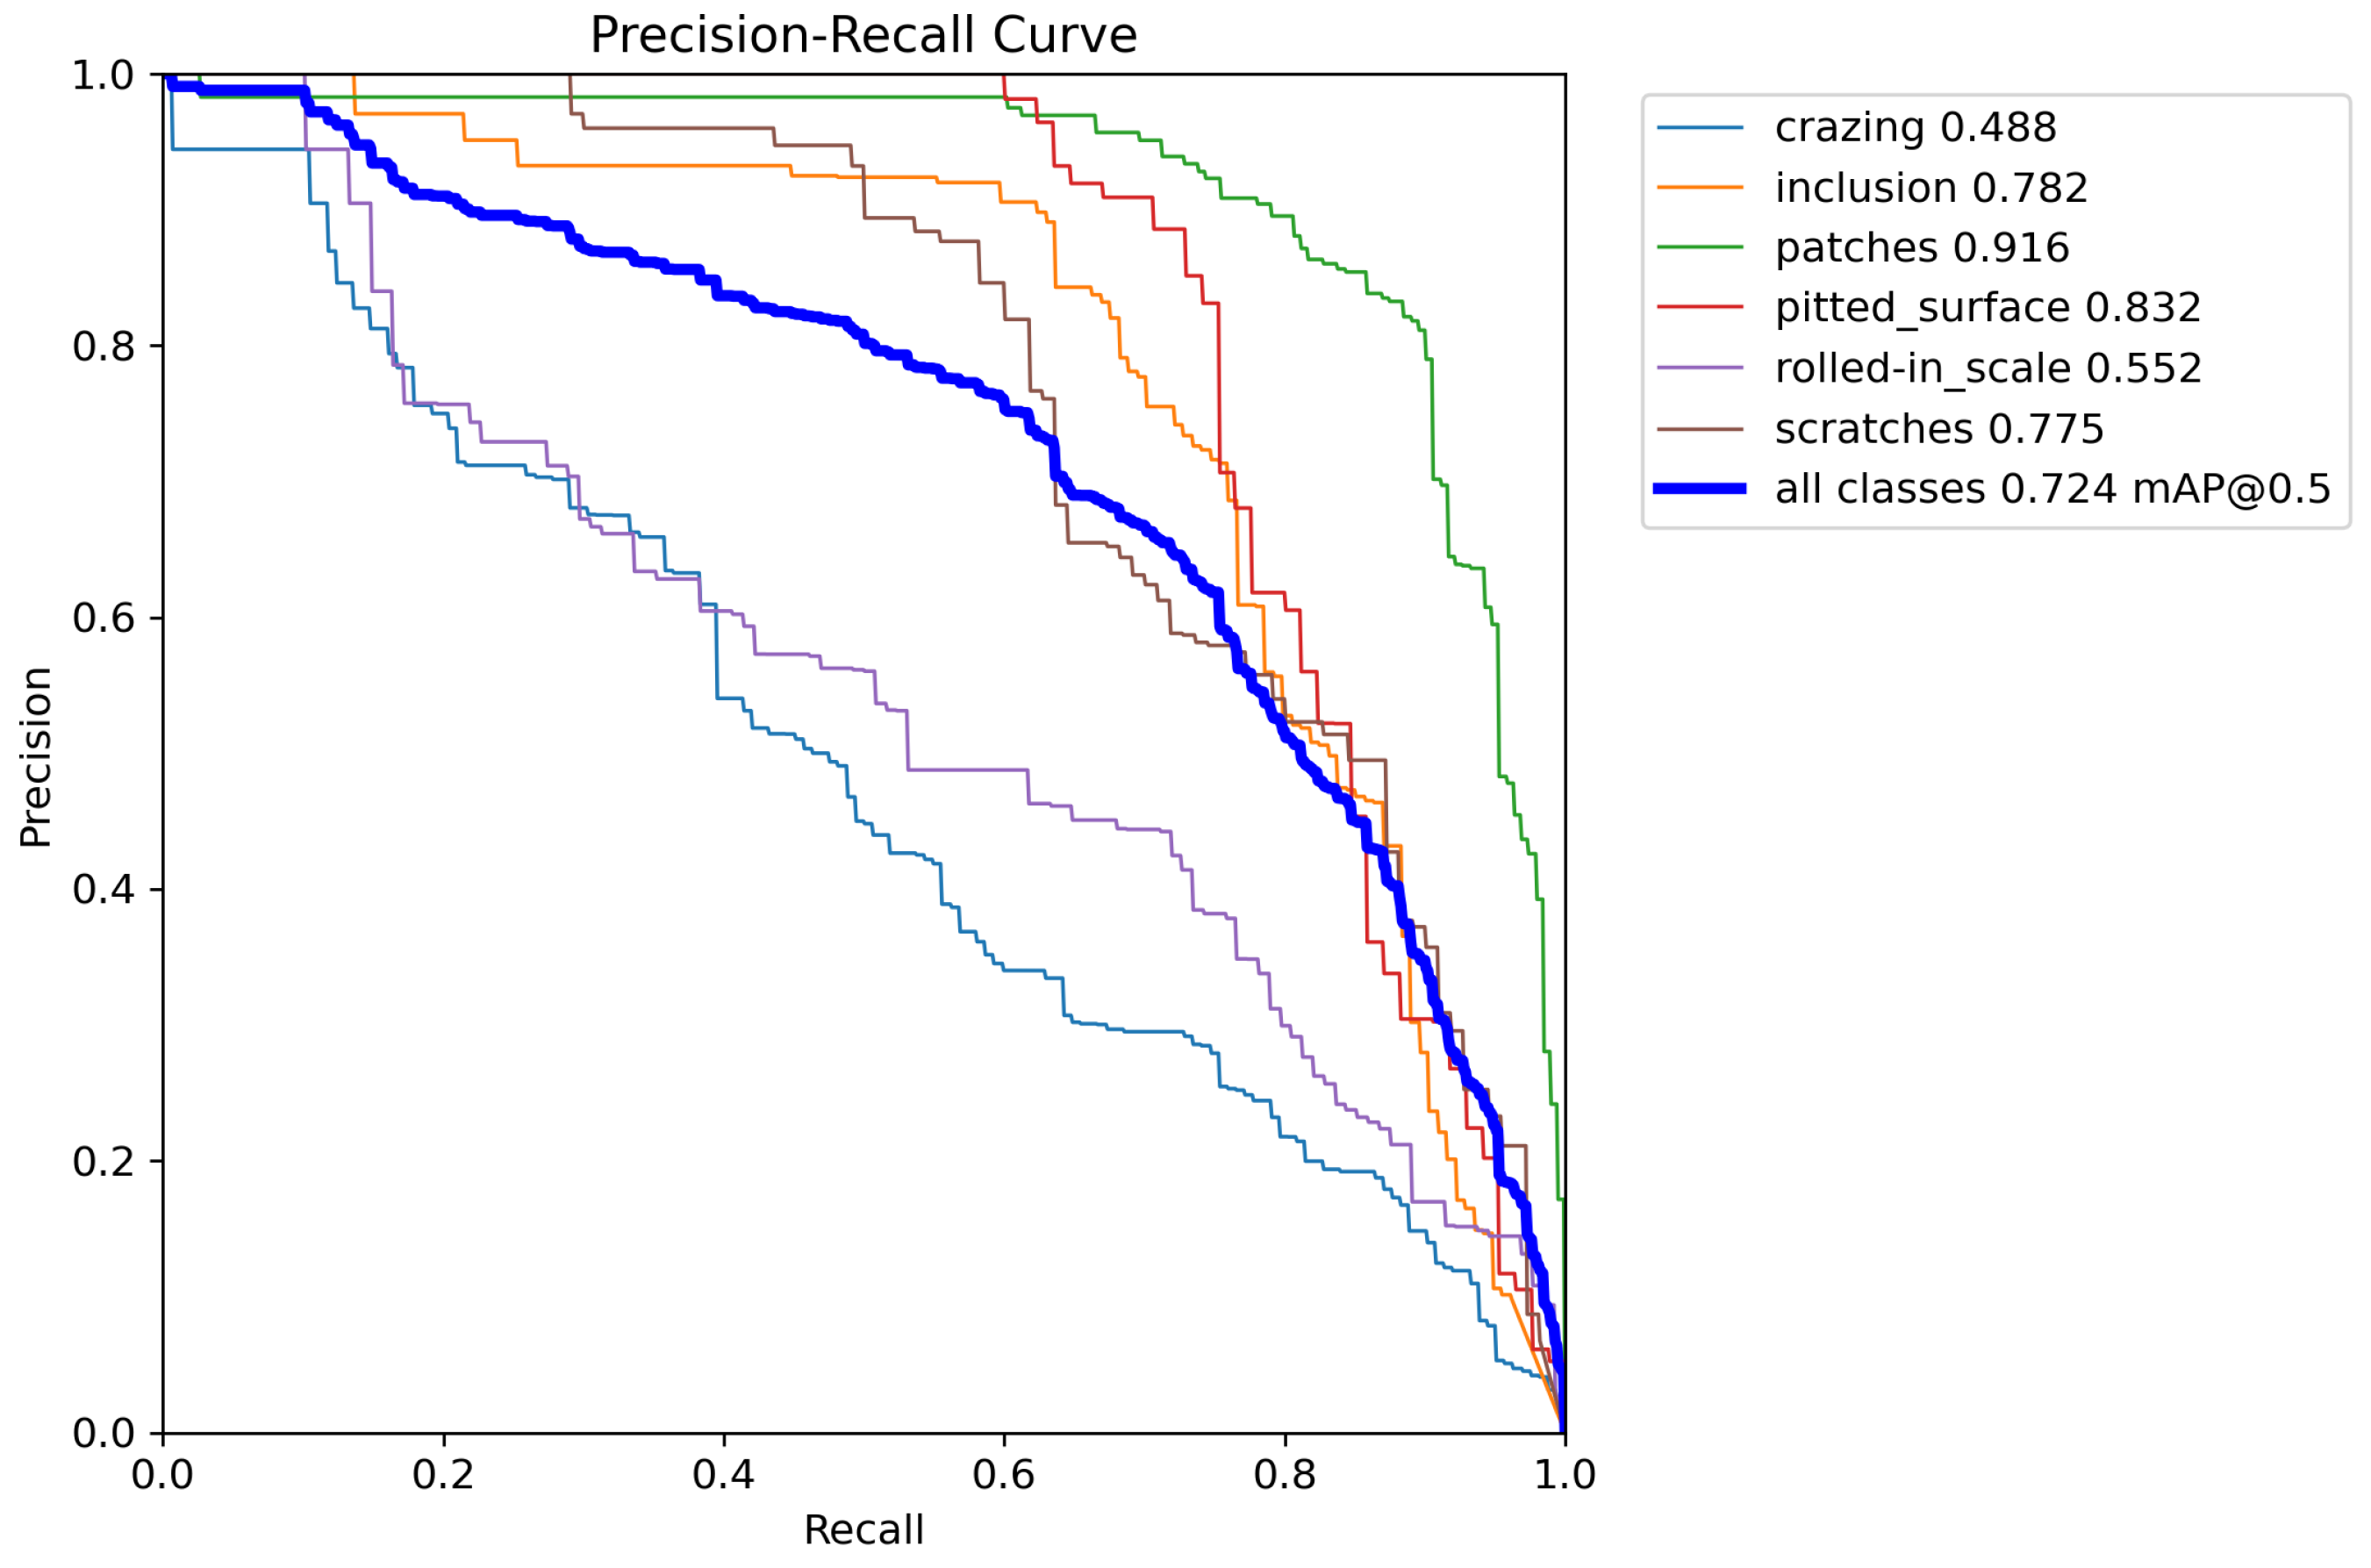
4.3. Evaluation Metrics
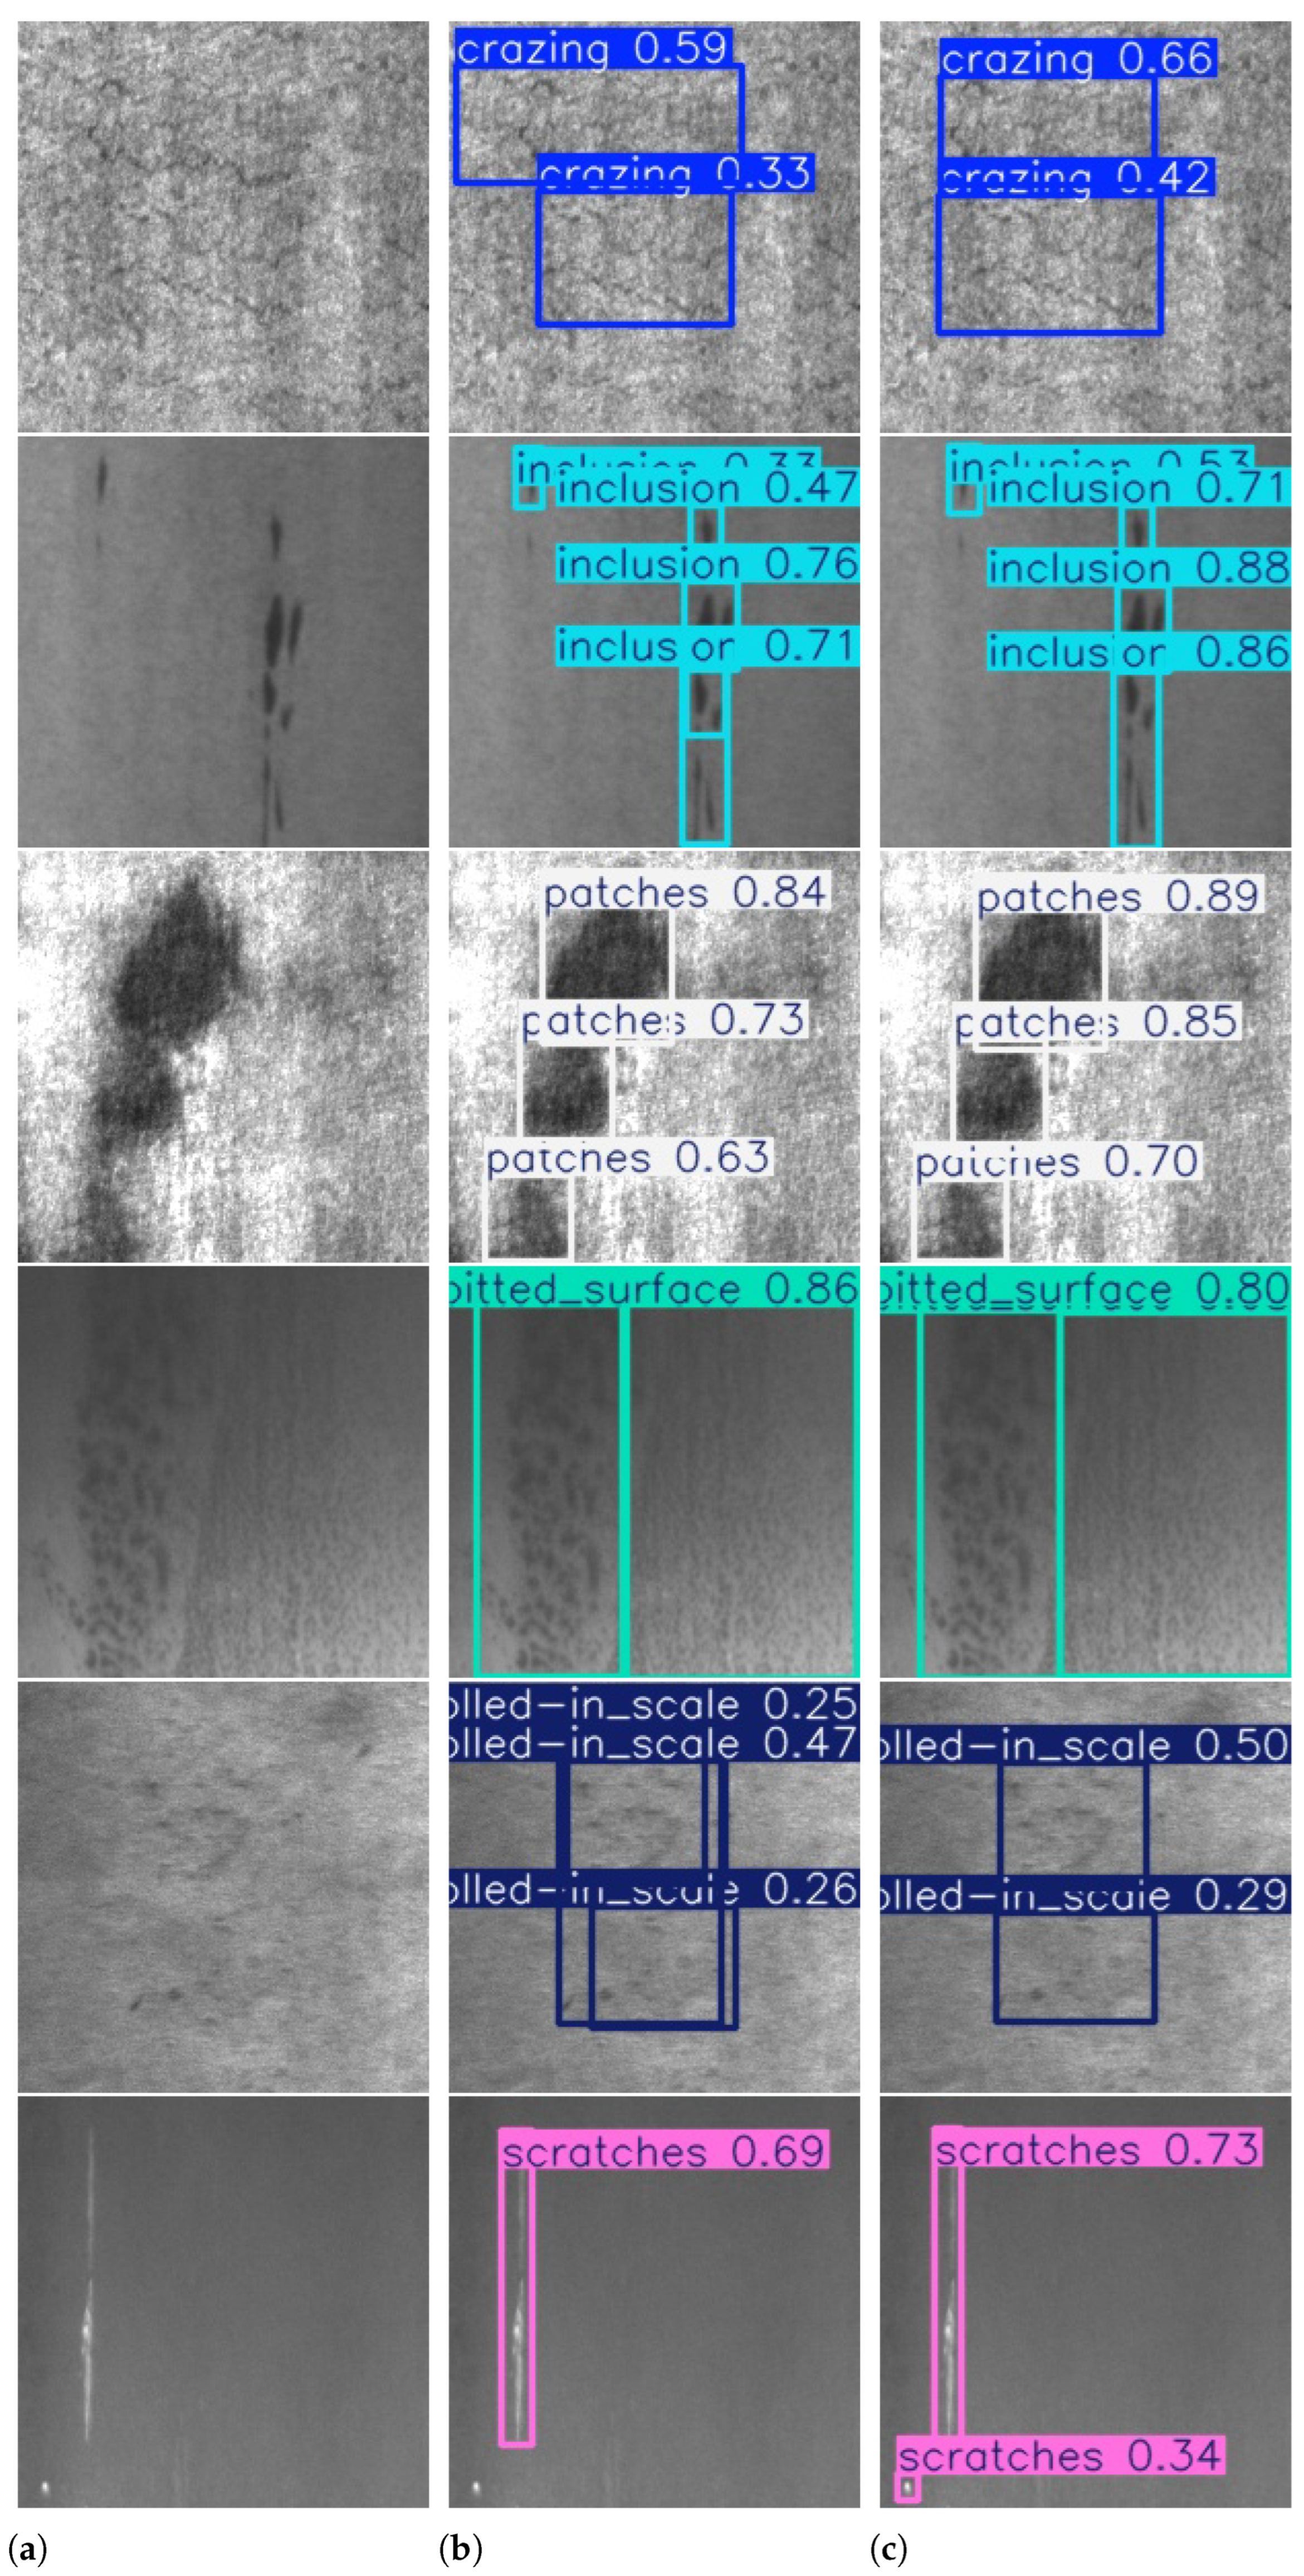
4.4. Experimental Results
4.5. The Result of Ablation Study
5. Discussion
6. Conclusions
Author Contributions
Funding
Data Availability Statement
Conflicts of Interest
References
- Alexey Grishin, BorisV, iBardintsev, Inversion, and Oleg. Severstal: Steel Defect Detection. Kaggle. 2019. Available online: https://kaggle.com/competitions/severstal-steel-defect-detection (accessed on 12 May 2025).
- Tabernik, D.; Šela, S.; Skvarč, J.; Skočaj, D. Segmentation-Based Deep-Learning Approach for Surface-Defect Detection. J. Intell. Manuf. 2019, 31, 759–776. [Google Scholar] [CrossRef]
- Tang, S.; He, F.; Huang, X.; Yang, J. Online PCB defect detector on a new PCB defect dataset. arXiv 2019, arXiv:1902.06197. [Google Scholar]
- Shi, Y.; Cui, L.; Qi, Z.; Meng, F.; Chen, Z. Automatic road crack detection using random structured forests. IEEE Trans. Intell. Transp. Syst. 2016, 17, 3434–3445. [Google Scholar] [CrossRef]
- Cui, L.; Qi, Z.; Chen, Z.; Meng, F.; Shi, Y. Pavement Distress Detection Using Random Decision Forests. In Data Science, Proceedings of the Second International Conference, Sydney, Australia, 8–9 August 2015; Springer: Cham, Switzerland, 2015; pp. 95–102. [Google Scholar]
- Zhou, X.; Fang, H.; Liu, Z.; Zheng, B.; Sun, Y.; Zhang, J.; Yan, C. Dense attention-guided cascaded network for salient object detection of strip steel surface defects. IEEE Trans. Instrum. Meas. 2021, 71, 1–14. [Google Scholar] [CrossRef]
- Hu, J.; Shen, L.; Sun, G. Squeeze-and-excitation networks. In Proceedings of the IEEE Conference on Computer Vision and Pattern Recognition, Salt Lake City, UT, USA, 18–22 June 2018; pp. 7132–7141. [Google Scholar]
- Qi, Y.; He, Y.; Qi, X.; Zhang, Y.; Yang, G. Dynamic snake convolution based on topological geometric constraints for tubular structure segmentation. In Proceedings of the IEEE/CVF International Conference on Computer Vision, Paris, France, 2–6 October 2023; pp. 6070–6079. [Google Scholar]
- Wu, T.; Tang, S.; Zhang, R.; Cao, J.; Zhang, Y. Cgnet: A light-weight context guided network for semantic segmentation. IEEE Trans. Image Process. 2020, 30, 1169–1179. [Google Scholar] [CrossRef]
- Liu, S.; Huang, D.; Wang, Y. Learning spatial fusion for single-shot object detection. arXiv 2019, arXiv:1911.09516. [Google Scholar]
- O’shea, K.; Nash, R. An introduction to convolutional neural networks. arXiv 2015, arXiv:1511.08458. [Google Scholar]
- LeCun, Y.; Bottou, L.; Bengio, Y.; Haffner, P. Gradient-based learning applied to document recognition. Proc. IEEE 1998, 86, 2278–2324. [Google Scholar] [CrossRef]
- Krizhevsky, A.; Sutskever, I.; Hinton, G.E. Imagenet classification with deep convolutional neural networks. In Proceedings of the Advances in Neural Information Processing Systems 25 (NIPS 2012), Lake Tahoe, NV, USA, 3–6 December 2012. [Google Scholar]
- Simonyan, K.; Zisserman, A. Very deep convolutional networks for large-scale image recognition. arXiv 2014, arXiv:1409.1556. [Google Scholar]
- Szegedy, C.; Liu, W.; Jia, Y.; Sermanet, P.; Reed, S.; Anguelov, D.; Erhan, D.; Vanhoucke, V.; Rabinovich, A. Going deeper with convolutions. In Proceedings of the IEEE Conference on Computer Vision and Pattern Recognition, Boston, MA, USA, 7–12 June 2015; pp. 1–9. [Google Scholar]
- He, K.; Zhang, X.; Ren, S.; Sun, J. Deep residual learning for image recognition. In Proceedings of the IEEE Conference on Computer Vision and Pattern Recognition, Las Vegas, NV, USA, 27–30 June 2016; pp. 770–778. [Google Scholar]
- Redmon, J.; Divvala, S.; Girshick, R.; Farhadi, A. You only look once: Unified, real-time object detection. In Proceedings of the IEEE Conference on Computer Vision and Pattern Recognition, Las Vegas, NV, USA, 27–30 June 2016; pp. 779–788. [Google Scholar]
- Zhukov, A.; Rivero, A.; Benois-Pineau, J.; Zemmari, A.; Mosbah, M. A hybrid system for defect detection on rail lines through the fusion of object and context information. Sensors 2024, 24, 1171. [Google Scholar] [CrossRef]
- Yuan, Z.; Tang, X.; Ning, H.; Yang, Z. Lw-yolo: Lightweight deep learning model for fast and precise defect detection in printed circuit boards. Symmetry 2024, 16, 418. [Google Scholar] [CrossRef]
- Gao, R.; Chen, M.; Pan, Y.; Zhang, J.; Zhang, H.; Zhao, Z. LGR-Net: A Lightweight Defect Detection Network Aimed at Elevator Guide Rail Pressure Plates. Sensors 2025, 25, 1702. [Google Scholar] [CrossRef] [PubMed]
- Dai, X.; Chen, Y.; Xiao, B.; Chen, D.; Liu, M.; Yuan, L.; Zhang, L. Dynamic head: Unifying object detection heads with attentions. In Proceedings of the IEEE/CVF Conference on Computer Vision and Pattern Recognition, Nashville, TN, USA, 20–25 June 2021; pp. 7373–7382. [Google Scholar]
- Liu, W.; Lu, H.; Fu, H.; Cao, Z. Learning to upsample by learning to sample. In Proceedings of the IEEE/CVF International Conference on Computer Vision, Paris, France, 2–6 October 2023; pp. 6027–6037. [Google Scholar]
- Dong, X.; Bao, J.; Chen, D.; Zhang, W.; Yu, N.; Yuan, L.; Chen, D.; Guo, B. Cswin transformer: A general vision transformer backbone with cross-shaped windows. In Proceedings of the IEEE/CVF Conference on Computer Vision and Pattern Recognition, New Orleans, LA, USA, 18–24 June 2022; pp. 12124–12134. [Google Scholar]
- Goshtasby, A. Template matching in rotated images. IEEE Trans. Pattern Anal. Mach. Intell. 1985, PAMI-7, 338–344. [Google Scholar]
- Mikolajczyk, K.; Zisserman, A.; Schmid, C. Shape recognition with edge-based features. In Proceedings of the British Machine Vision Conference (BMVC’03), Norwich, UK, 9–11 September 2003; Volume 2, pp. 779–788. [Google Scholar]
- Luo, Q.; Fang, X.; Liu, L.; Yang, C.; Sun, Y. Automated visual defect detection for flat steel surface: A survey. IEEE Trans. Instrum. Meas. 2020, 69, 626–644. [Google Scholar] [CrossRef]
- Wen, X.; Shan, J.; He, Y.; Song, K. Steel surface defect recognition: A survey. Coatings 2022, 13, 17. [Google Scholar] [CrossRef]
- Lv, X.; Duan, F.; Jiang, J.j.; Fu, X.; Gan, L. Deep metallic surface defect detection: The new benchmark and detection network. Sensors 2020, 20, 1562. [Google Scholar] [CrossRef]
- Yung, N.D.T.; Wong, W.; Juwono, F.H.; Sim, Z.A. Safety helmet detection using deep learning: Implementation and comparative study using YOLOv5, YOLOv6, and YOLOv7. In Proceedings of the 2022 International Conference on Green Energy, Computing and Sustainable Technology (GECOST), Miri Sarawak, Malaysia, 26–28 October 2022; pp. 164–170. [Google Scholar]
- Yu, F.; Koltun, V. Multi-scale context aggregation by dilated convolutions. arXiv 2015, arXiv:1511.07122. [Google Scholar]
- Chen, Y.; Dai, X.; Liu, M.; Chen, D.; Yuan, L.; Liu, Z. Dynamic convolution: Attention over convolution kernels. In Proceedings of the IEEE/CVF Conference on Computer Vision and Pattern Recognition, Seattle, WA, USA, 13–19 June 2020; pp. 11030–11039. [Google Scholar]
- Lin, T.Y.; Dollár, P.; Girshick, R.; He, K.; Hariharan, B.; Belongie, S. Feature pyramid networks for object detection. In Proceedings of the IEEE Conference on Computer Vision and Pattern Recognition, Honolulu, HI, USA, 21–26 July 2017; pp. 2117–2125. [Google Scholar]
- Bochkovskiy, A.; Wang, C.Y.; Liao, H.Y.M. Yolov4: Optimal speed and accuracy of object detection. arXiv 2020, arXiv:2004.10934. [Google Scholar]
- Bao, Y.; Song, K.; Liu, J.; Wang, Y.; Yan, Y.; Yu, H.; Li, X. Triplet-graph reasoning network for few-shot metal generic surface defect segmentation. IEEE Trans. Instrum. Meas. 2021, 70, 1–11. [Google Scholar] [CrossRef]
- Song, K.; Yan, Y. A noise robust method based on completed local binary patterns for hot-rolled steel strip surface defects. Appl. Surf. Sci. 2013, 285, 858–864. [Google Scholar] [CrossRef]
- He, Y.; Song, K.; Meng, Q.; Yan, Y. An end-to-end steel surface defect detection approach via fusing multiple hierarchical features. IEEE Trans. Instrum. Meas. 2019, 69, 1493–1504. [Google Scholar] [CrossRef]
- Tan, M.; Pang, R.; Le, Q.V. Efficientdet: Scalable and efficient object detection. In Proceedings of the IEEE/CVF Conference on Computer Vision and Pattern Recognition, Seattle, WA, USA, 13–19 June 2020; pp. 10781–10790. [Google Scholar]
- Ma, X.; Deng, X.; Kuang, H.; Liu, X. YOLOv7-BA: A Metal Surface Defect Detection Model Based On Dynamic Sparse Sampling And Adaptive Spatial Feature Fusion. In Proceedings of the 2024 IEEE 6th Advanced Information Management, Communicates, Electronic and Automation Control Conference (IMCEC), Chongqing, China, 24–26 May 2024; Volume 6, pp. 292–296. [Google Scholar]
- Pang, J.; Chen, K.; Shi, J.; Feng, H.; Ouyang, W.; Lin, D. Libra r-cnn: Towards balanced learning for object detection. In Proceedings of the IEEE/CVF Conference on Computer Vision and Pattern Recognition, Long Beach, CA, USA, 15–20 June 2019; pp. 821–830. [Google Scholar]
- Tian, Z.; Shen, C.; Chen, H.; FCOS, T.H. Fully convolutional one-stage object detection. In Proceedings of the CVF International Conference on Computer Vision (ICCV), Seoul, Republic of Korea, 27 October–2 November 2019; pp. 9626–9635. [Google Scholar]
- Selvaraju, R.R.; Cogswell, M.; Das, A.; Vedantam, R.; Parikh, D.; Batra, D. Grad-cam: Visual explanations from deep networks via gradient-based localization. In Proceedings of the IEEE International Conference on Computer Vision, Venice, Italy, 22–29 October 2017; pp. 618–626. [Google Scholar]
- Girshick, R.; Donahue, J.; Darrell, T.; Malik, J. Rich feature hierarchies for accurate object detection and semantic segmentation. In Proceedings of the IEEE Conference on Computer Vision and Pattern Recognition, Columbus, OH, USA, 23–28 June 2014; pp. 580–587. [Google Scholar]
- Lipton, Z.C. The mythos of model interpretability: In machine learning, the concept of interpretability is both important and slippery. Queue 2018, 16, 31–57. [Google Scholar] [CrossRef]


| Method | mAP50 | mAP50-95 | CRA | INC | PAT | PIT | RIS | SCR |
|---|---|---|---|---|---|---|---|---|
| EfficientDet [37] | 70.1 | - | 45.9 | 62.0 | 83.5 | 85.5 | 70.7 | 73.1 |
| YOLO-BA [38] | 74.8 | 38.8 | 36.3 | 67.8 | 91.0 | 96.6 | 70.6 | 86.4 |
| DDN [36] | 76.6 | - | 50.8 | 71.2 | 90.7 | 88.5 | 69.0 | 89.3 |
| YOLOv8n | 72.4 | 37.7 | 48.8 | 78.2 | 91.6 | 83.2 | 55.2 | 77.5 |
| YOLOv11n | 75.4 | 44.0 | 37.5 | 85.6 | 92.5 | 81.5 | 62.2 | 92.9 |
| YOLOv8l | 73.5 | 37.7 | 54.0 | 73.9 | 93.3 | 80.1 | 51.4 | 88.6 |
| YOLOv11l | 75.2 | 45.4 | 38.1 | 87.8 | 90.9 | 82.6 | 59.0 | 92.7 |
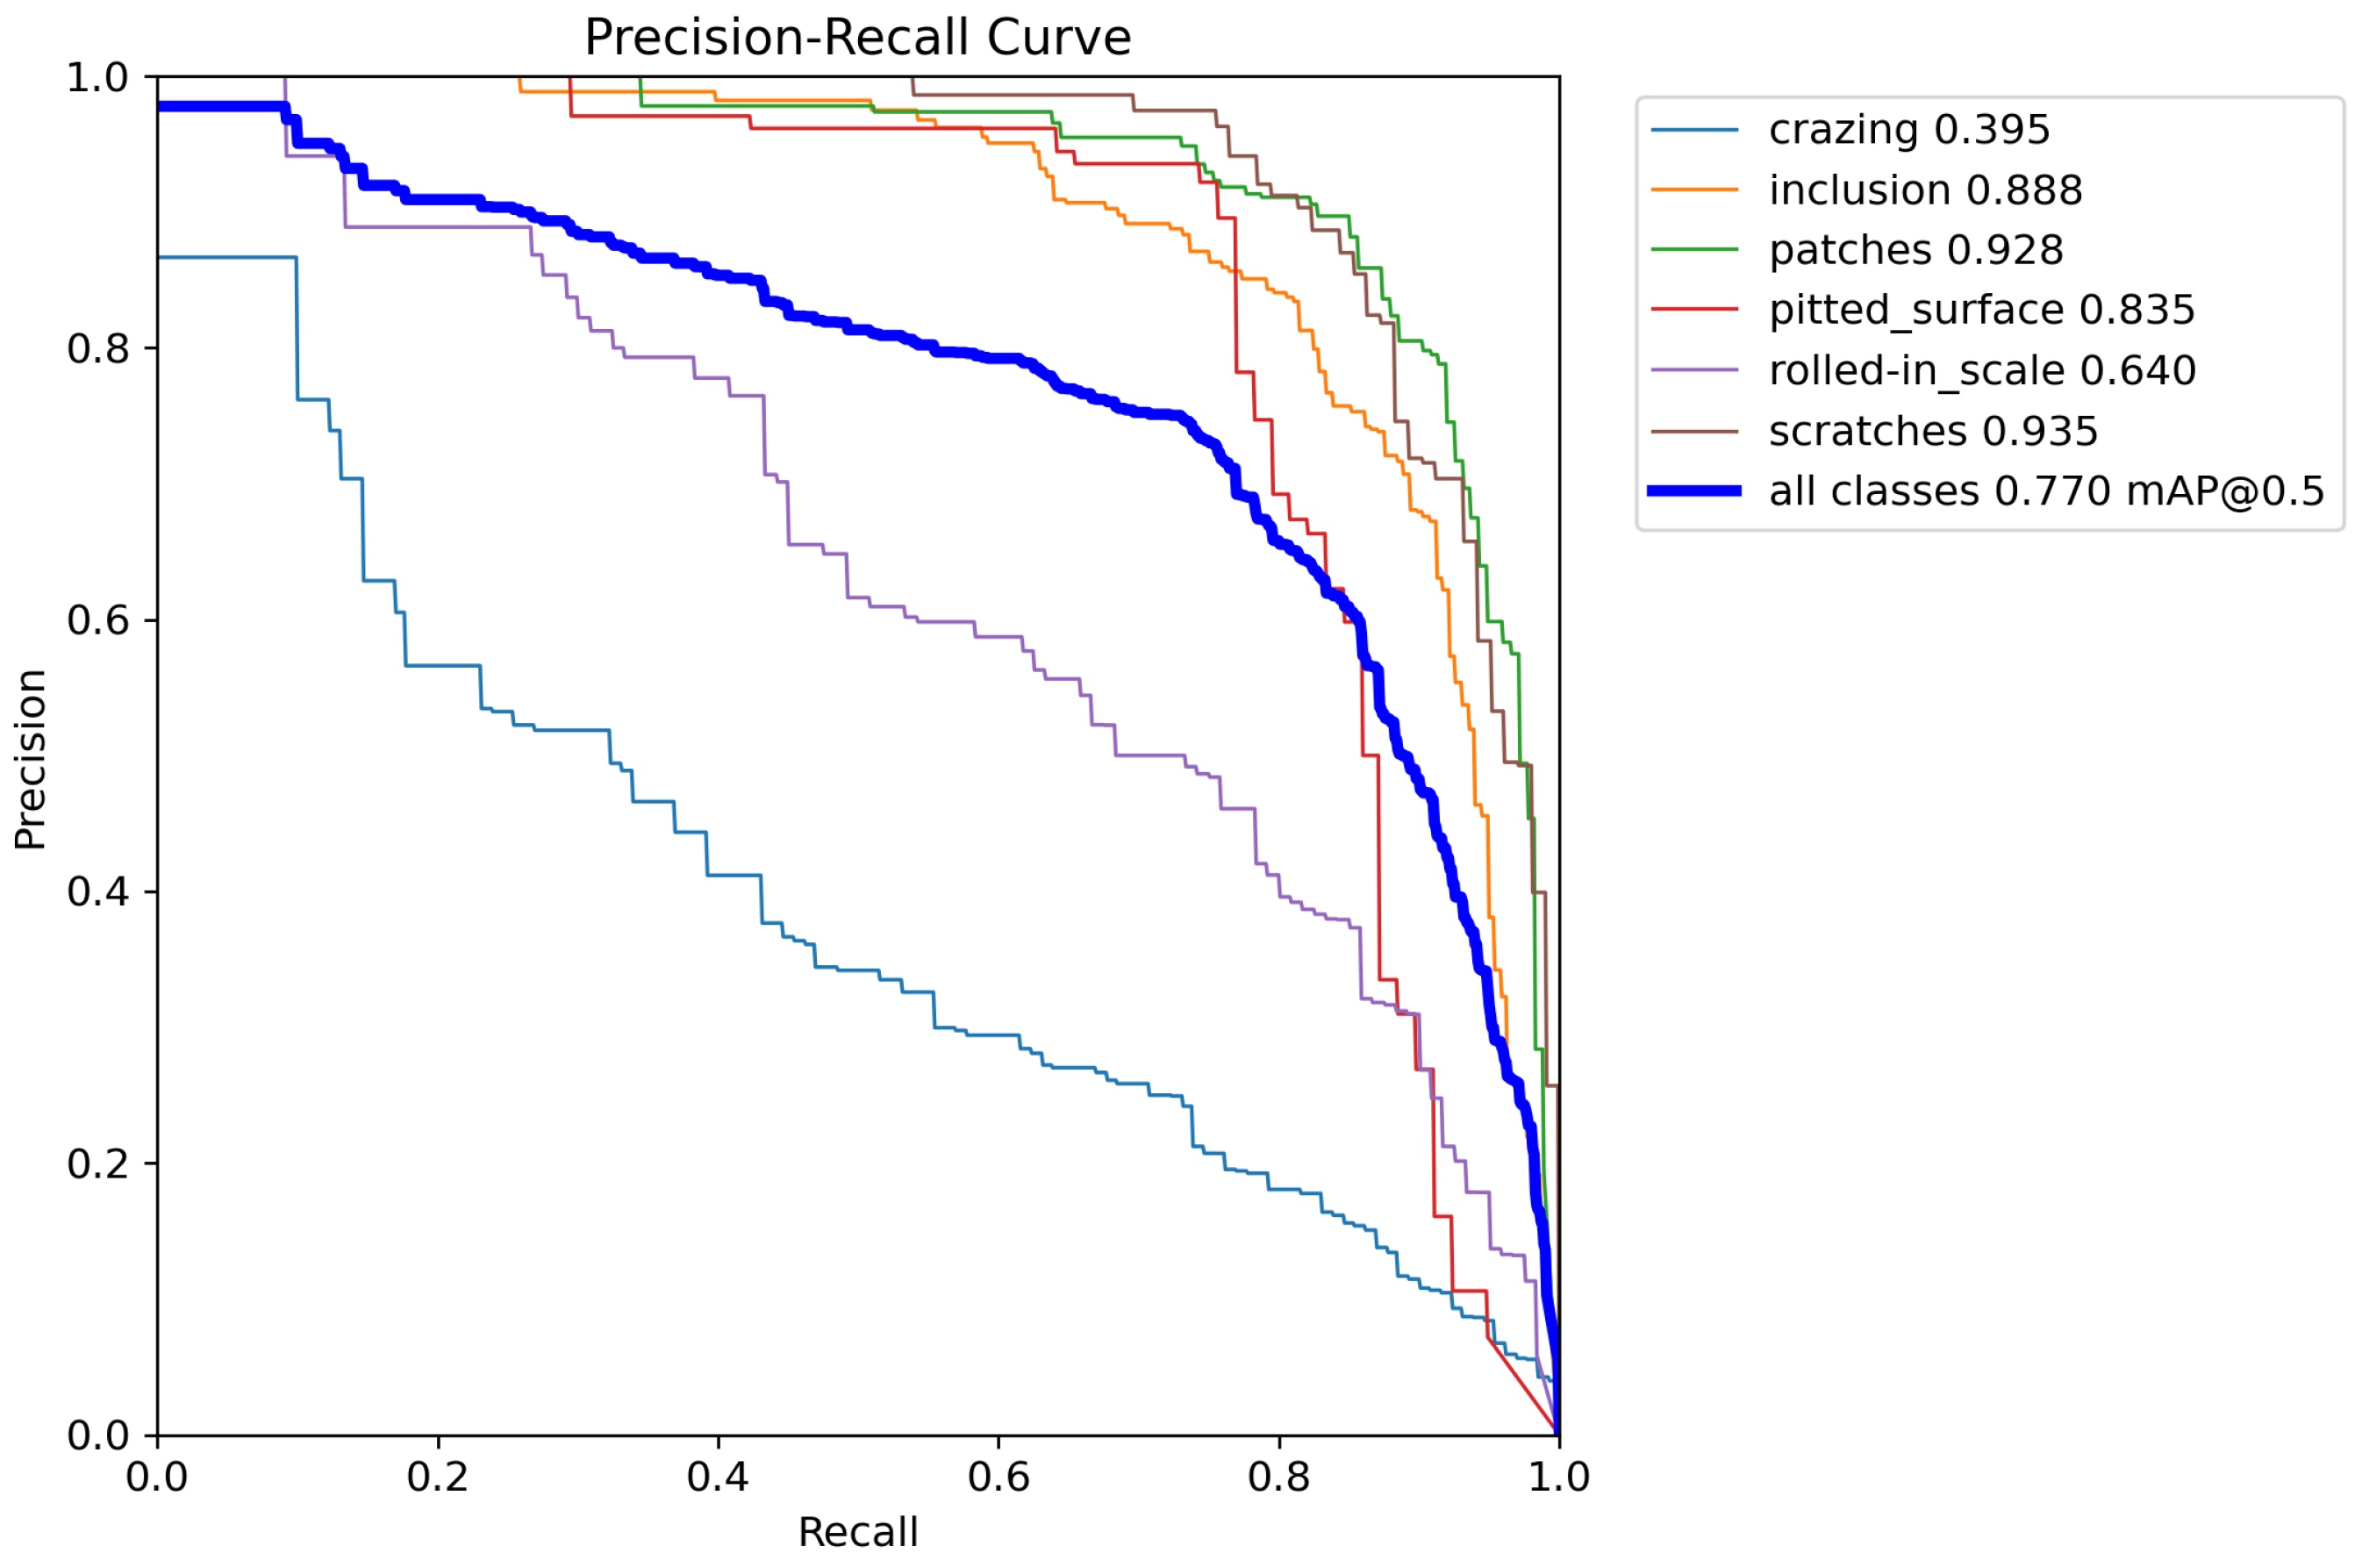
| DCA-YOLO | 77.0 | 45.4 | 39.5 | 88.8 | 92.8 | 83.5 | 64.0 | 93.5 |
| Method | Pu | Wl | Cg | Ws | Os | Ss | In | Rp | Cr | Wf | mAP |
|---|---|---|---|---|---|---|---|---|---|---|---|
| Libra Faster R-CNN [39] | 99.5 | 42.9 | 94.9 | 72.8 | 72.1 | 62.8 | 18.8 | 37.4 | 17.6 | 69.3 | 58.8 |
| FCOS [40] | 96.7 | 57.3 | 93.0 | 73.6 | 61.8 | 61.5 | 21.3 | 35.7 | 25.1 | 84.2 | 61.2 |
| YOLOv8n | 95.0 | 86.9 | 88.2 | 79.1 | 62.2 | 58.4 | 30.6 | 5.3 | 39.9 | 76.1 | 62.2 |
| YOLOv11n | 98.5 | 89.5 | 91.6 | 79.9 | 65.1 | 57.1 | 30.8 | 9.8 | 34.7 | 68.9 | 62.6 |
| DCA-YOLO | 98.6 | 93.4 | 96.0 | 80.7 | 63.7 | 56.5 | 34.6 | 15.2 | 31.5 | 74.1 | 64.4 |
| Model | P | R | mAP50 | mAP50-95 |
|---|---|---|---|---|
| YOLOv8n | 0.671 | 0.685 | 0.724 | 0.377 |
| +ContextGuide | 0.747 | 0.678 | 0.761 | 0.452 |
| +DSConv | 0.674 | 0.733 | 0.763 | 0.445 |
| +Detect_ASFF | 0.664 | 0.749 | 0.759 | 0.454 |
Disclaimer/Publisher’s Note: The statements, opinions and data contained in all publications are solely those of the individual author(s) and contributor(s) and not of MDPI and/or the editor(s). MDPI and/or the editor(s) disclaim responsibility for any injury to people or property resulting from any ideas, methods, instructions or products referred to in the content. |
© 2025 by the authors. Licensee MDPI, Basel, Switzerland. This article is an open access article distributed under the terms and conditions of the Creative Commons Attribution (CC BY) license (https://creativecommons.org/licenses/by/4.0/).
Share and Cite
Xu, H.; Zhang, Z.; Ye, H.; Song, J.; Chen, Y. Efficient Steel Surface Defect Detection via a Lightweight YOLO Framework with Task-Specific Knowledge-Guided Optimization. Electronics 2025, 14, 2029. https://doi.org/10.3390/electronics14102029
Xu H, Zhang Z, Ye H, Song J, Chen Y. Efficient Steel Surface Defect Detection via a Lightweight YOLO Framework with Task-Specific Knowledge-Guided Optimization. Electronics. 2025; 14(10):2029. https://doi.org/10.3390/electronics14102029
Chicago/Turabian StyleXu, He, Zhibo Zhang, Hairong Ye, Jinyu Song, and Yanbing Chen. 2025. "Efficient Steel Surface Defect Detection via a Lightweight YOLO Framework with Task-Specific Knowledge-Guided Optimization" Electronics 14, no. 10: 2029. https://doi.org/10.3390/electronics14102029
APA StyleXu, H., Zhang, Z., Ye, H., Song, J., & Chen, Y. (2025). Efficient Steel Surface Defect Detection via a Lightweight YOLO Framework with Task-Specific Knowledge-Guided Optimization. Electronics, 14(10), 2029. https://doi.org/10.3390/electronics14102029