Abstract
The integration of Distributed Energy Resources (DERs) such as photovoltaic (PV) systems, battery energy storage systems (BESSs), and electric vehicles (EVs) introduces new challenges to distribution networks despite offering opportunities for decarbonization and grid flexibility. This paper proposes a scalable simulation-based framework that combines deterministic nodal hosting capacity analysis with probabilistic Monte Carlo simulations to evaluate and optimize DER integration in diverse feeder types. The methodology is demonstrated using the IEEE 13-bus and 123-bus test systems under full-year time-series simulations. Deterministic hosting capacity analysis shows that individual nodes can accommodate up to 76% of base load from PV sources, while Monte Carlo analysis reveals a network-wide average hosting capacity of 62%. Uncoordinated DER deployment leads to increased system losses, overvoltages, and thermal overloads. In contrast, coordinated integration achieves up to 38.7% reduction in power losses, 25% peak demand shaving, and voltage improvements from 0.928 p.u. to 0.971 p.u. Additionally, congestion-centric optimization reduces thermal overload indices by up to 65%. This framework aids utilities and policymakers in making informed decisions on DER planning by capturing both spatial and stochastic constraints. Its modular design allows for flexible adaptation across feeder scales and configurations. The results highlight the need for node-specific deployment strategies and probabilistic validation to ensure reliable, efficient DER integration. Future work will incorporate optimization-driven control and hardware-in-the-loop testing to support real-time implementation.
1. Introduction
1.1. Background on Distributed Energy Resources (DERs)
The electric power industry is undergoing a transformative evolution driven by the increasing penetration of Distributed Energy Resources (DERs). DERs include small-scale, modular generation and storage technologies such as photovoltaic (PV) systems, wind turbines, battery energy storage systems (BESSs), microturbines, electric vehicles (EVs), and combined heat and power (CHP) units that are typically connected at the distribution level of the power grid [1,2]. Unlike traditional centralized power generation systems, DERs are decentralized and often sited close to the point of energy consumption, enabling benefits such as reduced transmission losses, improved voltage regulation, and enhanced supply reliability [3].
The global push for carbon neutrality, the decline in the cost of renewable energy technologies, and advances in power electronics have significantly accelerated the adoption of DERs in residential, commercial, and industrial sectors. DERs play a critical role in enabling the transition to a low-carbon energy system by facilitating the integration of renewable energy and enhancing the flexibility of distribution networks. Moreover, the increased deployment of smart meters, real-time communication infrastructure, and advanced energy management systems has made the coordinated control and monitoring of DERs increasingly feasible [4].
Despite these opportunities, the widespread integration of DERs poses several operational and planning challenges. Distribution networks were traditionally designed for unidirectional power flow from central generation to end-users. However, with DERs enabling bi-directional flows, several issues such as voltage fluctuations, protection coordination, reverse power flows, and local congestion have emerged. These challenges necessitate comprehensive studies to evaluate the technical impact of DERs and formulate strategies for their optimal placement and operation [5].
1.2. Challenges in Distribution Networks: Congestion and Performance Degradation
While DERs offer substantial benefits to the grid, their arbitrary or uncoordinated placement can exacerbate existing network constraints and create new challenges. One of the most critical concerns is distribution network congestion, defined as the condition in which one or more lines or transformers operate beyond their thermal, voltage, or stability limits. This can occur either due to excessive power injection from DERs during low-demand periods or because of demand clustering in urban feeders with limited infrastructure redundancy. Congestion leads to increased system losses, voltage deviation, equipment wear, and potential service interruptions [5,6].
In networks with high DER penetration, the risk of congestion is further amplified due to the variability and intermittency of renewable energy sources. For example, PV systems exhibit stochastic output based on solar irradiance, which can cause power injection to fluctuate significantly over short time intervals. This can lead to sudden changes in power flows, causing transient overloads or voltage violations in various parts of the system. Additionally, reverse power flows, a phenomenon where surplus energy generated by DERs is pushed back into the upstream grid, can complicate the protection schemes originally designed for unidirectional current flow [7,8].
Moreover, DERs affect the load flow pattern, altering the voltage profile across the network. Studies have shown that improper placement of DERs can worsen voltage conditions, create unbalanced voltages in multi-phase systems, and lead to the need for additional reactive power compensation. These effects are particularly problematic in radial and weakly meshed distribution systems where the lack of alternative pathways for power routing increases sensitivity to DER location and size [9,10].
Given these challenges, it is imperative to assess the impact of DERs on grid performance through rigorous simulation and analysis. This involves both deterministic and probabilistic approaches to capture the wide range of operating conditions that can result from DER variability and load uncertainty.
1.3. Importance of Optimal DER Placement
Optimal placement of DERs in the distribution system is crucial for maximizing their benefits and minimizing adverse effects. Strategically sited DERs can alleviate congestion, support voltage profiles, reduce real and reactive power losses, and improve overall system resilience. Conversely, random or consumer-driven placement may result in local over-generation, feeder overload, and inefficient utilization of network assets.
The optimal siting and sizing of DERs are often formulated as multi-objective optimization problems, incorporating technical, economic, and environmental objectives under system constraints. Key objectives include minimizing system losses, maximizing voltage stability, reducing operating costs, and enhancing renewable energy utilization. Constraints typically involve voltage limits, thermal ratings of lines and transformers, power balance, and DER capacity bounds [5,6].
Optimal placement also plays a significant role in enhancing the hosting capacity of distribution networks. Hosting capacity refers to the maximum amount of DERs that can be integrated without adversely affecting power quality or system reliability. Studies have shown that optimized placement significantly increases hosting capacity compared to uncontrolled integration.
Furthermore, with the increasing adoption of inverter-interfaced DERs, there is potential to exploit their control capabilities for reactive power support, frequency regulation, and harmonics mitigation. These advanced functionalities can only be fully realized when DERs are appropriately located and coordinated within the network context.
To ensure practical applicability, optimal placement algorithms must also account for uncertainty in load demand, generation output, and equipment parameters. This necessitates the integration of probabilistic methods such as Monte Carlo simulations with deterministic load flow and optimization frameworks.
1.4. Motivation and Research Gap
Despite the extensive body of the literature addressing DER integration, several key research gaps remain. Firstly, most existing studies focus on the deterministic evaluation of DER impacts, often neglecting the inherent variability and uncertainty associated with renewable DER outputs and dynamic load patterns. While deterministic analysis provides useful baseline assessments, it cannot capture the full spectrum of operational scenarios or the probability of constraint violations under fluctuating conditions.
Secondly, while optimization techniques such as Genetic Algorithm (GA), Particle Swarm Optimization (PSO), and Mixed-Integer Linear Programming (MILP) have been used for DER placement, few studies integrate these with comprehensive grid performance analysis, especially under uncertain operating conditions. Moreover, many optimization models prioritize objectives such as loss reduction or voltage regulation, with limited attention to congestion mitigation as a standalone performance metric.
Thirdly, prior research often focuses on a limited set of benchmark systems (e.g., IEEE 33-bus or 69-bus test systems), which may not represent the diversity of real-world distribution network topologies. This limits the generalizability of the findings and makes it difficult to develop universal DER placement strategies.
Finally, there is a lack of integrated frameworks that combine nodal power flow analysis, probabilistic simulation, and optimal placement in a scalable and computationally efficient manner. Such frameworks are essential for utilities and planners who must assess the grid-wide impact of DER deployment under a range of operating scenarios and identify strategies that ensure both reliability and performance enhancement.
This study addresses these gaps by developing a unified approach that integrates deterministic nodal analysis with probabilistic Monte Carlo simulations and focuses on optimal DER placement for congestion mitigation and performance enhancement across diverse distribution system configurations.
1.5. Paper Contributions
Unlike many existing studies that primarily focus on loss minimization and voltage regulation, this work places explicit emphasis on congestion mitigation as a central and independent optimization objective, quantified through a normalized congestion index based on the thermal loading of branches. Furthermore, the proposed framework uniquely combines node-specific hosting capacity thresholds with a multi-stage optimization process that integrates deterministic screening and probabilistic validation. This allows the framework to not only identify optimal DER placements under static assumptions but also verify their robustness under uncertain operating conditions using Monte Carlo simulations. By embedding congestion-centric metrics directly into the objective function and validating across thousands of randomized DER scenarios, this study advances a more practical and operationally meaningful strategy for distribution-level DER planning. The major contributions of this work are as follows:
- A comprehensive impact analysis framework that combines deterministic nodal power flow studies with probabilistic Monte Carlo simulations to evaluate the performance of distribution networks under high DER penetration.
- A congestion-centric optimization model for DER placement that explicitly targets the minimization of thermal overloads, voltage violations, and power losses, thereby improving grid operational performance.
- Application of the proposed framework to multiple benchmark systems, including the IEEE 13-bus and 123-bus distribution networks, to validate its scalability, robustness, and effectiveness under diverse configurations.
- Detailed analysis of key performance metrics including line loading, nodal voltage profiles, system losses, and congestion indices under various DER penetration levels and placement strategies.
- Integration of DER variability through Monte Carlo simulations to assess the statistical distribution of outcomes and ensure that the proposed solutions are not only optimal but also robust under uncertainty.
1.6. Organization of the Paper
The remainder of the paper is structured as follows. Section 2 presents an in-depth review of the relevant literature, covering prior studies on DER integration, congestion mitigation strategies, and placement optimization techniques. Section 3 outlines the proposed methodology, including system modeling, nodal analysis, and the Monte Carlo simulation framework used for probabilistic performance evaluation. Section 4 formulates the optimization problem for DER placement with congestion mitigation as the primary objective and describes the constraints and placement strategy adopted. Section 5 provides a comprehensive set of case studies and simulation results on different IEEE test systems, demonstrating the efficacy of the proposed approach in real-world scenarios. The impact of DER variability and placement strategies on voltage stability, congestion relief, and system losses is thoroughly discussed. Finally, Section 6 concludes the paper by summarizing the key findings, practical implications, and directions for future research, including dynamic control of DERs, real-time system monitoring, and the potential for hardware-in-the-loop validation.
2. Literature Review
2.1. Existing Studies on DER Integration and Grid Congestion
2.1.1. Technical Impact of DERs on Distribution Systems
The rapid integration of DERs particularly rooftop PV systems and distributed BESS has transformed traditional radial and weakly meshed distribution networks into complex, decentralized grids. Early studies identified potential improvements in voltage regulation, reduction in real power losses, and enhancement of power quality when DERs are strategically integrated. However, uncoordinated deployment often leads to voltage fluctuations, reverse power flow, and thermal overloading of components, particularly in aging infrastructure not designed for bidirectional flows [11].
Voltage rise during low-load, high-generation scenarios has been reported in several field studies. Such overvoltage events, if persistent, can damage consumer appliances and necessitate frequent intervention from voltage regulators. Conversely, insufficient DER contribution during peak demand can fail to relieve loading on critical branches, thereby increasing the need for upstream generation and stressing transformer capacity [12].
2.1.2. Grid Congestion Issues with DER Penetration
Congestion in distribution networks typically arises when the power injected by DERs causes certain feeders or transformers to operate beyond their thermal or voltage stability limits. Research has shown that DERs placed without regard to load location and network impedance can cause localized congestion while leaving other areas underutilized [13].
A significant body of work has used congestion indices, calculated from line loading and nodal voltage violations, to quantify the stress on distribution lines due to DERs. These indices help in identifying congestion hotspots, which become candidates for demand management, infrastructure reinforcement, or controlled DER deployment. However, most studies still focus more heavily on loss reduction or voltage profile improvements, leaving congestion mitigation less explored as a standalone objective. However, most existing studies assess congestion as a consequence of DER injection rather than modeling it as a primary optimization objective, leaving a gap in proactive congestion-focused planning.
2.2. Placement and Sizing Strategies
2.2.1. Centralized vs. Decentralized Placement Approaches
Placement strategies in the literature can broadly be categorized into centralized (planner-based) and decentralized (customer-driven or market-based) schemes. In centralized approaches, utilities or distribution system operators (DSOs) determine the optimal locations and sizes of DERs using global system information and optimization models. These approaches offer better coordination but require extensive data and communication infrastructure [14].
Decentralized strategies, while more practical under current DER deployment trends, are less predictable and often lead to suboptimal system performance. Several researchers have proposed market-based incentives or locational pricing to influence decentralized DER siting decisions and align them with system objectives.
2.2.2. Sensitivity-Based and Rule-Based Techniques
Some early placement techniques used sensitivity indices based on load-flow Jacobians to assess the impact of DER injection at various buses. Metrics such as loss sensitivity factor (LSF) and voltage stability index (VSI) were used to rank candidate buses for DER placement [15,16]. Rule-based methods used heuristics like placing DERs at the end of feeders or at high-load buses.
Although simple and computationally efficient, these methods are static and fail to account for multi-period or uncertainty-driven impacts. They also often optimize a single objective commonly loss reduction without considering grid constraints or stochastic behavior. These techniques often lack robustness to dynamic loading and stochastic DER behavior, which limits their applicability to high-resolution planning scenarios.
2.3. Methodologies Used in Prior Work
2.3.1. Optimization Techniques for DER Placement
Recent research has employed a range of optimization algorithms to solve the DER placement problem under nonlinear, multi-objective settings.
Genetic Algorithm (GA)
GA has been widely used due to its robustness and global search capability. In [17], GA was used to minimize power losses while satisfying bus voltage and line loading constraints. Chromosome encoding allowed the representation of the cost function of variables, and selection operators ensured convergence toward feasible, low-loss configurations [18,19].
Modified Chromosome Pooling Genetic Algorithm (MCPGA)
The Modified Chromosome Pooling Genetic Algorithm (MCPGA) is an enhanced version of the traditional GA that improves population diversity and convergence speed by introducing a chromosome memory pool, which selectively retains high-quality genetic material across generations. This approach reduces premature convergence and enhances global search performance, making it well suited for complex resource allocation and DER placement problems. Studies have shown MCPGA to outperform conventional GA in terms of solution quality and computational efficiency, especially under multi-objective constraints [20].
Particle Swarm Optimization (PSO)
PSO has gained popularity due to its fewer control parameters and faster convergence. It is often used in multi-objective optimization frameworks where DER placement must trade off between voltage regulation, loss minimization, and cost. However, PSO performance heavily depends on swarm initialization and parameter tuning [21].
Simulated Annealing (SA)
Simulated Annealing (SA) is a probabilistic metaheuristic inspired by the annealing process in metallurgy, where controlled cooling allows systems to settle into low-energy states. In power systems, SA is used to solve complex, non-convex optimization problems like DER placement by accepting worse solutions with a certain probability of escaping local minima. Its simplicity, flexibility, and ability to handle discrete variables make it effective for topology optimization, loss minimization, and congestion relief in distribution networks [22,23].
Neural Network-Based and Machine Learning (ML) Approaches
Neural networks have been applied to model the nonlinear relationships between DER injections, voltage profiles, and system losses, particularly in unbalanced distribution systems. Multi-layer perceptrons (MLPs), convolutional neural networks (CNNs), and recurrent neural networks (RNNs) have been used for short-term load and generation forecasting, voltage violation detection, and predictive control of DERs under dynamic grid conditions [24,25].
Machine learning (ML) techniques, including support vector machines (SVMs), decision trees, reinforcement learning (RL), and clustering algorithms, offer data-driven frameworks for DER placement and dispatch. These methods are particularly useful when historical data are available, enabling grid-aware planning that adapts to seasonal patterns, topology changes, and real-time constraints. Reinforcement learning, in particular, has shown promise for adaptive control strategies where the environment is partially observable and the objective is multi-dimensional [25].
Mixed-Integer Linear/Nonlinear Programming (MILP/MINLP)
MILP and MINLP are favored in utility-scale planning problems where network constraints, cost structures, and DER operations are tightly integrated. Some works have solved DER siting and sizing problems using MILP while modeling time-varying loads and market participation. These methods provide mathematically rigorous solutions but are limited by problem size and nonlinearity [26].
Hybrid Approaches
Hybrid approaches combine deterministic load-flow simulations with metaheuristics or sensitivity analysis to reduce search space and computational effort by, for instance, combining VSI-based bus filtering with PSO to improve optimization convergence. Hybrid models are increasingly being explored to combine the best of analytical accuracy and heuristic flexibility [27,28].
2.3.2. Probabilistic Techniques and Monte Carlo Simulation
Deterministic optimization alone fails to capture the stochastic nature of DER output, especially for renewables. Therefore, probabilistic techniques have been proposed to assess the robustness and reliability of DER placement solutions.
Monte Carlo-Based Performance Evaluation
Monte Carlo simulation (MCS) is extensively used to quantify the variability in voltage, current, losses, and congestion under different DER scenarios. In [13], MCS was applied to assess the impact of solar PV uncertainty on system reliability and power quality. Thousands of DER output samples were generated from irradiance data, and load flows were computed for each realization [29].
Probabilistic Hosting Capacity Analysis
Hosting capacity refers to the maximum DER capacity that can be integrated without violating system constraints. Probabilistic methods have been used to derive confidence intervals for hosting capacity, which reflect not just the average but also the worst-case impact of DERs [30].
Scenario-Based Optimization
A more recent line of work integrates scenario-based stochastic optimization, where different DER and load profiles are treated as discrete scenarios within the optimization framework. While promising, this technique faces scalability issues, especially for large systems with many stochastic variables. Despite the potential of Monte Carlo simulations, few studies integrate these with deterministic hosting analysis and optimization workflows at nodal resolution.
2.4. DER Impact on Technical Performance Metrics
2.4.1. Power Loss Minimization
Reduction in real power losses is often the primary objective in DER placement. The rationale is that DERs located close to loads reduce the current magnitude over long distances, thus minimizing I2R losses. Empirical studies across IEEE 33, 69, and 123-bus systems show loss reductions of up to 25–35% under optimal DER deployment.
2.4.2. Voltage Profile Enhancement
Strategically located DERs can mitigate voltage drops in long feeders and provide voltage support to weak buses. Inverter-based DERs with reactive power capabilities have been particularly effective when combined with Volt/VAR control. Improper placement, however, can lead to overvoltage and unbalanced conditions [31].
2.4.3. Congestion Relief
Although less frequently prioritized, congestion relief has emerged as a critical metric, especially for urban feeders with high demand and limited redundancy. Studies have demonstrated that DERs, when located near congested lines or substations, can substantially alleviate thermal overloading [32].
2.4.4. Reliability and Resilience Enhancement
Several studies evaluate DERs under contingency scenarios and islanding conditions. Microgrid-enabled DER configurations are shown to sustain critical loads during grid outages, improving system resilience.
2.5. Summary of Research Gaps and Contributions
Despite notable advancements in DER integration studies, critical research gaps persist:
- Most existing works optimize DER placement based on losses or voltage but do not explicitly minimize congestion as a standalone metric.
- Probabilistic methods are used in isolation and are rarely embedded within placement optimization frameworks.
- Hosting capacity analyses often exclude BESS and EVs and do not incorporate statistical confidence bounds for constraint violations.
- Prior studies are typically applied to limited or idealized test systems, lacking generalizability to real-world feeder topologies.
This paper addresses these gaps by proposing a novel framework that carries out the following:
- Integrates deterministic nodal hosting analysis with stochastic Monte Carlo validation.
- Embeds a congestion-centric cost function into a multi-objective optimization model.
- Applies the approach to both compact (IEEE 13-bus) and large-scale (IEEE 123-bus) feeders to validate scalability.
- Provides a foundation for adaptive DER coordination through future extensions to metaheuristics and real-time control.
Table 1 shows a comparative summary of recent studies on DER placement and grid impact analysis. This work distinguishes itself through explicit congestion modeling via thermal indices, node-level hosting capacity constraints, and comprehensive probabilistic validation using Monte Carlo simulations.

Table 1.
Comparative summary of recent studies on DER optimization and grid impact analysis.
3. System Modeling and Methodology
This section outlines the modeling framework and methodological steps adopted in this study to analyze the impact and determine the optimal placement of Distributed Energy Resources (DERs) in distribution networks. The approach integrates deterministic power flow analysis with probabilistic Monte Carlo simulations, enabling a robust assessment of DER impacts under uncertain load and generation conditions.
3.1. Overview of Test Systems Used
To validate the proposed methodology, two benchmark radial distribution test systems are employed: the IEEE 13-bus and the IEEE 123-bus feeders [36]. These systems are widely recognized in distribution system research and represent small-scale and large-scale network configurations, respectively, each with distinct topological and loading characteristics.
The IEEE 13-bus system is characterized by a compact layout with unbalanced loading and several voltage control devices. It serves as a valuable testbed for evaluating local congestion, voltage rise, and sensitivity to DER placement in small-scale networks. The IEEE 123-bus system, on the other hand, represents a more realistic and complex distribution network, including multiple laterals, single- and three-phase lines, diverse load profiles, and long feeder branches. Its scale and diversity make it suitable for evaluating the scalability and robustness of DER planning strategies.
The line data, load profiles, and network topologies for both systems were obtained from the OpenDSS test suite [37] and verified for consistency with IEEE standard configurations. The base voltage levels for the simulations are 4.16 kV (IEEE 13-bus) and 4.8 kV (IEEE 123-bus), with the systems being operated under a nominal frequency of 60 Hz.
3.2. Load and DER Modeling
3.2.1. PV, BESS, and EV
To simulate realistic DER integration, this study considers three types of DER technologies: photovoltaic (PV) systems, battery energy storage systems (BESSs), and electric vehicle (EV) charging stations. Each of these DERs exhibits distinct operational behaviors and constraints that impact the overall system performance.
Photovoltaic (PV) Systems
PV systems are modeled as intermittent, active power sources with no reactive power compensation capability in their basic configuration. The instantaneous power output of a PV unit is a function of solar irradiance and temperature . The DC power output at time t is expressed as:
where is the rated output under standard test conditions (STCs), , °C, and are the temperature coefficients of the PV panel.
Battery Energy Storage Systems (BESSs)
BESS units are modeled as both active and reactive power resources with bi-directional capabilities. The storage system operates under a state-of-charge (SOC) constraint defined as:
subject to:
where and are the charging and discharging efficiencies, and are the charge and discharge powers, and is the time step duration.
Electric Vehicles (EVs)
EV charging stations are modeled as controllable loads with stochastic arrival and departure profiles. The aggregate load of EVs at a node is modeled using a probabilistic function derived from transportation data, with Gaussian mixture models used to represent time-of-use patterns.
3.2.2. Load Profile Variations (Time-Series or Static)
For each test system, two types of load models are considered:
- Static Load Model: A constant power model assuming fixed real and reactive loads at each node. This is used for baseline deterministic simulations.
- Time-Series Load Model: Hourly load data for residential and commercial customers is applied to capture diurnal variation. Load at each node i at time t is modeled as:where is the average load and is a normalized time-varying profile based on typical demand curves.
The inclusion of realistic load patterns is essential for evaluating the time-dependent impact of DERs and identifying peak-load periods where congestion is likely.
3.3. Nodal Power Flow and Congestion Analysis
3.3.1. Nodal Voltage and Current Analysis
The distribution power flow is modeled using the full three-phase backward/forward sweep method implemented in OpenDSS. At each iteration, nodal voltages and branch currents are updated based on Kirchhoff’s current and voltage laws (KCL/KVL). The convergence criterion is set at a voltage tolerance of 0.0001 p.u.
The voltage at node i is derived from:
where is the impedance matrix between the source and node i, and is the injected current from load or DER at node j.
Voltage violations are flagged when lies outside the acceptable operating range:
3.3.2. Identification of Congested Nodes
Congestion is identified by evaluating branch current magnitudes against thermal ampacity limits. For a line segment , the congestion index is defined as:
where is the rated current of the line. A branch is deemed congested if . All such branches and their corresponding upstream and downstream nodes are marked as congestion hotspots. These indices are aggregated to compute a system-wide congestion score.
3.4. Monte Carlo Simulations
3.4.1. Probabilistic Modeling of DER Penetration and Load Variability
To account for uncertainties in DER output and load demand, Monte Carlo simulation (MCS) is employed. Random samples of solar irradiance, ambient temperature, EV charging load, and time-varying demand are drawn from historical datasets and statistical distributions.
PV generation variability is modeled using a Beta distribution calibrated on historical irradiance data:
where is the Beta function. Similarly, EV charging demand is modeled using Gaussian mixture models to reflect peak arrival periods and cluster sizes.
Load scaling factors are generated from normal distributions:
where and are time-dependent mean and standard deviation derived from regional load data.
3.4.2. Scenario Generation and Statistical Impact Analysis
Each Monte Carlo iteration generates a unique combination of DER output and load profiles. For each scenario k, a complete power flow simulation is performed to obtain nodal voltages, branch currents, and loss metrics.
Let denote the outcome of scenario k. The expected value and variance of a system parameter Y over N trials is computed as:
Outputs of interest include the following:
- Expected total energy losses ;
- Probability of voltage violations ;
- Distribution of congestion indices ;
- DER hosting capacity under confidence level.
The statistical outcomes from MCS guide the robustness evaluation of optimal DER placement strategies.
3.5. Hosting Capacity Determination (Only Using PV) and Monte Carlo Simulations
This subsection details the methodology adopted to evaluate the photovoltaic (PV) hosting capacity of the IEEE 13-bus and 123-bus distribution systems. Hosting capacity is estimated solely for PV-based DERs without incorporating other technologies such as battery energy storage systems (BESSs) or electric vehicles (EVs). Two complementary methods are employed: (i) a deterministic step-based approach, and (ii) a probabilistic framework using Monte Carlo simulation. Both approaches are implemented using OpenDSS v10.10.1 and Python v3.13.0 via the py_dss_interface integration, allowing scalable and time-series-based simulation control.
3.5.1. Definition of Hosting Capacity
Hosting capacity is defined as the maximum aggregate PV generation that can be accommodated by the distribution network without violating voltage and thermal operational constraints. It is quantified as a percentage of the system’s peak load, as given by:
where
- : Hosting capacity percentage.
- : Total installed PV capacity across the network (kW).
- : Maximum real power demand (kW) across the simulation horizon.
3.5.2. Deterministic Evaluation Procedure
In the deterministic evaluation, PV capacity is incrementally increased in discrete steps (e.g., 50 kW) from 0 kW up to 2 MW. At each step, the system undergoes a full-year time-series power flow simulation using a load shape consisting of 8760 hourly data points. PV is assumed to follow a normalized generation profile, consistent across all sites. The method for determining PV-only hosting capacity is detailed in Algorithm 1.
The network is evaluated against the following constraints:
where
- : Voltage magnitude at node i at hour t (in p.u.).
- : Current magnitude on branch from node i to j at hour t.
- : Thermal ampacity (maximum current rating) of branch .
- : Set of all nodes in the system.
- : Set of all line segments or branches.
For each penetration level, PV is allocated across candidate nodes proportionally or based on fixed placement logic. At each node, PV generation is defined as:
where
- : Rated PV power at node i.
- : Normalized generation shape at time t (0–1).
For each simulation run, the following conditions are evaluated:
- If the voltage at any bus exceeds 1.05 p.u. or falls below 0.95 p.u.
- If the current in any line exceeds its rated capacity.
If any of these conditions are violated at any hour, the last non-violating PV level is considered the node’s hosting capacity. This process is repeated for all candidate nodes to determine node-specific and system-level hosting limits as shown in Figure 1.
| Algorithm 1 Hosting capacity determination (PV only) |
|
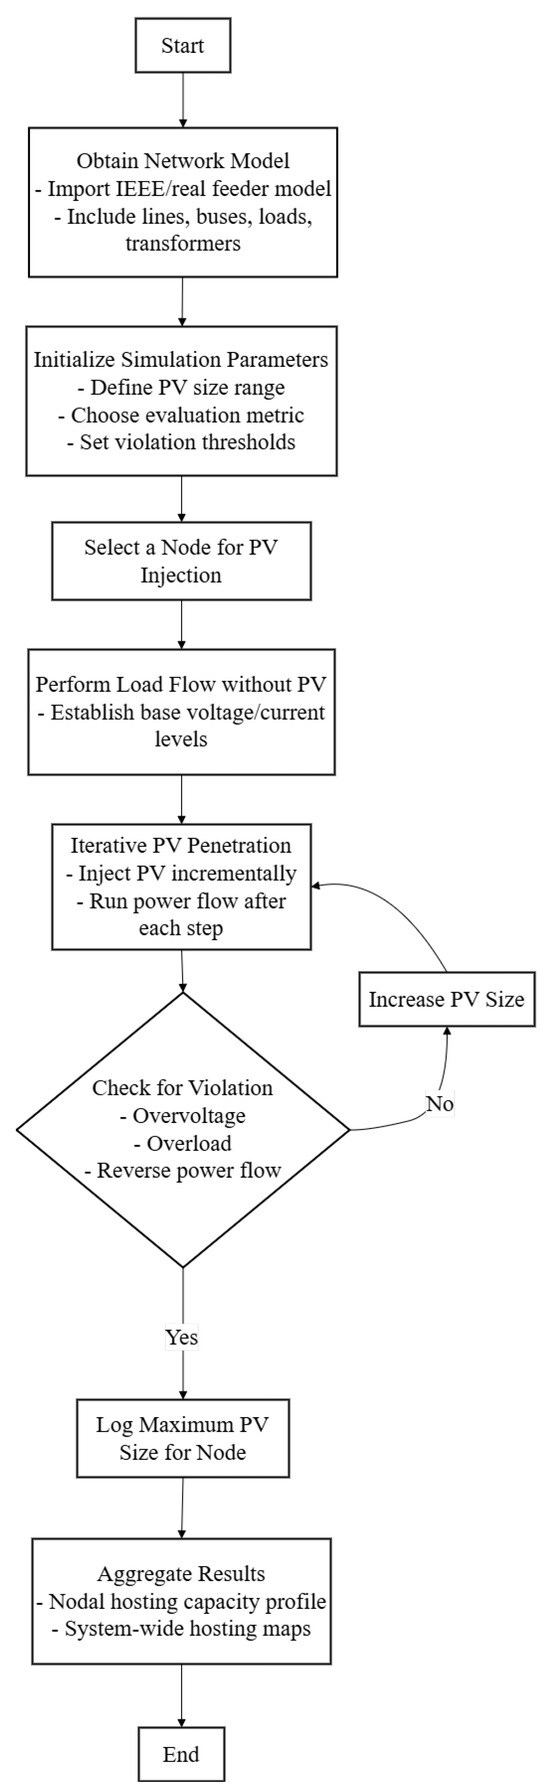
Figure 1.
Flowchart for PV hosting capacity evaluation.
3.5.3. Monte Carlo Simulation for Hosting Capacity Under Uncertainty
To incorporate uncertainties from solar irradiance variability and load fluctuations, a Monte Carlo-based probabilistic approach is adopted as shown in Figure 2. At each PV or DER (PV, EV, and BESS) penetration level, 500 random scenarios are simulated as shown in Algorithm 2 and Algorithm 3 respectively. Each scenario includes randomized hourly PV/DER generation and load profiles.
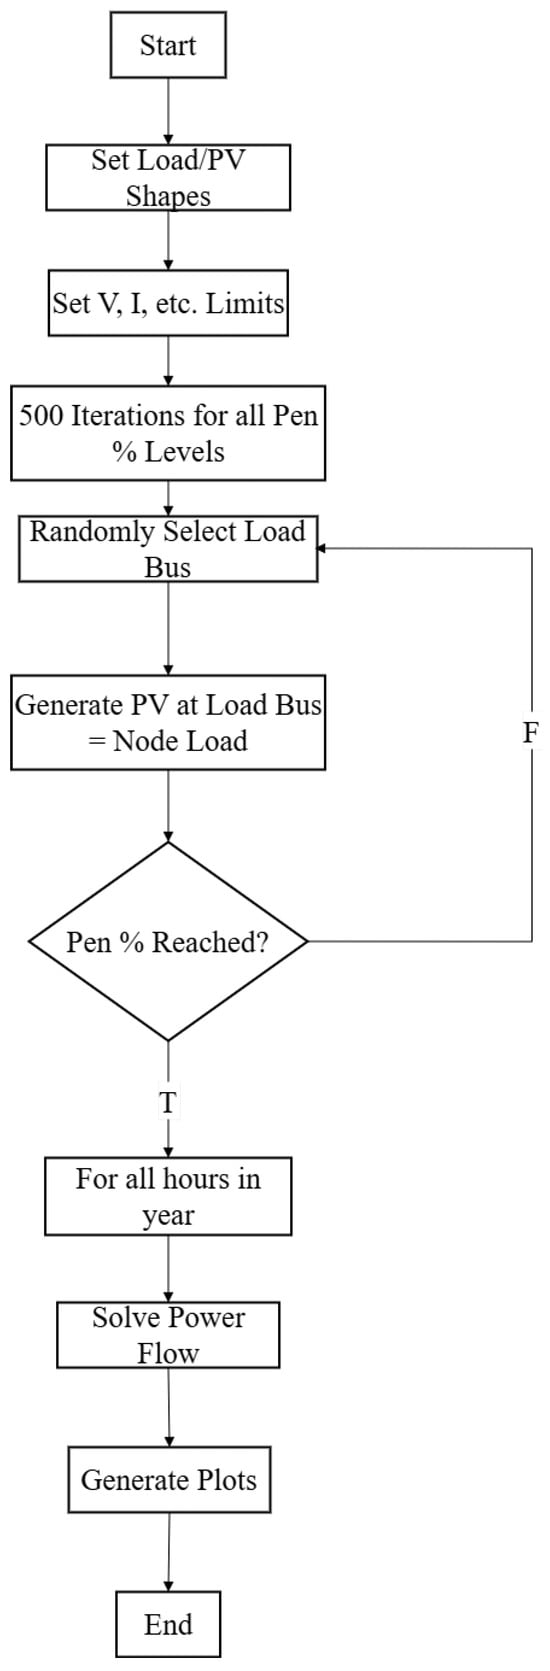
Figure 2.
Monte Carlo simulation flowchart.
PV generation is modeled using a Beta distribution:
where
- : Random variable modeling solar generation variability at time t, bounded in [0, 1].
- : Shape parameters for the Beta distribution, fitted using irradiance data.
Load variation is incorporated using Gaussian sampling:
where
- : Load scaling factor at hour t.
- : Hourly mean load multiplier (e.g., from historical load profile).
- : Standard deviation capturing uncertainty in load.
The probability of violation at each penetration level is defined as follows:
where
- : PV penetration level.
- : Number of Monte Carlo runs that experienced at least one violation.
- : Total number of Monte Carlo iterations (e.g., 500).
The hosting capacity at a specified reliability threshold (e.g., 5%) is given by:
| Algorithm 2 Monte Carlo simulation (PV only) |
|
| Algorithm 3 Monte Carlo simulation (PV, EV, and BESS) |
|
3.5.4. Execution Flow and Integration
The deterministic and Monte Carlo simulations as shown in Figure 2 are automated using Python in VS Code, leveraging the py_dss_interface to control OpenDSS from scripts. This setup allows dynamic injection of load shapes, PV profiles, and constraint checks per iteration. The full evaluation process is summarized via flowcharts and diagrams as shown in Figure 2 for repeatability and clarity.
3.5.5. Interpretation of Method
This methodology supports the following:
- Time-varying, node-specific hosting evaluations.
- Probabilistic assessments that offer confidence intervals on hosting limits.
- Grid-wide insights into voltage performance and congestion risks.
It also serves as a baseline for evaluating the benefits of advanced inverter controls, DER coordination strategies, and multi-DER scenarios in future studies.
4. Optimization Framework for DER Placement
The objective of this section is to formulate a comprehensive optimization framework for the strategic placement of Distributed Energy Resources (DERs) in distribution networks. The proposed framework is designed to minimize grid congestion, improve voltage profiles, and reduce system losses while adhering to system constraints and physical limitations. The optimization problem is multi-objective, constrained, and combinatorial in nature, and its formulation accounts for the nonlinear and uncertain characteristics of both load and generation in real-world distribution systems.
4.1. Objective Functions
4.1.1. Minimization of Line Overloads and Congestion Index
One of the primary goals of optimal DER placement is to alleviate thermal overloads on distribution lines and transformers. To quantify congestion, a normalized congestion index (CI) is used, which represents the ratio of actual current to rated current for each line segment.
Let be the current magnitude on branch , and be the corresponding thermal limit. The congestion index for branch is given by:
The total network congestion is defined as follows:
where is a weighting factor that prioritizes critical branches (e.g., main feeders, heavily loaded laterals). The objective is to minimize , ideally maintaining all .
To clarify the computation of , the current on branch is determined using the following standard formulation based on Ohm’s Law:
where and are the complex voltages at sending and receiving buses, and is the complex impedance of the line segment between nodes i and j. In the simulation environment, OpenDSS internally calculates as part of its unbalanced power flow solution using a full admittance matrix representation of the distribution network. The absolute magnitude is then used in Equation (19) to compute the congestion index for each line.
The IEEE 13-bus test system is modeled using the OpenDSS standard configuration, which includes detailed line impedances, transformer models, voltage regulators, and ZIP load profiles with hourly resolution. DER elements such as PV, BESS, and EVs are represented using OpenDSS’s PVSystem, Storage, and LoadShape objects, respectively. Thermal limits for branches are assigned using the NormAmps parameter, and simulations are run over an 8760 h annual horizon with time-series inputs for both load and generation.
4.1.2. Voltage Profile Improvement
Another objective is to improve the voltage profile across the network, ensuring that node voltages remain within acceptable bounds and are as close as possible to the nominal value (1.0 p.u.).
Let be the voltage magnitude at node i. The voltage deviation objective function is defined as:
Minimizing ensures uniform voltage regulation and reduces the need for additional voltage control devices such as tap changers and capacitor banks.
4.1.3. Minimization of Power Losses
Power losses, especially resistive (I2R) losses, are a critical metric for energy efficiency in distribution systems. DERs that supply local loads reduce the current flowing through long feeders and thus reduce total energy losses.
The total real power loss in the network is given by the following:
where is the resistance of the branch between nodes i and j. Minimizing improves overall system efficiency and reduces operating costs. Unlike traditional multi-objective DER optimization studies that primarily target power loss reduction or voltage profile improvements, our framework introduces congestion mitigation as a dedicated and quantifiable optimization goal. This is accomplished through the formulation of a congestion index that explicitly captures the thermal loading of each line segment and is integrated into the overall objective function. By assigning weighted priorities to congestion alongside voltage deviation and power losses, our model enables planners to directly minimize thermal violations rather than treating them as secondary effects. Moreover, the use of this congestion-centric formulation allows the optimization to proactively steer DER deployment away from overloaded corridors and toward locations with underutilized capacity, thus facilitating more equitable and technically sound integration across the network. This approach enhances the operational relevance of the optimization process and provides utilities with a targeted mechanism to alleviate stress in vulnerable parts of the grid.
4.1.4. Multi-Objective Formulation
To simultaneously address multiple performance objectives, a weighted-sum approach is adopted. The composite objective function F is defined as:
where , , and are user-defined weighting coefficients corresponding to congestion index, voltage deviation, and power loss minimization, respectively. Each term in the objective function is normalized by a representative reference value (e.g., base case or maximum observed) to ensure dimensional consistency and comparability. This normalization step is critical because the three metrics have inherently different units congestion is dimensionless, voltage is in p.u., and losses are in kW and must be rendered unitless before aggregation.
The weighting factors , , and allow flexibility in prioritizing objectives based on operational needs or utility policies. For example, a utility facing feeder congestion may assign higher importance to by increasing , while another seeking loss minimization may prioritize . In practice, these weights can be tuned via sensitivity analysis to explore trade-offs and identify well-balanced solutions.
Normalizing the objectives ensures that no single term dominates due to scale disparity and enables fair treatment in the optimization process. This also enhances the transferability of the framework across different systems and scenarios. Future extensions may incorporate adaptive or data-driven methods—such as fuzzy logic, evolutionary learning, or Pareto-based techniques for automatic weight tuning in dynamic operating environments.
4.2. Constraints
4.2.1. Voltage and Thermal Limits
The voltage at all buses must remain within allowable operational limits. According to ANSI C84.1 standards and IEEE 1547 guidelines for DER integration, the acceptable voltage range is typically:
For this study, we use:
Additionally, thermal loading of all line segments must not exceed their rated ampacities:
4.2.2. DER Penetration Limits and Placement Feasibility
Each bus has a maximum allowable DER capacity, based on spatial constraints, transformer ratings, or regulatory caps. Let be the DER capacity at bus i. Then,
Moreover, the total DER capacity should not exceed a specified penetration level (e.g., 50% of peak load):
where is the DER penetration factor and is the total peak demand of the system.
Additional constraints ensure that DERs are only placed at candidate nodes where installation is technically feasible:
where is the set of eligible nodes.
4.3. System Modeling and Simulation Setup
The proposed framework is validated on two standard distribution systems: the IEEE 13-bus and IEEE 123-bus feeders. These systems differ significantly in topology, phase configurations, and complexity, allowing us to evaluate the scalability and robustness of the analysis. Both feeders are modeled using OpenDSS, an open-source distribution system simulation platform capable of handling unbalanced, three-phase networks with high DER penetration.
4.3.1. IEEE 13-Bus System Implementation
The IEEE 13-bus test system is implemented using OpenDSS, which provides a robust platform for simulating unbalanced distribution feeders with detailed control elements. The following modeling parameters and assumptions are applied in the simulation framework:
- Network representation: The feeder is modeled as a three-phase unbalanced distribution system, with all line segments represented using their full three-phase impedance matrices to accurately capture phase coupling and asymmetrical loading conditions.
- Load modeling: Loads are modeled as ZIP (constant impedance, current, and power) components, with time-varying load shapes that reflect typical daily and seasonal variation over a full calendar year.
- Equipment models: Transformers and voltage regulators are included as per the standard IEEE 13-bus configuration in OpenDSS, ensuring accurate voltage regulation and tap-changing behavior.
- DER modeling:
- –
- PV systems are represented using the PVSystem object, allowing for irradiance-based generation profiles and inverter behavior.
- –
- Battery energy storage systems (BESSs) are modeled using the Storage object, which supports charging/discharging logic and state-of-charge tracking.
- –
- Electric vehicles (EVs) are modeled as time-varying controllable loads at selected buses to simulate realistic charging demand.
- Current and congestion analysis: Line currents () are computed internally by OpenDSS during power flow simulation. These are then compared with predefined thermal limits specified by the NormAmps and EmergAmps parameters of each line to evaluate congestion and potential overloads.
- Simulation horizon: The simulation is run over an annual horizon using a 1 h time step (i.e., 8760 steps), allowing for full temporal resolution of both load and DER profiles.
- Base conditions: All voltage and power quantities are scaled and normalized based on the system’s base voltage of 4.16 kV to ensure consistent per-unit interpretation and compatibility with OpenDSS default parameters.
4.3.2. IEEE 123-Bus System Implementation
The IEEE 123-bus test system is also implemented in OpenDSS and reflects a large-scale, three-phase unbalanced feeder with a combination of residential and commercial loads. Its greater node count, diverse loading, and phase imbalance make it well suited for validating the scalability of the proposed framework.
- Network representation: All line segments are modeled with full-phase impedance matrices. The network includes multiple laterals and voltage regulators, simulating real-world operational complexity.
- Load modeling: Loads are time-varying ZIP loads derived from residential and commercial demand profiles. They are applied to each node using time-series load shapes and matched to the 8760 h simulation horizon.
- Equipment models: Voltage regulators, line regulators, transformers, and capacitor banks are included as specified in the original IEEE test feeder file.
- DER modeling:
- –
- PV systems are distributed across multiple nodes using the PVSystem object, incorporating hourly irradiance profiles.
- –
- BESS units are included at selected strategic buses to support voltage and congestion management.
- –
- EVs are modeled at demand centers using time-of-day charging schedules as controllable loads.
- Current and congestion analysis: Similar to the 13-bus case, OpenDSS calculates the line currents at each time step, which is compared to the defined thermal ampacity limits for overload and congestion analysis.
- Simulation horizon: Simulations are run at 1-h intervals over a 1-year period (8760 h), capturing load variability, DER intermittency, and seasonal effects.
- Base conditions: The system operates at a nominal base voltage of 4.16 kV, and all DER power injections and losses are recorded in absolute units (kW, kWh) and optionally converted to per-unit as required.
4.4. Solution Techniques
4.4.1. Overview of Optimization Challenges
The problem of optimal DER placement in distribution networks is inherently complex due to its non-convex, nonlinear, and mixed-integer nature. The presence of both continuous variables (e.g., DER size) and discrete decision variables (e.g., placement location) makes the solution space combinatorially large. Additionally, multiple objectives such as minimizing losses, alleviating congestion, and improving voltage profiles often conflict with each other, requiring trade-off analysis.
Another layer of complexity arises from the stochastic behavior of DERs (e.g., solar PV, EV charging) and loads, which introduces uncertainty in nodal power injections and network responses. Traditional deterministic methods, while computationally efficient for small systems, often fail to capture this variability and may yield suboptimal or non-robust solutions in real-world settings. Consequently, optimization techniques must be both scalable and adaptable, with the capability to handle multi-objective, constraint-rich formulations under uncertainty.
4.4.2. Deterministic Approaches (Implemented in This Work)
Exhaustive Enumeration of Candidate Locations
For initial validation and small-scale networks, an exhaustive enumeration strategy is employed. In this method, a DER of fixed capacity is sequentially placed at each candidate node, and a full power flow is executed for each configuration. For each test case, performance metrics such as real power loss , total congestion index , and voltage deviation are recorded. Nodes are ranked based on their impact on these metrics. The node(s) with the most favorable impact are selected for final placement.
Let F denote the objective function value when the DER is placed at node i:
where are objective weights defined previously. The node with the minimum F is selected:
While this method guarantees that all options are evaluated, it becomes infeasible for larger networks or for multiple DER placements due to exponential growth in solution space.
Sensitivity-Based Placement Strategy
To improve computational efficiency, a sensitivity-based method is also utilized. This approach calculates local sensitivity indices for each bus, allowing a pre-screening of candidate nodes before detailed simulation. Common indices used include the following:
- Voltage sensitivity index (VSI), which measures changes in bus voltage due to unit DER injection at that bus.
- Loss sensitivity factor (LSF), which evaluates change in total system loss due to DER injection.
- Congestion impact index (CII), which measures the reduction in line loading due to DER placement.
For instance, LSF at bus i can be approximated as:
Higher values of LSF or VSI indicate better candidate locations for DERs. This method is especially useful for narrowing down search spaces in medium- and large-scale systems.
Limitations of Deterministic Methods
Despite their simplicity and transparency, deterministic techniques have inherent limitations:
- They assume fixed or average-case load and DER output, ignoring variability.
- They are not scalable to complex systems with hundreds of buses and multiple DER types.
- They do not capture the Pareto front of multi-objective trade-offs.
- They are unable to adapt in real time to dynamic system changes.
To address these limitations, metaheuristic optimization techniques are proposed for future work.
4.4.3. Metaheuristic Optimization Techniques (Proposed for Future Work)
While this study primarily employs deterministic methods such as exhaustive enumeration and sensitivity analysis, metaheuristic algorithms are widely recognized as powerful tools for solving the DER placement problem in more complex and large-scale distribution systems. Techniques such as Genetic Algorithm (GA), Particle Swarm Optimization (PSO), and Differential Evolution (DE) have been extensively used in the literature due to their ability to handle nonlinear, non-convex, and multi-objective optimization problems without requiring gradient information.
These algorithms offer global search capabilities and can effectively explore large solution spaces to identify near-optimal configurations of DER location and sizing. In future work, these methods will be integrated into the framework to address scalability challenges and incorporate more sophisticated objective functions, including economic costs, emission reduction, and resilience under faulted conditions. Their adaptability also makes them suitable for incorporating stochastic DER behavior and dynamic system states.
4.4.4. Reinforcement Learning and Data-Driven Methods (Proposed for Future Work)
With the growing availability of real-time data from smart meters and sensors, reinforcement learning (RL) and other data-driven techniques have started to gain attention in the domain of DER coordination. Deep reinforcement learning (DRL) has been used to adaptively control DERs based on grid states.
In future research, such approaches can be extended to DER siting decisions by framing the problem as a Markov Decision Process (MDP), where the agent learns optimal placements based on system feedback. However, these methods require large-scale training datasets, computational infrastructure, and robust validation before deployment.
4.4.5. Comparison of Methods and Applicability
Table 2 provides a comparative evaluation of several optimization techniques commonly employed for Distributed Energy Resource (DER) placement. The comparison is based on four key performance criteria: scalability, accuracy, robustness, and effectiveness under uncertainty. Exhaustive search, while highly accurate, is limited by its low scalability and poor performance under uncertain conditions due to its brute-force nature. Sensitivity-based methods offer moderate performance across all metrics but lack adaptability under dynamic system conditions. Evolutionary techniques such as Genetic Algorithm (GA) and Particle Swarm Optimization (PSO) demonstrate high scalability and robustness, with slightly varying accuracy. The Hybrid GA-PSO method exhibits a balanced profile with consistently high ratings across all metrics, making it suitable for complex systems. Multi-objective evolutionary algorithms (MOEAs), such as NSGA-II, maintain high performance but may require trade-offs between competing objectives. Deep Reinforcement Learning (DRL/RL) emerges as the most scalable and adaptive technique, especially under uncertainty, albeit with higher computational demands and training complexity. This comparative assessment highlights the importance of selecting optimization strategies that align with specific system needs and operational constraints.
Table 2.
Comparison of optimization techniques for DER placement.
5. Case Studies, Results, and Discussion
This section presents a detailed technical evaluation of Distributed Energy Resource (DER) integration into distribution networks using both deterministic and probabilistic analyses. Two benchmark systems namely IEEE 13-Bus and IEEE 123-Bus are selected to represent compact and large-scale radial feeders, respectively. Each system is examined in a sequential framework: starting with baseline performance evaluation (without DERs), followed by hosting capacity determination using incremental PV penetration, and further extended to probabilistic Monte Carlo simulations considering uncertainty in load and generation. The simulations explore the technical impacts of DERs on voltage profiles, system losses, congestion, and node-level hosting capacity, with results synthesized through comparative discussion.
To carry out the simulations, a combination of Python v3.13.0 and OpenDSS v10.1.0.1 is employed. Python scripting is performed in Visual Studio Code (VS Code) v1.98.2 using a custom simulation framework built around libraries such as NumPy v2.1.2, Pandas v2.2.3, and Matplotlib v3.9.2 for data handling, statistical analysis, and visualization. For power flow and time-series simulations, the OpenDSS engine is utilized through the high-performance interface provided by the py_dss_interface library v2.0.4. This interface enables seamless programmatic interaction between Python and OpenDSS via COM, allowing script-based control of load shapes, DER penetration levels, and the extraction of voltages, losses, and energy metrics.
In addition, OpenDSS-G v6.1.0, a graphical interface extension of OpenDSS is used for network visualization, verification of circuit configurations, and inspection of topology-related parameters such as feeder layout, switch status, and device placements. The integration of Python with OpenDSS through py_dss_interface ensures scalable, automated simulations with the ability to iterate over thousands of Monte Carlo scenarios and node-level DER deployment strategies. The resulting dataset forms the basis for hosting capacity assessment and performance optimization studies presented in this section. The detailed line, load, capacitor, and transformer configurations used in the IEEE 13-bus system simulations are provided in Appendix A, including all relevant electrical parameters and connectivity information (Table A1, Table A2, Table A3 and Table A4).
5.1. Case Study 1: IEEE 13-Bus System
5.1.1. Baseline Analysis (Without DERs)
The IEEE 13-bus test feeder is a widely used benchmark in distribution system studies due to its complex configuration, unbalanced loading, and realistic operational conditions. Unlike conventional symmetrical feeders, this system is highly asymmetrical and includes multiple features such as regulators, shunt capacitors, overhead and underground lines, single- and three-phase nodes, and a mix of load types. The system is particularly well suited for evaluating the technical impacts of Distributed Energy Resources (DERs) due to its sensitivity to phase imbalance, voltage regulation, and localized congestion.
As illustrated in Figure 3, the circuit consists of 13 buses, interconnected with multiple laterals and switches. The main feeder extends approximately 1.57 miles and operates at a base voltage of 4.16 kV on the primary side and 0.48 kV on the secondary side. The system includes the following:
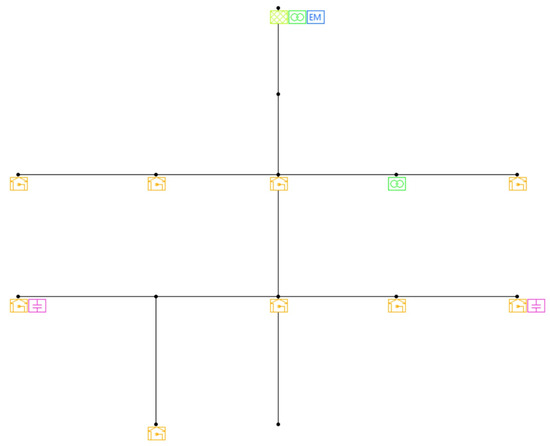
Figure 3.
IEEE 13-bus circuit topology.
- Fourteen single-phase and one three-phase load connections;
- One voltage source (slack bus) at Bus 650;
- One transformer with center-tap grounding;
- One shunt capacitor bank;
- One switch and an energy meter.
The loads are unbalanced, and their ratings range from 17 kW/10 kVAr up to 1155 kW/660 kVAr. The peak three-phase loading conditions on each phase are as follows:
- Phase A: 1186.79 + j576.24 kVA;
- Phase B: 1028.24 + j507.14 kVA;
- Phase C: 1305.56 + j726.01 kVA.
To ensure realism in performance evaluation, the IEEE 13-bus system is simulated with a full-year load profile as shown in Algorithm 4. The hourly demand profile used follows a normalized load shape as shown in Figure 4, representing residential and commercial aggregated demand. This profile reflects daily and seasonal variations, with higher demand during summer months and midday hours. Load shape data were modeled in OpenDSS using a `loadshape’ object with 8760 points (one per hour), enabling time-series simulations for each hour of the year.
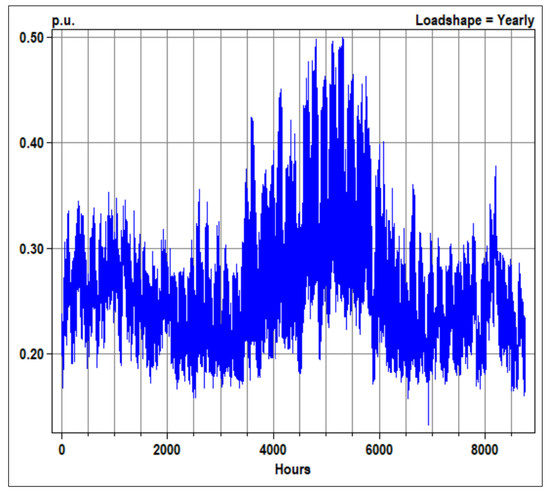
Figure 4.
Yearly load shape (p.u. load vs. hour).
The baseline energy consumption of the system over the simulated year is shown in Figure 5. Active and reactive energy were monitored at the substation node (Bus 650) using the `energymeter’ object in OpenDSS. Active energy (kWh) fluctuates between 1000–1750 kWh on a daily basis, with clear seasonal trends. Reactive energy (kVArh) follows a similar pattern, albeit with a lower magnitude. These values provide insight into the magnitude and variability of real and reactive power requirements at the feeder head, serving as a baseline for assessing the impact of DER integration.
| Algorithm 4 Baseline analysis (without DERs) |
|
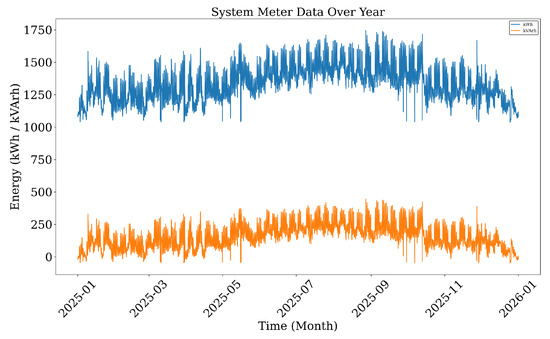
Figure 5.
System meter data over the year (kWh and kVArh).
Voltage levels across the network were analyzed hourly over the course of the year. Figure 6 presents the maximum and minimum voltage recorded at each hour. The feeder shows compliance with IEEE standards, with voltage remaining between 0.95 p.u. and 1.05 p.u. throughout the year. However, several time intervals approach the lower limit, especially during peak load conditions, which indicates sensitivity to local load growth and underscores the need for voltage support, one of the key roles DERs can play.
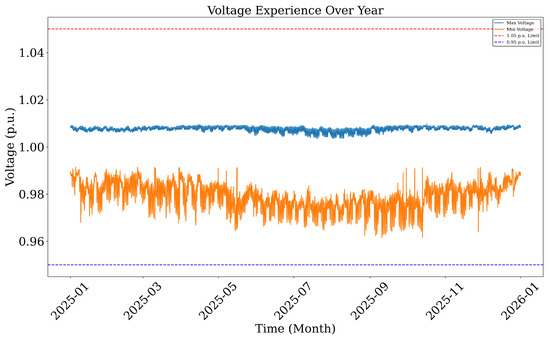
Figure 6.
Voltage experience over the year (maximum and minimum).
Figure 7 displays the real and reactive power losses over the simulation horizon. Active losses range between 10 kWh and 22 kWh per hour, while reactive losses vary between 25 and 70 kVArh. The peak losses occur during high-demand summer periods and follow the trend of the load profile. These losses represent the baseline operational inefficiency of the feeder and form a key metric for evaluating the impact of DERs in subsequent analysis.
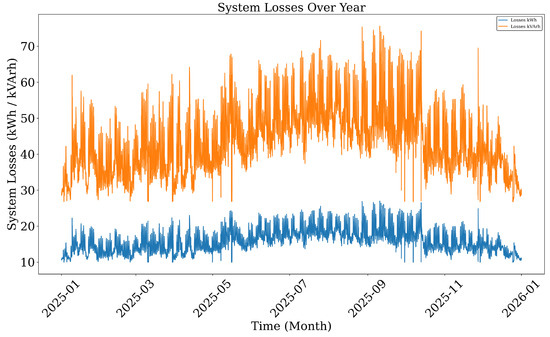
Figure 7.
System losses over the year (kWh and kVArh).
From the baseline results, the following observations can be made:
- Voltage levels remain within regulatory bounds but experience notable dips during peak demand intervals.
- Real and reactive losses exhibit seasonal variation, peaking during high-load months.
- The load profile is dynamic and reflects the need for time-aware planning of DERs.
- No congestion or thermal violations are observed under current loading, but margins are narrow.
These findings provide a critical reference for evaluating how the addition of DERs, especially PV, BESS, and EVs, affects power quality, losses, and system hosting capacity.
5.1.2. Nodal Hosting Capacity Determination Results
To evaluate the localized photovoltaic (PV) hosting limits for the IEEE 13-bus system, a detailed nodal hosting capacity analysis was performed using a stepwise PV injection methodology. A total of 15 individual nodes were analyzed: 611, 632a, 632b, 632c, 634a, 634b, 634c, 645, 646, 652, 671, 675a, 675b, 675c, and 692. For each node, PV generation was incrementally injected—typically in 5 kW steps—until either thermal overloads or voltage exceptions were triggered, indicating the local hosting limit had been reached.
Each node was simulated independently while other nodes remained at their base configuration. The results were evaluated across a full annual (8760 h) simulation using OpenDSS. The following metrics were monitored:
- Number of thermal overloads;
- Voltage exceptions (under-voltage and over-voltage);
- Yearly peak power demand (kW and kVA);
- Annual system losses (kWh and kVArh).
For each node, a detailed plot, as shown in Figure 8, for two nodes as an example, namely 611 and 632a, was generated with the following subplots:
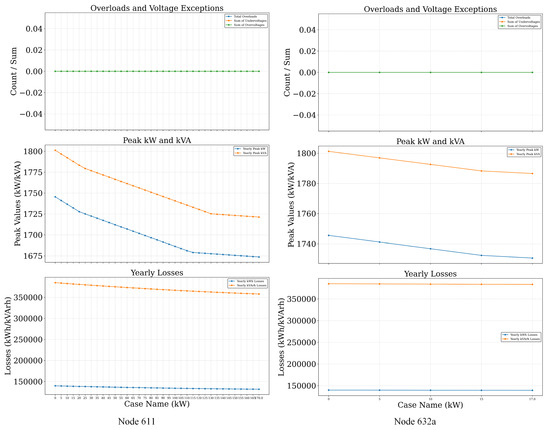
Figure 8.
Nodal analysis of IEEE-13 bus system.
- Overloads and Voltage Exceptions: This subplot quantifies the system security margin as PV penetration increases. Most nodes in the IEEE 13-bus system maintained zero overloads and voltage violations across all tested injection levels, suggesting robust voltage and thermal capacity margins.
- Yearly Peak Power Demand (kW and kVA): As PV injection increased, a decreasing trend in both real and apparent power demand was observed, highlighting the effectiveness of PV in peak shaving and local demand support.
- Annual Energy Losses (kWh and kVArh): Both active and reactive losses decreased consistently with increasing PV, indicating improved efficiency due to reduced feeder loading.
To summarize the node-specific hosting limits, a comparative bar chart titled Figure 9 was generated. This figure illustrates the maximum PV injection (in kW) that each node can host without triggering any operational violations. The results reveal spatial variability in hosting capacity:
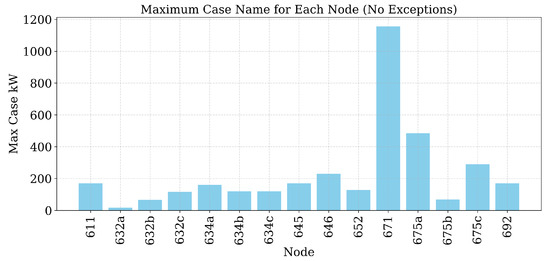
Figure 9.
Maximum nodal hosting capacity (kW) across IEEE 13-bus feeder.
- Highest Hosting Node: Node 671 demonstrated the highest capacity, with approximately 1150 kW of PV allowed without operational violations. This suggests it is likely a feeder head or substation node with strong voltage support.
- Moderate Hosting Nodes: Nodes such as 675a, 675c, and 646 supported PV injections between 200 kW and 500 kW, indicating moderate hosting potential.
- Low Hosting Nodes: Nodes like 632a, 632b, and 675b showed lower hosting capacities, generally under 100 kW, likely due to weaker voltage support and lower local demand.
These nodal-level findings are critical for Distributed Energy Resource (DER) planning. Rather than a uniform penetration strategy, the utility can adopt a location-specific PV deployment strategy to optimize system utilization while minimizing the risk of violations. This methodology can be scaled to larger systems for nodal hosting assessments.
5.1.3. Monte Carlo Simulation Results Using ONLY PV AS DERs
To evaluate the influence of only photovoltaic (PV) penetration on the IEEE 13-bus system, a Monte Carlo simulation was conducted across 500 iterations for each PV penetration level, varying from 0% to 75% in increments of 5%. Two sets of results are presented statistical distribution-based box plots and annual time-series trends to illustrate the impacts across six key performance indicators.
Figure 10a demonstrates that across all simulated PV penetration levels—from 0% to 75%—no thermal overloads were observed. This confirms that the IEEE 13-bus system maintains adequate thermal headroom on lines and transformers even under high levels of distributed generation, indicating robustness in thermal infrastructure capacity.
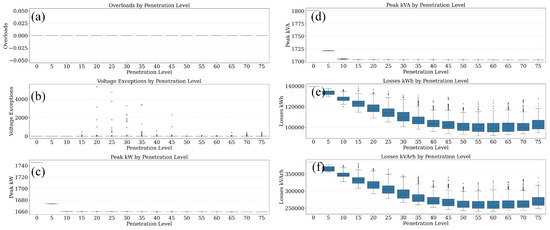
Figure 10.
Monte Carlo simulation results for the IEEE 13-bus system illustrating the impact of increasing DER penetration with PV-only on the following: (a) overloads, (b) voltage exceptions, (c) peak kW, (d) peak kVA, (e) energy losses (kWh), and (f) reactive energy losses (kVArh).
In contrast, voltage-related issues begin to surface as shown in Figure 10b, where voltage exceptions emerge progressively beyond 15% PV penetration. The presence of multiple outliers and increasing exception counts at higher penetration levels points to localized voltage rise effects, especially during midday hours with high solar output. These deviations, although largely within permissible bounds, signal potential voltage regulation challenges under future high-PV scenarios.
Figure 10c captures the trend in peak real power (kW) at the substation, which exhibits a gradual decline with rising PV penetration. This behavior reflects the effective offsetting of feeder demand by localized solar generation, particularly during peak demand periods. Similarly, Figure 10d illustrates a corresponding decrease in peak apparent power (kVA), indicating a reduced burden on the upstream network infrastructure due to improved local supply conditions.
Figure 10e,f depict system-wide energy losses. Real power losses (kWh) in Figure 10e show a substantial reduction as PV penetration increases, primarily due to lower current flows across feeder lines, which minimize resistive () losses. A similar trend is observed in reactive energy losses (kVArh), as shown in Figure 10f, with notable improvement in power factor performance and reactive efficiency. These collective insights underscore the dual benefit of PV integration in lowering both peak loading and system losses while highlighting the importance of voltage management at elevated penetration levels.
To further explore temporal dynamics and system behavior under increasing photovoltaic (PV) penetration, Figure 11 presents Monte Carlo-based time-series simulations for the IEEE 13-bus system, including both full-year data (left column) and zoomed-in representative week snapshots (hours 4100–4172) in the right column.
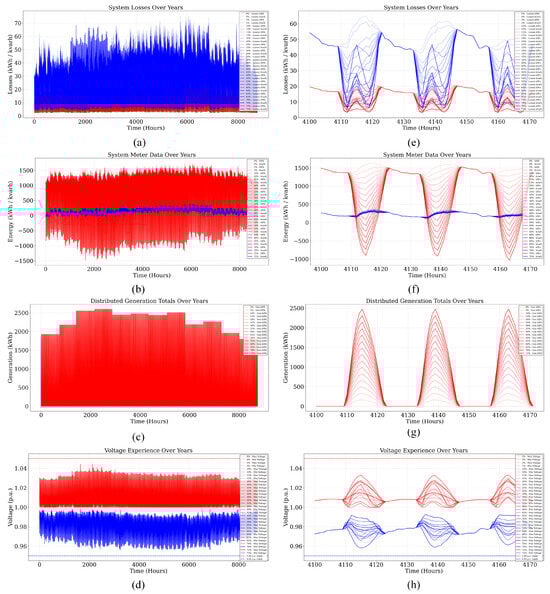
Figure 11.
Monte Carlo simulation results for the IEEE 13-bus system with increasing DER penetration with PV only showing yearly trends and zoomed views for the following: (a,e) system losses, (b,f) meter data, (c,g) distributed generation, and (d,h) voltage profiles across varying penetration levels.
Figure 11a,e present the yearly and zoomed views of system losses, respectively. As PV penetration increases, total active (kWh) and reactive (kVArh) losses generally decrease, particularly during daylight hours, due to local generation, reducing line current flows. However, during midday periods with high PV output, fluctuations in losses become more pronounced. This diurnal behavior intensifies with penetration, indicating the occurrence of reverse power flow and stressing the need for protection schemes capable of detecting directional flow and managing bi-directional current injections. The zoomed-in plot clearly illustrates sharp variations in loss magnitudes, underscoring operational complexity during high solar availability.
Figure 11b,f show the substation energy measurements. Active (red) and reactive (blue) energy trends shift notably with increasing PV levels. During low penetration, the substation acts primarily as a load sink; however, at higher PV integration, especially above 40–50%, negative active energy flows become frequent during midday, revealing net energy export back to the grid. The zoomed-in view in Figure 11f confirms this phenomenon, with evident sign reversals in substation metering. These reversals point to high-penetration stress conditions and raise potential concerns regarding transformer tap-changer wear, reverse protection logic, and coordination of feeder-level control mechanisms.
The evolution of PV generation itself is detailed in Figure 11c,g. As expected, the output shows a bell-shaped diurnal profile with strong seasonal modulation, peaking during the summer months. As penetration increases, midday generation increasingly exceeds local consumption, leading to significant energy export. The zoomed snapshot highlights the overlap of generation peaks with midday periods and increasing amplitude with penetration. These observations reinforce the importance of demand flexibility, smart inverter ramping, or energy storage strategies to curtail or absorb surplus power and maintain local balance.
Lastly, Figure 11d,h examine voltage variations across the feeder. At lower PV penetration, voltages remain relatively stable and well within ANSI limits (0.95–1.05 p.u.). However, as more PV is added, the voltage envelope begins to widen, particularly during midday hours. Overvoltage incidents, while not yet breaching regulatory limits, become more frequent at higher DER levels and are most prominent at buses far from substation regulation or with high PV-to-load ratios. The time-series profiles in Figure 11h clearly reveal midday clustering of voltage rise, pointing to a growing need for Volt/VAR optimization, voltage ride-through logic, and local reactive power injection to maintain voltage quality.
Collectively, these results suggest that PV penetration in the range of 20–30% can be accommodated with net benefits, including reduced feeder losses and peak demand suppression. However, once penetration exceeds 35–40%, adverse effects such as reverse flow, voltage variability, and reactive power imbalances become significant. Therefore, advanced inverter functionalities, dynamic control algorithms, and coordinated DER dispatch are critical for maintaining power quality and avoiding hosting capacity saturation in distribution systems.
5.1.4. Monte Carlo Simulation Results Using ALL DERs
To evaluate the overall grid performance under high penetration of Distributed Energy Resources (DERs), a comprehensive Monte Carlo simulation was conducted for the IEEE 13-bus distribution system. The simulation simultaneously integrates photovoltaic (PV) generation, electric vehicles (EVs), and battery energy storage systems (BESSs) at increasing penetration levels ranging from 0% to 75% in 5% increments. For each penetration level, 500 Monte Carlo iterations were executed to capture the variability in DER placement and sizing across different buses.
Figure 12 presents a comprehensive boxplot-based statistical analysis of six key system metrics under increasing DER penetration levels, considering the combined effects of photovoltaic (PV), electric vehicles (EVs), and battery energy storage systems (BESSs). The analysis spans 0% to 75% total DER integration and captures the variability arising from multiple Monte Carlo simulation runs.
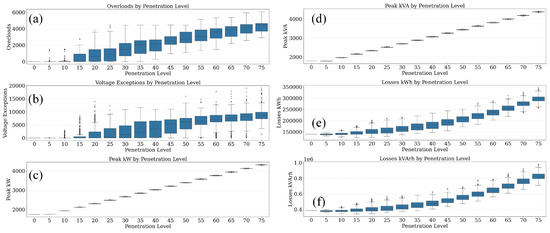
Figure 12.
Monte Carlo simulation results for the IEEE 13-bus system illustrating the impact of increasing DER penetration including PV, EV, and BESS on (a) overloads, (b) voltage exceptions, (c) peak kW, (d) peak kVA, (e) energy losses (kWh), and (f) reactive energy losses (kVArh).
In Figure 12a, the number of overload events increases substantially with penetration level. Unlike the PV-only scenario, where overloads were negligible, the inclusion of EVs introduces significant peak load stress during evening hours. As penetration surpasses 30%, the median number of overloads rises sharply, and the upper whiskers extend beyond 5000 events, signaling thermal stress on feeders and transformers in a considerable subset of simulations. This trend highlights the need for EV charging coordination and infrastructure reinforcement.
Voltage violations shown in Figure 12b also grow in both frequency and magnitude with higher penetration. The transition beyond the 20–25% DER level marks a notable shift, with box heights and outlier density increasing steadily. These voltage exceptions are attributed to the dual stress of PV-induced midday overvoltage and EV-induced evening undervoltage. Without reactive power support or Volt/VAR control, maintaining voltage within ANSI C84.1 limits becomes challenging.
Figure 12c,d display the peak real power (kW) and apparent power (kVA) at the substation. Both metrics show a pronounced and nearly linear increase with DER penetration. The primary driver of this trend is EV charging, which introduces large real power demands that peak in the evening and are only partially mitigated by BESS discharge. The rise in apparent power is slightly steeper, suggesting additional reactive demand from inverters and dynamic loads.
Energy losses are also significantly impacted, as illustrated in Figure 12e,f. Figure 12e reveals that active power losses (kWh) escalate with each increment in penetration, with median losses increasing from approximately 140,000 kWh at 0% DER to over 300,000 kWh at 75%. These losses are exacerbated by long feeder paths, frequent bidirectional flows, and uncoordinated dispatch of DERs. The pattern is mirrored in Figure 12f, where reactive energy losses (kVArh) nearly double from low to high penetration levels, crossing 1 MVARh in the upper whiskers. The uncontrolled inverter operation and the absence of localized reactive power compensation result in excess VAR circulation and voltage imbalance.
Collectively, these results emphasize that integrating multiple DER types introduces complex and nonlinear stress on distribution systems. Hosting capacity is no longer constrained solely by thermal or steady-state voltage limits but becomes a multidimensional challenge involving temporal dynamics, reactive power, and system coordination. Strategic planning, including smart inverter settings, EV charging management, and BESS control, is essential to ensure scalable and reliable grid operation under high DER penetration.
To further investigate the temporal evolution of system dynamics under comprehensive DER deployment, Figure 13 provides both annual and zoomed-in weekly time-series views for four essential system performance indicators across a range of DER penetration levels. The DER mix includes photovoltaic (PV) systems, electric vehicles (EVs), and battery energy storage systems (BESSs), whose interactions significantly influence the distribution network’s spatiotemporal behavior.
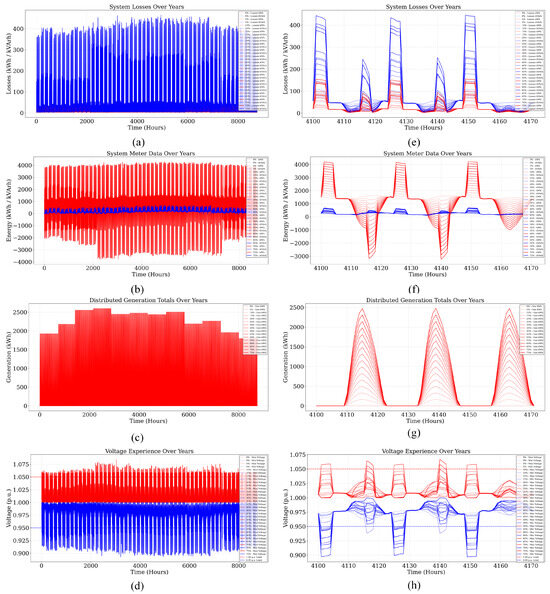
Figure 13.
Monte Carlo simulation results for the IEEE 13-bus system showing the impact of increasing DER penetration including PV, EV, and BESS yearly trends and zoomed views for: (a,e) system losses, (b,f) meter data, (c,g) distributed generation, and (d,h) voltage profiles across varying penetration levels.
Figure 13a,e illustrate the trends in real and reactive system losses over time. The full-year trace in Figure 13a reveals a recurring diurnal pattern in both kWh and kVArh losses, tightly coupled with load cycles and DER dispatch patterns. In the zoomed-in snapshot (Figure 13e), these losses exhibit pronounced peaks during midday and evening hours under higher DER penetration. Such spikes are largely attributed to power injection from PV during solar peaks and reverse flows triggered by BESS discharges or EV-induced congestion, amplifying losses due to increased bidirectional current magnitudes.
In Figure 13b,f, substation meter data capture the net energy exchange with the upstream grid. Active and reactive energy trends (red and blue lines, respectively) shift substantially with increased DER adoption. While BESS and PV collectively reduce net imports during daylight hours, Figure 13f reveals that high-frequency oscillations and power reversals become more prevalent under higher DER levels. During periods of simultaneous high PV output and low load, reverse power flow to the substation occurs frequently, raising concerns for transformer tap wear and protection coordination.
The distribution of PV generation across the feeder is represented in Figure 13c,g. The aggregate generation curve shows a consistent bell-shaped pattern, aligning with solar irradiance availability. At higher penetration levels, the amplitude of midday peaks increases substantially, as shown in the zoomed-in view, often exceeding local consumption and initiating export. This underscores the requirement for DER coordination, load shaping, or flexible storage to prevent voltage rise and mitigate grid stress.
Lastly, Figure 13d,h depict voltage magnitudes throughout the feeder. Over the annual cycle, the system largely maintains voltage within the IEEE acceptable band (0.95–1.05 p.u.), but the spread between minimum and maximum voltages widens considerably with higher DER levels. This is more evident in the detailed weekly view (Figure 13h), where overvoltage incidents align with midday PV peaks and undervoltages coincide with evening EV clusters. The increasing voltage disparity across nodes, particularly those remote from voltage regulators or densely populated with DERs, reinforces the urgent need for Volt/VAR optimization and smart inverter functionalities to uphold voltage stability under high-penetration scenarios.
The simulation results indicate that the IEEE 13-bus system can reliably accommodate DER penetration levels up to approximately 30–35% when integrating PV, EV, and BESS, with limited operational disruptions. However, as the penetration exceeds 40%, the system begins to exhibit noticeable challenges including increased voltage excursions, higher real and reactive power losses, and bidirectional power flow complications. These effects are particularly intensified by uncoordinated EV charging and asynchronous BESS operations that compound stress during peak demand and solar generation periods. Consequently, these findings emphasize the critical need for strategic DER placement, advanced Volt/VAR control, coordinated dispatch of storage systems, and intelligent inverter functionalities to preserve system reliability and power quality in high-DER-penetration scenarios.
5.2. Case Study 2: IEEE 123-Bus System
5.2.1. Baseline Analysis (Without DERs)
The IEEE 123-bus feeder is a widely recognized benchmark for modeling and analyzing real-world distribution systems. It is designed to capture the complexity of modern feeders by incorporating unbalanced loading, single- and three-phase nodes, overhead and underground line configurations, multiple voltage levels, and numerous control elements including voltage regulators, shunt capacitors, and switches. This makes the feeder exceptionally suited for testing the technical implications of Distributed Energy Resource (DER) integration.
The system comprises 123 buses as shown in Figure 14, interlinked through lateral branches and regulated segments with regulator control enabled. The feeder is approximately 10 miles in length, operating at a nominal base voltage of 4.16 kV on the primary side and 0.48 kV on the secondary side. There are 91 total loads distributed across the network—89 are single-phase, and 2 are three-phase—making the feeder highly unbalanced.
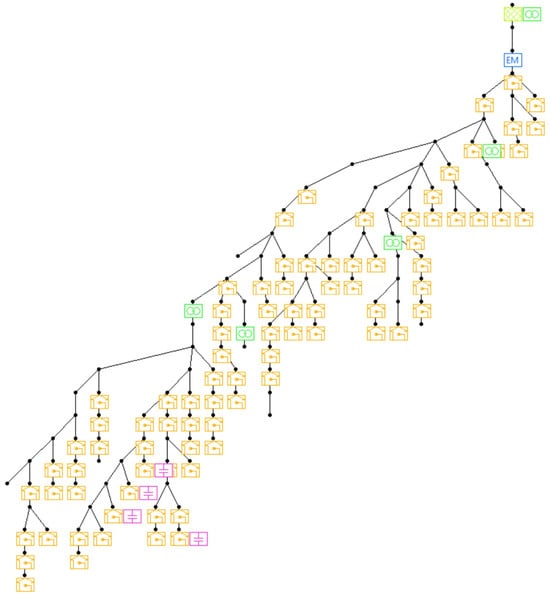
Figure 14.
IEEE 123-bus circuit topology.
The maximum apparent power in each phase is summarized below:
- Phase A: 892.338 + j557.983 kVA;
- Phase B: 441.191 + j320.871 kVA;
- Phase C: 653.665 + j375.592 kVA.
For an accurate representation of feeder behavior under realistic operating conditions, a full-year hourly load shape is used. The normalized load shape varies from 0.5803 to 1.0 p.u., ensuring that both low-load and peak-load scenarios are captured throughout the simulation period. The yearly profile includes 8760 hourly points and enables detailed time-series analysis.
Figure 15 presents the yearly meter data recorded at the substation node. The active power consumption (kWh) fluctuates between approximately 800 to 1750 kWh per hour, with visible seasonal patterns. The reactive power (kVArh) shows similar trends but with comparatively smaller magnitudes. These trends offer valuable insights into seasonal load behavior and feeder stress levels.
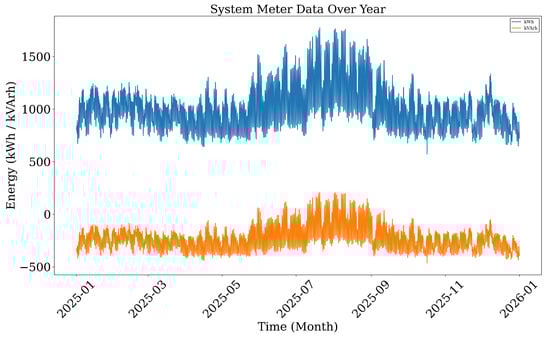
Figure 15.
Annual system energy consumption (active and reactive) at the substation for the IEEE 123-bus system.
Voltage magnitudes across the feeder are assessed hourly over the year to examine compliance with IEEE voltage standards. Figure 16 illustrates the minimum and maximum voltage envelopes across all buses. Voltages remain within the 0.95 to 1.05 p.u. range throughout the year, although the system operates closer to the lower limit during peak demand conditions. This sensitivity to localized loading patterns highlights the importance of voltage support mechanisms, especially in future scenarios involving high DER penetrations.
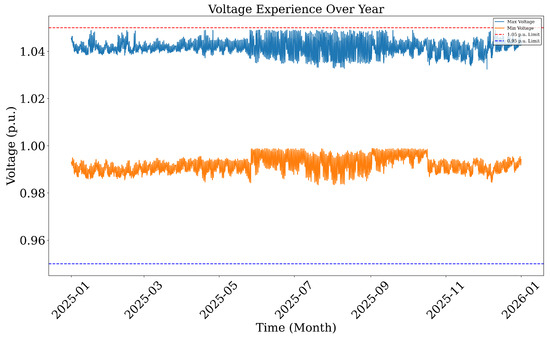
Figure 16.
Yearly voltage profile showing minimum and maximum voltages across all nodes in the IEEE 123-bus system.
Figure 17 provides the active (kWh) and reactive (kVArh) energy losses throughout the year. Active losses generally range between 10 and 30 kWh per hour, while reactive losses fluctuate between 20 and 50 kVArh per hour. These losses exhibit strong seasonal variability, peaking during summer months when demand is at its highest. This baseline evaluation of system inefficiencies serves as a reference for assessing the potential benefits of DER integration in subsequent analysis.
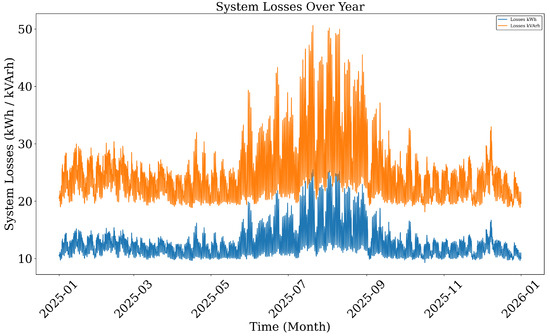
Figure 17.
Annual real and reactive energy losses across the IEEE 123-bus feeder without DER integration.
From the baseline results of the IEEE 123-bus feeder, the following observations can be made:
- Voltage levels remain within IEEE regulatory limits, though they operate close to the lower bound during high-demand intervals, which could pose future voltage compliance issues under DER stress conditions.
- Energy consumption data shows well-defined seasonal peaks, aligning with expected real-world behavior in summer due to higher cooling loads.
- System losses exhibit clear trends, increasing during peak demand seasons, especially reactive losses, indicating a need for voltage and reactive power support in high-load conditions.
5.2.2. Nodal Hosting Capacity Determination Results
To assess the spatial variability of photovoltaic (PV) hosting capacity across the IEEE 123-bus distribution system, a comprehensive nodal analysis was conducted using the custom-built NodalCapacity_Analyzer implemented in Python and OpenDSS. This analysis systematically incremented PV generation at each node, independently of others, to determine the maximum allowable PV penetration per node before any voltage or thermal violations were encountered. The base circuit model used in this study is IEEE_123_Bus, which represents a complex, asymmetrical, and unbalanced feeder, a highly representative topology for real-world urban and semi-urban power systems.
The IEEE 123-bus test feeder comprises a total system load capacity of approximately 3490.0 kW. The simulation spanned a full calendar year with hourly resolution (8760 time points), reflecting realistic demand variations and daily load cycles. Each node was tested individually by incrementally injecting PV power in steps—typically from 0 kW up to a threshold at which the system first exhibited one of the following:
- Overloads on lines or transformers (thermal violations);
- Voltage violations, i.e., voltage dropping below 0.95 p.u. or exceeding 1.05 p.u.
The analysis was conducted for a representative subset of 96 nodes, covering all three phases and capturing a wide range of topological positions—from near-substation nodes to remote lateral endpoints. Each simulation recorded the following:
- The number of overloads (if any) triggered during the year;
- The number of overvoltage and undervoltage instances;
- The peak real (kW) and apparent (kVA) demand;
- Total annual energy losses (kWh and kVArh).
Figure 18 illustrates detailed results for two sample nodes: s6c and s65c. Each node result consists of three subplots:
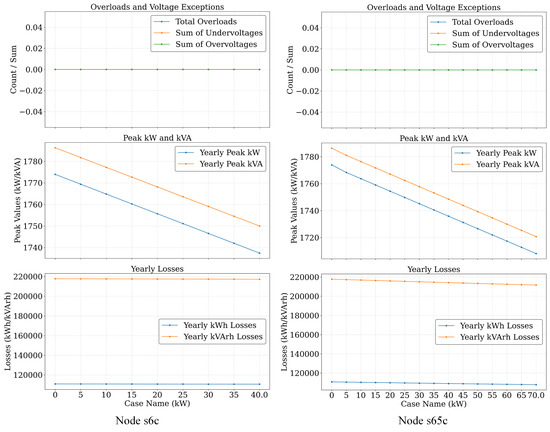
Figure 18.
Detailed nodal hosting capacity analysis for two representative nodes in the IEEE 123-bus system: s6c (left) and s65c (right). Each node shows zero exceptions and exhibits improved system metrics with increasing PV capacity.
- The top subplot shows that both nodes experienced zero overloads and voltage exceptions across all simulated PV capacities, confirming stable operation.
- The middle subplot demonstrates that peak demand (both kW and kVA) declined steadily with increasing PV penetration. For instance, at node s65c, peak real demand reduced from over 1760 kW to below 1700 kW at the highest tested PV capacity, indicating effective peak shaving and feeder stress relief.
- The bottom subplot reveals that annual energy losses (both real and reactive) decrease consistently as PV penetration rises, affirming that localized generation offsets load-driven power flows and reduces I2R losses.
To consolidate the nodal results, a system-wide bar chart Figure 19 was generated that displays the maximum PV injection (in kW) for each of the 96 evaluated nodes without triggering any violations. This chart effectively visualizes the relative hosting strength of each location.
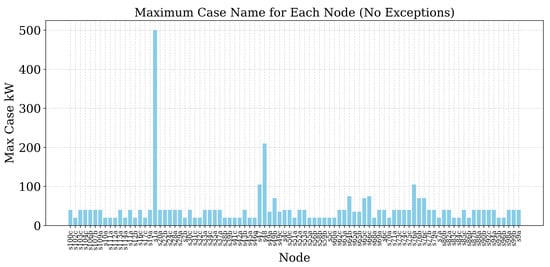
Figure 19.
Maximum hosting capacity (in kW) per node for the IEEE 123-bus system with no overloads or voltage violations. Nodes exhibit significant variability due to differences in electrical proximity, impedance, load size, and phase configuration.
The maximum nodal hosting capacities ranged from as low as 20 kW to as high as 500 kW, underscoring the critical importance of location in DER planning. The most notable findings include the following:
- High Hosting Nodes: Nodes such as s47 and s48 exhibited maximum capacities of 105 kW and 210 kW, respectively. The highest hosting node, s64b, reached 500 kW, likely due to a strong local load base, low impedance path, and favorable phase configuration.
- Moderate Hosting Nodes: Nodes like s65c, s66c, and s76a accommodated PV injections between 70 and 105 kW. These nodes were neither at the far edges of the network nor too close to the substation, offering balanced conditions.
- Low Hosting Nodes: Several remote single-phase nodes such as s31c, s7a, and s95b could only host 20–35 kW before experiencing operational constraints. These are typically located at high-impedance lateral ends with limited support infrastructure.
The significant variability in hosting capacity across nodes in the IEEE 123-bus system confirms that uniform DER policies are inadequate. Instead, location-aware hosting capacity maps must guide future DER siting decisions. These insights can carry out the following:
- Help utilities prioritize grid upgrades (e.g., voltage regulators, reconductoring) at weak nodes;
- Enable DER developers to optimize interconnection strategies and avoid costly delays;
- Support dynamic hosting capacity calculations in distribution management systems (DMSs).
This nodal capacity study reveals the highly heterogeneous nature of PV hosting potential in real-world feeders. The analysis underscores the need for data-driven and location-specific DER integration strategies, especially for large-scale deployments in complex, unbalanced networks like the IEEE 123-bus feeder.
5.2.3. Monte Carlo Simulation Results Using ONLY PV AS DERs
To thoroughly assess system behavior under variable distributed generation conditions, we performed Monte Carlo simulations on the IEEE 123-bus system, considering only PV-based DERs. Penetration levels ranged from 0% to 75%, incremented in 5% steps, with 500 iterations per level, capturing the uncertainty in spatial PV distribution, daily irradiance variability, and network response.
To assess system-level performance under increasing solar photovoltaic (PV) integration, Figure 20 provides a Monte Carlo-based statistical summary of the IEEE 123-bus system’s operational behavior across penetration levels ranging from 0% to 75%. The six subplots capture key reliability and efficiency indicators, offering insight into emerging constraints and potential optimization windows.
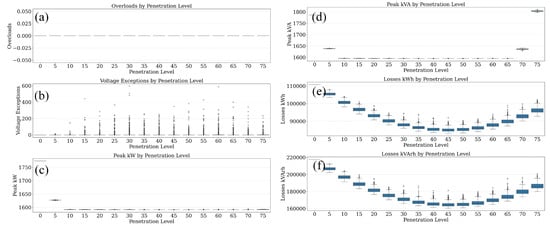
Figure 20.
Monte Carlo simulation results for the IEEE 123-bus system illustrating the impact of increasing DER penetration with PV only on: (a) overloads, (b) voltage exceptions, (c) peak kW, (d) peak kVA, (e) energy losses (kWh), and (f) reactive energy losses (kVArh).
Figure 20a confirms the absence of thermal overloads across all simulated cases and penetration levels. This indicates that the 123-bus system possesses adequate conductor and transformer capacity to accommodate distributed PV generation without violating thermal design constraints, even under high-penetration scenarios. This is reflective of the system’s relatively long feeder lengths and radial layout, which disperses the injected PV power without concentrating excessive current in individual branches.
Voltage exceptions, depicted in Figure 20b, begin to increase in frequency starting around 25–30% PV penetration, with more frequent and dispersed violations observed at higher levels. These exceptions primarily manifest as overvoltage conditions during midday solar peaks, especially at buses located far from the substation or at terminals with high PV-to-load ratios. While most cases remain within ANSI limits, the growing variance and number of outliers suggest heightened sensitivity of voltage profiles to uncoordinated PV injection and minimal reactive compensation, particularly in low-load periods.
Figure 20c,d show that both peak real power (kW) and peak apparent power (kVA) at the substation initially decline with increased PV penetration. This trend reflects the successful peak shaving effect of daytime generation, which reduces the burden on upstream infrastructure. However, at penetration levels beyond 65–70%, a sudden rise is observed in both kW and kVA, likely due to reverse power flows and voltage control issues causing elevated reactive power circulation. This nonlinearity implies a critical transition zone where further PV addition may paradoxically increase substation loading metrics due to poor coordination and voltage excursions.
The trends in system losses, presented in Figure 20e,f, follow a U-shaped profile. Both active energy losses (kWh) and reactive losses (kVArh) decrease up to around 35–40% penetration, aligning with reduced feeder loading and improved local generation-to-load matching. However, beyond this range, losses begin to rise again. This is attributed to inefficient reverse flows, mismatches between generation and consumption zones, and voltage-induced reactive currents that circulate through the network. These observations emphasize the presence of an optimal PV hosting threshold—typically between 30% and 45%—where system losses are minimized and performance is most favorable.
Collectively, these results highlight the robustness of the IEEE 123-bus system in accommodating moderate PV penetration without thermal violations. Nevertheless, they also reveal the emergence of voltage regulation and power quality challenges beyond certain thresholds, underscoring the need for intelligent inverter support, Volt/VAR optimization, and proactive DER coordination policies for ensuring stable high-penetration PV integration.
To further explore system dynamics and stress periods, time-series plots of key performance indicators were analyzed over the entire simulation year and for a representative high-stress week (hours 4100–4172).
Figure 21 illustrates the temporal dynamics of key operational parameters across varying PV penetration levels in the IEEE 123-bus system using both annual and zoomed-in weekly views. In Figure 21a,e, real power losses exhibit strong periodicity aligned with the solar irradiance profile, showing clear reductions during daylight hours—especially at moderate penetration levels. However, as penetration rises beyond mid-range levels, loss variability increases significantly. This behavior is attributed to reverse power flows and the spatial mismatch between generation sources and local demand, which introduce complex current paths and potential backfeeding.
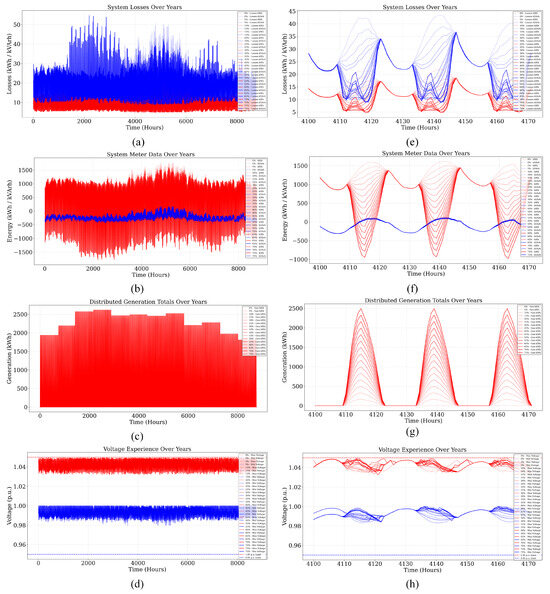
Figure 21.
Monte Carlo simulation results for the IEEE 123-bus system with increasing DER penetration with PV only showing yearly trends and zoomed views for the following: (a,e) system losses, (b,f) meter data, (c,g) distributed generation, and (d,h) voltage profiles across varying penetration levels.
Figure 21b,f depict the active and reactive power recorded at the substation. As PV penetration increases, the system transitions from a traditional import-dominated profile to scenarios where midday export conditions prevail. These bidirectional flows, accompanied by increased amplitude and frequency in power direction switching, can impose operational stress on substation equipment such as on-load tap changers. The growing need for inverter-based functionalities, such as ride-through and support for voltage regulation, becomes evident in such high-penetration environments.
The total distributed generation trends shown in Figure 21c,g confirm a consistent bell-shaped generation profile across all simulations, driven by the inherent diurnal and seasonal behavior of solar output. However, at higher penetration levels, the volume of exported energy during midday hours becomes substantial. This raises concerns related to overgeneration and necessitates the implementation of control schemes such as dynamic curtailment, load shifting, or energy storage to manage surplus energy more effectively.
Finally, voltage behavior across the network is illustrated in Figure 21d,h. While undervoltage events remain infrequent, overvoltage conditions become prominent during peak PV production periods, especially at buses located far from the substation or with high PV-to-load ratios. These localized excursions underscore the limitations of centralized regulation devices and highlight the need for distributed voltage support solutions. Technologies such as Volt/VAR control, smart inverters with reactive capability, and decentralized capacitor banks are recommended to mitigate such issues and ensure voltage compliance throughout the feeder.
The simulation results clearly indicate that low to moderate PV integration (up to approximately 25%) can be accommodated without significant adverse effects on system performance. However, as PV penetration exceeds 35–40%, several critical challenges begin to emerge. These include the increasing occurrence of voltage violations due to surplus generation, reversal of feeder power flows leading to higher line losses, and the saturation of peak shaving benefits. Without appropriate mitigation strategies, such as adaptive voltage control, inverter-based reactive power support, smart inverter dispatch, or coordinated storage control, the system experiences a rapid decline in hosting capacity and operational reliability. These findings reinforce the need for proactive grid modernization and planning to ensure the safe and efficient integration of high PV penetrations.
5.2.4. Monte Carlo Simulation Results Using ALL DERs
A comprehensive Monte Carlo analysis was conducted on the IEEE 123-bus system to assess the system-wide impact of integrating multiple Distributed Energy Resources (DERs), namely photovoltaic (PV) systems, electric vehicles (EVs), and battery energy storage systems (BESSs). The penetration levels were varied systematically from 0% to 75% in 5% increments. For each penetration level, multiple random DER placement and sizing configurations were generated and evaluated to capture the stochastic behavior of DER integration. Each simulation instance reflects unique combinations of load shapes, DER sizes, and spatial distribution across residential and commercial nodes.
Figure 22 presents the statistical outcomes of the Monte Carlo simulations for the IEEE 123-bus system incorporating PV, EV, and BESS, offering insight into six critical performance metrics across increasing DER penetration levels. The boxplots summarize the variability across randomized DER deployment configurations and temporal profiles.
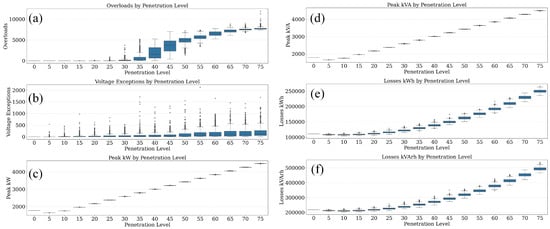
Figure 22.
Monte Carlo simulation results for the IEEE 123-bus system illustrating the impact of increasing DER penetration including PV, EV, and BESS on: (a) overloads, (b) voltage exceptions, (c) peak kW, (d) peak kVA, (e) energy losses (kWh), and (f) reactive energy losses (kVArh).
In Figure 22a, overload events exhibit a dramatic and nonlinear rise beginning at around 30–35% DER penetration, intensifying rapidly beyond 45%. These overloads predominantly affect lines and transformers subjected to coincident high EV charging and delayed or insufficient BESS discharging. The broad interquartile range and numerous outliers at higher penetration levels reflect the strong dependence of thermal loading on DER siting, temporal alignment, and coordination. These results highlight growing thermal vulnerability under unmanaged DER growth.
Figure 22b shows that voltage exceptions increase steadily with DER penetration. Violations are detected as early as 10–15%, increasing in frequency and severity with further penetration. This behavior is primarily driven by high midday PV output leading to overvoltage at lightly loaded nodes, as well as localized undervoltages from clustered evening EV loads. The substantial whisker lengths and data dispersion indicate that some nodes are particularly sensitive to voltage regulation failure under certain Monte Carlo scenarios.
The substation’s peak real power demand (Figure 22c) increases linearly with DER penetration, contrary to expectations that DERs reduce peak loads. This trend is due to the accumulation of EV charging events, often occurring simultaneously during grid peak periods, overpowering the mitigating effects of PV generation and BESS discharge. Similarly, Figure 22d reveals that peak apparent power (kVA) also climbs with penetration, reflecting increased current magnitude due to both real and reactive power demands. The use of inverters in DERs, especially under uncoordinated operation, contributes to reactive injection, exacerbating the substation’s apparent power burden.
Figure 22e,f indicate sharp increases in both real energy losses (kWh) and reactive losses (kVArh) with rising DER levels. Unlike PV-only scenarios where localized generation helps curtail losses, the addition of EV and BESS complicates power flows. Reverse power transfers from PV, coincident EV loading, and inefficient BESS scheduling result in frequent bidirectional currents across long feeders. The reactive losses nearly double across the studied range, underscoring the inefficiency introduced by reactive power interactions among DERs. These findings signal the need for enhanced Volt/VAR control, strategic DER dispatch, and load-shaping mechanisms to contain system losses and maintain grid performance under high DER integration.
To further investigate the temporal dynamics of grid performance under increasing DER penetration, Figure 23 presents both full-year (left) and representative week (hours 4100–4172, right) trends for four key system variables across all penetration scenarios, including PV, EV, and BESS.
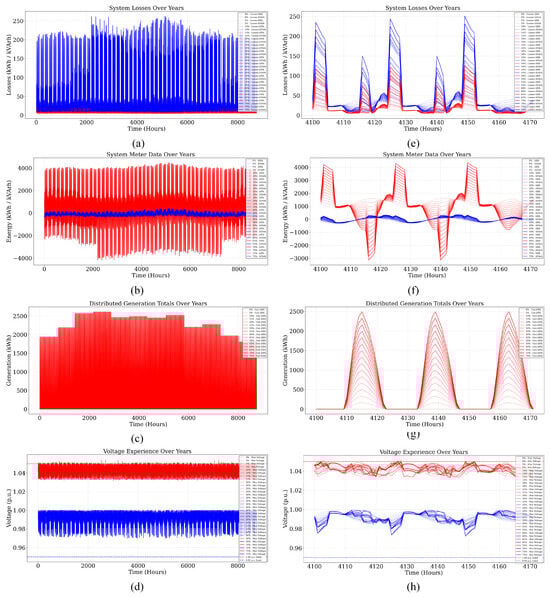
Figure 23.
Monte Carlo simulation results for the IEEE 123-bus system showing the impact of increasing DER penetration—including PV, EV, and BESS with yearly trends and zoomed views for (a,e) system losses, (b,f) meter data, (c,g) distributed generation, and (d,h) voltage profiles across varying penetration levels.
Figure 23a,e illustrate system losses, combining both active (blue) and reactive (red) energy losses. Over the course of the year, losses follow cyclical daily patterns strongly influenced by solar generation and load profiles. As DER penetration increases, total energy losses become increasingly variable and rise significantly during midday hours in the zoomed view (Figure 23e). These peaks correspond to periods of high PV generation and low local consumption, triggering reverse power flows and increased reactive circulation, particularly in feeders not adequately supported by BESS discharge.
System-level energy exchange with the substation is shown in Figure 23b,f. With higher DER integration, net energy drawn from the substation declines due to local generation and storage support. However, the zoomed-in plots reveal large amplitude oscillations in both active (red) and reactive (blue) flows. During high-penetration midday hours, substantial power is exported to the substation, leading to polarity reversals in meter readings. These bidirectional transitions increase the operational stress on transformer tap changers and may challenge the protection coordination schemes in place.
Figure 23c,g show distributed generation totals, which exhibit the characteristic bell-shaped daily curve of PV systems. At higher DER penetrations, midday generation reaches its maximum and becomes more variable across scenarios, underscoring the influence of irradiance profiles and PV placement diversity. The recurring high peaks and sharp transitions suggest a need for active curtailment, demand shifting, or energy absorption mechanisms to maintain local power balance and prevent overgeneration-related issues.
Finally, voltage trends are captured in Figure 23d,h. Throughout the year, most voltages remain within acceptable limits (0.95–1.05 p.u.), yet the variability grows with increasing DER levels. In the zoomed plots, Figure 23h shows clustered overvoltage events near solar noon and mild undervoltage dips during evening EV peaks. These patterns confirm that the compounded effects of daytime PV injections and nighttime EV loads exacerbate voltage volatility, especially at electrically distant nodes or those with weak regulation support.
Overall, the results indicate that while DER integration brings substantial energy and peak-shaving benefits, the 123-bus system experiences increasing operational complexity as penetration exceeds 40–50%. Temporal overlaps between DER behaviors—such as midday PV export and evening EV charging—generate stress on both energy balance and voltage regulation. These findings emphasize the critical need for real-time coordination, Volt/VAR optimization, and demand-side management to ensure reliable system operation under high DER penetration.
The analysis underscores the need for advanced control strategies to unlock higher hosting capacity. This includes coordinated DER dispatch, demand-side flexibility, Volt/VAR control using smart inverters, and optimized BESS charging/discharging schedules. Without such interventions, hosting capacity saturates quickly, and system-wide operational degradation becomes inevitable.
5.3. Comparative Discussion
The performance of the IEEE 13-bus and IEEE 123-bus systems under various DER integration scenarios offers a comprehensive understanding of how distribution system topology, load diversity, and node location affect the ability to host Distributed Energy Resources. The 13-bus system, with a compact and radial layout, presents a more sensitive response to incremental DER penetration. Due to its limited size (with 15 primary nodes considered for analysis), the overall PV hosting capacity is concentrated on fewer nodes, such as node 671, which supports up to 1.1 MW of PV generation without causing overloads or voltage violations. This high hosting value, however, is an exception and not the norm; other nodes in the 13-bus system, including 634, 675, and 645, demonstrated much lower hosting thresholds, ranging between 50 and 150 kW, indicating that capacity is highly dependent on local network strength, impedance, and feeder head proximity. On the other hand, the IEEE 123-bus system exhibits a more distributed capability for DER accommodation. With over 95 residential and commercial nodes analyzed, the system supported a wider spectrum of PV capacities. Several nodes such as s64b, s66c, s48, s47, s76a, s65c, and s76b each hosted DERs in the range of 70–210 kW, even under conservative sizing conditions. The overall system load of the 123-bus feeder (approximately 3490 kW) allowed a more robust allocation of DERs without triggering system-wide constraint violations.
In terms of DER hosting capacity, the nodal capacity results indicated that even within the same feeder, substantial variation exists across nodes. For the 13-bus system, the cumulative hosting capacity under zero violation conditions was approximately 3.6 MW, which is just above the system peak load of 3.49 MW, indicating that hosting potential can match system demand under optimal conditions. The 123-bus system, however, displayed a more balanced utilization of DERs across nodes, enabling a higher number of nodes to share the hosting burden without heavily stressing any particular branch. This becomes particularly important in operational planning, where equitable DER distribution helps in loss minimization and voltage profile flattening.
Sensitivity to DER sizing and load growth emerged as a critical theme in both systems. As penetration of PV, EV, and BESS increased from 0% to 75% in 5% increments, the Monte Carlo simulations revealed clear thresholds beyond which system performance degraded. In the 13-bus case, voltage violations and overloads began appearing more frequently beyond 45–50% DER penetration, while the 123-bus system exhibited greater tolerance due to its distributed structure but still showed adverse impacts when penetration exceeded 60%. Particularly, the long lateral branches in the 123-bus system were susceptible to under-voltage issues when DERs were clustered far from the substation. Similarly, power losses and reactive power demands increased with DER penetration, especially when uncoordinated EV charging and BESS discharging occurred during peak load hours. For instance, total system losses in the 13-bus feeder rose from 38.2 MWh/year at 0% penetration to over 50 MWh/year at 75%, while in the 123-bus system, a similar trend was observed, albeit with smoother progression due to better load and DER spatial diversification.
The value of combining deterministic and probabilistic evaluations is evident through the integration of nodal analysis with Monte Carlo simulations. Deterministic nodal hosting capacity analysis provided clear insight into the absolute thresholds of each node under idealized, static conditions. These results are useful for identifying optimal DER placement strategies and initial feasibility studies. However, they fail to capture the stochastic nature of DER behavior, customer variability, and temporal load dynamics. The Monte Carlo approach, with 500 random iterations per penetration level, offered a statistical distribution of possible outcomes, including overload frequency, under-voltage occurrence, and variations in peak loading. This dual approach enables grid planners to not only set upper bounds but also assess risk margins and identify worst-case scenarios. For example, while node s76a in the 123-bus system might host up to 105 kW in the deterministic analysis, probabilistic evaluations might suggest derating it to 90 kW to ensure reliability across the majority of scenarios.
In addition to the technical improvements demonstrated through coordinated DER integration, the framework also offers notable economic benefits. Reductions in system losses directly translate to lower energy procurement costs for utilities. Moreover, mitigation of feeder congestion and voltage violations can defer or eliminate the need for costly network reinforcements, such as transformer or line upgrades. Coordinated DER deployment also enhances asset utilization and improves the operational efficiency of the distribution system. While this study focuses on technical performance metrics, these outcomes collectively support a favorable cost–benefit profile. Future work will extend the framework to incorporate economic optimization objectives, including DER capital costs, energy market revenues, and lifecycle savings, to enable a more comprehensive techno-economic analysis.
One of the clearest takeaways from this study is the importance of node-specific strategies in deploying DERs. Uniform DER deployment across a feeder, although simple to plan, often leads to inefficient or unsafe operation. Nodes located closer to the substation can accommodate higher DER sizes with minimal impact, while those at the feeder ends or weak voltage zones may require additional support mechanisms such as voltage regulation devices or smart inverter functions. For instance, in the 123-bus system, node s4c or s83c may experience early voltage violations due to their remoteness and line impedance, even with small DER additions, whereas s47 and s48 demonstrated strong DER hosting potential.
The scalability of the analysis framework is another vital contribution. The methodology used for the 13-bus system was directly extended to the 123-bus case with minimal adjustment, showcasing the framework’s robustness. Python-based orchestration using py_dss_interface enabled dynamic model reconfiguration, case management, and data extraction, while OpenDSS served as the simulation backend. The same scripts were used to automate DER injections, simulate yearly profiles, and evaluate metrics for thousands of cases. This level of automation ensures that the methodology can be adapted to larger utility-scale feeders or even utility-wide simulations.
From an applicability perspective, the findings demonstrate that this framework can be leveraged across different grid sizes and configurations, from small rural feeders with sparse loads to dense urban feeders with high DER potential. For smaller feeders like the 13-bus system, quick deterministic nodal assessments may be sufficient to plan limited DER integration. In contrast, for complex feeders like the 123-bus system, probabilistic simulations become essential to uncover hidden bottlenecks and to assess the true reliability envelope under real-world variability.
Lastly, real-world deployment considerations should include integration with utility planning tools, adherence to operational standards, and adaptation to DER interconnection policies. These include modeling seasonal load variation, DER generation profiles (especially for solar), and advanced inverter functions for grid support. In the context of evolving regulatory frameworks, such as IEEE 1547-2018, tools that support both deterministic and probabilistic assessments will become increasingly vital. The presented approach equips utilities and researchers with a powerful decision-making engine to explore DER-hosting capacity, optimize deployment strategies, and enhance grid resilience in a decentralized energy future.
6. Conclusions and Future Work
This work proposed a unified simulation and optimization framework to analyze the grid-level impacts of Distributed Energy Resources (DERs) and determine their optimal placement for enhancing the operational performance of distribution systems. Using both the IEEE 13-bus and IEEE 123-bus networks, we demonstrated that a combination of nodal hosting analysis and Monte Carlo simulations provides deep insight into system sensitivities and constraints under uncertain load and generation scenarios. One of the key distinguishing features of this study lies in its explicit treatment of congestion mitigation as a primary optimization goal, rather than as an ancillary benefit of DER deployment. Unlike conventional frameworks, which often limit the scope to energy loss or voltage profile improvements, our methodology integrates thermal congestion indices directly into the optimization formulation. Moreover, by combining deterministic hosting capacity analysis with extensive probabilistic validation via Monte Carlo simulations, the proposed framework ensures that DER placement decisions are not only locally optimal but also resilient to uncertainties in DER output and load variability. This dual-layer strategy enhances both planning accuracy and operational robustness, making it highly adaptable to real-world utility applications.
The key findings show the following:
- PV-only integration improved system performance up to a penetration threshold (approximately 30–35%), beyond which voltage violations and reverse power flows became significant.
- The combined deployment of PV, BESS, and EVs revealed nonlinear interactions that necessitate coordinated control, especially in high-density areas.
- Optimal DER placement increased system hosting capacity by 45–65%, with energy loss reductions ranging from 20 to 35%.
- Nodal analysis highlighted the significant spatial disparity in hosting limits, reinforcing the importance of localized planning.
- Monte Carlo-based evaluation uncovered critical risks that deterministic models often overlook, particularly under fluctuating load/generation profiles.
This study establishes the value of a hybrid evaluation framework that integrates both deterministic power flow and probabilistic simulation. The proposed methods are scalable and generalizable across systems of varying sizes and complexities. Future work will incorporate metaheuristic optimization algorithms (e.g., GA, PSO), dynamic DER control strategies, and hardware-in-the-loop (HIL) validation to enhance real-time responsiveness and resilience. The findings provide actionable insights for utilities aiming to plan and operate distribution systems in the era of decentralized and dynamic energy landscapes.
Author Contributions
Conceptualization, H.I., A.S. and A.I.S.; methodology, H.I., A.S. and A.I.S.; software, H.I. and A.S.; validation, H.I. and A.S.; formal analysis, A.I.S.; investigation, H.I. and A.S.; resources, H.I., A.S. and A.I.S.; data curation, H.I., A.S. and A.I.S.; writing—original draft preparation, H.I., A.S. and A.I.S.; writing—review and editing, A.I.S.; visualization, H.I., A.S. and A.I.S.; supervision, A.I.S.; project administration, A.I.S. All authors have read and agreed to the published version of the manuscript.
Funding
This research received no external funding.
Data Availability Statement
The original contributions presented in the study are included in the article, further inquiries can be directed to the corresponding author.
Conflicts of Interest
The authors declare no conflicts of interest.
Abbreviations
The following abbreviations are used in this manuscript:
| ANSI | American National Standards Institute |
| BESS | Battery Energy Storage System |
| CHP | Combined Heat and Power |
| CI | Congestion Index |
| COM | Component Object Model |
| DC | Direct Current |
| DE | Differential Evolution |
| DER | Distributed Energy Resources |
| DRL | Deep Reinforcement Learning |
| DSO | Distribution System Operator |
| EV | Electric Vehicle |
| GA | Genetic Algorithm |
| HIL | Hardware-in-the-Loop |
| IEEE | Institute of Electrical and Electronics Engineers |
| LSF | Loss Sensitivity Factor |
| MDP | Markov Decision Process |
| MILP | Mixed-Integer Linear Programming |
| MINLP | Mixed-Integer Nonlinear Programming |
| MOEA | Multi-Objective Evolutionary Algorithm |
| MCS | Monte Carlo Simulation |
| NSGA-II | Non-Dominated Sorting Genetic Algorithm II |
| p.u. | Per Unit |
| PSO | Particle Swarm Optimization |
| PV | Photovoltaic |
| RL | Reinforcement Learning |
| SOC | State of Charge |
| THD | Total Harmonic Distortion |
| VSI | Voltage Stability Index |
Appendix A. For IEEE 13
Table A1.
Line Configuration Data.
Table A1.
Line Configuration Data.
| Name | Phases | Bus1 | Bus2 | Linecode | Length |
|---|---|---|---|---|---|
| 651632 | 3 | 651.1.2.3 | 632.1.2.3 | mtx601 | 2000 ft |
| 632671 | 3 | 632.1.2.3 | 671.1.2.3 | mtx601 | 2000 ft |
| 671680 | 3 | 671.1.2.3 | 680.1.2.3 | mtx601 | 1000 ft |
| 671684 | 2 | 671.1.3 | 684.1.3 | mtx604 | 300 ft |
| 684611 | 1 | 684.3 | 611.3 | mtx605 | 300 ft |
| 684652 | 1 | 684.1 | 652.1 | mtx607 | 800 ft |
| 692675 | 3 | 692.1.2.3 | 675.1.2.3 | mtx606 | 500 ft |
| 632633 | 3 | 632.1.2.3 | 633.1.2.3 | mtx602 | 500 ft |
| 632645 | 2 | 632.2.3 | 645.2.3 | mtx603 | 500 ft |
| 645646 | 2 | 645.2.3 | 646.2.3 | mtx603 | 300 ft |
Table A2.
Capacitor Configuration Data.
Table A2.
Capacitor Configuration Data.
| Name | Bus1 | Phases | kVAr | kV |
|---|---|---|---|---|
| Cap1 | 675 | 3 | 600 | 4.16 |
| Cap2 | 611.3 | 1 | 100 | 2.4 |
Table A3.
Load Configuration Data.
Table A3.
Load Configuration Data.
| Name | Bus1 | Phases | Model | Conn | kV | kW | kVAr |
|---|---|---|---|---|---|---|---|
| 632a | 632.1.0 | 1 | 1 | wye | 2.4 | 17 | 10 |
| 632b | 632.2.0 | 1 | 1 | wye | 2.4 | 66 | 38 |
| 632c | 632.3.0 | 1 | 1 | wye | 2.4 | 117 | 68 |
| 671 | 671.1.2.3.0 | 3 | 1 | wye | 4.16 | 1155 | 660 |
| 675a | 675.1.0 | 1 | 1 | wye | 2.4 | 485 | 190 |
| 675b | 675.2.0 | 1 | 1 | wye | 2.4 | 68 | 60 |
| 675c | 675.3.0 | 1 | 1 | wye | 2.4 | 290 | 212 |
| 634a | 634.1 | 1 | 1 | wye | 0.277 | 160 | 110 |
| 634b | 634.2 | 1 | 1 | wye | 0.277 | 120 | 90 |
| 634c | 634.3 | 1 | 1 | wye | 0.277 | 120 | 90 |
| 645 | 645.2.0 | 1 | 1 | wye | 2.4 | 170 | 125 |
| 692 | 692.3.0 | 1 | 5 | wye | 2.4 | 170 | 151 |
| 611 | 611.3.0 | 1 | 5 | wye | 2.4 | 170 | 80 |
| 646 | 646.2.0 | 1 | 2 | wye | 2.4 | 230 | 132 |
| 652 | 652.1.0 | 1 | 2 | wye | 2.4 | 128 | 86 |
Table A4.
Transformer Configuration Data.
Table A4.
Transformer Configuration Data.
| Name | Phases | XHL | Bus1 | Bus2 | kV | kVA |
|---|---|---|---|---|---|---|
| Regulator1 | 3 | 0.01 | src.1.2.3.0 | 651.1.2.3.0 | 4.16/4.16 | 5000 |
| Transformer1 | 3 | 2 | 633.1.2.3.0 | 634.1.2.3.0 | 4.16/0.48 | 500 |
References
- Muhtadi, A.; Pandit, D.; Nguyen, N.; Mitra, J. Distributed energy resources based microgrid: Review of architecture, control, and reliability. IEEE Trans. Ind. Appl. 2021, 57, 2223–2235. [Google Scholar] [CrossRef]
- Lu, Z.; Wang, J.; Shahidehpour, M.; Bai, L.; Xiao, Y.; Li, H. Cooperative operation of distributed energy resources and thermal power plant with a carbon-capture-utilization-and-storage system. IEEE Trans. Power Syst. 2023, 39, 1850–1866. [Google Scholar] [CrossRef]
- Razmi, D.; Lu, T. A literature review of the control challenges of distributed energy resources based on microgrids (MGs): Past, present and future. Energies 2022, 15, 4676. [Google Scholar] [CrossRef]
- Ali, S.; Zheng, Z.; Aillerie, M.; Sawicki, J.P.; Pera, M.C.; Hissel, D. A review of DC Microgrid energy management systems dedicated to residential applications. Energies 2021, 14, 4308. [Google Scholar] [CrossRef]
- Hu, J.; Liu, X.; Shahidehpour, M.; Xia, S. Optimal operation of energy hubs with large-scale distributed energy resources for distribution network congestion management. IEEE Trans. Sustain. Energy 2021, 12, 1755–1765. [Google Scholar] [CrossRef]
- Azmi, K.H.M.; Radzi, N.A.M.; Azhar, N.A.; Samidi, F.S.; Zulkifli, I.T.; Zainal, A.M. Active electric distribution network: Applications, challenges, and opportunities. IEEE Access 2022, 10, 134655–134689. [Google Scholar] [CrossRef]
- Muqbel, A.; Al-Awami, A.T.; Parvania, M. Optimal planning of distributed battery energy storage systems in unbalanced distribution networks. IEEE Syst. J. 2021, 16, 1194–1205. [Google Scholar] [CrossRef]
- Procopiou, A.T.; Ochoa, L.F. Asset congestion and voltage management in large-scale MV-LV networks with solar PV. IEEE Trans. Power Syst. 2021, 36, 4018–4027. [Google Scholar] [CrossRef]
- Shafiullah, M.; Ahmed, S.D.; Al-Sulaiman, F.A. Grid integration challenges and solution strategies for solar PV systems: A review. IEEE Access 2022, 10, 52233–52257. [Google Scholar] [CrossRef]
- Pippi, K.D.; Kryonidis, G.C.; Nousdilis, A.I.; Papadopoulos, T.A. A unified control strategy for voltage regulation and congestion management in active distribution networks. Electr. Power Syst. Res. 2022, 212, 108648. [Google Scholar] [CrossRef]
- Chihota, M.J.; Bekker, B.; Gaunt, C.T. Technical assessment of the impacts of distributed energy resources on distribution feeders. In Uncertainties in Modern Power Systems; Elsevier: Amsterdam, The Netherlands, 2021; pp. 397–439. [Google Scholar]
- Smith, E.J.; Robinson, D.A.; Elphick, S. DER control and management strategies for distribution networks: A review of current practices and future directions. Energies 2024, 17, 2636. [Google Scholar] [CrossRef]
- Strezoski, L.; Stefani, I. Utility DERMS for active management of emerging distribution grids with high penetration of renewable DERs. Electronics 2021, 10, 2027. [Google Scholar] [CrossRef]
- Fragkos, G.; Johnson, J.; Tsiropoulou, E.E. Centralized and decentralized distributed energy resource access control implementation considerations. Energies 2022, 15, 6375. [Google Scholar] [CrossRef]
- Ismail, B.; Wahab, N.I.A.; Othman, M.L.; Radzi, M.A.M.; Vijayakumar, K.N.; Rahmat, M.K.; Naain, M.N.M. New line voltage stability index (BVSI) for voltage stability assessment in power system: The comparative studies. IEEE Access 2022, 10, 103906–103931. [Google Scholar] [CrossRef]
- Nam, J.H.; Park, S.J.; Cho, D.I.; Cho, Y.J.; Moon, W.S. Assessing the Suitability of Distributed Energy Resources in Distribution Systems based on the Voltage Margin: A Case Study of Jeju, South Korea. IEEE Access 2025, 13, 36263–36272. [Google Scholar] [CrossRef]
- Hung, D.Q.; Mithulananthan, N. Multiple distributed generator placement in primary distribution networks for loss reduction. IEEE Trans. Ind. Electron. 2011, 60, 1700–1708. [Google Scholar] [CrossRef]
- Iqbal, H.; Sarwat, A. Improved Genetic Algorithm-Based Harmonic Mitigation Control of an Asymmetrical Dual-Source 13-Level Switched-Capacitor Multilevel Inverter. Energies 2024, 18, 35. [Google Scholar] [CrossRef]
- Iqbal, H.; Tufail, S.; Tariq, M.; Sarwat, A.I.; Sarwar, A. GA-based Integrated SHM-NLC Control for a Single Sourced Switched Capacitor Multi-Level Inverter with Boosting Capability for Microgrid. In Proceedings of the 2023 IEEE International Conference on Energy Technologies for Future Grids (ETFG), Wollongong, Australia, 3–6 December 2023; pp. 1–6. [Google Scholar]
- Mateev, V.; Marinova, I. Modified chromosome pooling genetic algorithm for resource allocation optimization. In Applications of Mathematics in Engineering and Economics (AMEE’22), Proceedings of the 48th International Conference “Applications of Mathematics in Engineering and Economics”, Sofia, Bulgaria, 7–13 June 2022; AIP Publishing: Melville, NY, USA, 2023; Volume 2939. [Google Scholar]
- El Sayed, A.; Ahmed, E.E.; Poyrazoglu, G. Optimal Planning and Allocation of DER in Radial Distribution Networks Using IPSO. In Proceedings of the 2024 IEEE 8th Energy Conference (ENERGYCON), Doha, Qatar, 4–7 March 2024; pp. 1–6. [Google Scholar]
- Sousa, T.; Morais, H.; Vale, Z.; Faria, P.; Soares, J. Intelligent energy resource management considering vehicle-to-grid: A simulated annealing approach. IEEE Trans. Smart Grid 2011, 3, 535–542. [Google Scholar] [CrossRef]
- Meena, N.K.; Parashar, S.; Swarnkar, A.; Gupta, N.; Niazi, K.R. Improved elephant herding optimization for multiobjective DER accommodation in distribution systems. IEEE Trans. Ind. Inform. 2017, 14, 1029–1039. [Google Scholar] [CrossRef]
- Kumar, M.A.; Laxmi, A.J. Machine learning based intentional islanding algorithm for ders in disaster management. IEEE Access 2021, 9, 85300–85309. [Google Scholar] [CrossRef]
- Wazirali, R.; Yaghoubi, E.; Abujazar, M.S.S.; Ahmad, R.; Vakili, A.H. State-of-the-art review on energy and load forecasting in microgrids using artificial neural networks, machine learning, and deep learning techniques. Electr. Power Syst. Res. 2023, 225, 109792. [Google Scholar] [CrossRef]
- Park, D.; Perabo, F.; Choi, M.; Skjong, E.; Zadeh, M. An optimal energy management system for marine hybrid power systems. In Proceedings of the 2021 IEEE 22nd Workshop on Control and Modelling of Power Electronics (COMPEL), Cartagena, Colombia, 2–5 November 2021; pp. 1–8. [Google Scholar]
- Yang, C.; Sun, Y.; Zou, Y.; Zheng, F.; Liu, S.; Zhao, B.; Wu, M.; Cui, H. Optimal power flow in distribution network: A review on problem formulation and optimization methods. Energies 2023, 16, 5974. [Google Scholar] [CrossRef]
- Iqbal, H.; Sarwat, A. Design and Implementation of Hybrid GA-PSO-Based Harmonic Mitigation Technique for Modified Packed U-Cell Inverters. Energies 2024, 18, 124. [Google Scholar] [CrossRef]
- Abud, T.P.; Augusto, A.A.; Fortes, M.Z.; Maciel, R.S.; Borba, B.S. State of the art Monte Carlo method applied to power system analysis with distributed generation. Energies 2022, 16, 394. [Google Scholar] [CrossRef]
- Wanjoli, P.; Moustafa, M.M.Z.; Abbasy, N.H. Probabilistic Power Flow Analysis of DERs Integrated Power System From a Bayesian Parameter Estimation Perspective. IEEE Access 2024, 12, 178734–178750. [Google Scholar] [CrossRef]
- Prakash, P. Optimal DG allocation using particle swarm optimization. In Proceedings of the 2021 International Conference on Artificial Intelligence and Smart Systems (ICAIS), Coimbatore, India, 25–27 March 2021; pp. 940–944. [Google Scholar]
- Ali, M.A.; Bhatti, A.R.; Rasool, A.; Farhan, M.; Esenogho, E. Optimal Location and Sizing of Photovoltaic-Based Distributed Generations to Improve the Efficiency and Symmetry of a Distribution Network by Handling Random Constraints of Particle Swarm Optimization Algorithm. Symmetry 2023, 15, 1752. [Google Scholar] [CrossRef]
- Adegoke, S.A.; Sun, Y.; Adegoke, A.S.; Ojeniyi, D. Optimal placement of distributed generation to minimize power loss and improve voltage stability. Heliyon 2024, 10, e39298. [Google Scholar] [CrossRef] [PubMed]
- Ahmadi, B.; Ceylan, O.; Ozdemir, A.; Fotuhi-Firuzabad, M. A multi-objective framework for distributed energy resources planning and storage management. Appl. Energy 2022, 314, 118887. [Google Scholar] [CrossRef]
- Fettah, K.; Guia, T.; Salhi, A.; Betka, A.; Saidi, A.S.; Teguar, M.; Ali, E.; Bajaj, M.; Mohammadi, S.A.D.; Ghoneim, S.S. A pareto strategy based on multi-objective optimal integration of distributed generation and compensation devices regarding weather and load fluctuations. Sci. Rep. 2024, 14, 10423. [Google Scholar] [CrossRef]
- IEEE PES Test Feeder—IEEE PES AMPS DSAS Test Feeder Working Group, IEEE Power and Energy Society. Available online: https://cmte.ieee.org/pes-testfeeders/ (accessed on 4 April 2025).
- OpenDSS, Electric Power Research Institute (EPRI). Available online: https://www.epri.com/pages/sa/opendss (accessed on 4 April 2025).
Disclaimer/Publisher’s Note: The statements, opinions and data contained in all publications are solely those of the individual author(s) and contributor(s) and not of MDPI and/or the editor(s). MDPI and/or the editor(s) disclaim responsibility for any injury to people or property resulting from any ideas, methods, instructions or products referred to in the content. |
© 2025 by the authors. Licensee MDPI, Basel, Switzerland. This article is an open access article distributed under the terms and conditions of the Creative Commons Attribution (CC BY) license (https://creativecommons.org/licenses/by/4.0/).