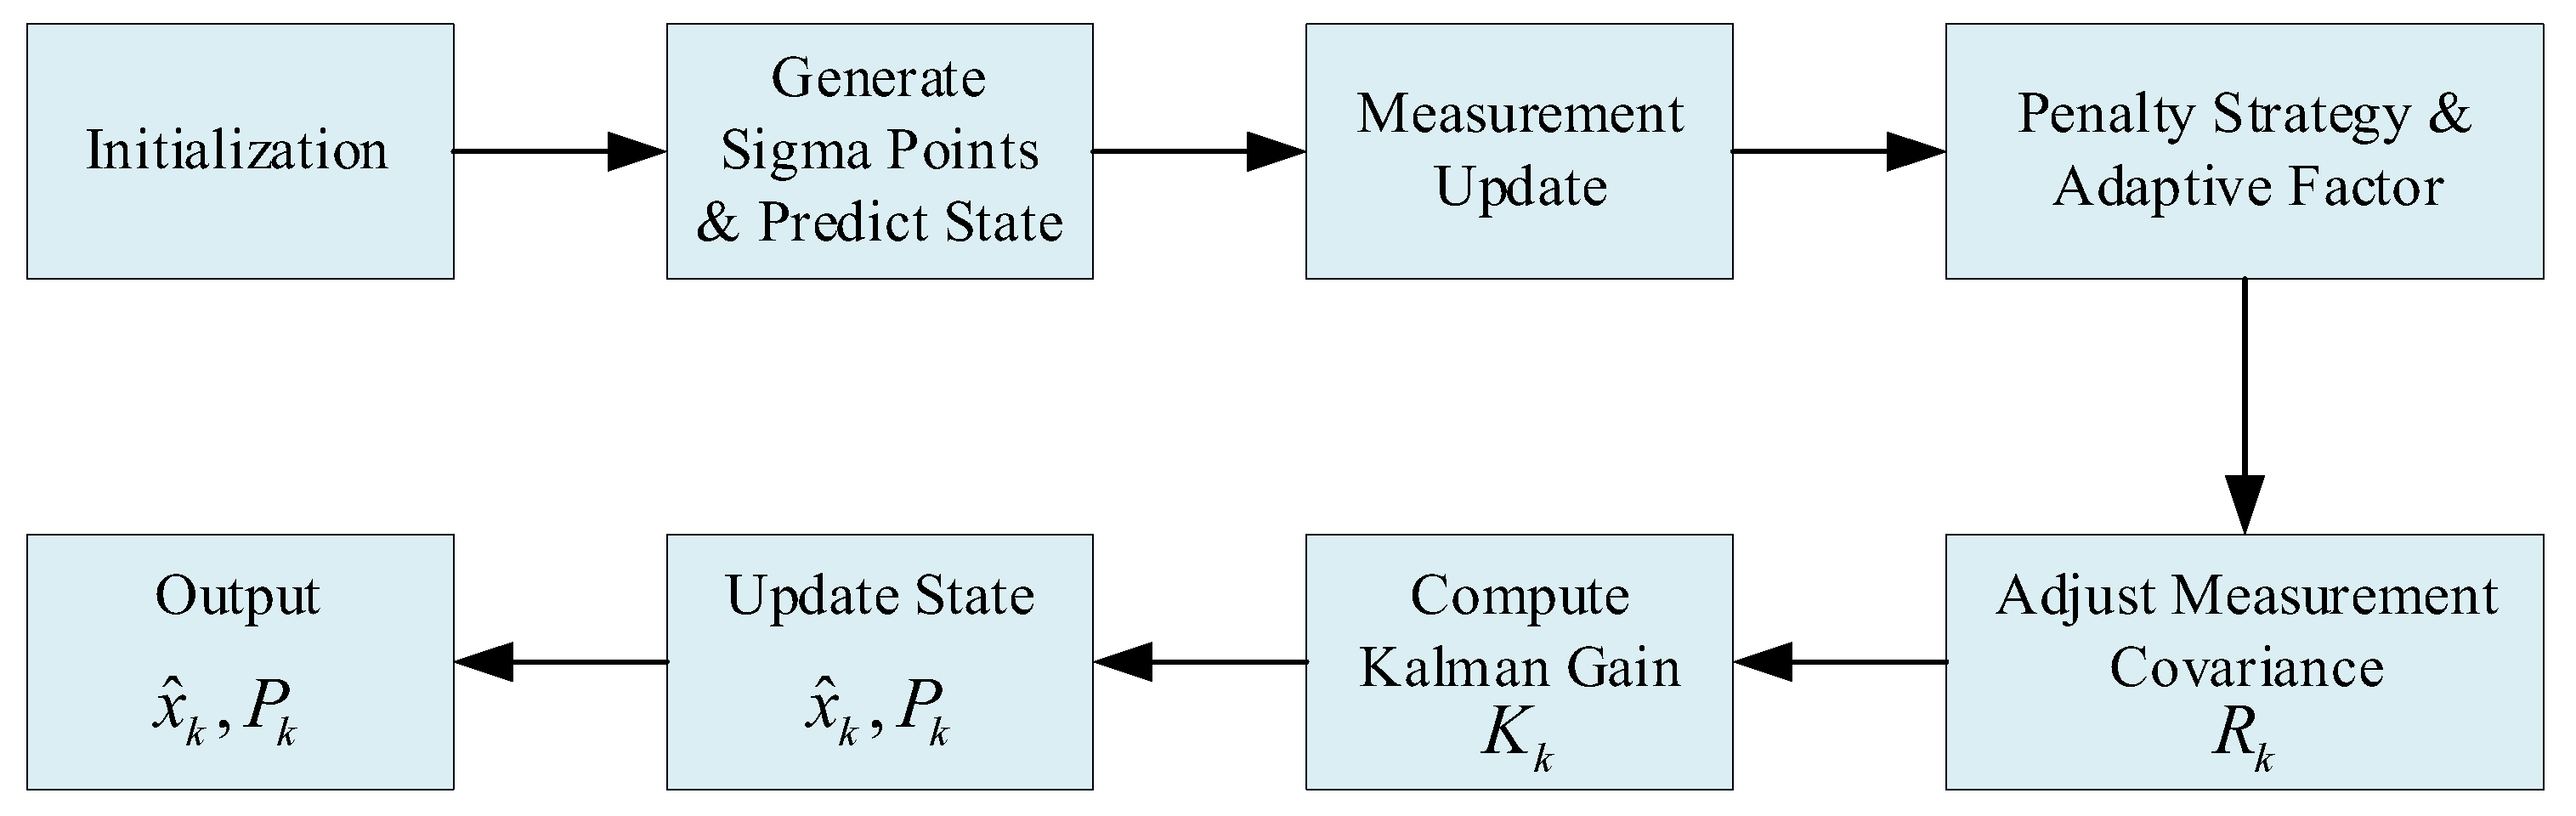
Figure 1.
Flowchart of the proposed RCKF_CS algorithm illustrating the key steps.
Figure 1.
Flowchart of the proposed RCKF_CS algorithm illustrating the key steps.
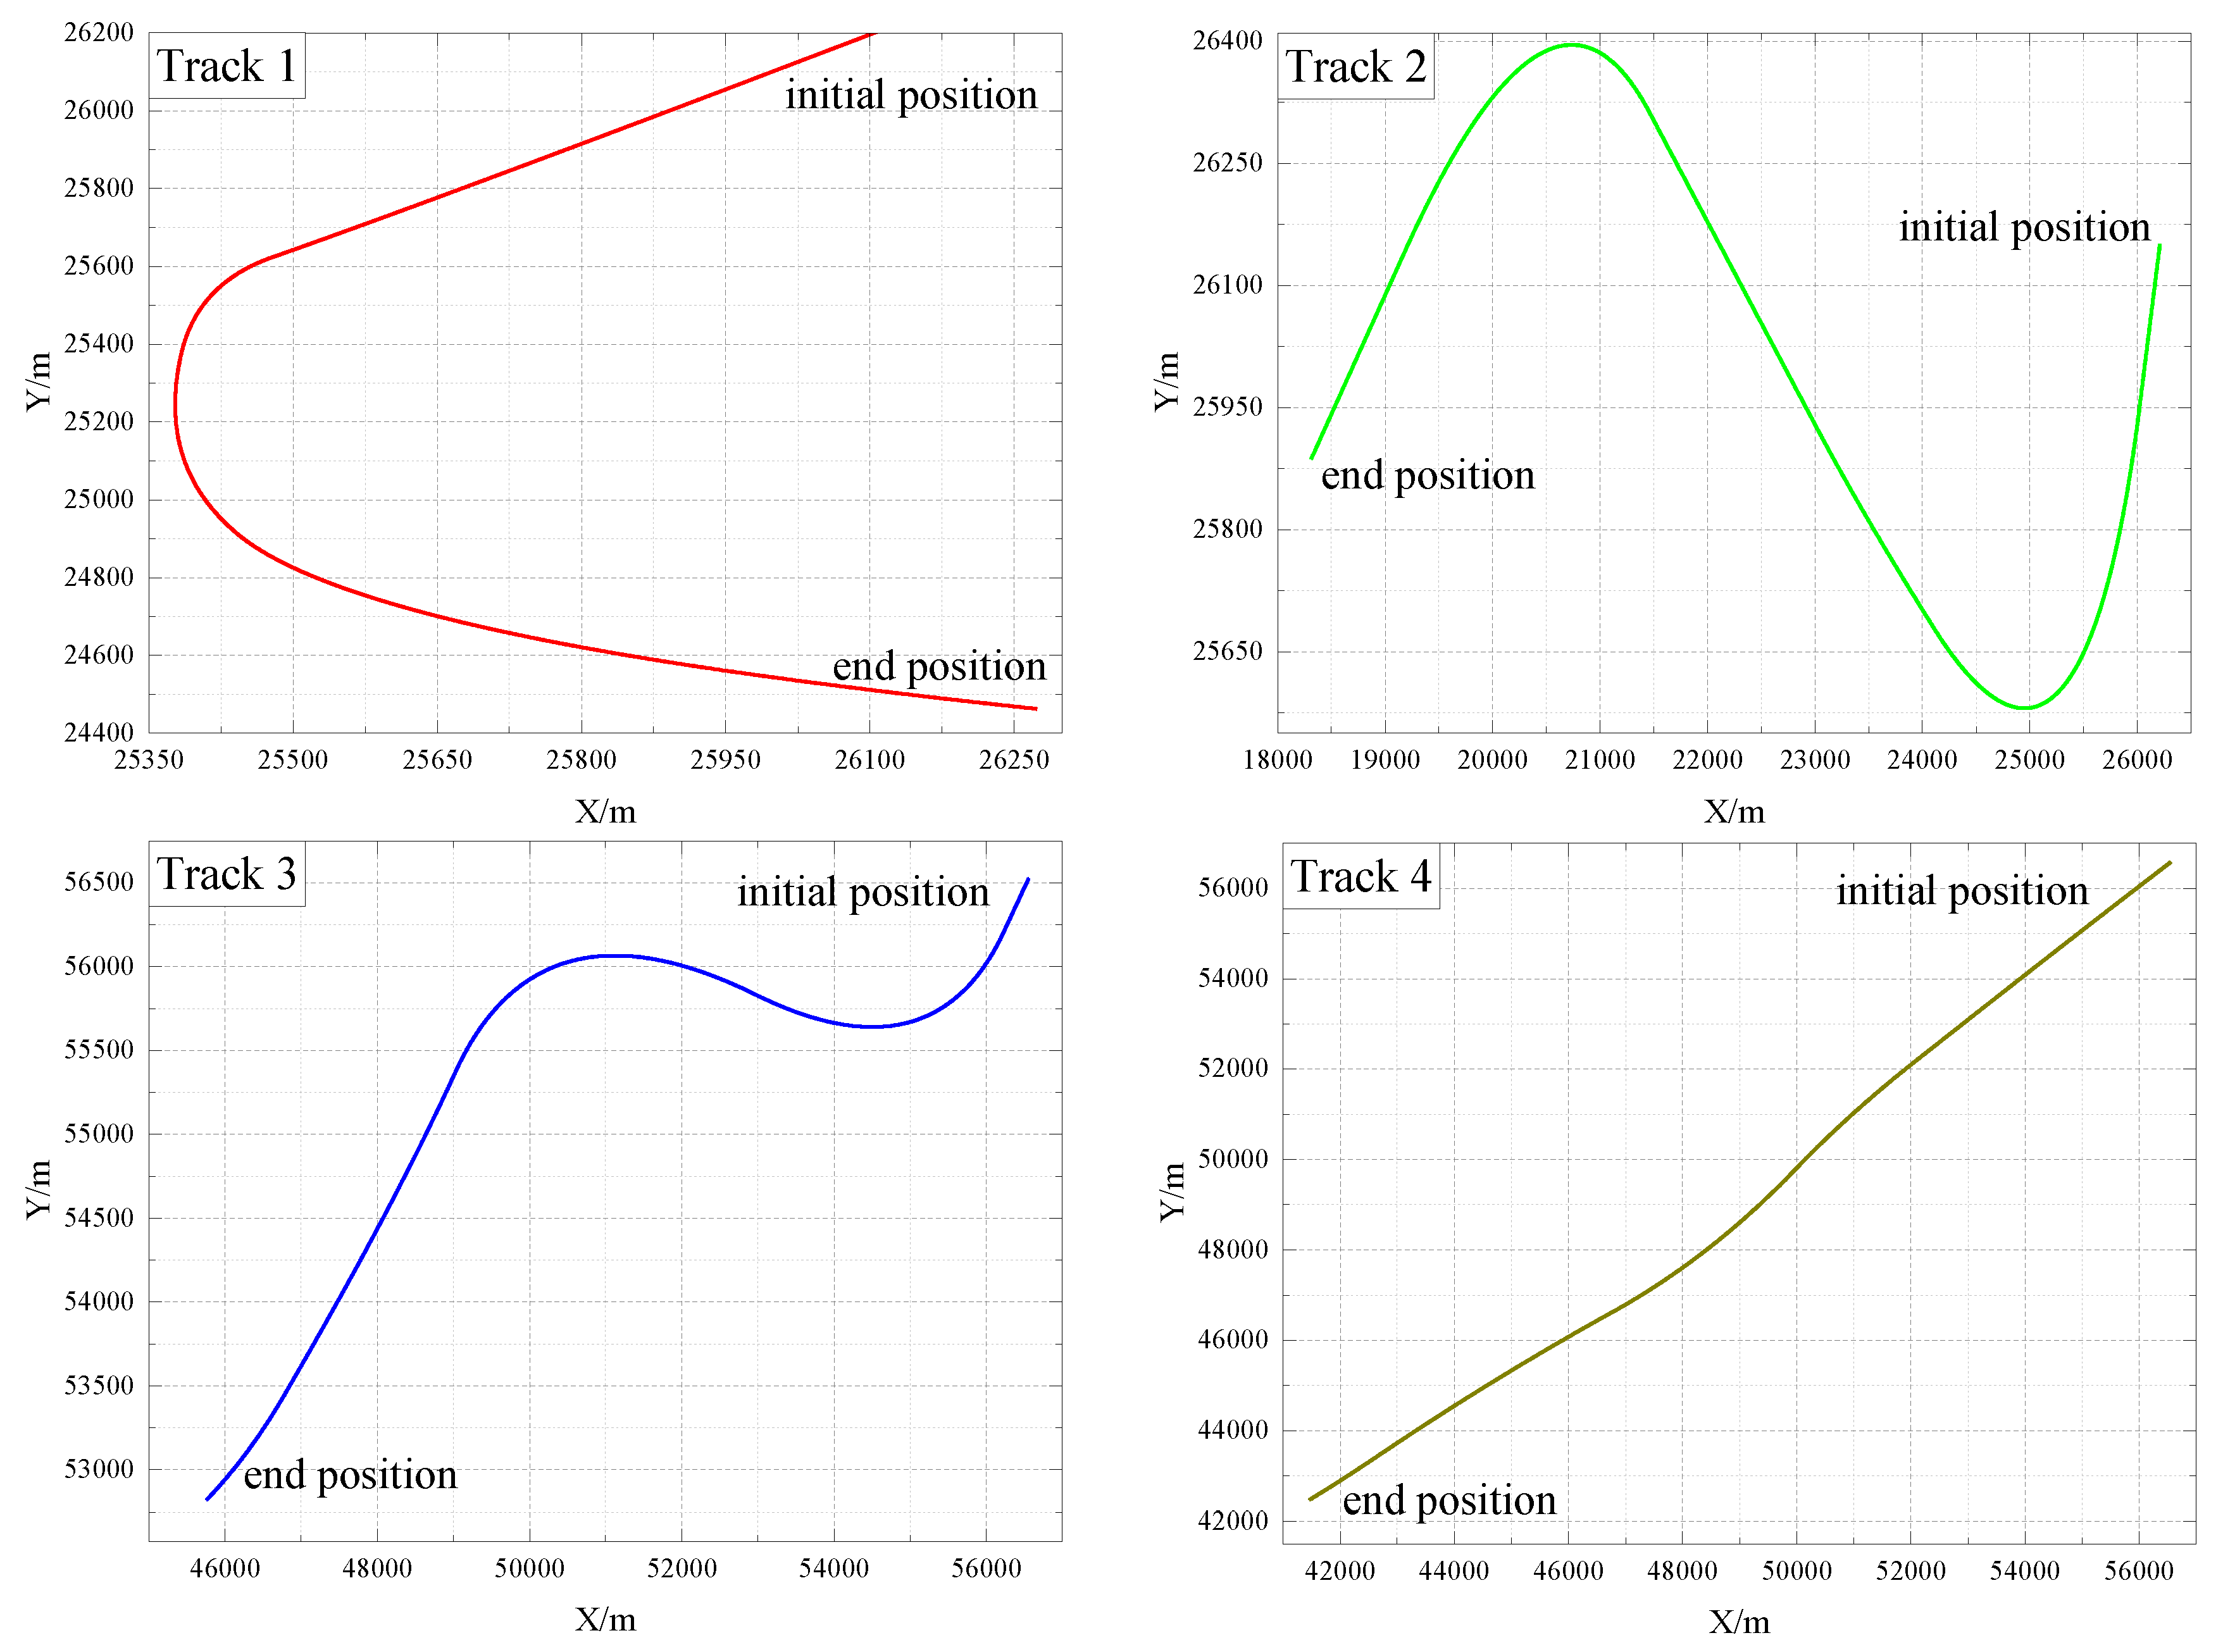
Figure 2.
Surface tracks.
Figure 2.
Surface tracks.
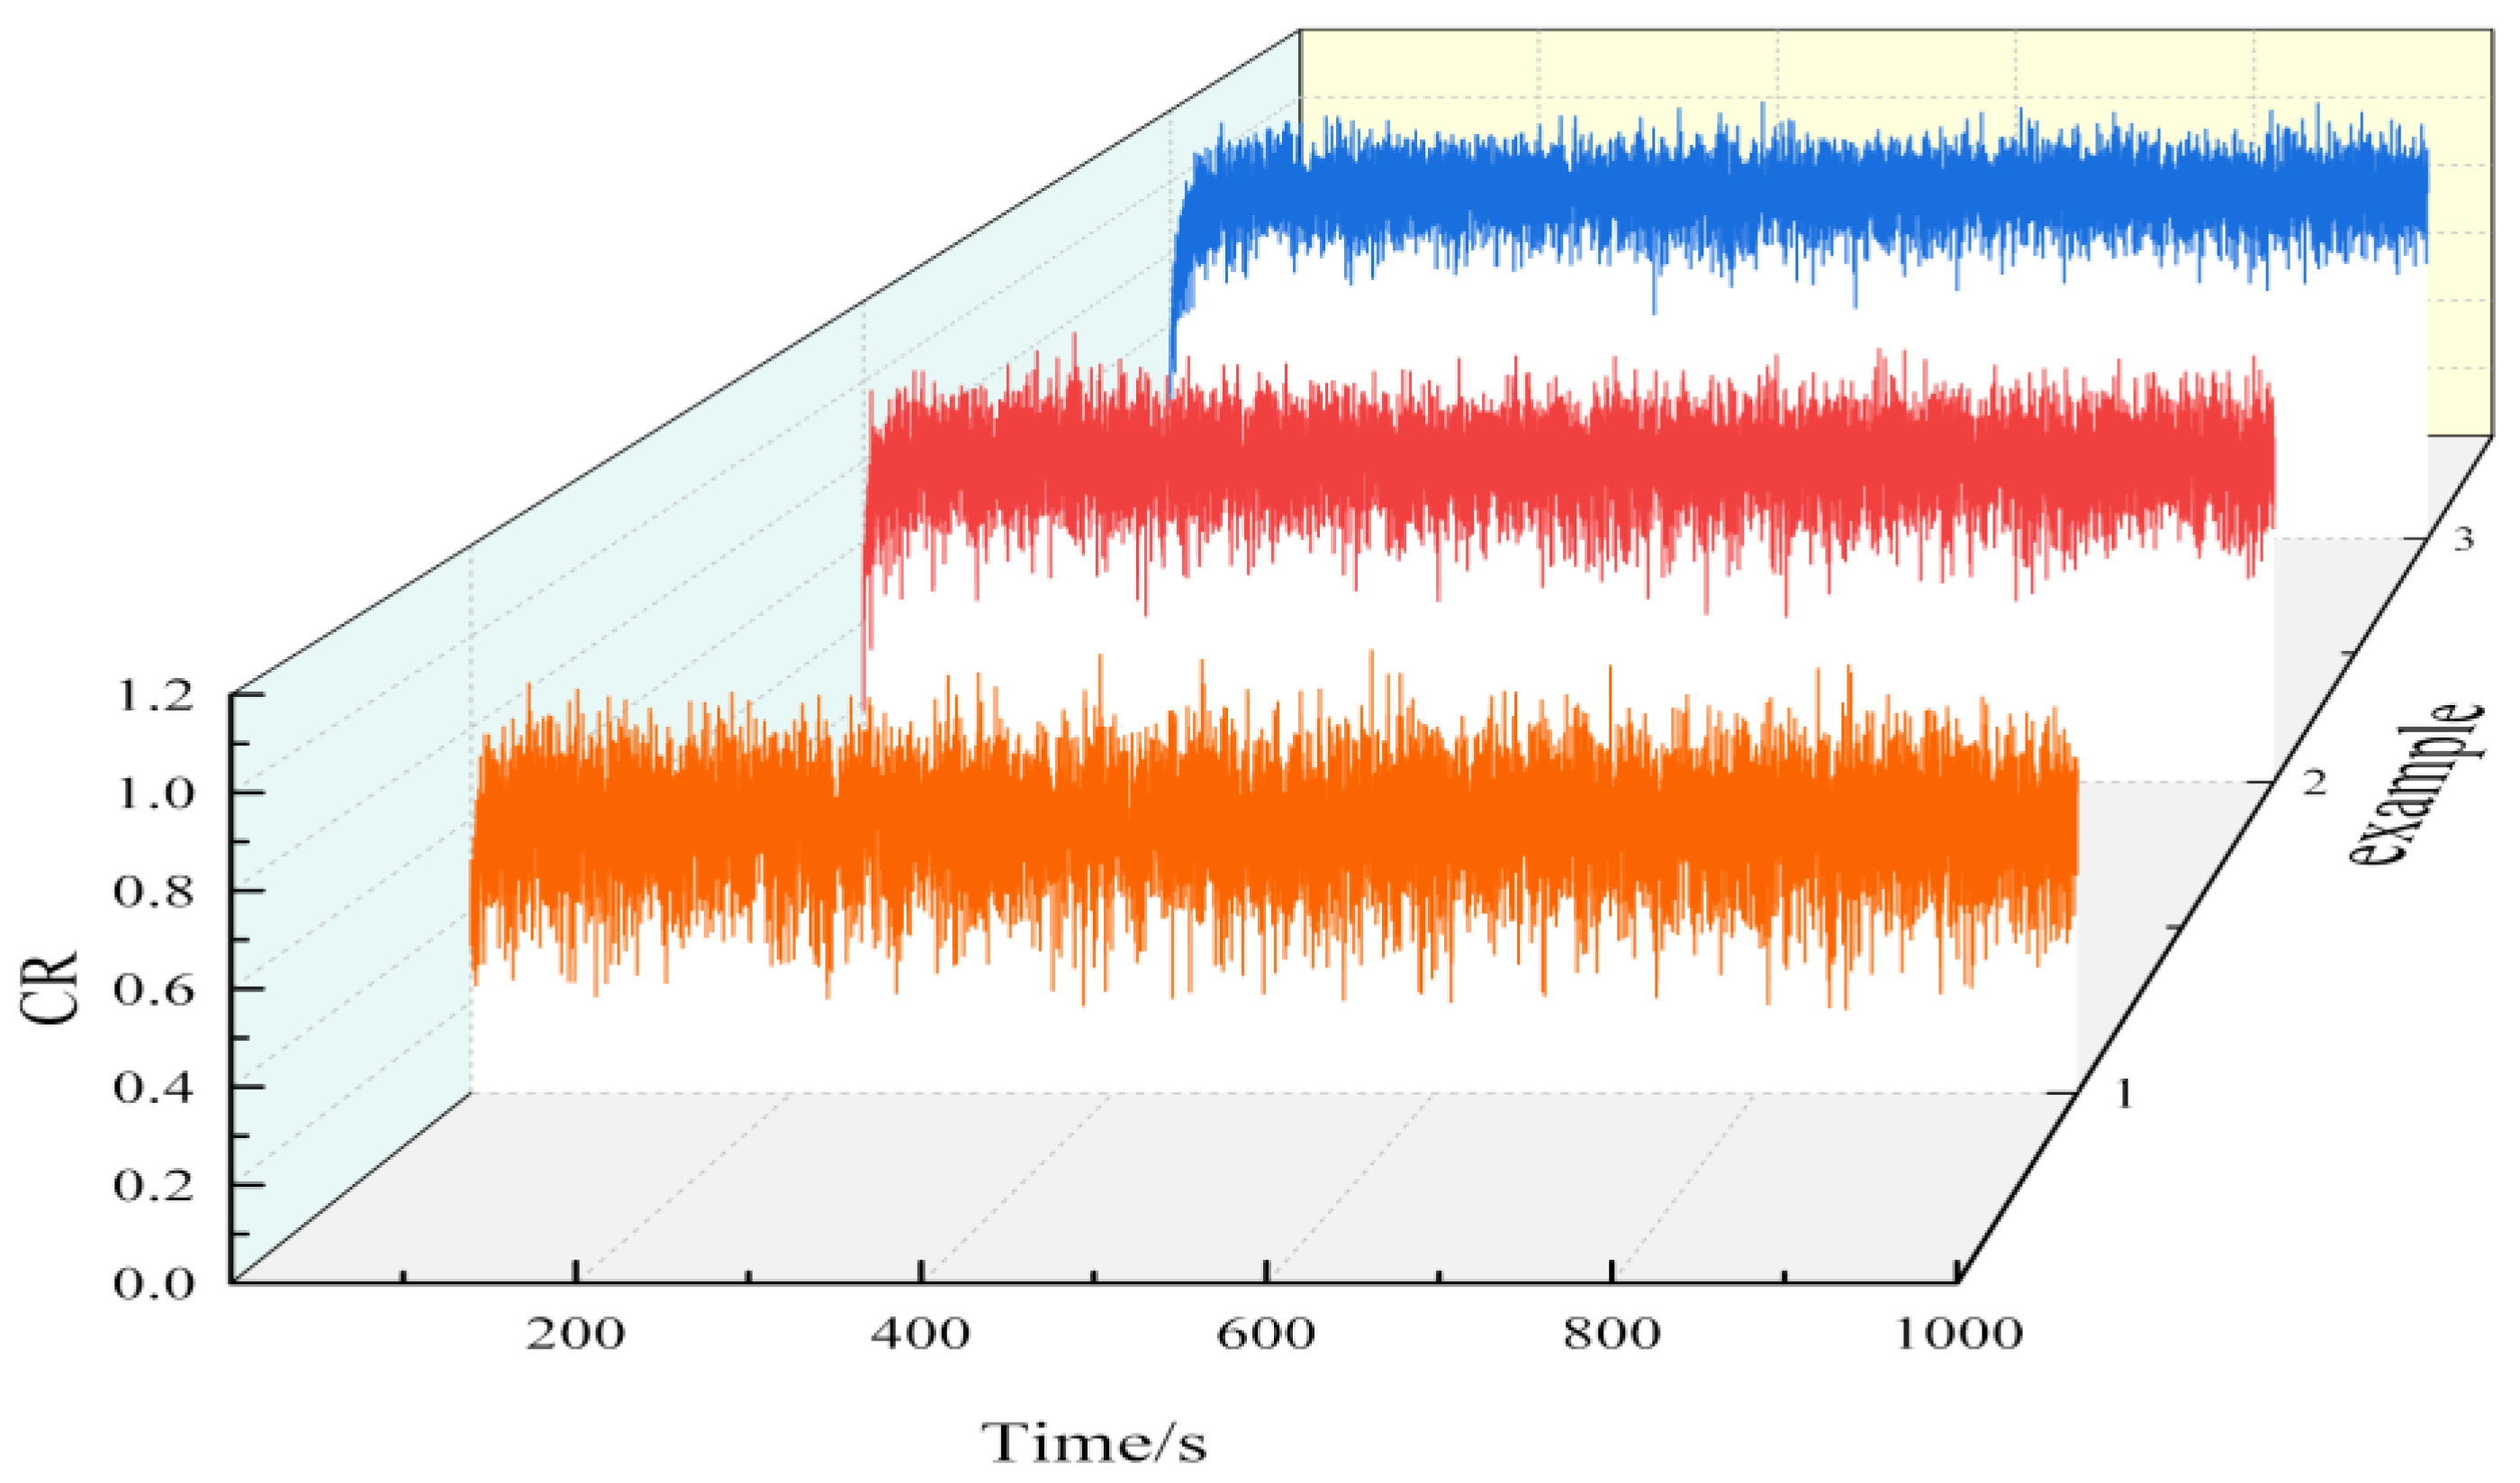
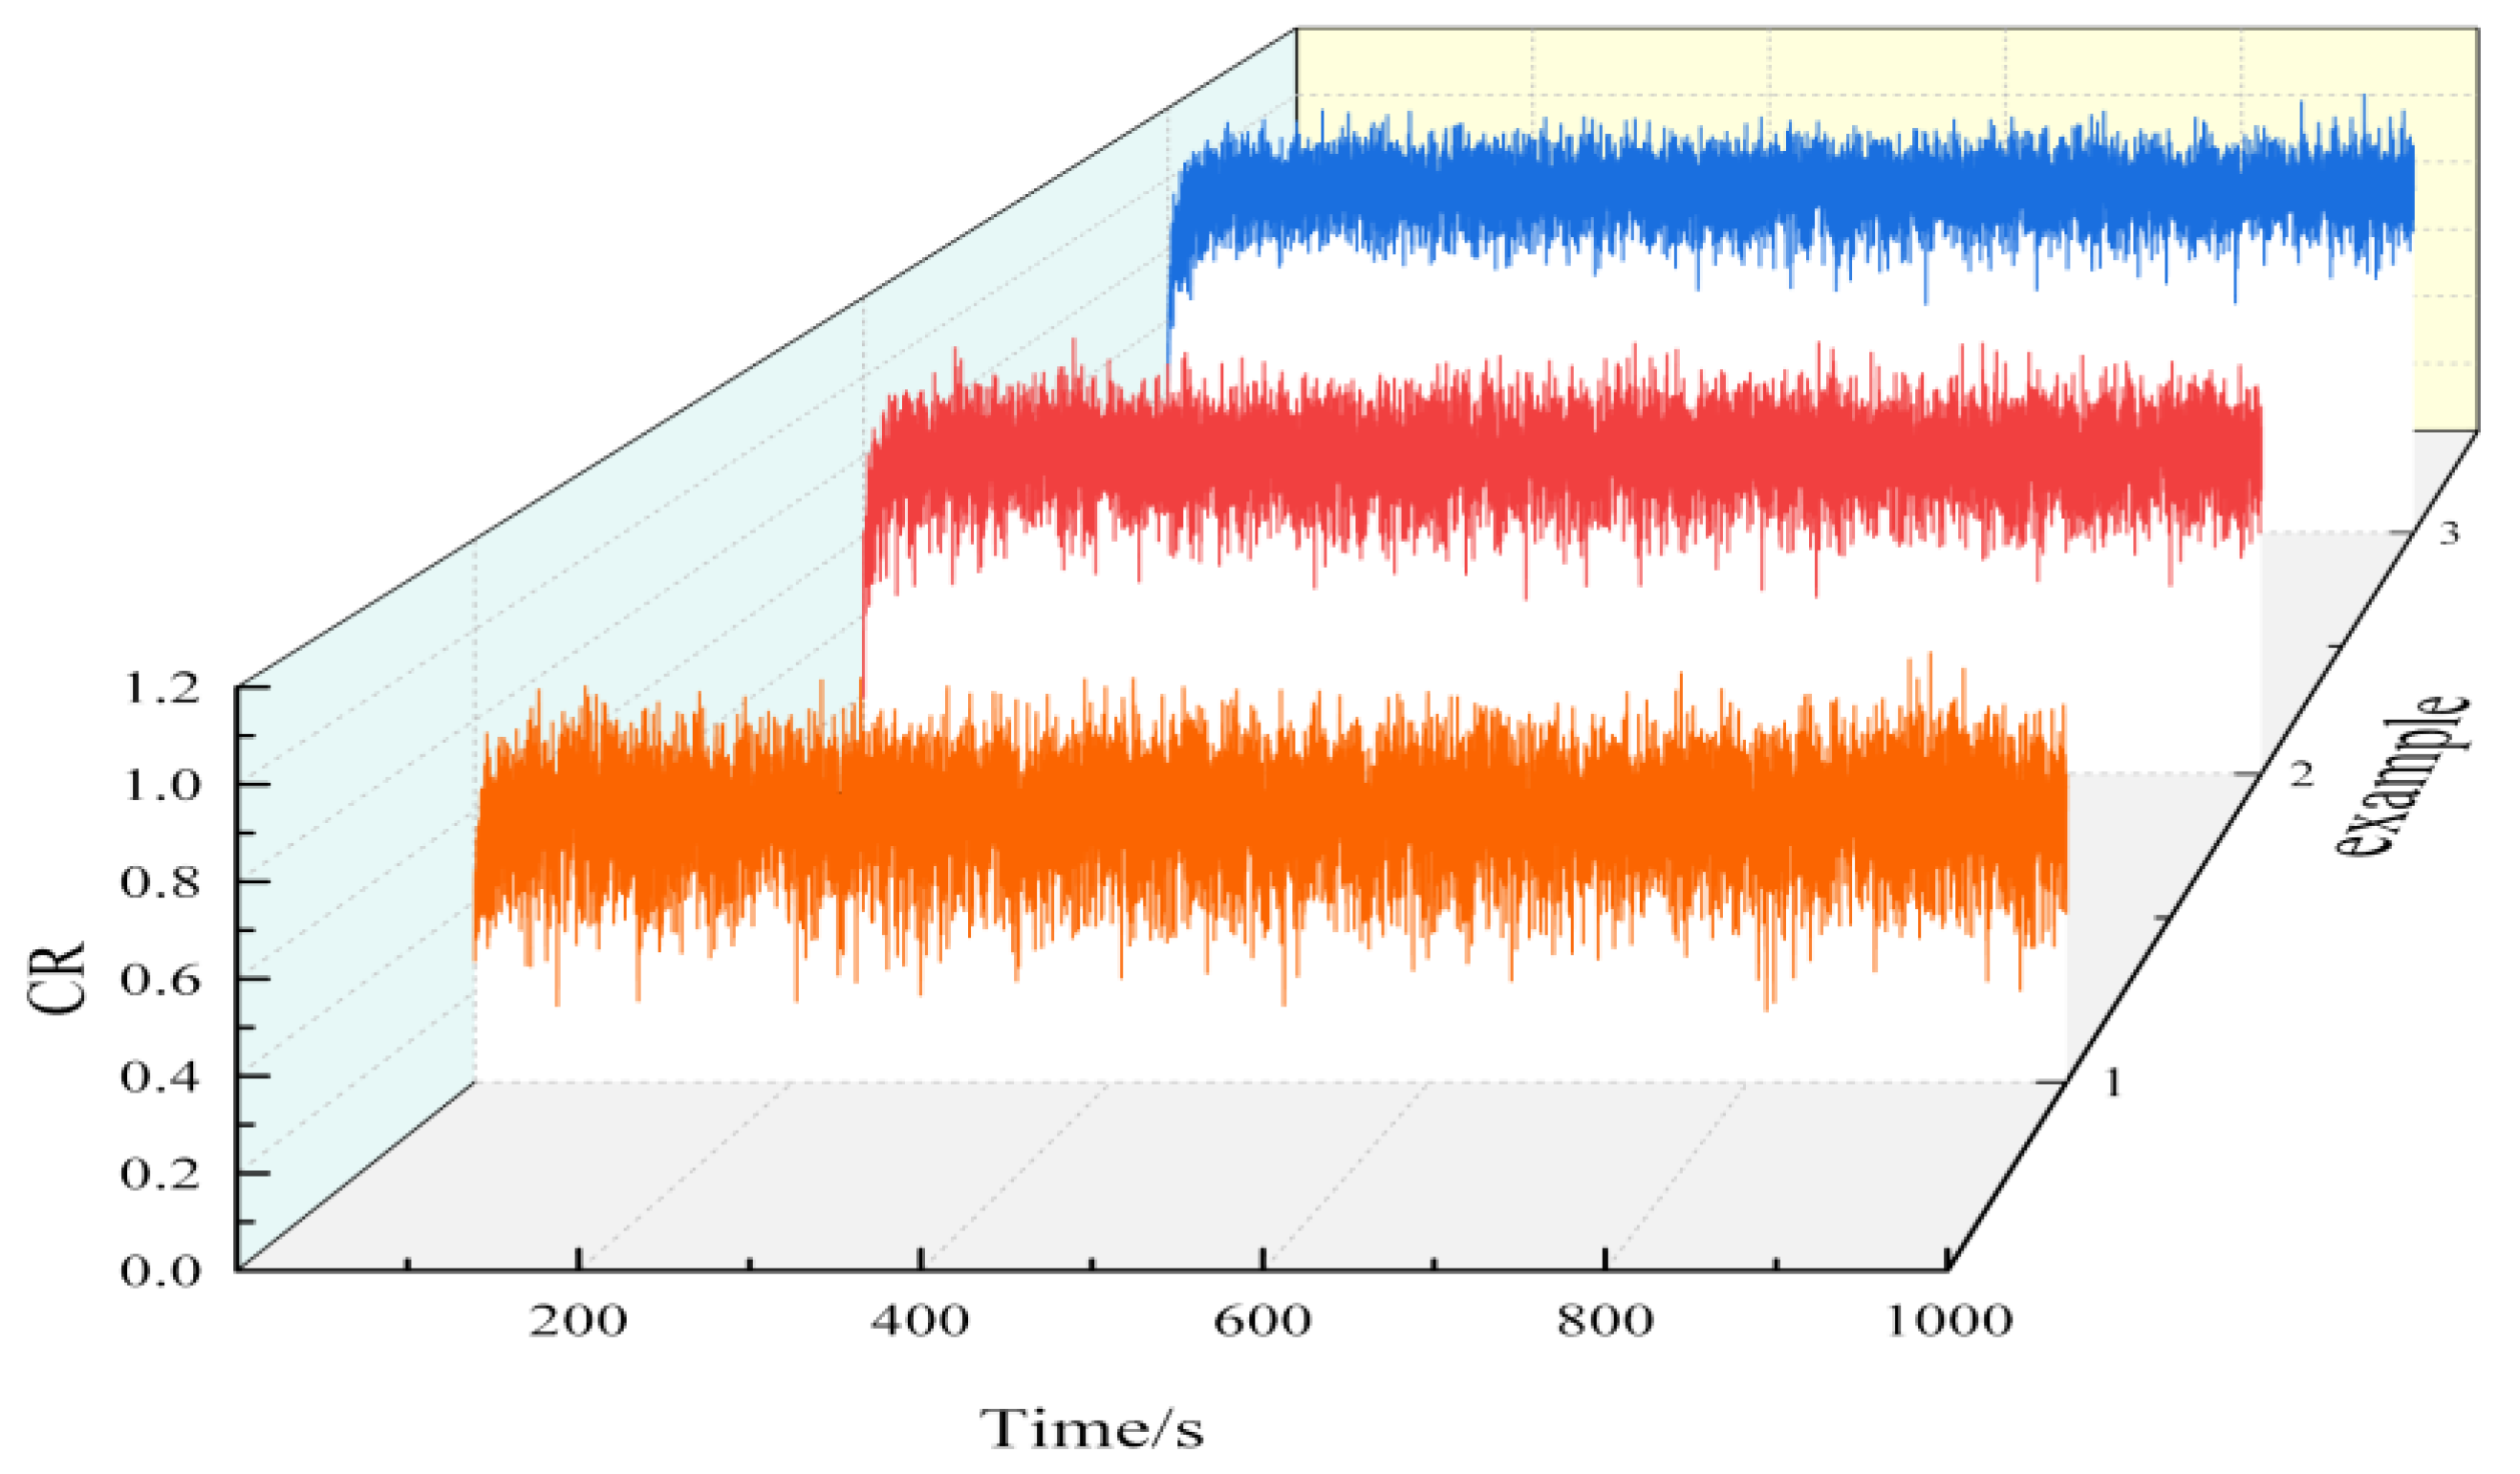
Figure 3.
Velocity distribution of 4 surface tracks.
Figure 3.
Velocity distribution of 4 surface tracks.
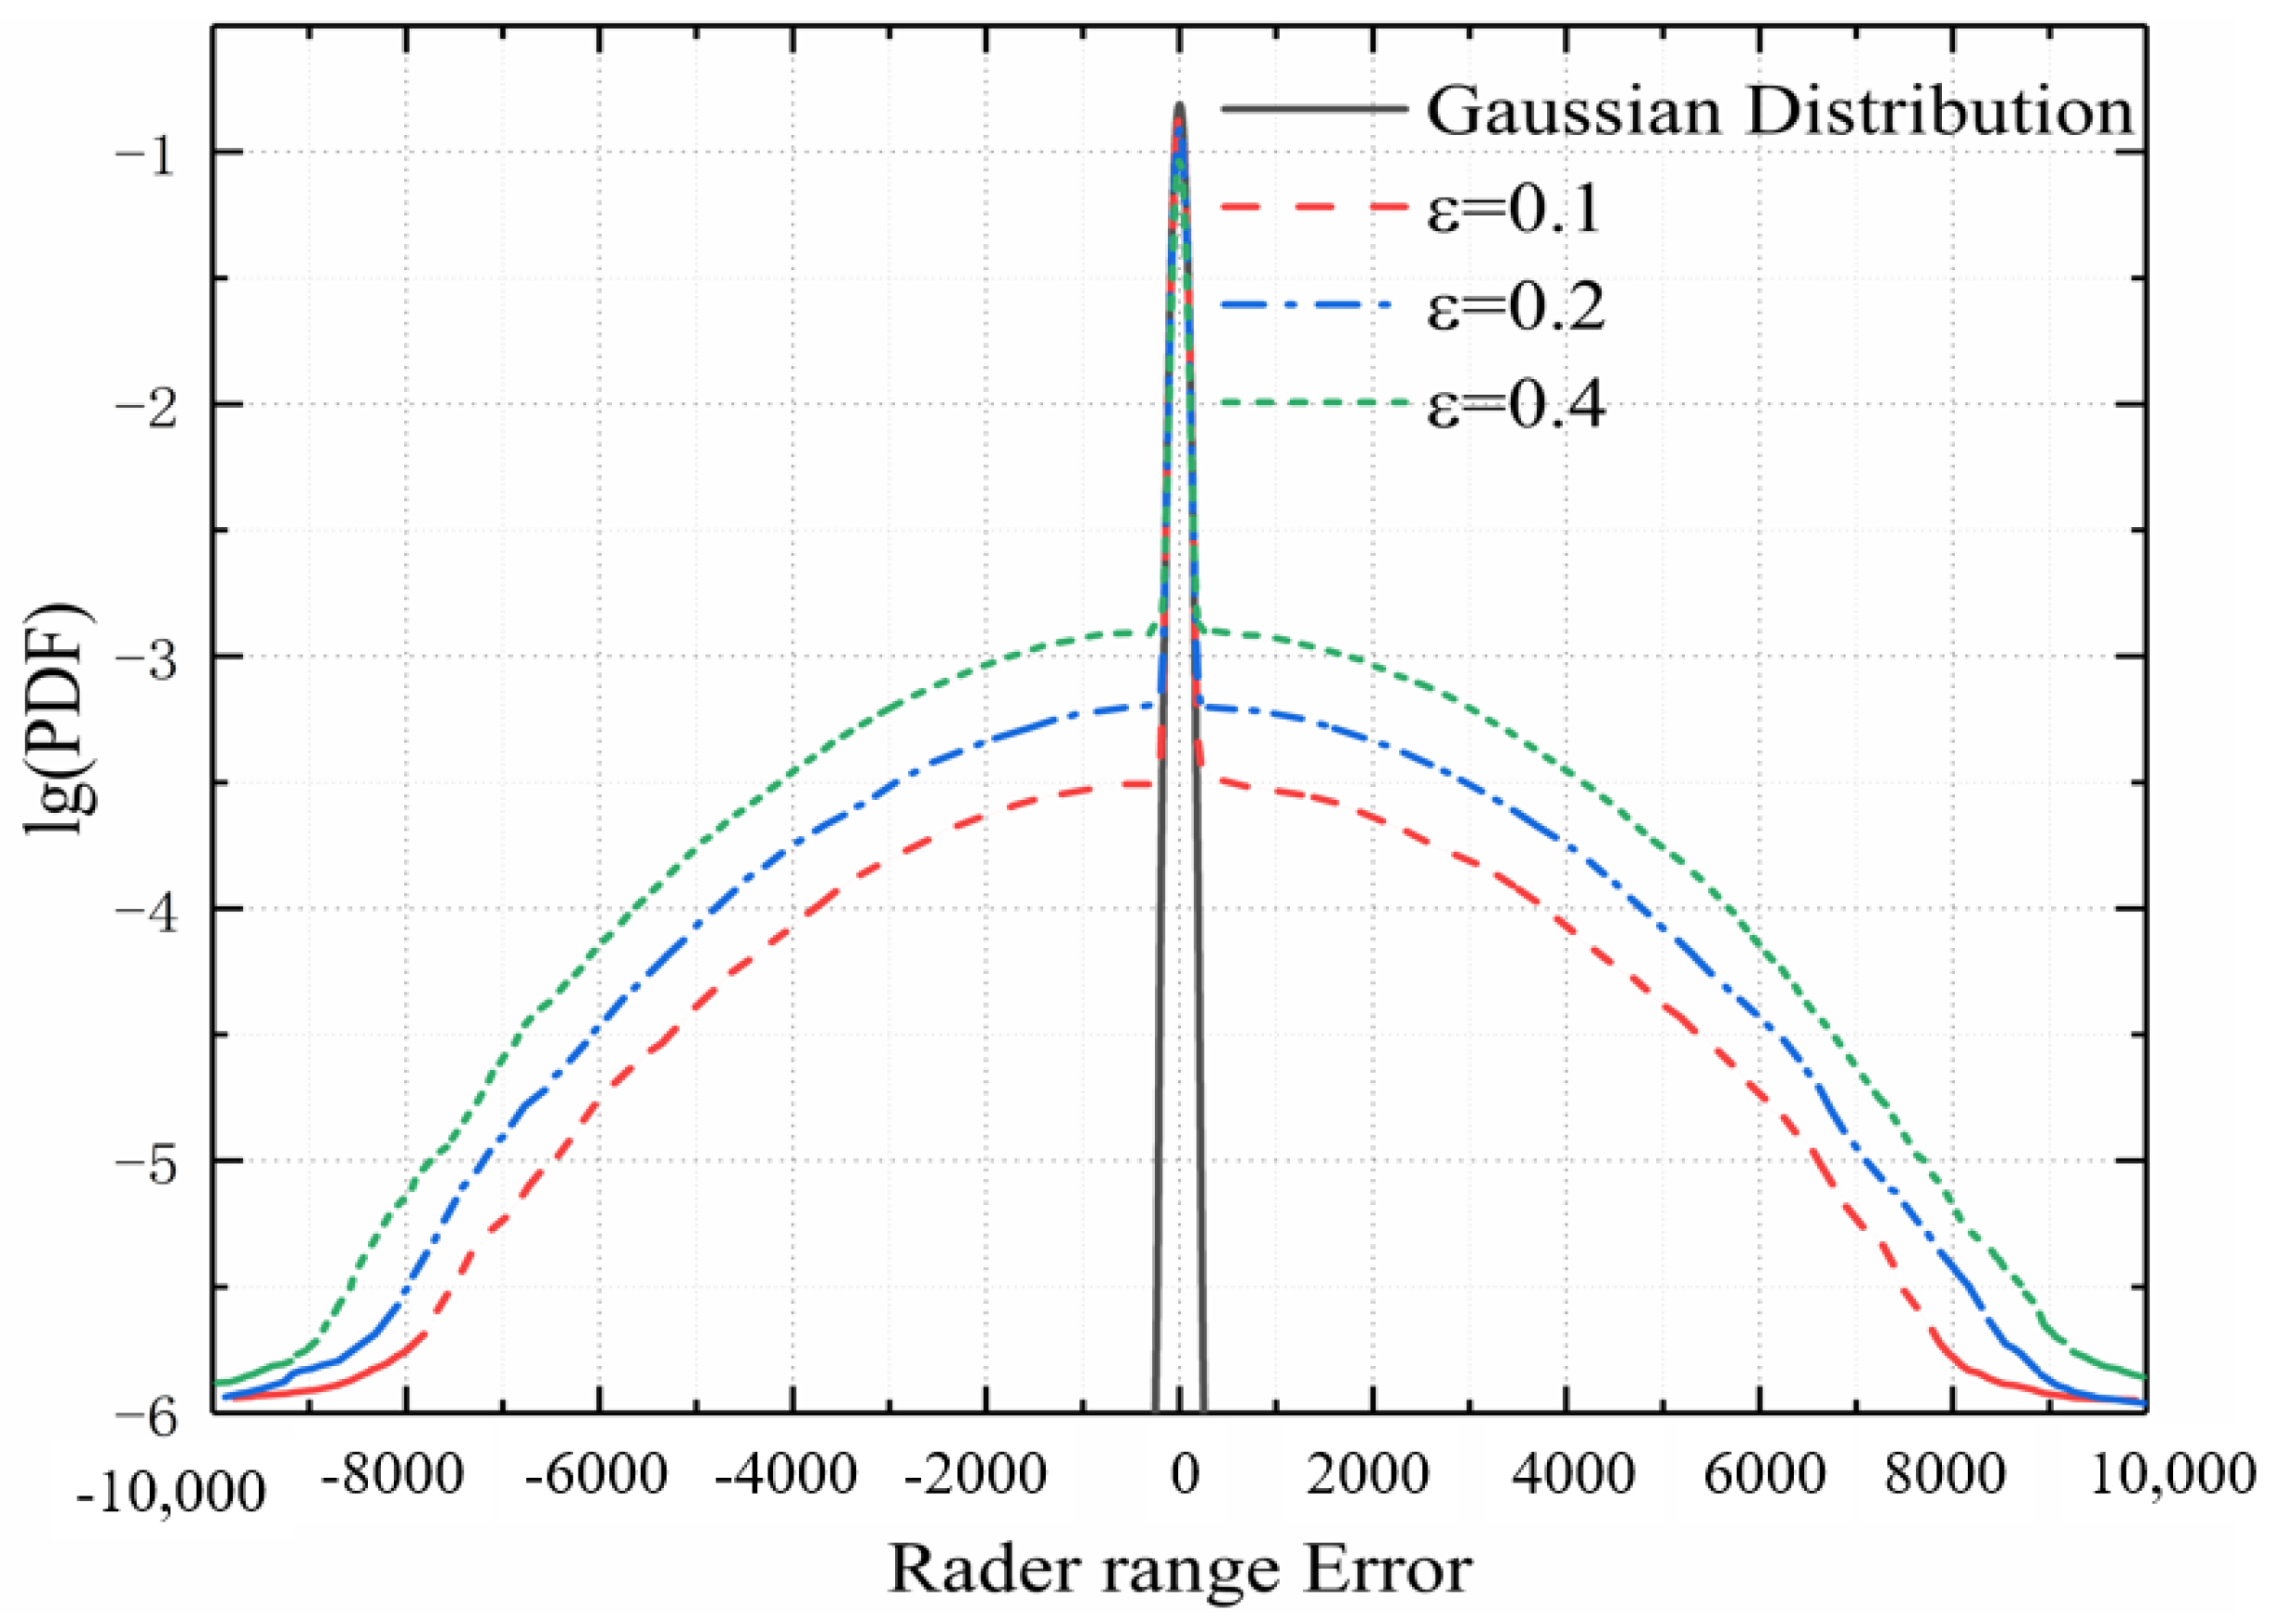
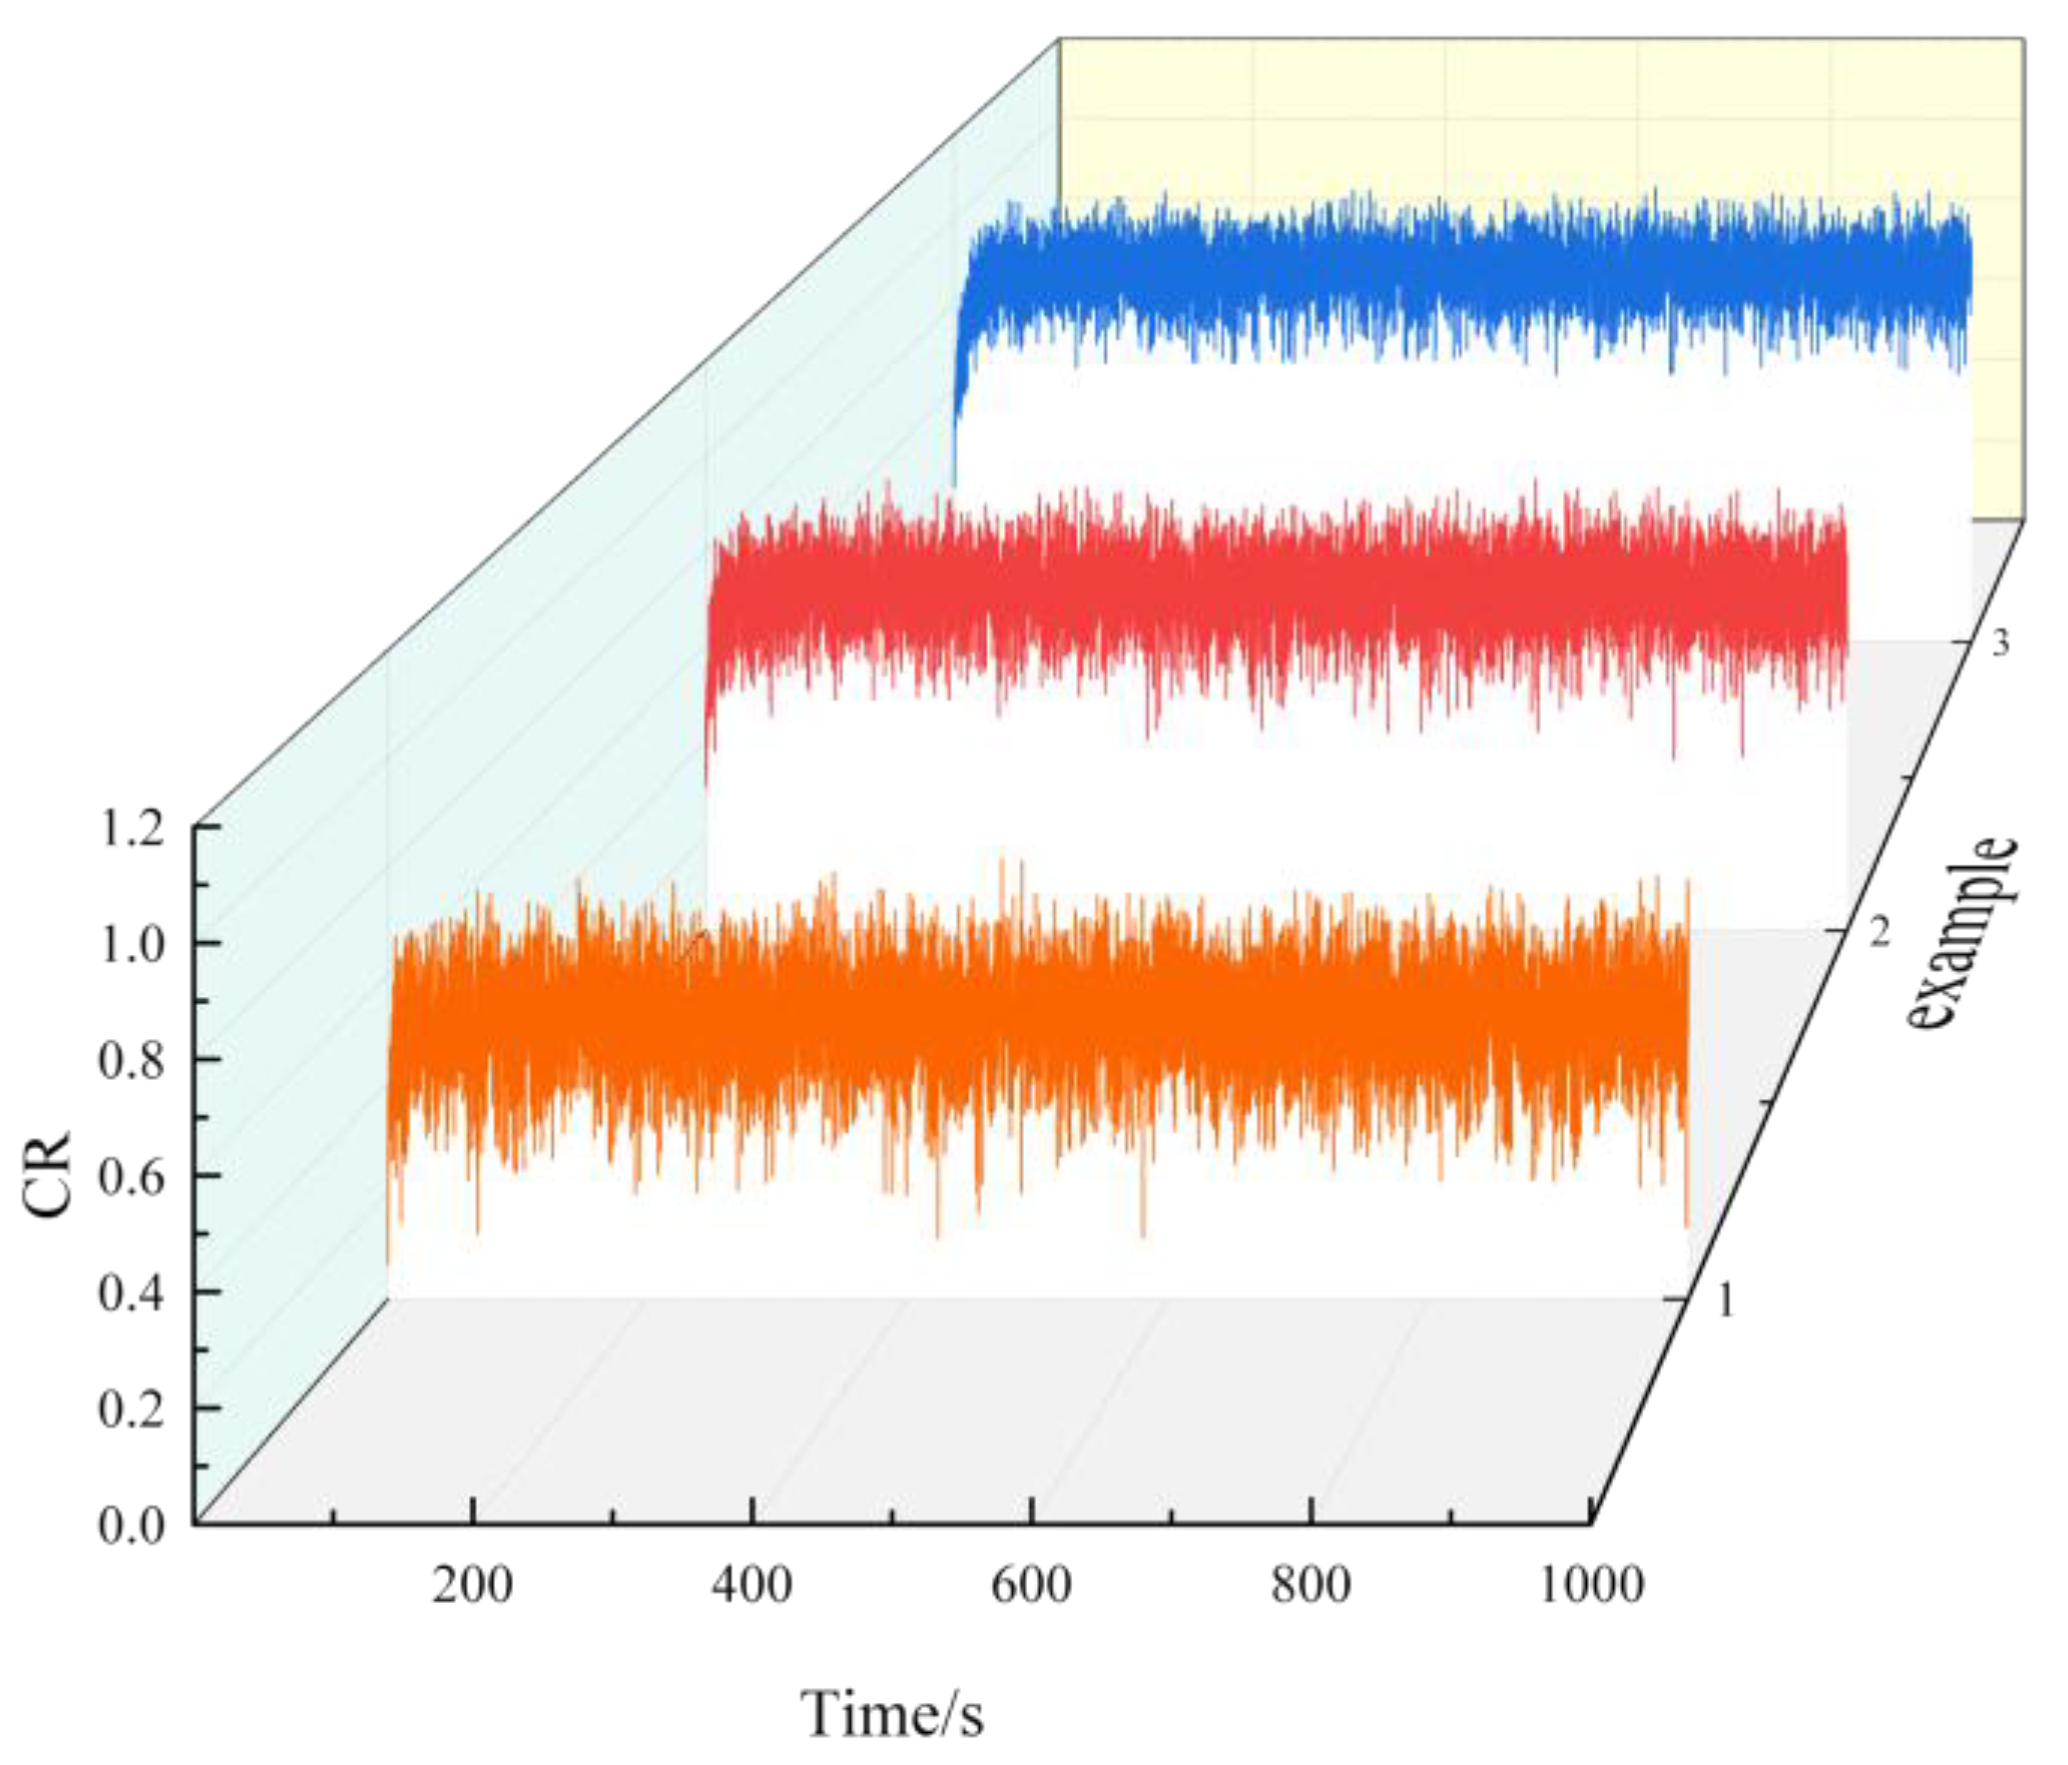
Figure 4.
The lg (PDF) of glint noise of Experiment A.
Figure 4.
The lg (PDF) of glint noise of Experiment A.
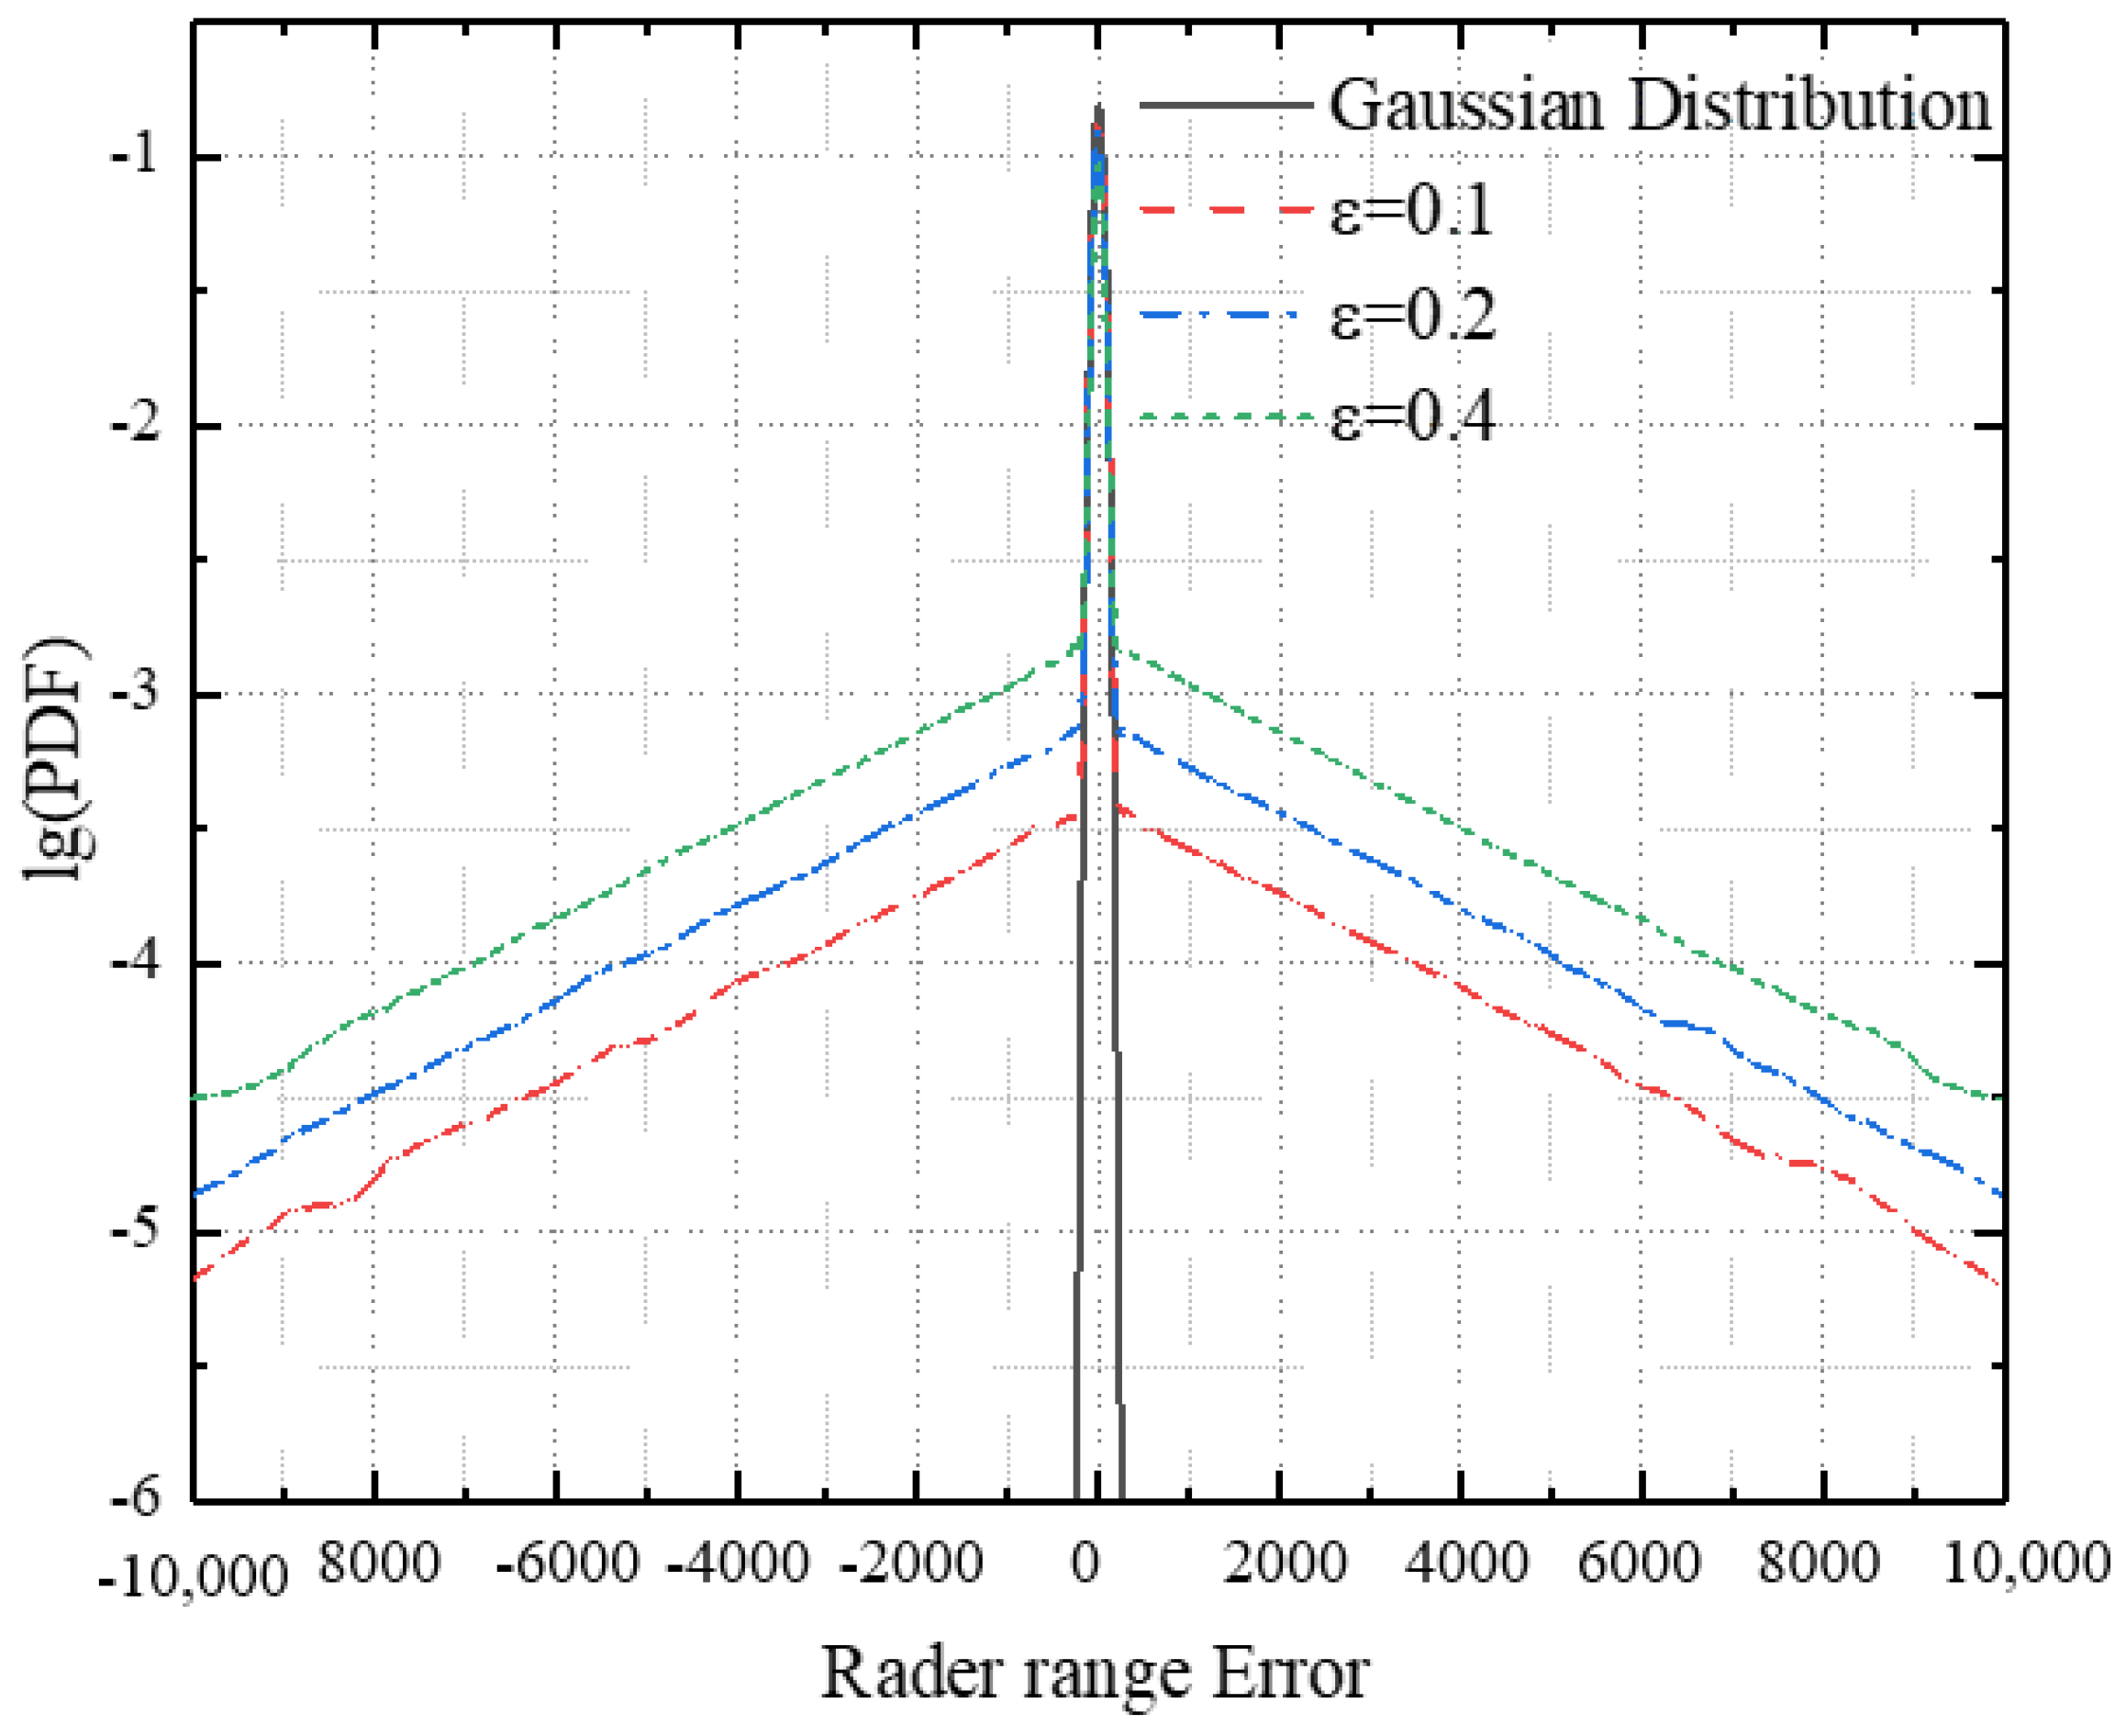
Figure 5.
The lg (PDF) of glint noise of Experiment B.
Figure 5.
The lg (PDF) of glint noise of Experiment B.
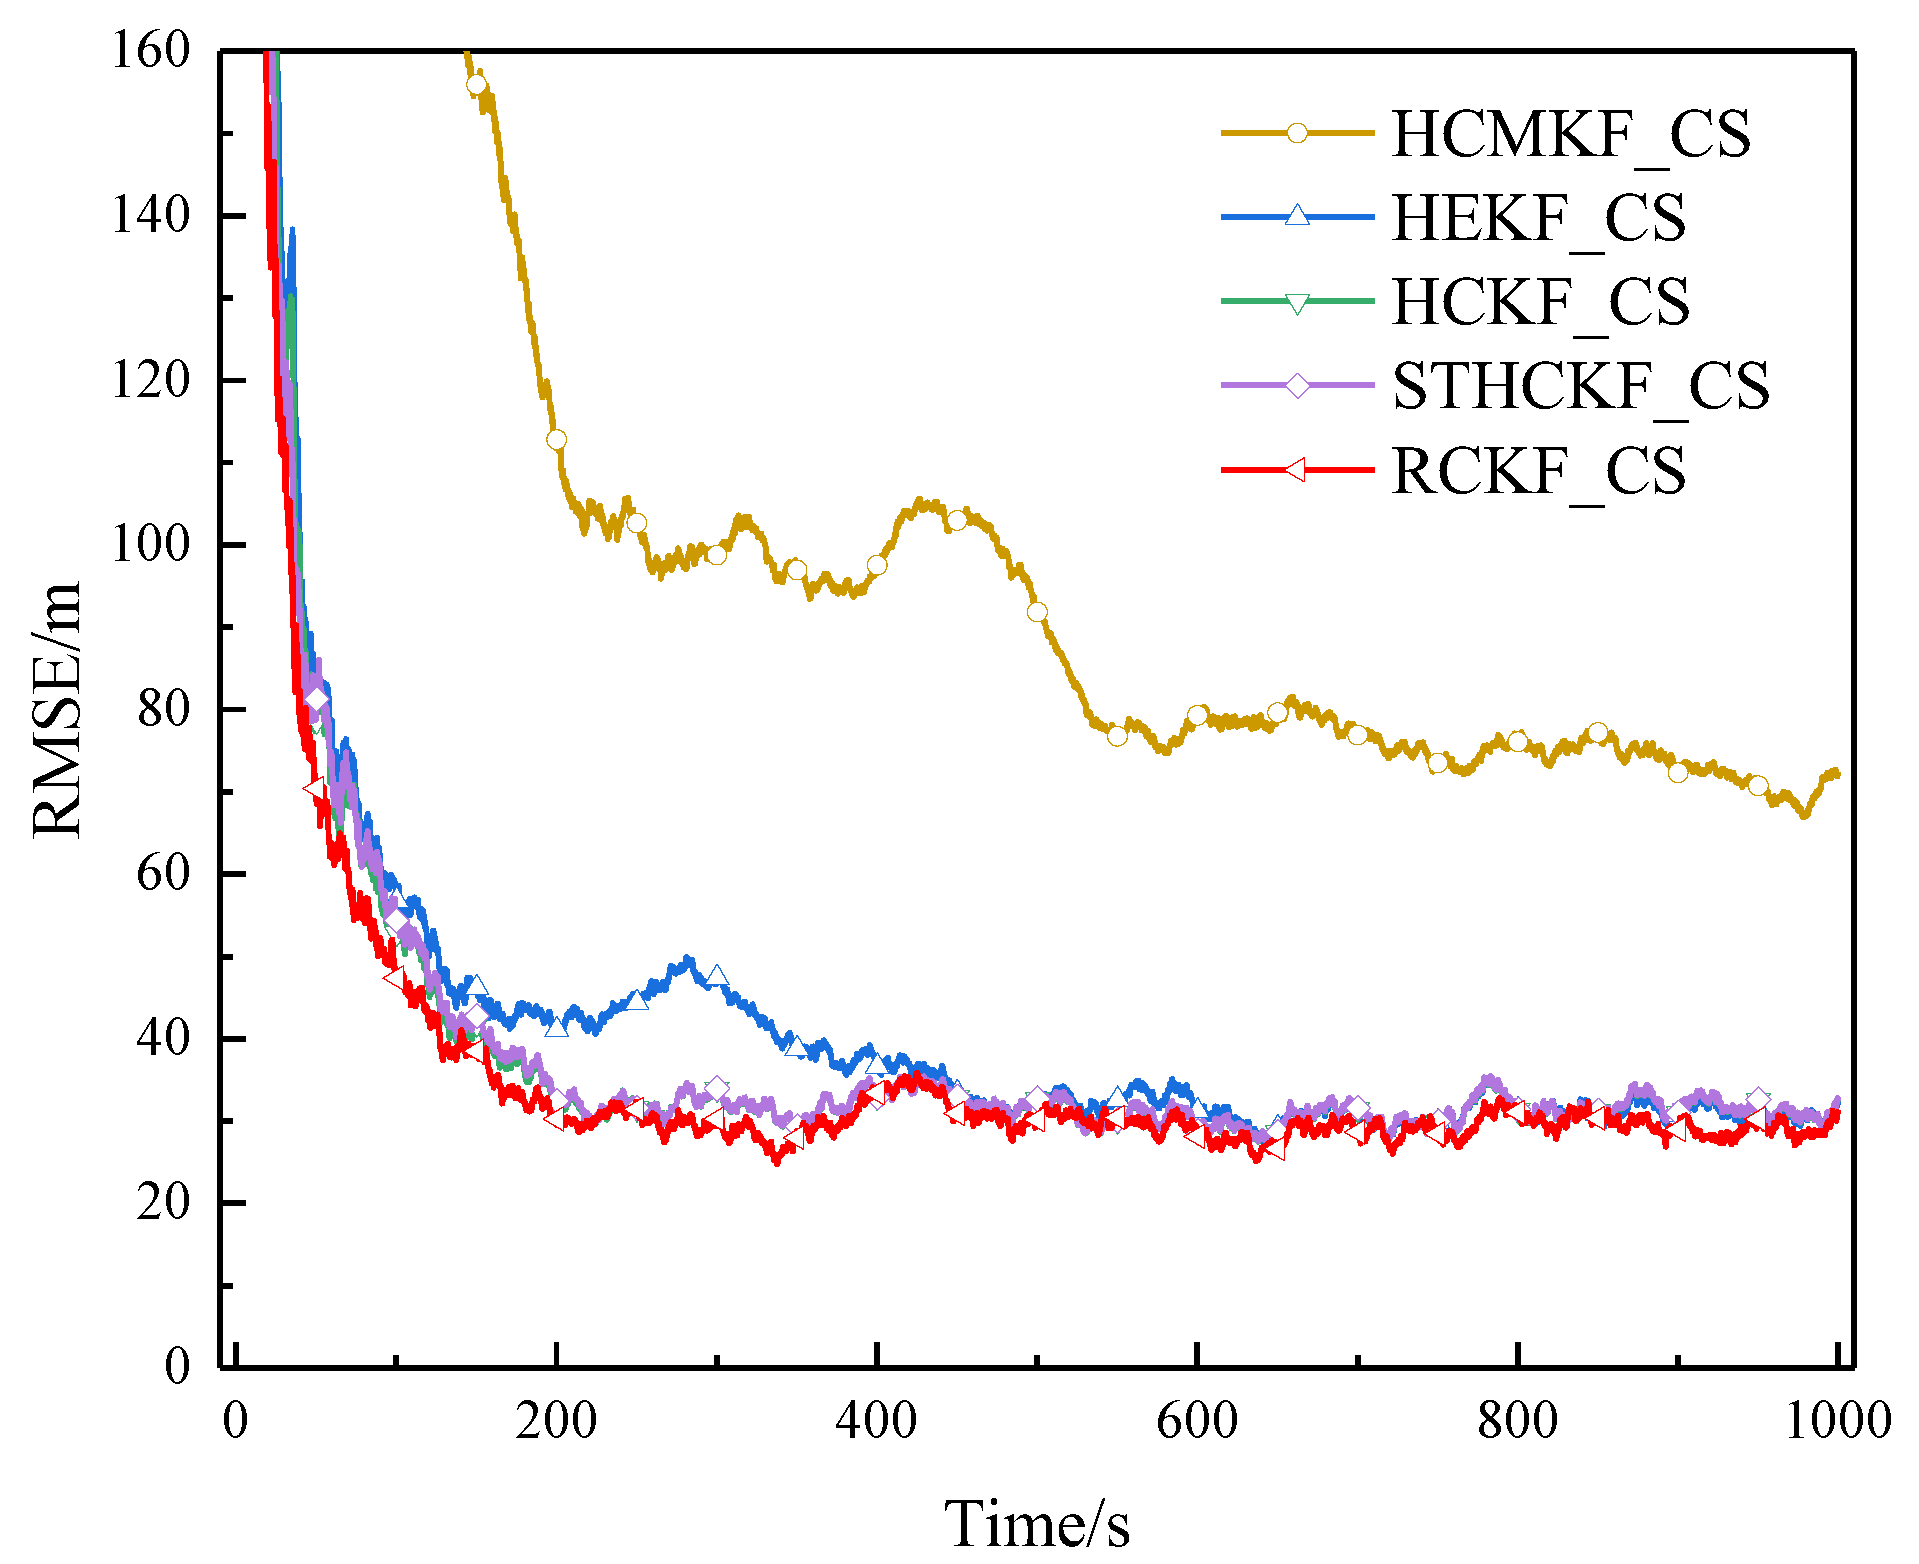
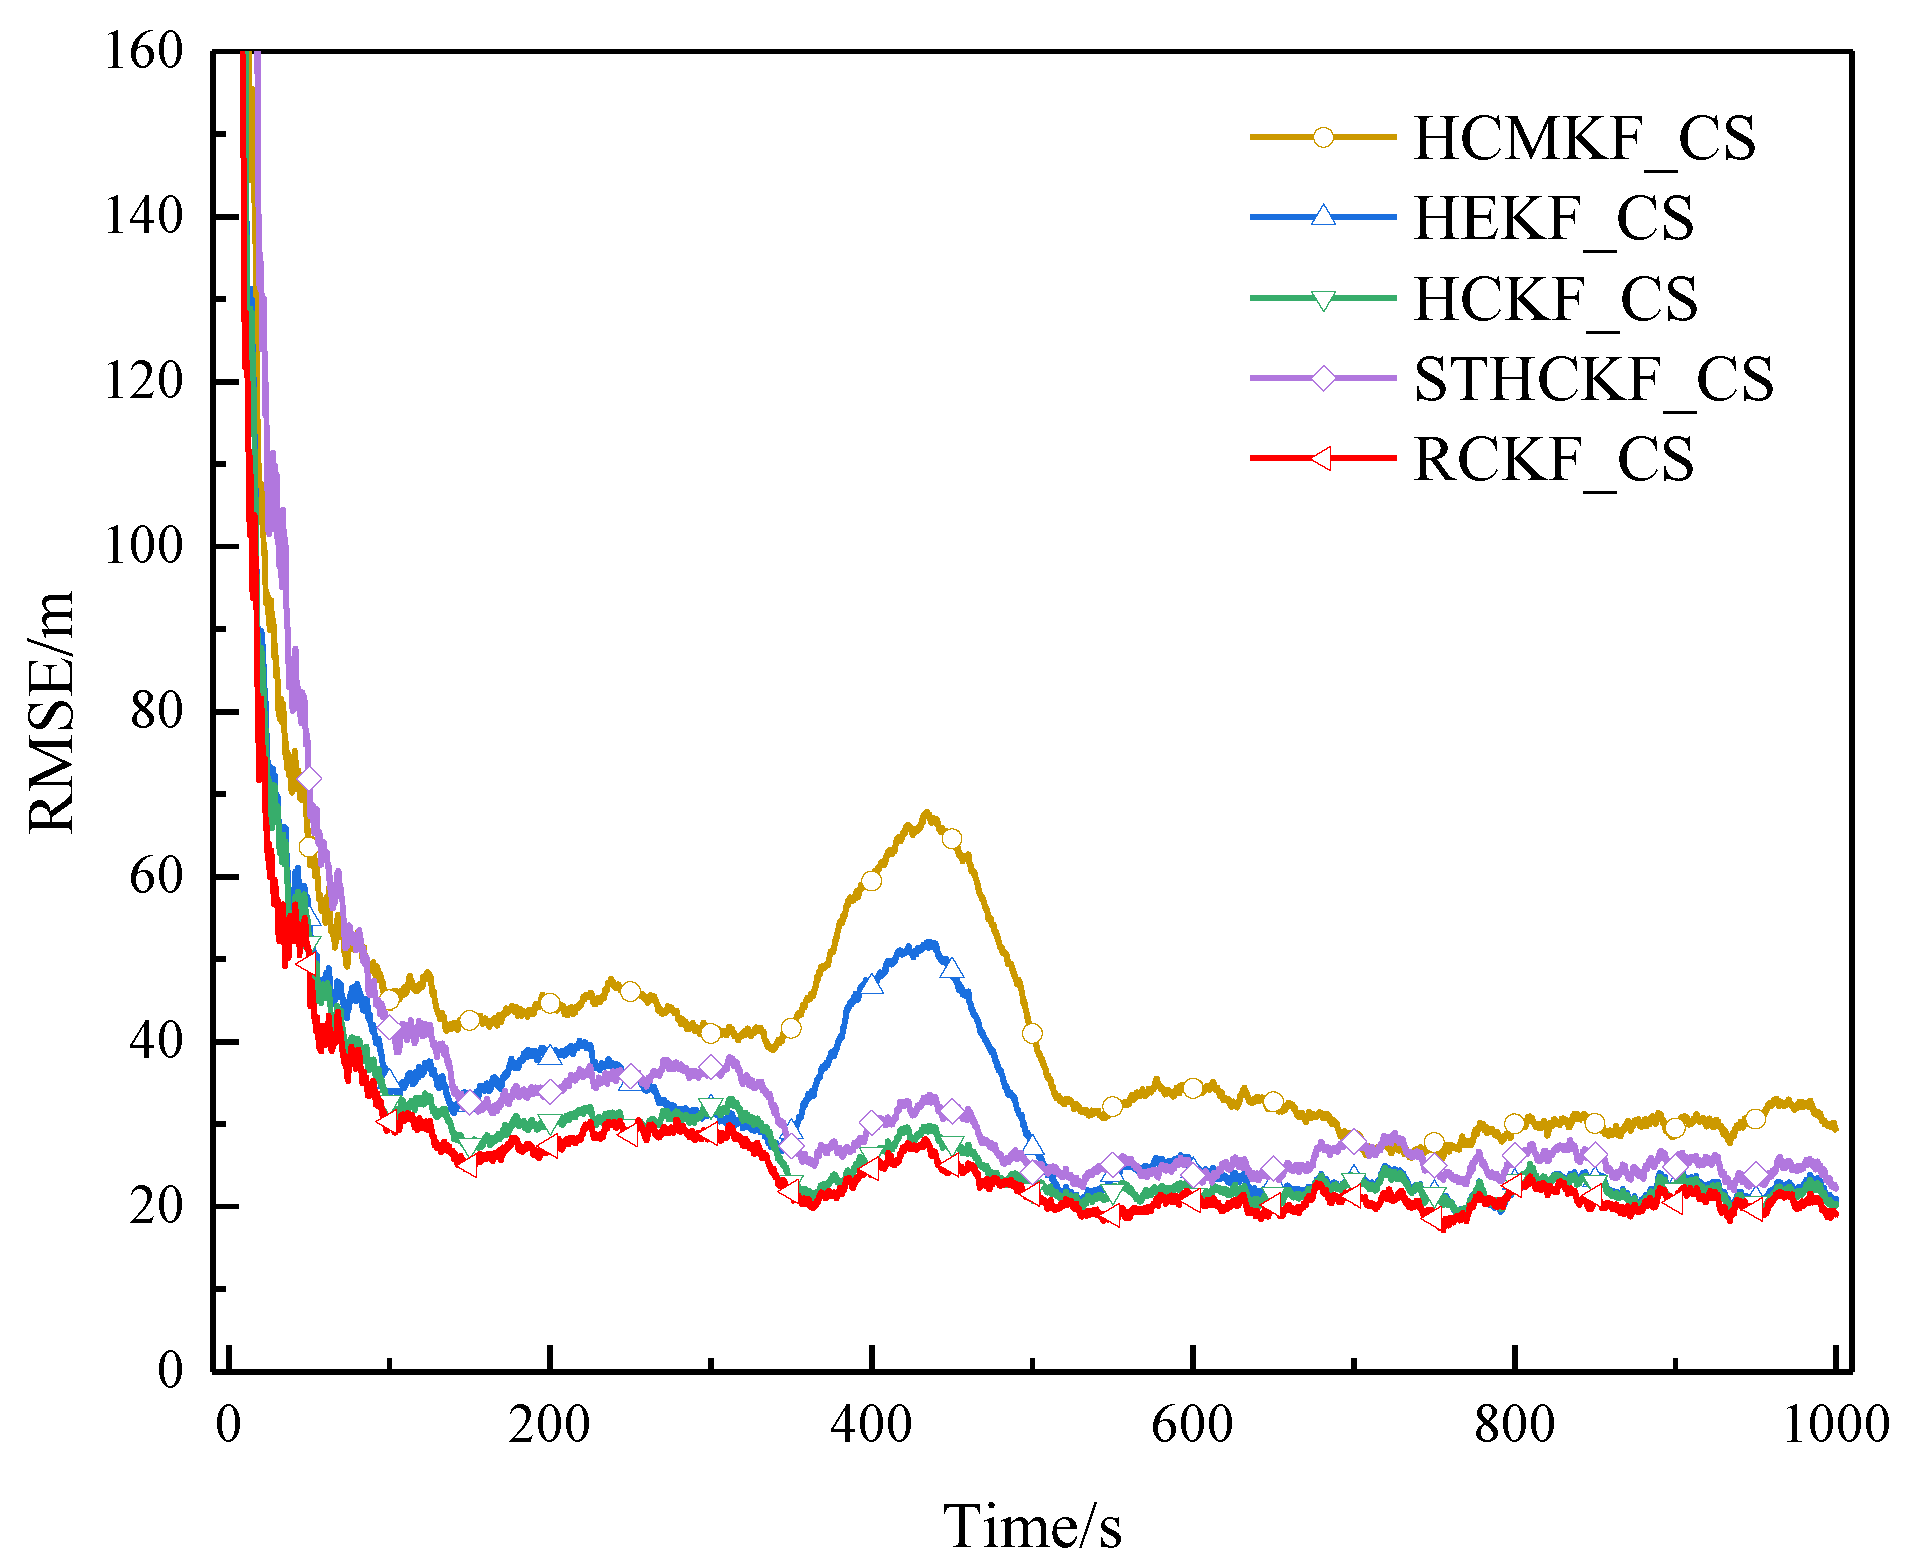
Figure 6.
RMSE of example 1 in surface track 1 (Experiment A).
Figure 6.
RMSE of example 1 in surface track 1 (Experiment A).
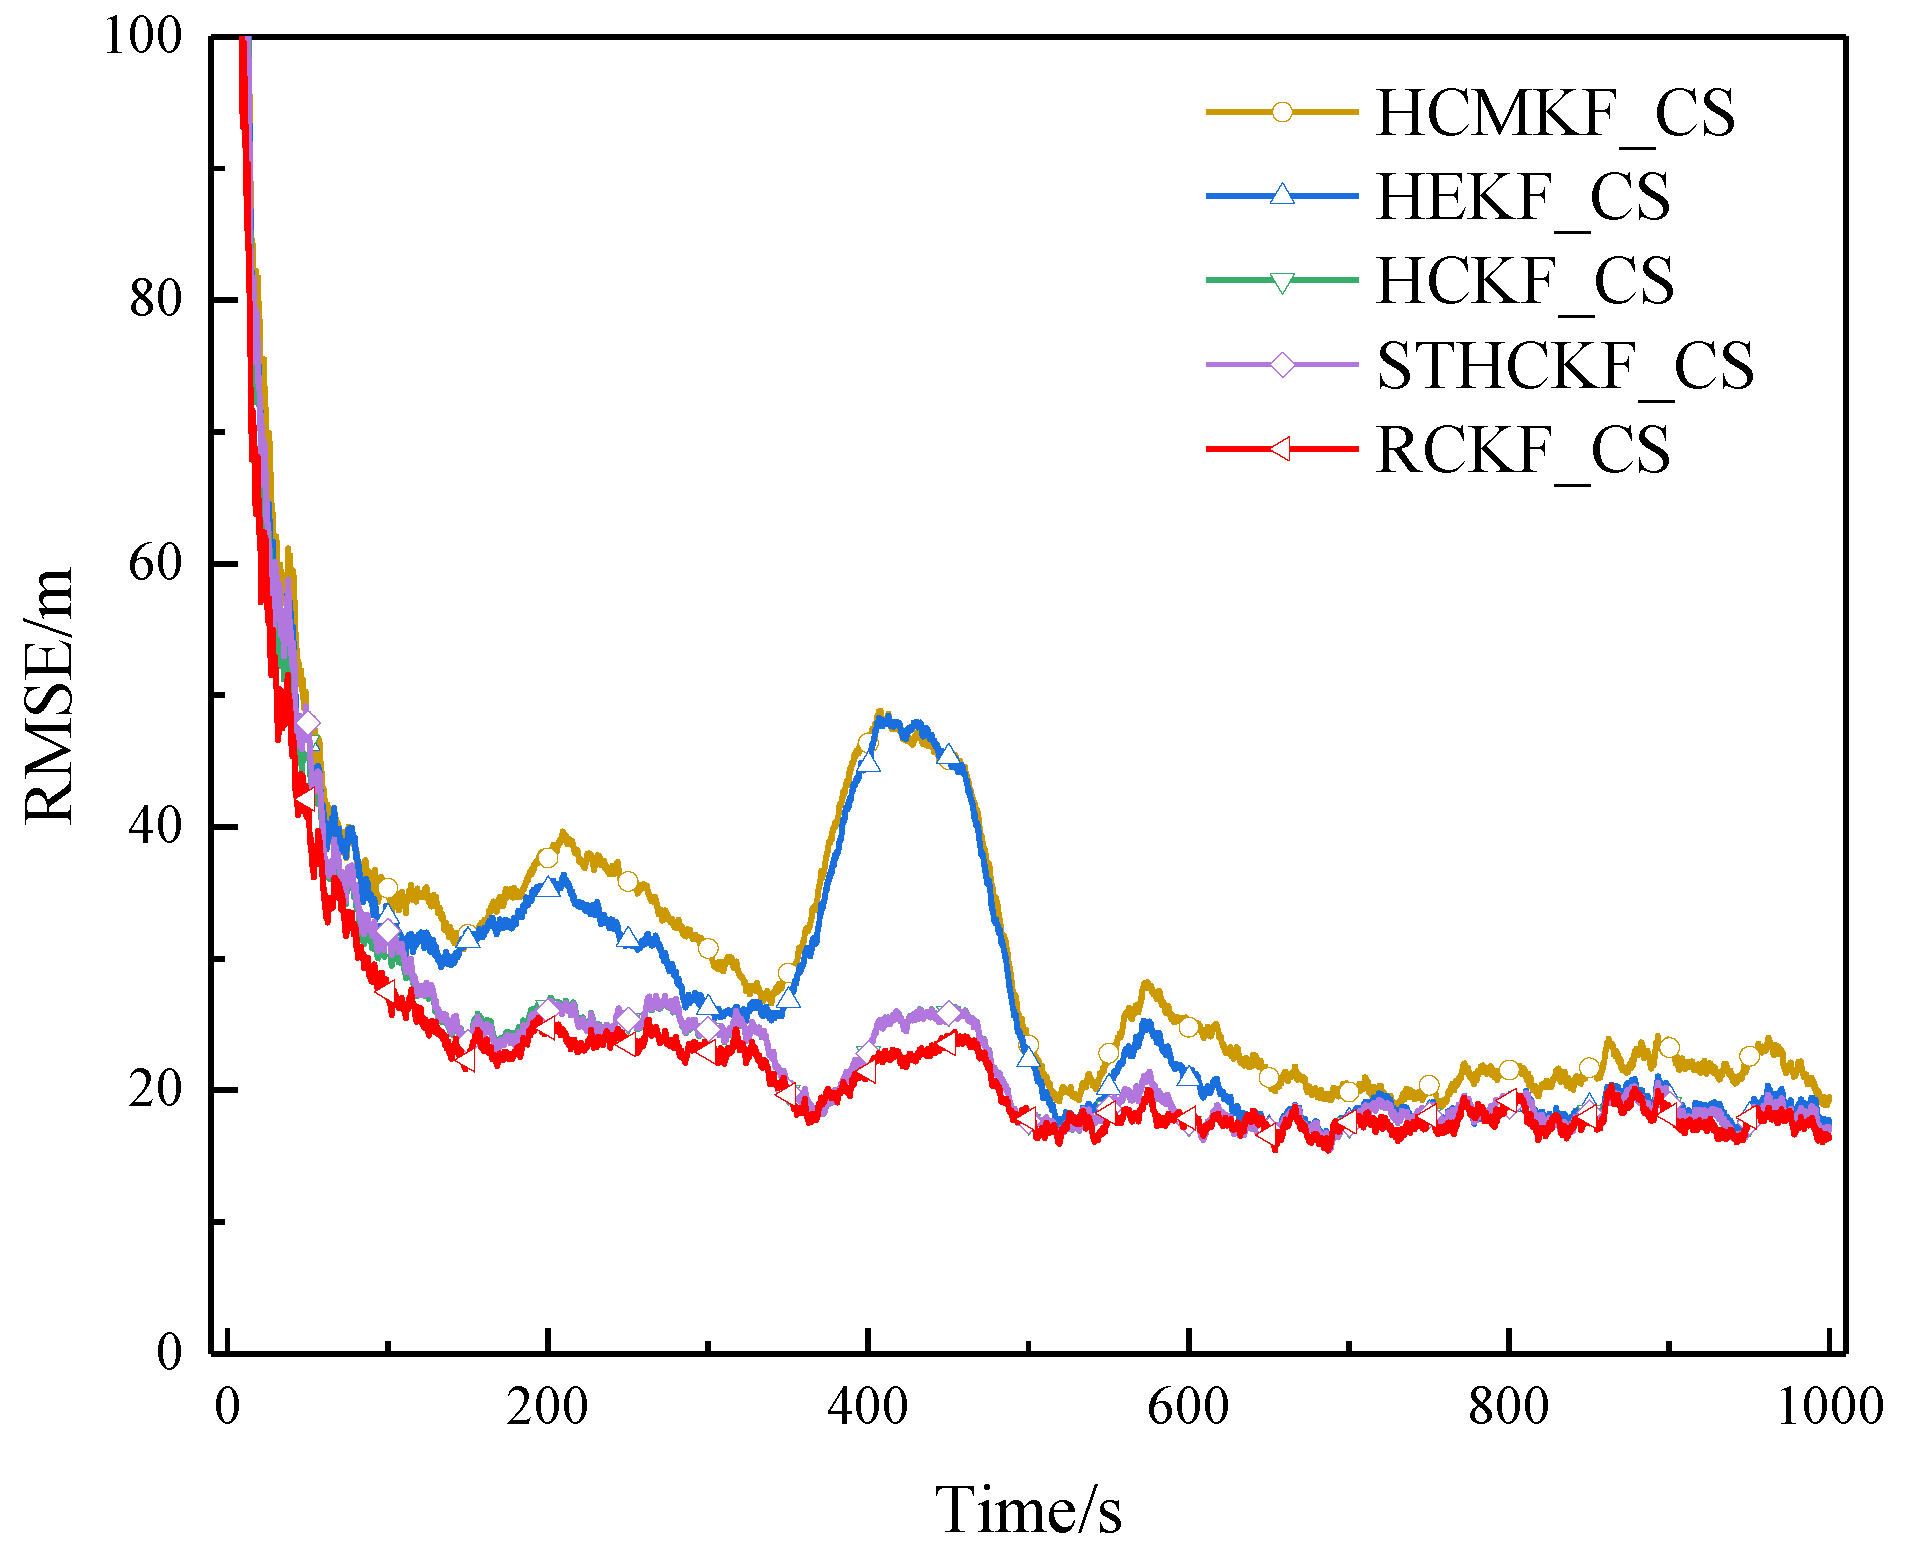
Figure 7.
RMSE of example 2 in surface track 1 (Experiment A).
Figure 7.
RMSE of example 2 in surface track 1 (Experiment A).
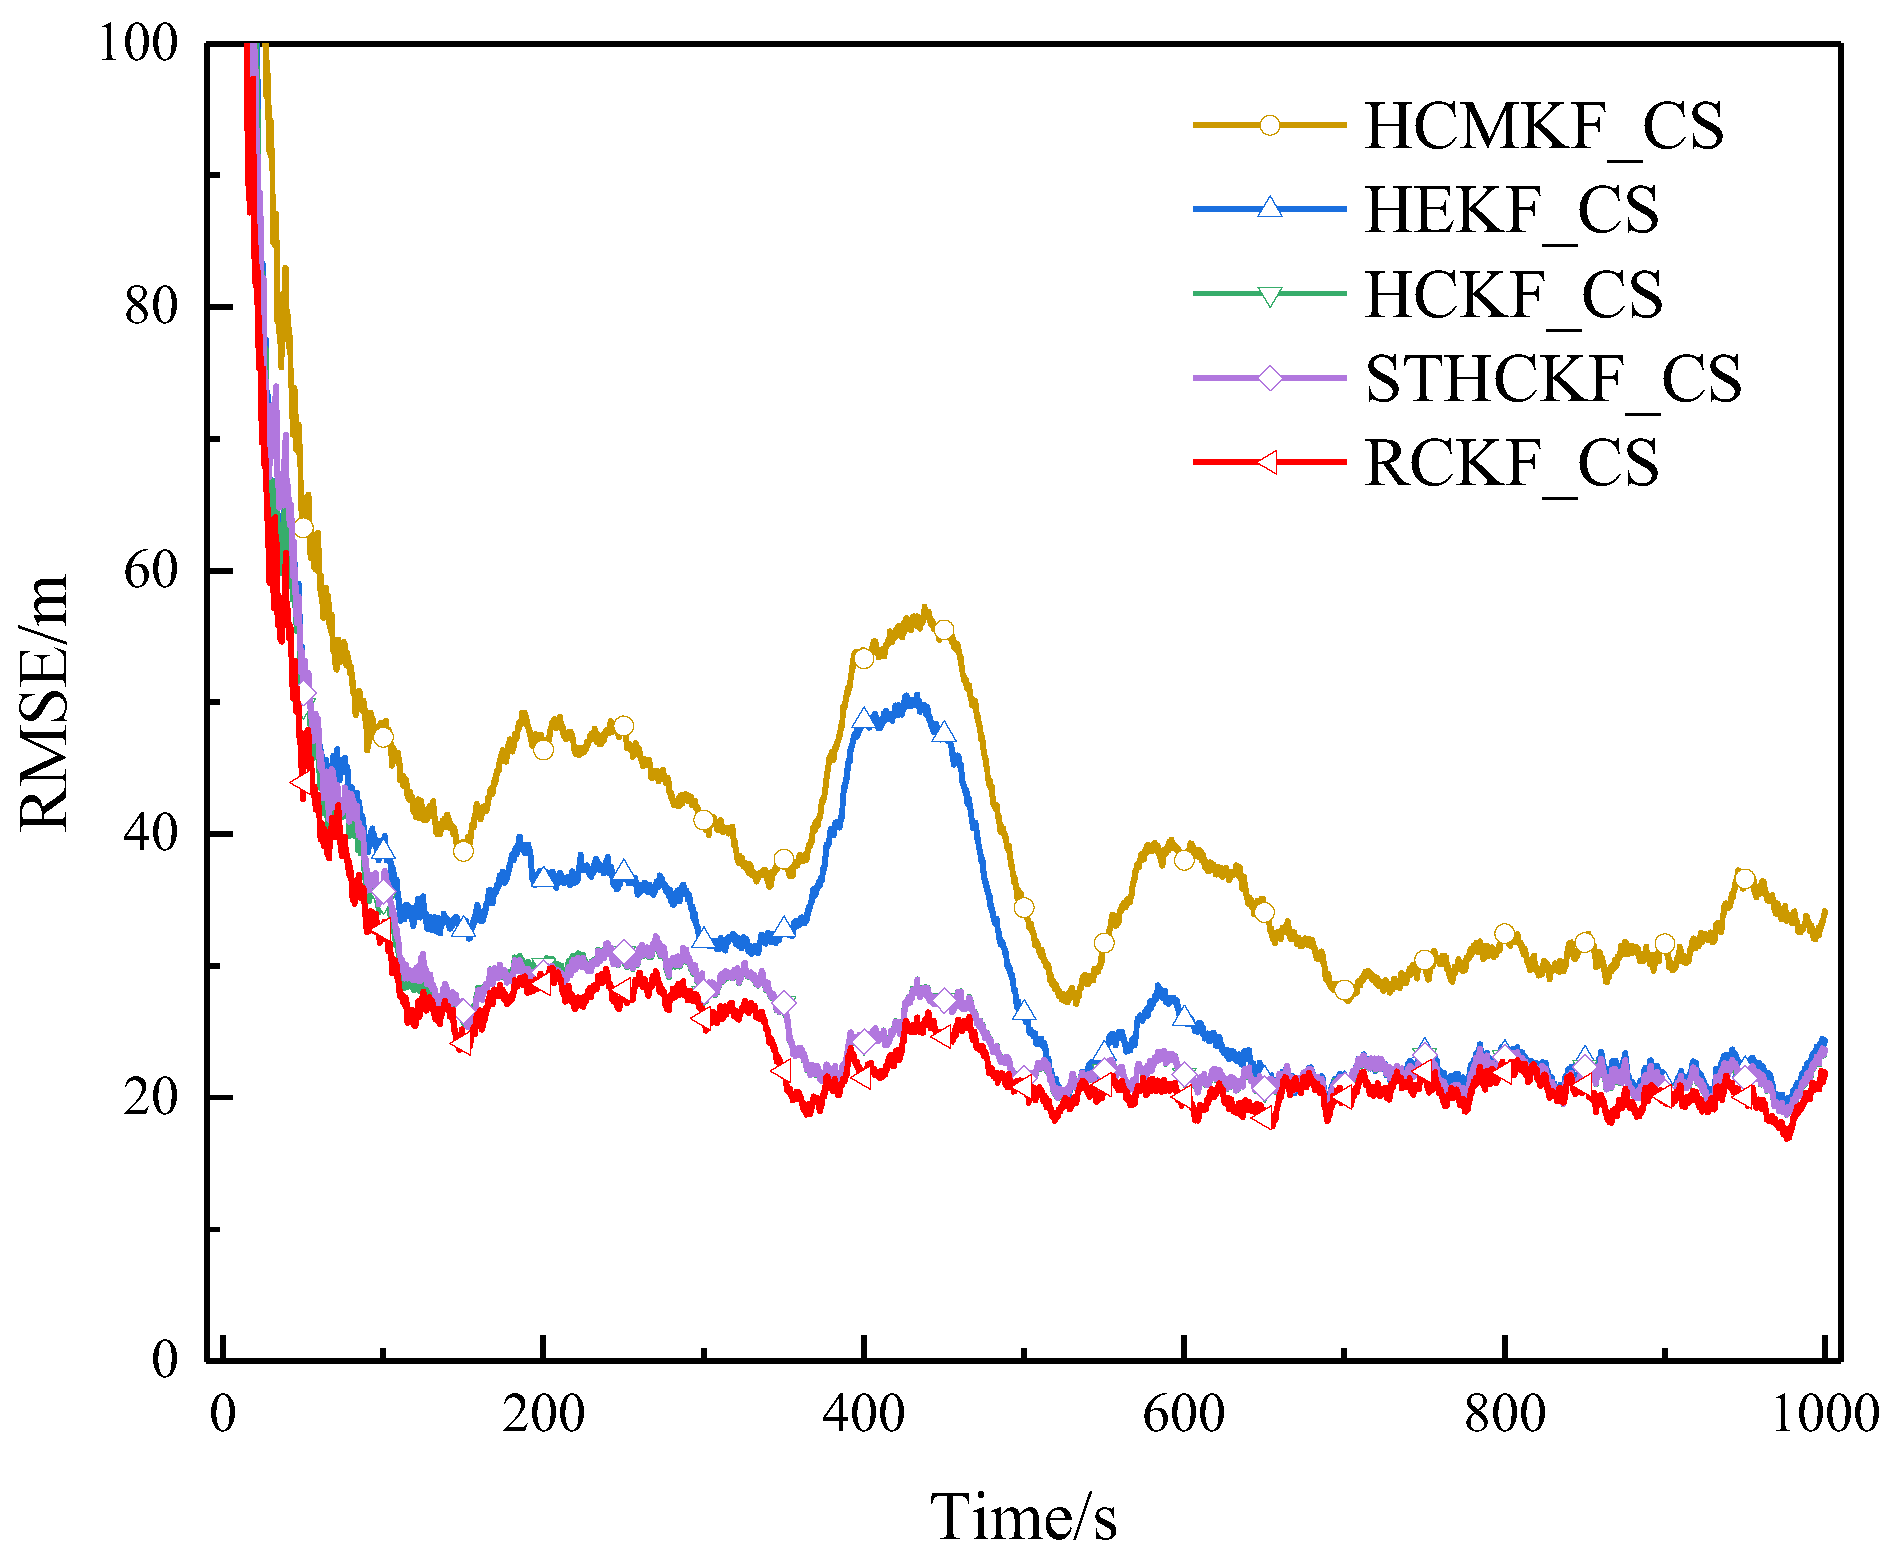
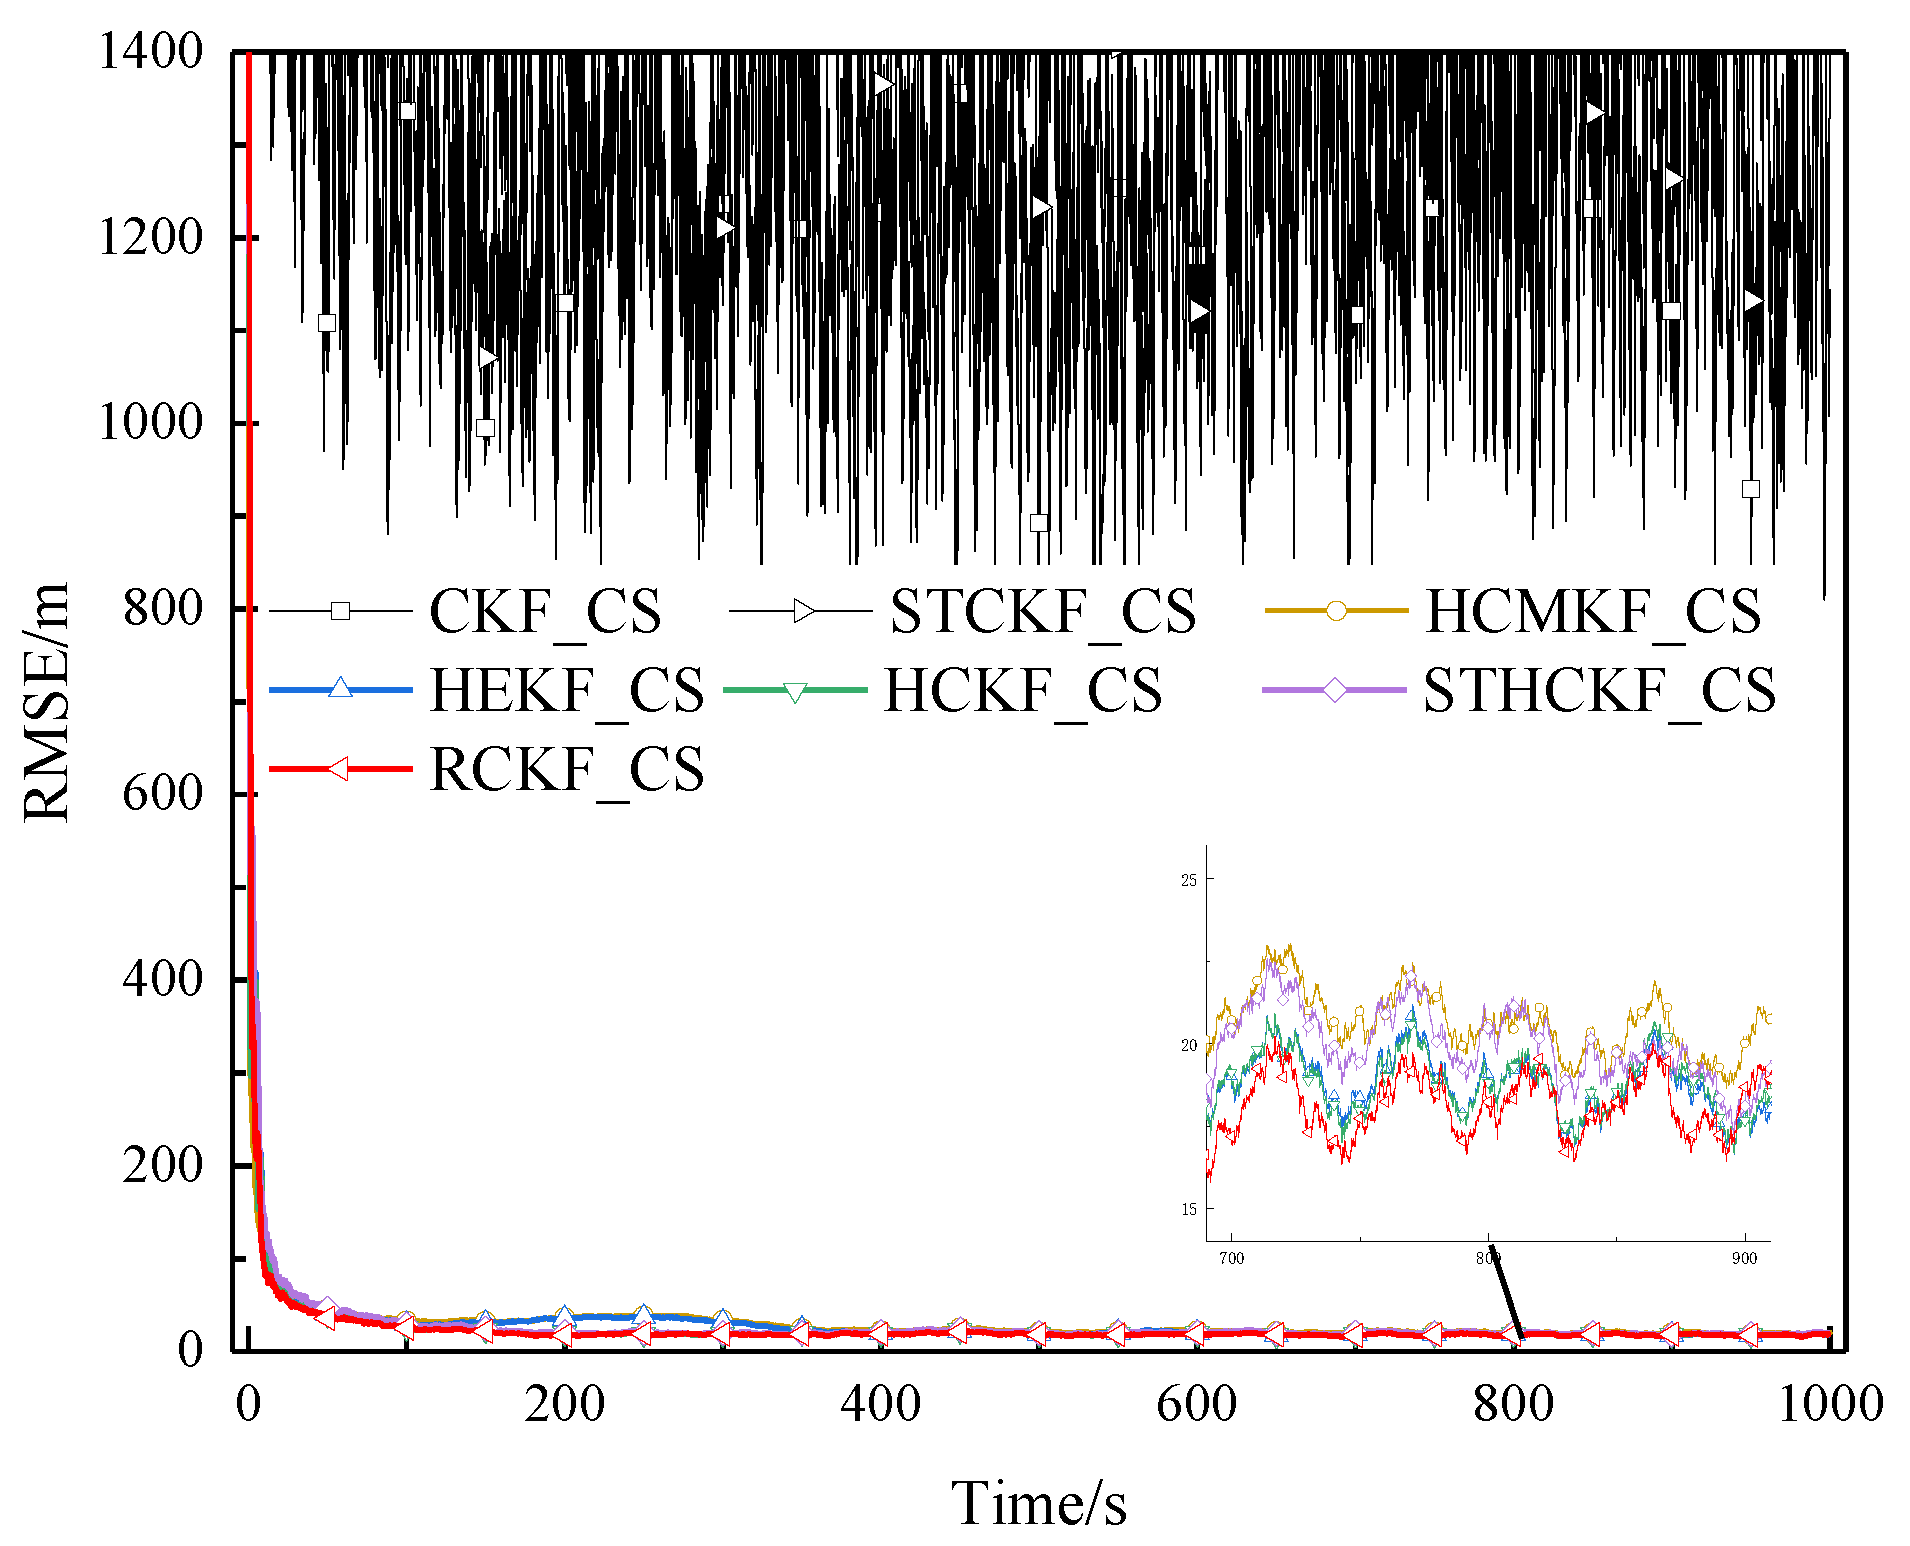
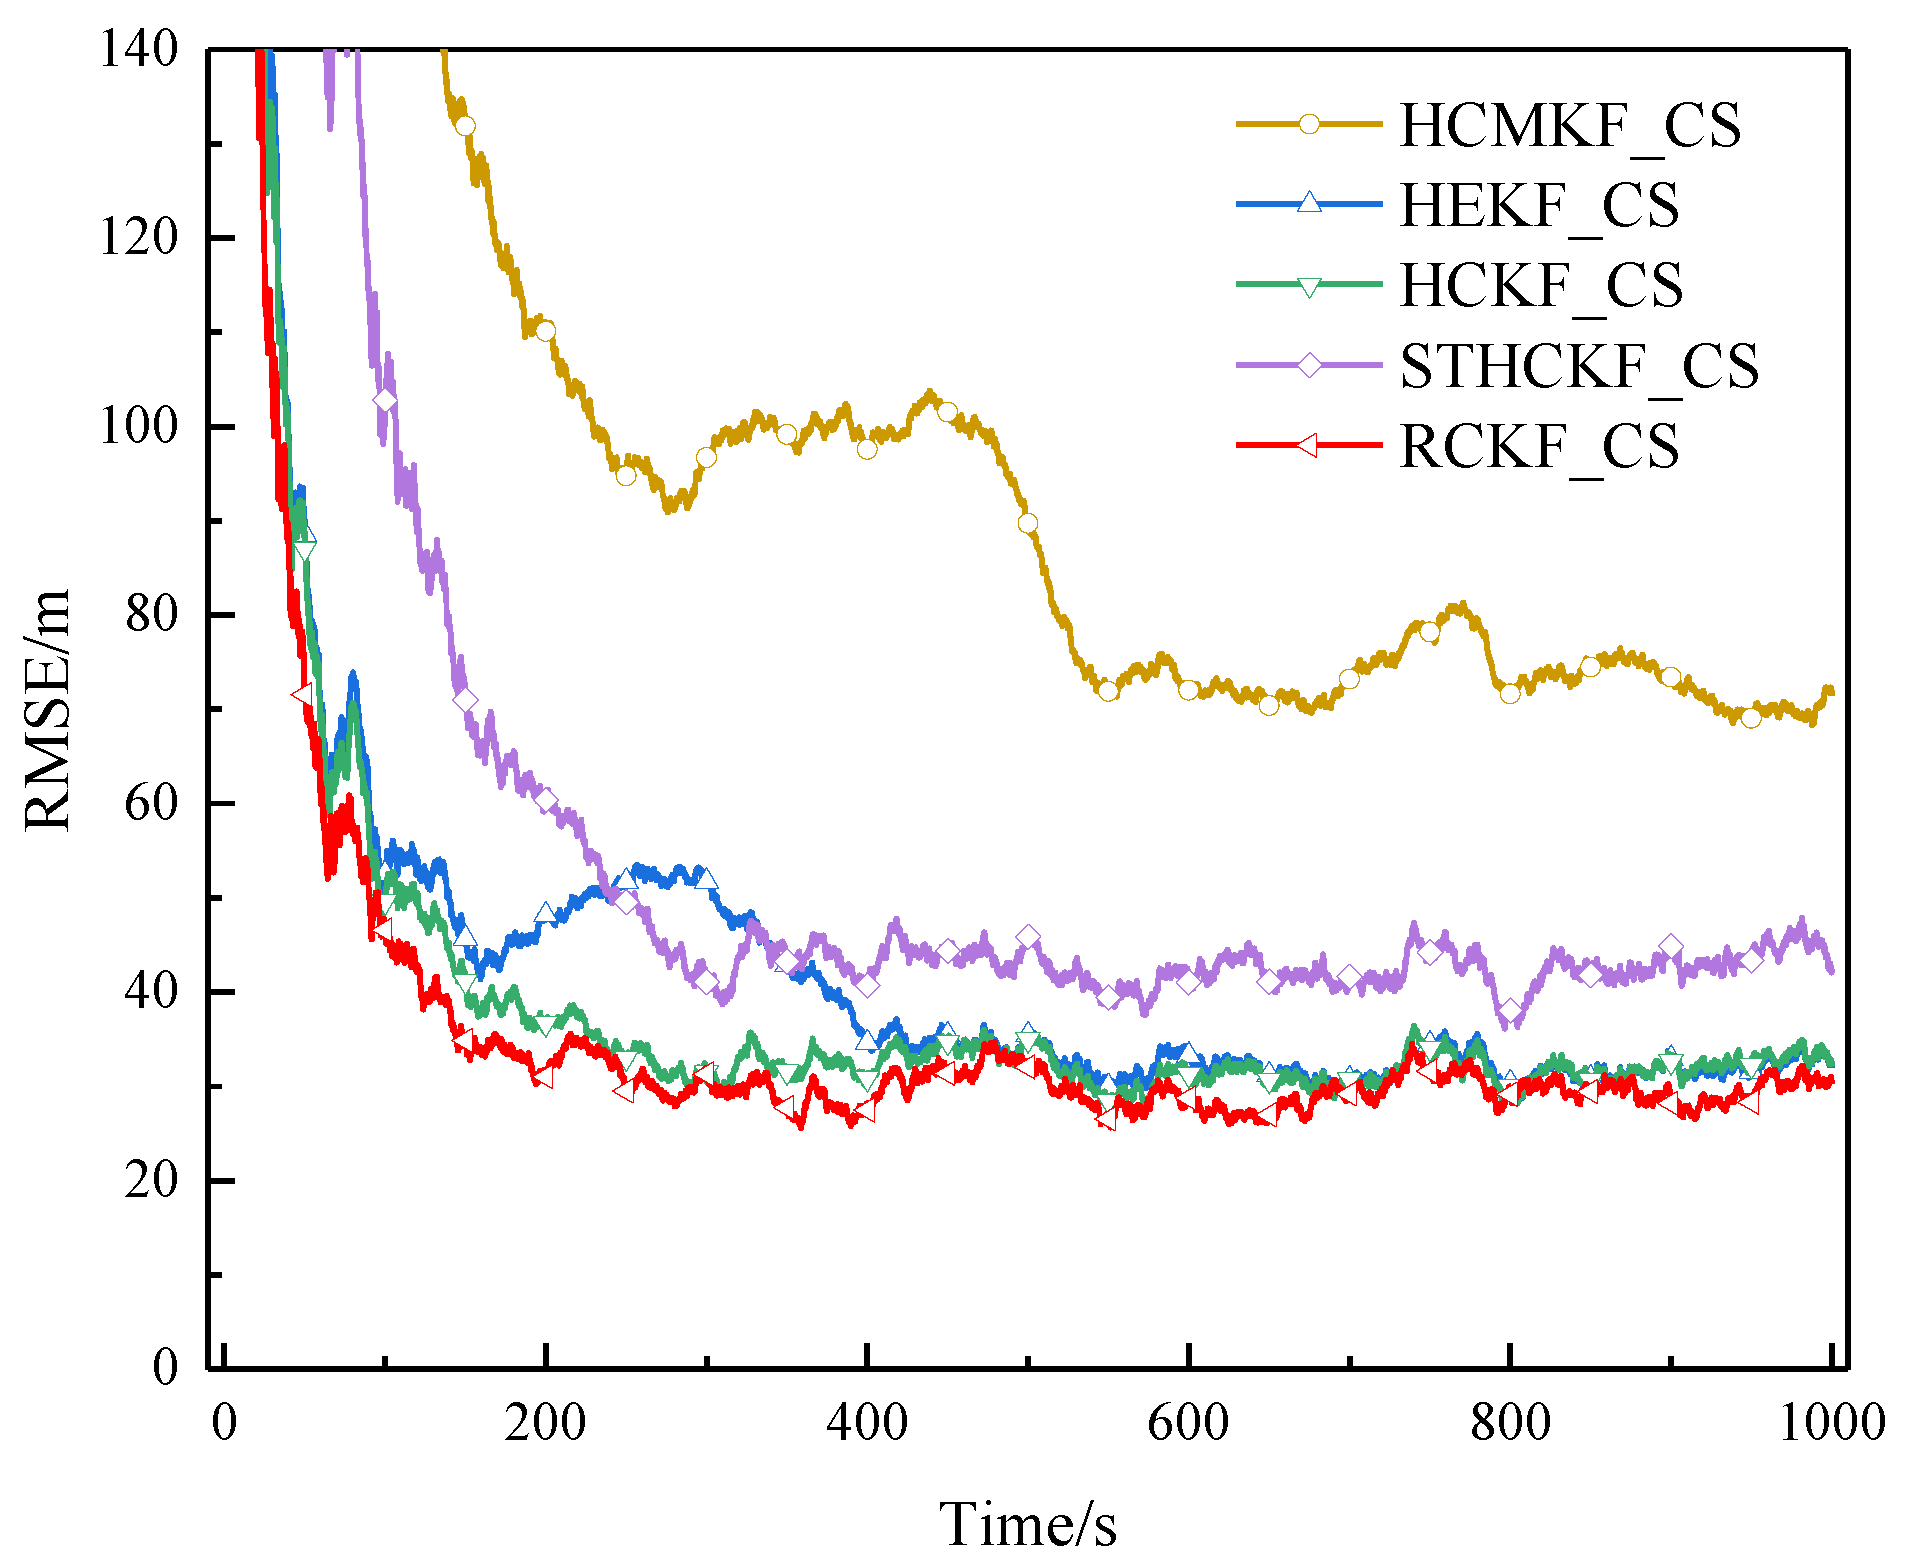
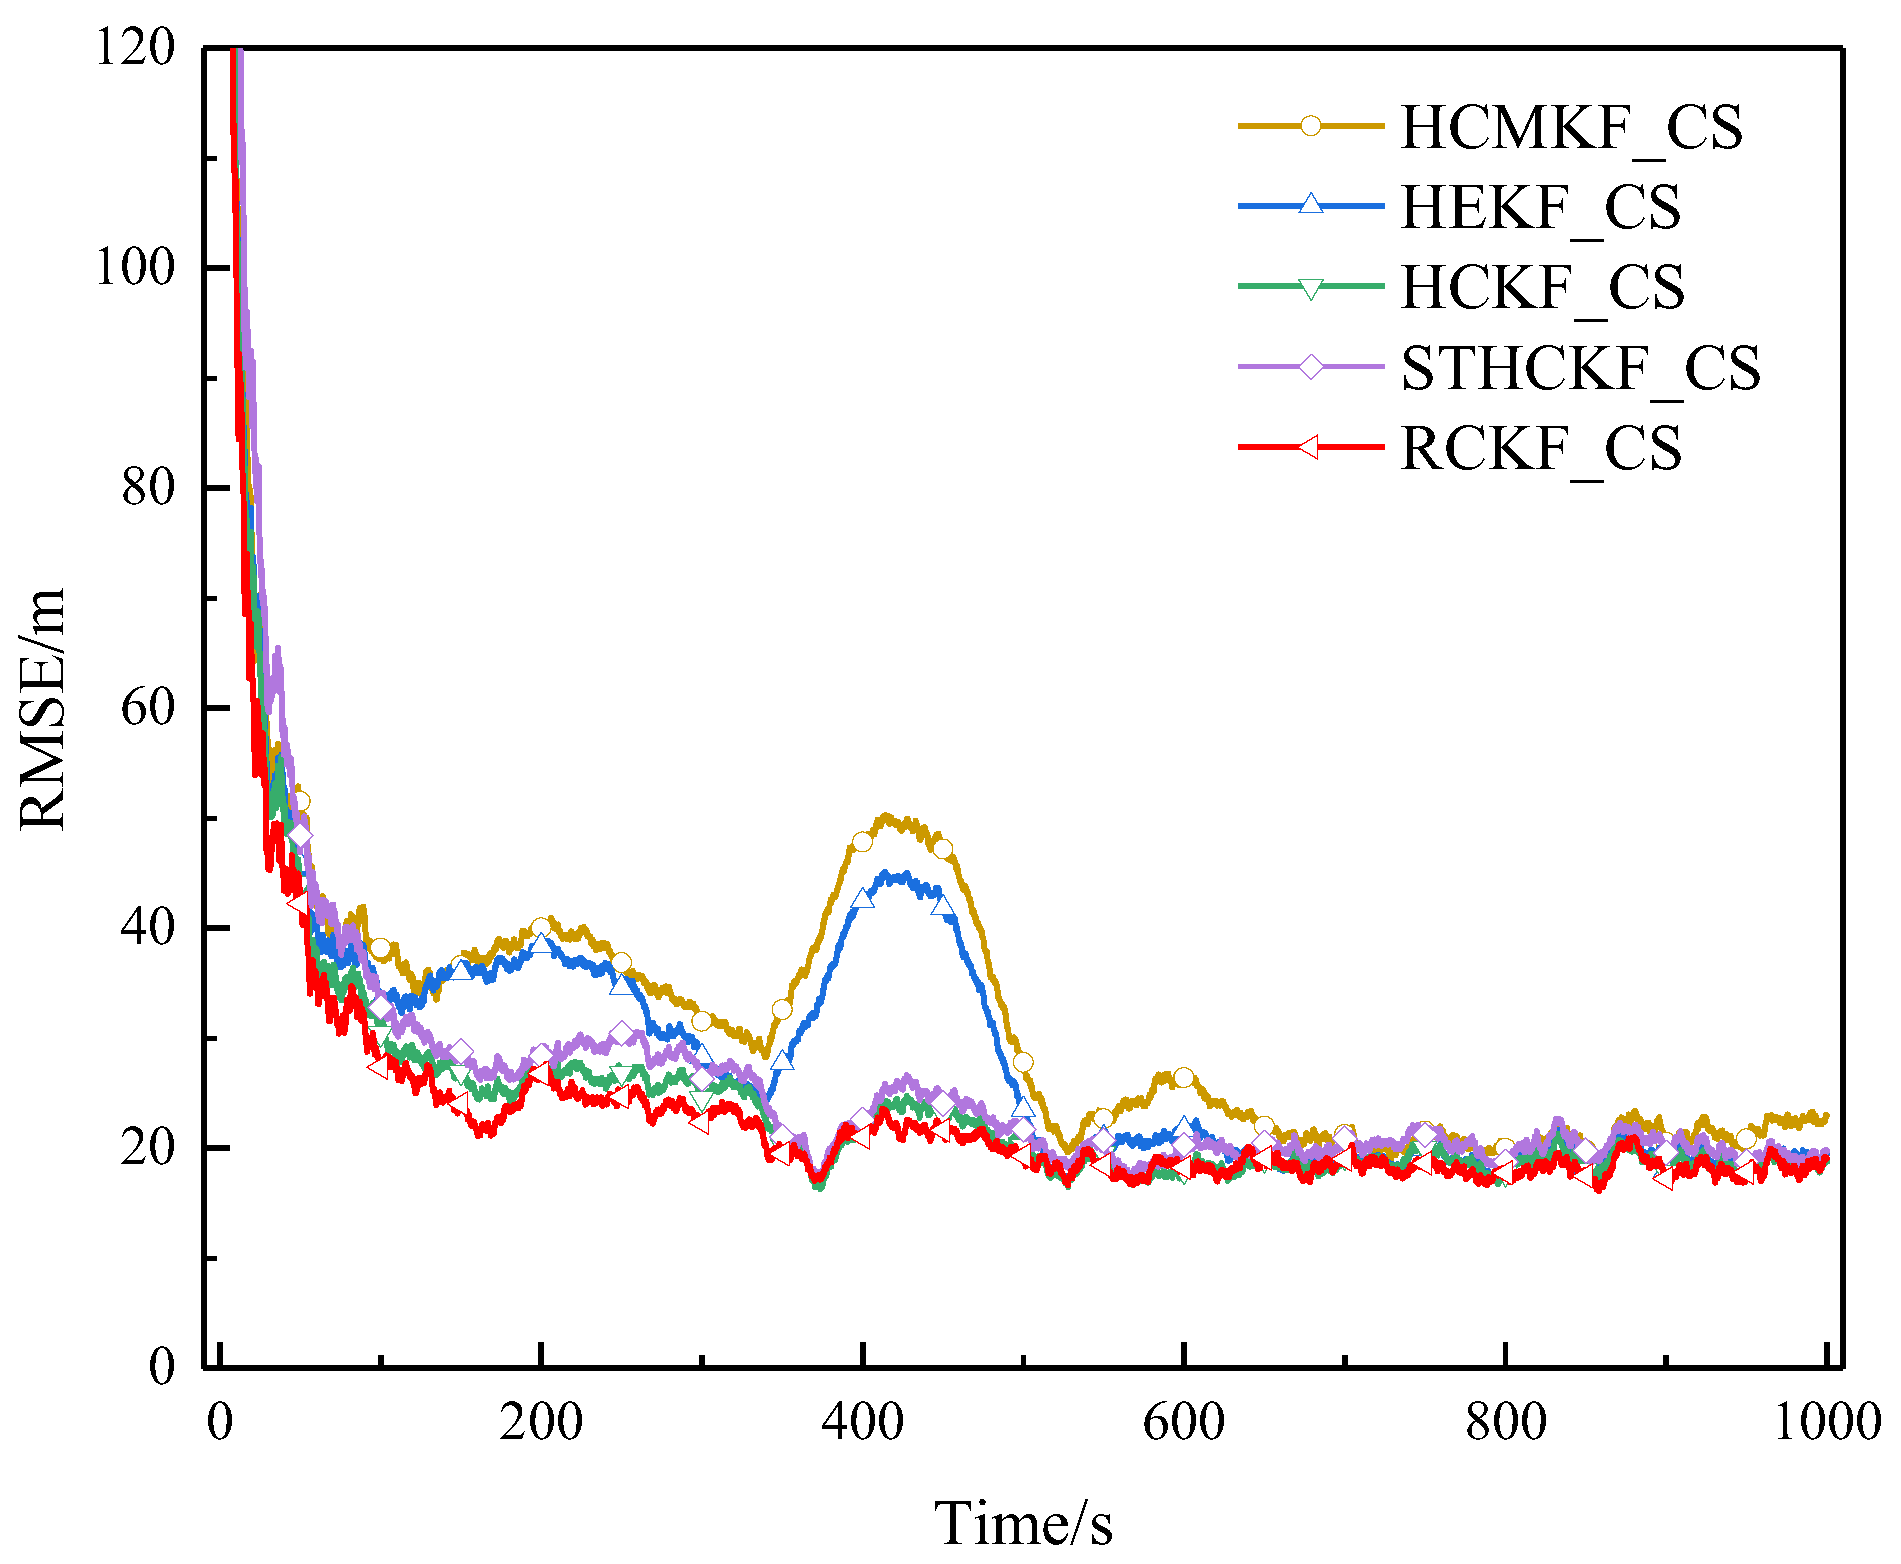
Figure 8.
RMSE of example 3 in surface track 1 (Experiment A).
Figure 8.
RMSE of example 3 in surface track 1 (Experiment A).
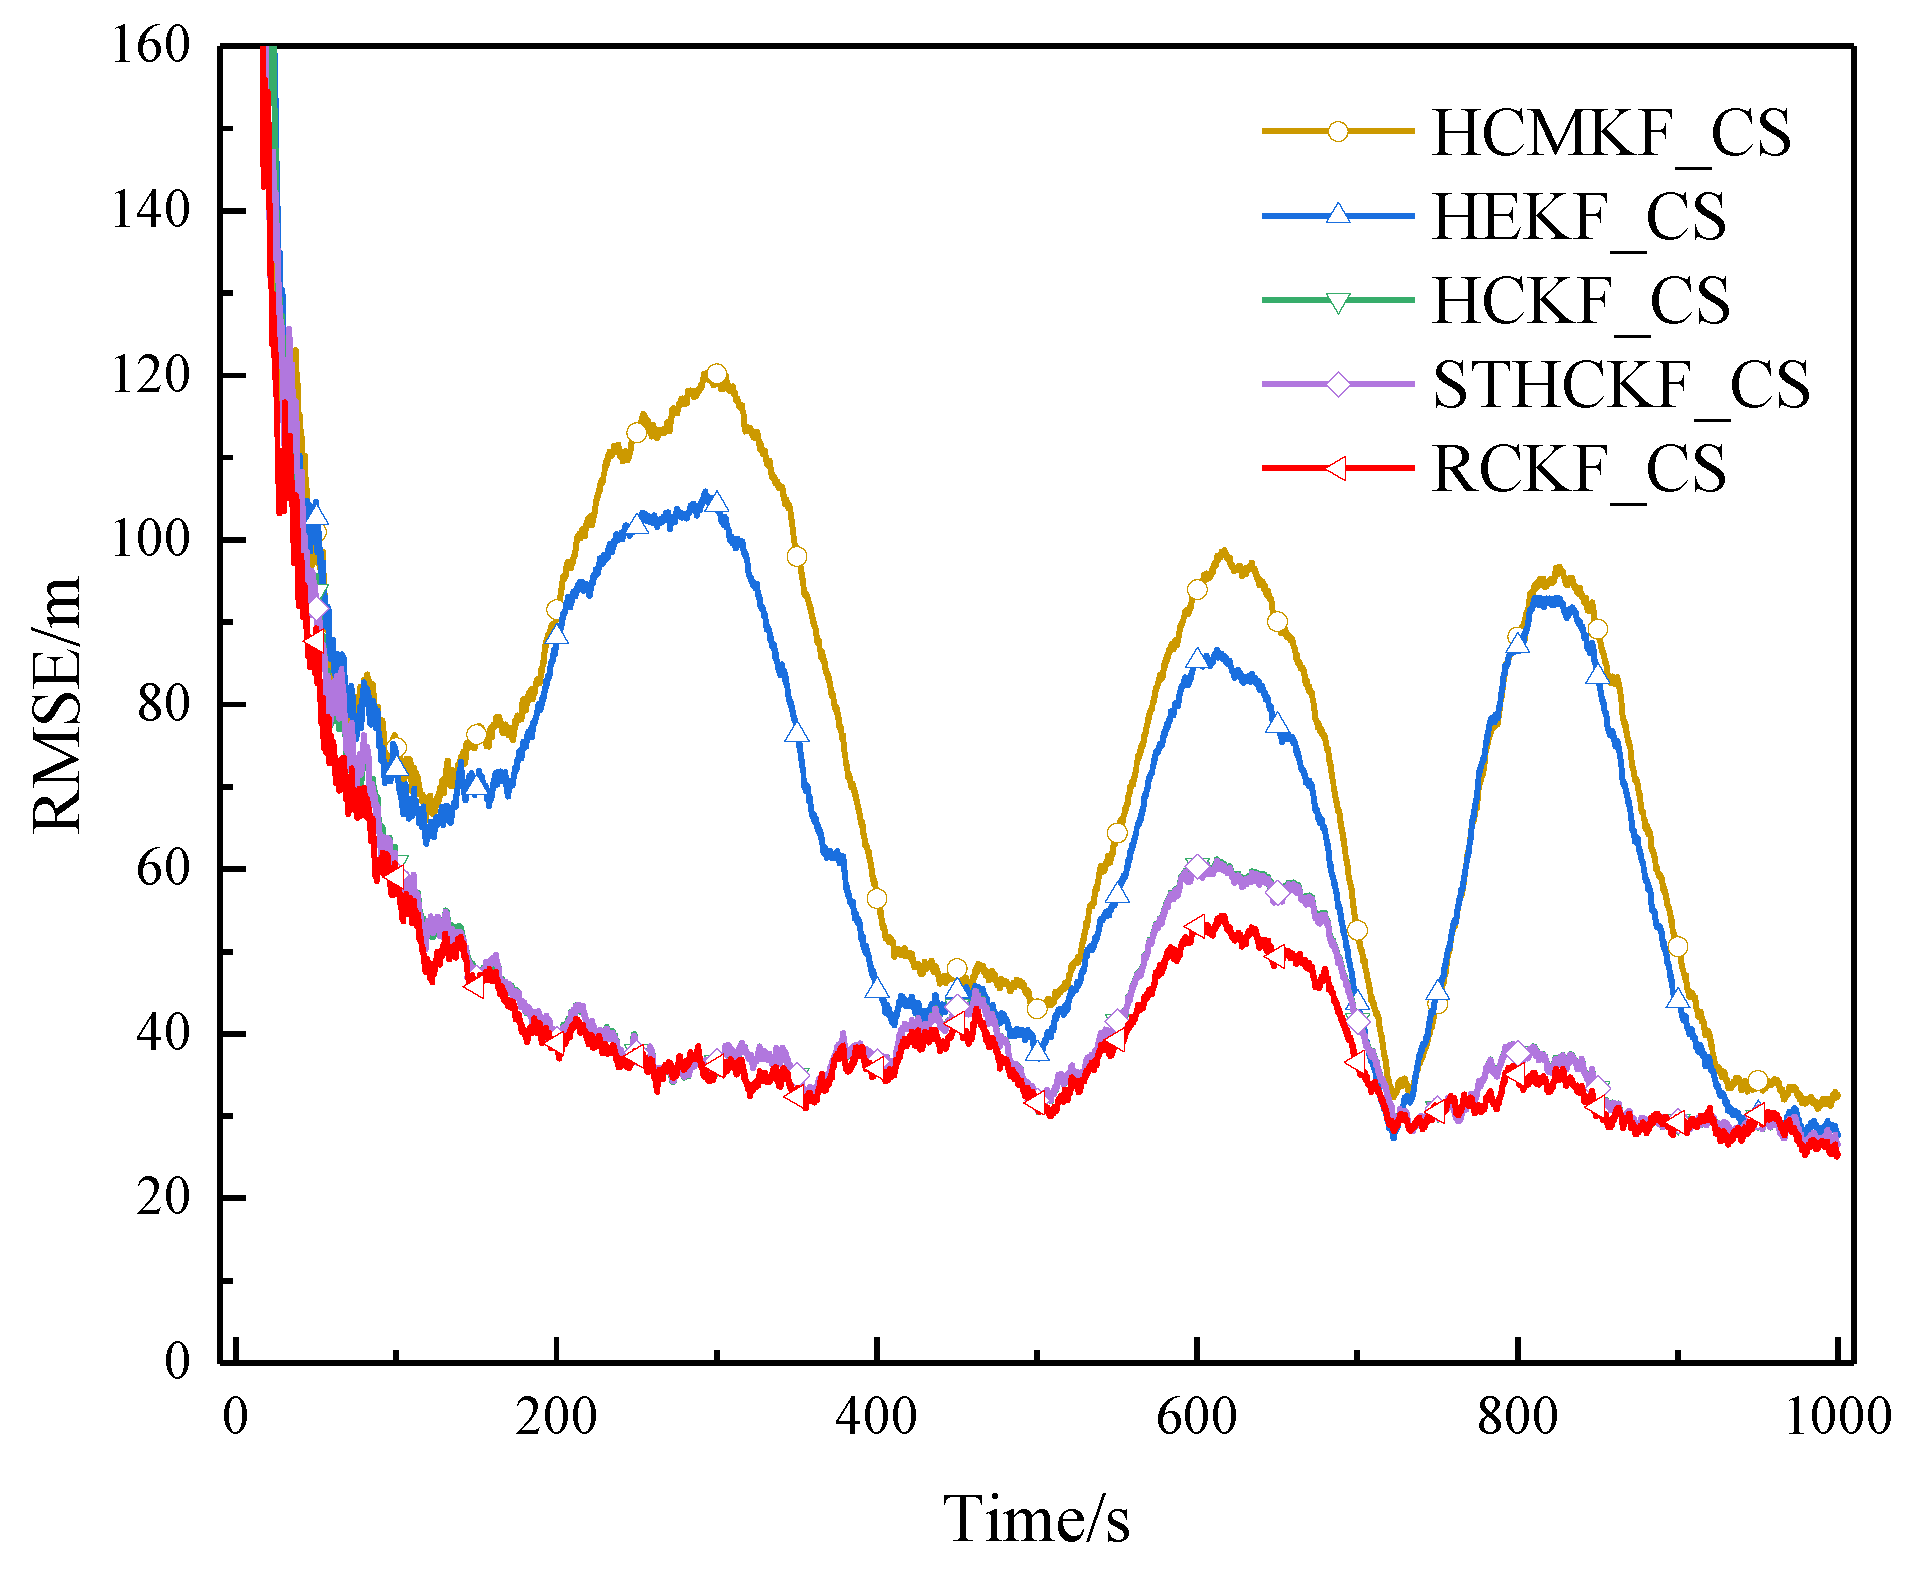
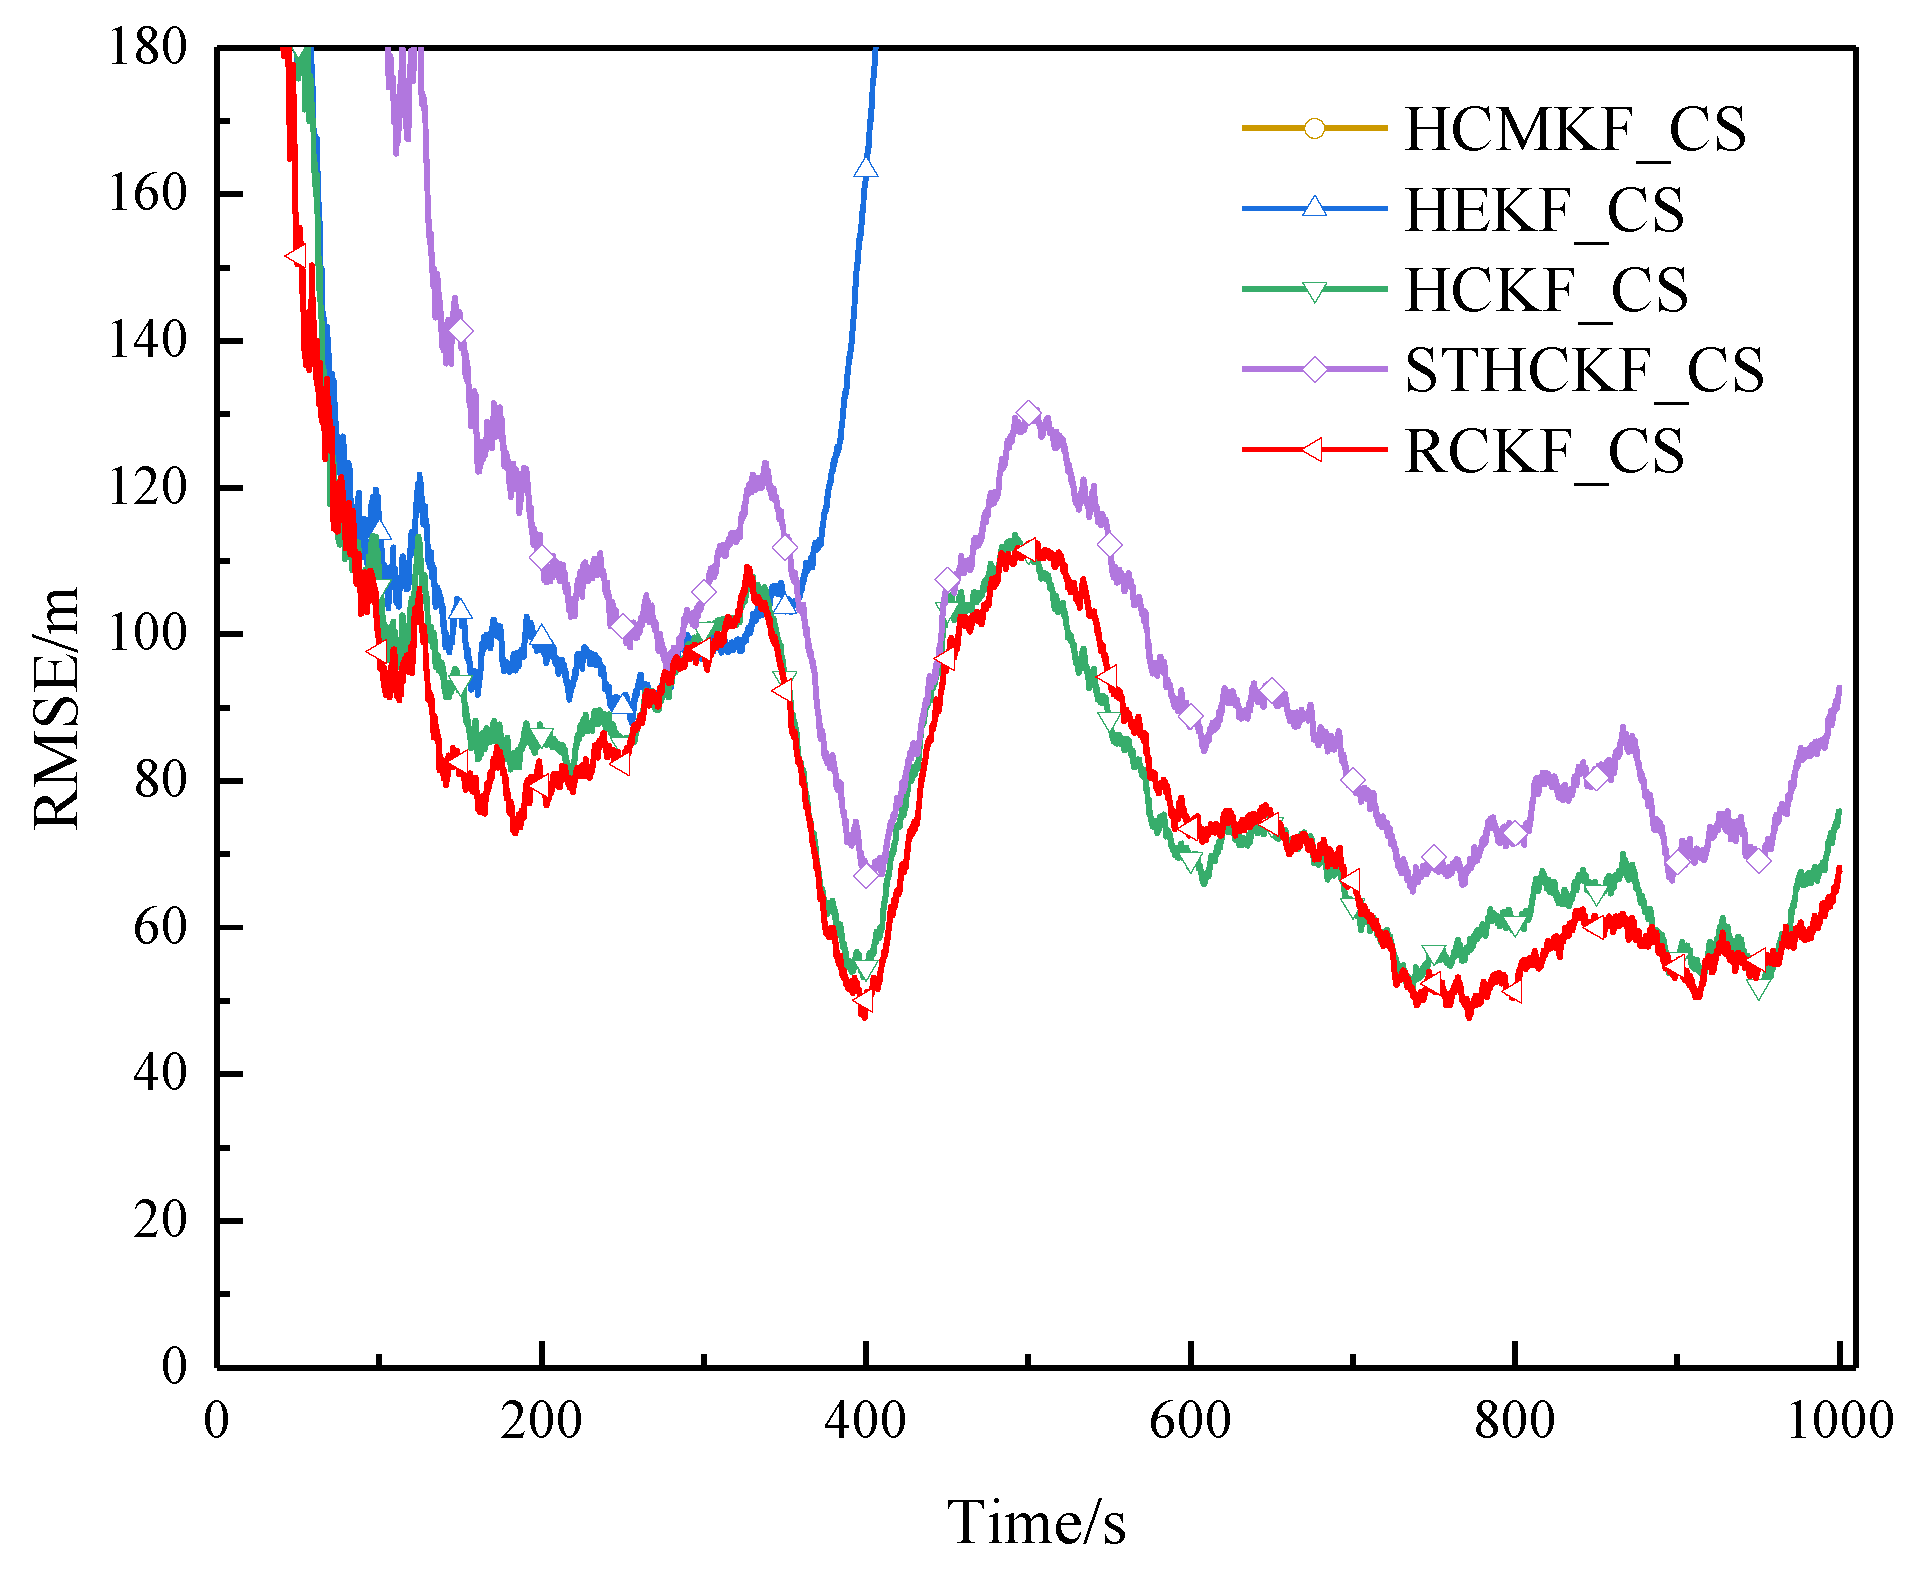
Figure 9.
RMSE of example 1 in surface track 2 (Experiment A).
Figure 9.
RMSE of example 1 in surface track 2 (Experiment A).
Figure 10.
RMSE of example 2 in surface track 2 (Experiment A).
Figure 10.
RMSE of example 2 in surface track 2 (Experiment A).
Figure 11.
RMSE of example 3 in surface track 2 (Experiment A).
Figure 11.
RMSE of example 3 in surface track 2 (Experiment A).
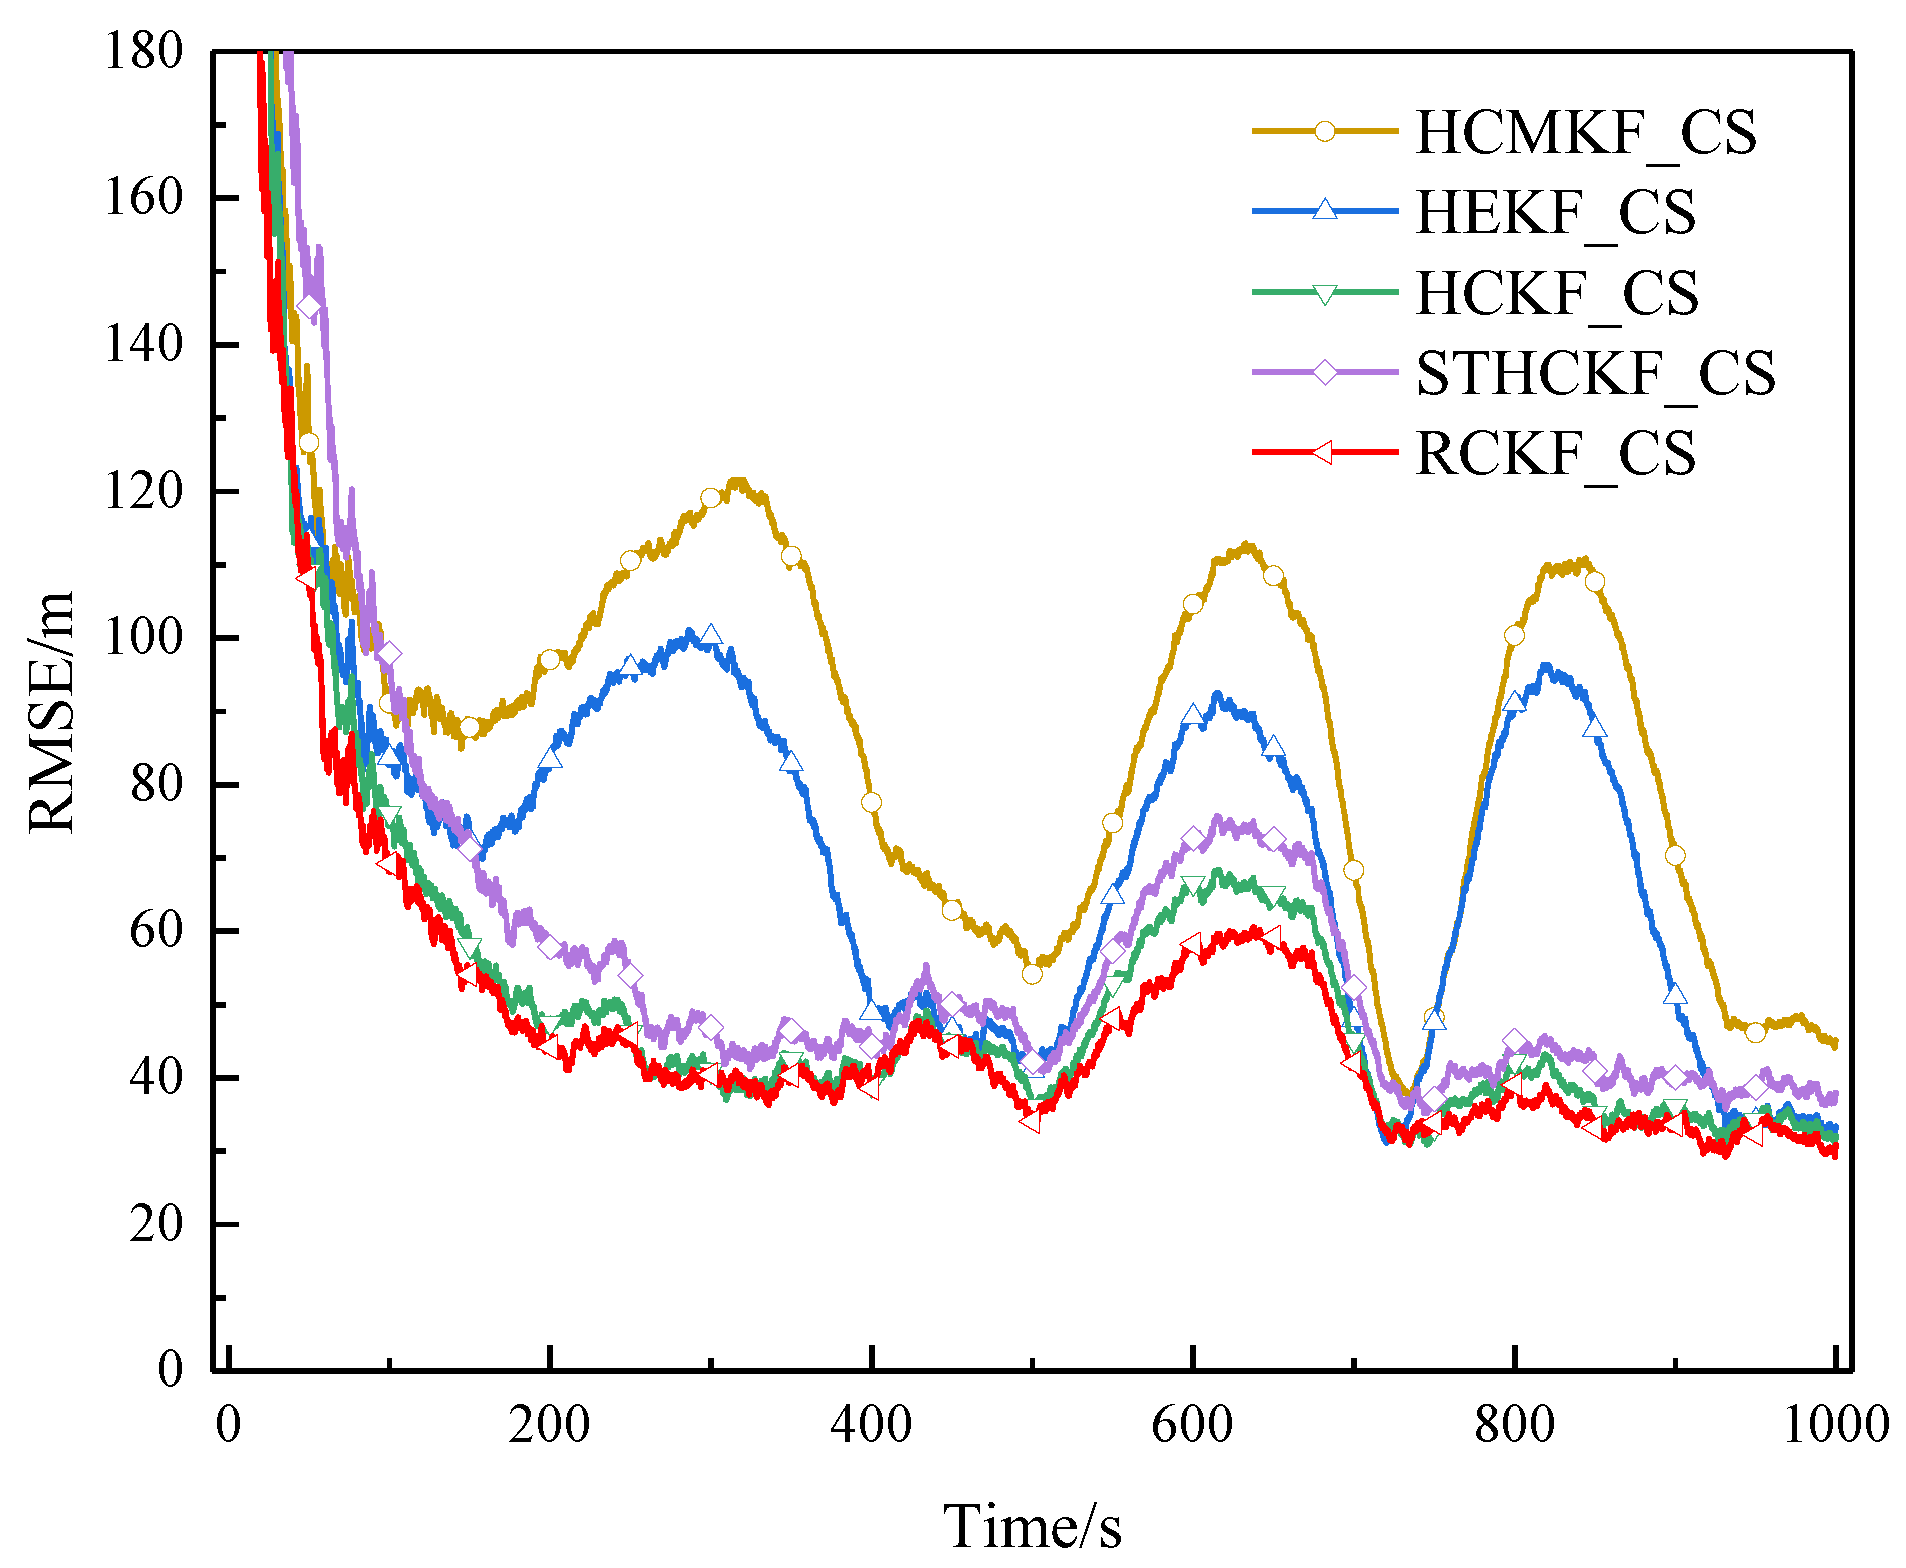
Figure 12.
RMSE of example 1 in surface track 3 (Experiment A).
Figure 12.
RMSE of example 1 in surface track 3 (Experiment A).
Figure 13.
RMSE of example 2 in surface track 3 (Experiment A).
Figure 13.
RMSE of example 2 in surface track 3 (Experiment A).
Figure 14.
RMSE of example 3 in surface track 3 (Experiment A).
Figure 14.
RMSE of example 3 in surface track 3 (Experiment A).
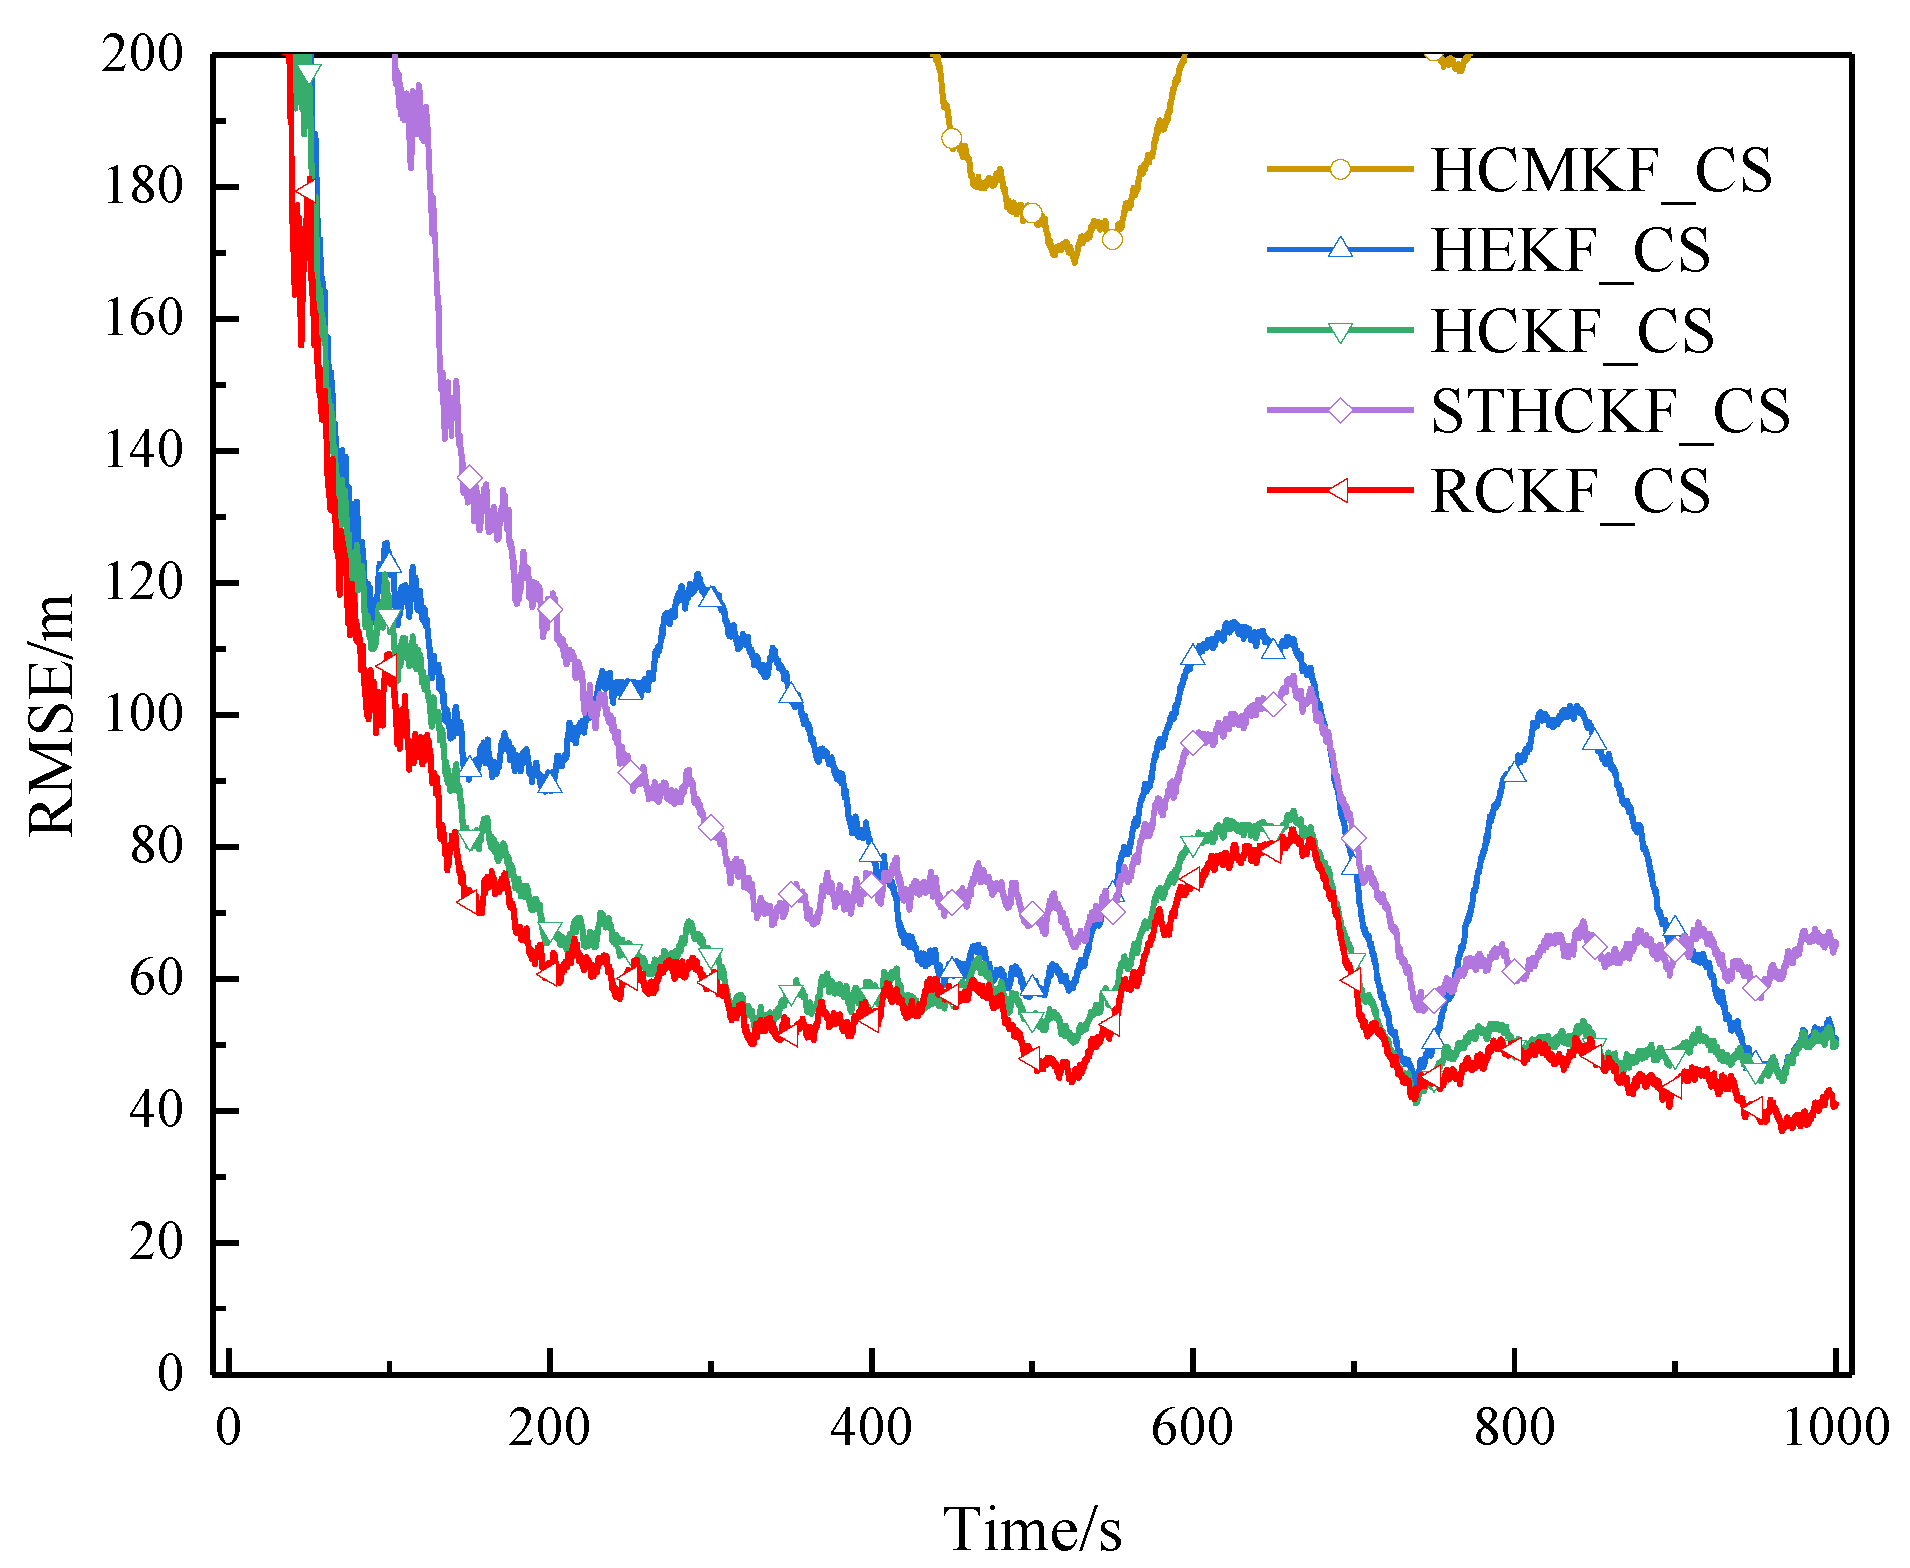
Figure 15.
RMSE of example 1 in surface track 4 (Experiment A).
Figure 15.
RMSE of example 1 in surface track 4 (Experiment A).
Figure 16.
RMSE of example 2 in surface track 4 (Experiment A).
Figure 16.
RMSE of example 2 in surface track 4 (Experiment A).
Figure 17.
RMSE of example 3 in surface track 4 (Experiment A).
Figure 17.
RMSE of example 3 in surface track 4 (Experiment A).
Figure 18.
Condition number ratio curve of surface track 1 (Experiment A).
Figure 18.
Condition number ratio curve of surface track 1 (Experiment A).
Figure 19.
Condition number ratio curve of surface track 2 (Experiment A).
Figure 19.
Condition number ratio curve of surface track 2 (Experiment A).
Figure 20.
Condition number ratio curve of surface track 3 (Experiment A).
Figure 20.
Condition number ratio curve of surface track 3 (Experiment A).
Figure 21.
Condition number ratio curve of surface track 4 (Experiment A).
Figure 21.
Condition number ratio curve of surface track 4 (Experiment A).
Figure 22.
RMSE of example 1 in surface track 1 (Experiment B).
Figure 22.
RMSE of example 1 in surface track 1 (Experiment B).
Figure 23.
RMSE of example 2 in surface track 1 (Experiment B).
Figure 23.
RMSE of example 2 in surface track 1 (Experiment B).
Figure 24.
RMSE of example 3 in surface track 1 (Experiment B).
Figure 24.
RMSE of example 3 in surface track 1 (Experiment B).
Figure 25.
RMSE of example 1 in surface track 2 (Experiment B).
Figure 25.
RMSE of example 1 in surface track 2 (Experiment B).
Figure 26.
RMSE of example 2 in surface track 2 (Experiment B).
Figure 26.
RMSE of example 2 in surface track 2 (Experiment B).
Figure 27.
RMSE of example 3 in surface track 2 (Experiment B).
Figure 27.
RMSE of example 3 in surface track 2 (Experiment B).
Figure 28.
RMSE of example 1 in surface track 3 (Experiment B).
Figure 28.
RMSE of example 1 in surface track 3 (Experiment B).
Figure 29.
RMSE of example 2 in surface track 3 (Experiment B).
Figure 29.
RMSE of example 2 in surface track 3 (Experiment B).
Figure 30.
RMSE of example 3 in surface track 3 (Experiment B).
Figure 30.
RMSE of example 3 in surface track 3 (Experiment B).
Figure 31.
RMSE of example 1 in surface track 4 (Experiment B).
Figure 31.
RMSE of example 1 in surface track 4 (Experiment B).
Figure 32.
RMSE of example 2 in surface track 4 (Experiment B).
Figure 32.
RMSE of example 2 in surface track 4 (Experiment B).
Figure 33.
RMSE of example 3 in surface track 4 (Experiment B).
Figure 33.
RMSE of example 3 in surface track 4 (Experiment B).
Figure 34.
Condition number ratio curve of surface track 1 (Experiment B).
Figure 34.
Condition number ratio curve of surface track 1 (Experiment B).
Figure 35.
Condition number ratio curve of surface track 2 (Experiment B).
Figure 35.
Condition number ratio curve of surface track 2 (Experiment B).
Figure 36.
Condition number ratio curve of surface track 3 (Experiment B).
Figure 36.
Condition number ratio curve of surface track 3 (Experiment B).
Figure 37.
Condition number ratio curve of surface track 4 (Experiment B).
Figure 37.
Condition number ratio curve of surface track 4 (Experiment B).
Table 1.
Notations and definitions of variables in
Section 4.
Table 1.
Notations and definitions of variables in
Section 4.
| Symbol | Definition | Symbol | Definition |
|---|
| The error between the extrapolated estimate value of the state and the true value | | Adaptive factor for residual suppression |
| Measurement noise (also used as residual) | | Threshold in penalty strategy |
| Composite error vector | | Slope control parameter in exponential penalty |
| Normalised error vector | | Upper bound in penalty function |
| Covariance matrix | | Measurement noise covariance matrix |
| The loss function at moment k | | A posteriori state covariance matrix |
| Penalty function (piecewise-defined smooth approximation) | | Estimated state after correction |
| Quadratic term in loss function | | Kalman gain |
Table 2.
List of simulation conditions.
Table 2.
List of simulation conditions.
| Simulation Parameter | Value |
|---|
| Number of simulations | 200 |
| Radar sampling time (s) | 1000 |
| Sampling interval (s) | 0.1 |
| Standard deviation of radar range noise (m) | 50 |
| Standard deviation of angle noise (°) | 0.5 |
| Pollution rate ε of example 1 of each track | 0.1 |
| Pollution rate ε of example 2 of each track | 0.2 |
| Pollution rate ε of example 3 of each track | 0.4 |
| Acceleration maximum value of the CS model (m/s2) | 0.1 |
Table 3.
Different parameter combinations of the adaptive factor with the penalty strategy.
Table 3.
Different parameter combinations of the adaptive factor with the penalty strategy.
| |
Smoothing Threshold |
Penalty Sharpness |
Gain Suppression Level |
|---|
| 10 | 100 | 4.25 |
| 10 | 100 | 5.25 |
| 20 | 100 | 4.25 |
| 20 | 100 | 5.25 |
| 10 | 150 | 4.25 |
| 10 | 150 | 5.25 |
| 20 | 150 | 4.25 |
| 20 | 150 | 5.25 |
Table 4.
Test results of the experiments for the parameter settings (Experiment A) (m).
Table 4.
Test results of the experiments for the parameter settings (Experiment A) (m).
| | | | | | | | | |
|---|
| Track 1/ε = 0.1 | 18.539 | 19.031 | 18.565 | 18.908 | 18.989 | 19.076 | 18.963 | 18.714 |
| Track 1/ε = 0.2 | 21.318 | 21.978 | 21.429 | 21.961 | 21.750 | 22.241 | 21.548 | 22.180 |
| Track 1/ε = 0.4 | 29.937 | 31.035 | 29.832 | 31.087 | 30.921 | 32.327 | 30.241 | 32.178 |
| Track 2/ε = 0.1 | 19.179 | 19.831 | 19.274 | 19.693 | 19.575 | 19.438 | 19.477 | 19.669 |
| Track 2/ε = 0.2 | 21.938 | 22.915 | 21.712 | 23.028 | 22.145 | 22.808 | 21.746 | 22.885 |
| Track 2/ε = 0.4 | 30.492 | 32.386 | 30.965 | 32.129 | 31.848 | 32.919 | 31.396 | 33.874 |
| Track 3/ε = 0.1 | 49.763 | 51.493 | 49.710 | 50.762 | 50.802 | 51.351 | 49.945 | 52.022 |
| Track 3/ε = 0.2 | 56.568 | 57.550 | 56.752 | 56.906 | 56.961 | 57.450 | 56.879 | 57.248 |
| Track 3/ε = 0.4 | 75.913 | 76.919 | 74.965 | 78.374 | 76.372 | 78.576 | 76.778 | 78.678 |
| Track 4/ε = 0.1 | 35.602 | 36.314 | 36.119 | 36.647 | 36.421 | 36.067 | 36.261 | 36.891 |
| Track 4/ε = 0.2 | 41.119 | 41.607 | 40.683 | 42.157 | 41.387 | 43.048 | 41.473 | 42.527 |
| Track 4/ε = 0.4 | 56.077 | 59.062 | 56.785 | 59.640 | 56.059 | 60.373 | 57.649 | 60.438 |
Table 5.
Test results of the experiments for the parameter settings (Experiment B) (m).
Table 5.
Test results of the experiments for the parameter settings (Experiment B) (m).
| | | | | | | | | |
|---|
| Track 1/ε = 0.1 | 18.548 | 18.940 | 18.607 | 18.784 | 18.616 | 18.754 | 18.750 | 19.147 |
| Track 1/ε = 0.2 | 21.149 | 24.295 | 21.324 | 22.296 | 21.810 | 22.153 | 21.272 | 23.385 |
| Track 1/ε = 0.4 | 29.307 | 32.079 | 29.553 | 31.461 | 30.835 | 32.517 | 30.299 | 32.115 |
| Track 2/ε = 0.1 | 19.568 | 19.620 | 19.388 | 19.488 | 19.215 | 19.455 | 19.163 | 19.755 |
| Track 2/ε = 0.2 | 22.356 | 22.964 | 22.103 | 22.661 | 22.521 | 23.184 | 22.180 | 23.038 |
| Track 2/ε = 0.4 | 30.793 | 32.733 | 31.006 | 32.448 | 31.415 | 33.116 | 31.186 | 33.580 |
| Track 3/ε = 0.1 | 50.795 | 51.133 | 50.012 | 50.334 | 50.316 | 51.142 | 51.499 | 50.421 |
| Track 3/ε = 0.2 | 56.413 | 57.623 | 57.088 | 56.966 | 57.371 | 57.924 | 57.762 | 57.685 |
| Track 3/ε = 0.4 | 74.575 | 77.466 | 74.601 | 78.462 | 75.099 | 78.131 | 74.747 | 78.772 |
| Track 4/ε = 0.1 | 36.134 | 36.355 | 36.204 | 36.903 | 37.048 | 37.289 | 36.249 | 36.446 |
| Track 4/ε = 0.2 | 41.396 | 41.889 | 40.719 | 42.822 | 41.372 | 42.302 | 42.022 | 42.515 |
| Track 4/ε = 0.4 | 56.228 | 58.529 | 56.233 | 58.644 | 57.362 | 59.857 | 58.643 | 59.645 |
Table 6.
Average RMSE of surface track 1 (Experiment A) (m).
Table 6.
Average RMSE of surface track 1 (Experiment A) (m).
| Approach | HCMKF_CS | HEKF_CS | HCKF_CS | STHCKF_CS | RCKF_CS | |
|---|
| ε = 0.1 | 23.738 | 21.462 | 18.995 | 19.004 | 18.490 | 2.66% |
| ε = 0.2 | 33.947 | 26.159 | 22.815 | 22.846 | 21.390 | 6.25% |
| ε = 0.4 | 85.032 | 34.451 | 31.417 | 31.480 | 29.678 | 5.54% |
Table 7.
Average RMSE of surface track 2 (Experiment A) (m).
Table 7.
Average RMSE of surface track 2 (Experiment A) (m).
| Approach | HCMKF_CS | HEKF_CS | HCKF_CS | STHCKF_CS | RCKF_CS | |
|---|
| ε = 0.1 | 27.370 | 24.853 | 20.252 | 20.257 | 19.350 | 4.45% |
| ε = 0.2 | 37.363 | 28.403 | 23.660 | 23.668 | 21.996 | 7.03% |
| ε = 0.4 | 87.748 | 39.606 | 32.729 | 32.766 | 30.437 | 7.00% |
Table 8.
Average RMSE of surface track 3 (Experiment A) (m).
Table 8.
Average RMSE of surface track 3 (Experiment A) (m).
| Approach | HCMKF_CS | HEKF_CS | HCKF_CS | STHCKF_CS | RCKF_CS | |
|---|
| ε = 0.1 | 411.688 | 343.499 | 55.490 | 55.201 | 49.840 | 10.18% |
| ε = 0.2 | 591.392 | 491.391 | 61.520 | 61.047 | 56.926 | 7.47% |
| ε = 0.4 | 572.914 | 622.334 | 79.580 | 78.982 | 75.856 | 4.68% |
Table 9.
Average RMSE of surface track 4 (Experiment A) (m).
Table 9.
Average RMSE of surface track 4 (Experiment A) (m).
| Approach | HCMKF_CS | HEKF_CS | HCKF_CS | STHCKF_CS | RCKF_CS | |
|---|
| ε = 0.1 | 71.906 | 64.130 | 38.698 | 38.663 | 36.617 | 5.38% |
| ε = 0.2 | 80.589 | 64.909 | 42.524 | 42.453 | 40.281 | 5.27% |
| ε = 0.4 | 313.269 | 82.751 | 59.992 | 59.881 | 56.489 | 5.84% |
Table 10.
Average RMSE of surface track 1 (Experiment B) (m).
Table 10.
Average RMSE of surface track 1 (Experiment B) (m).
| Approach | HCMKF_CS | HEKF_CS | HCKF_CS | STHCKF_CS | RCKF_CS | |
|---|
| ε = 0.1 | 23.840 | 22.047 | 19.130 | 20.258 | 18.230 | 4.70% |
| ε = 0.2 | 33.186 | 25.443 | 22.258 | 25.528 | 21.196 | 4.77% |
| ε = 0.4 | 83.215 | 36.157 | 32.255 | 43.654 | 29.789 | 8.61% |
Table 11.
Average RMSE of surface track 2 (Experiment B) (m).
Table 11.
Average RMSE of surface track 2 (Experiment B) (m).
| Approach | HCMKF_CS | HEKF_CS | HCKF_CS | STHCKF_CS | RCKF_CS | |
|---|
| ε = 0.1 | 28.107 | 25.036 | 20.511 | 21.986 | 19.743 | 3.74% |
| ε = 0.2 | 37.974 | 28.370 | 24.108 | 27.702 | 22.496 | 6.69% |
| ε = 0.4 | 89.229 | 39.322 | 33.025 | 44.659 | 30.856 | 6.57% |
Table 12.
Average RMSE of surface track 3 (Experiment B) (m).
Table 12.
Average RMSE of surface track 3 (Experiment B) (m).
| Approach | HCMKF_CS | HEKF_CS | HCKF_CS | STHCKF_CS | RCKF_CS | |
|---|
| ε = 0.1 | 462.053 | 533.850 | 55.935 | 59.191 | 50.668 | 9.42% |
| ε = 0.2 | 529.017 | 350.959 | 60.747 | 67.510 | 56.287 | 7.34% |
| ε = 0.4 | 476.740 | 653.207 | 76.067 | 91.235 | 73.365 | 3.55% |
Table 13.
Average RMSE of surface track 4 (Experiment B) (m).
Table 13.
Average RMSE of surface track 4 (Experiment B) (m).
| Approach | HCMKF_CS | HEKF_CS | HCKF_CS | STHCKF_CS | RCKF_CS | |
|---|
| ε = 0.1 | 66.283 | 61.602 | 38.403 | 40.855 | 35.757 | 6.89% |
| ε = 0.2 | 83.582 | 67.178 | 43.744 | 49.056 | 40.989 | 6.30% |
| ε = 0.4 | 249.530 | 82.800 | 58.800 | 76.071 | 55.070 | 6.34% |


