Article

Electro-Thermal Model-Based Design of a Smart Latch in Automotive Systems for Performance and Reliability Evaluations

Department of Information Engineering, University of Pisa, 56122 Pisa, Italy
*
Author to whom correspondence should be addressed.
Electronics 2025, 14(10), 1962; https://doi.org/10.3390/electronics14101962
Submission received: 25 March 2025 / Revised: 27 April 2025 / Accepted: 6 May 2025 / Published: 12 May 2025
(This article belongs to the Special Issue Collaborative Intelligence in the Era of Industry 5.0)

Abstract

:
Industry 5.0 places growing emphasis on intelligent and efficient design methodologies aiming to reduce development times, accelerate the time-to-market, and enhance human–machine collaboration in creating new products. This article proposes the use of a model-based design (MBD) approach to developing a detailed electro-thermal model (ETDM) of a Smart Latch Mechanism (SLM) used in automotive door automation systems. The proposed ETDM enhances the accuracy of the design and verification processes and enables the simulation of specific scenarios, such as fault conditions, within a virtual environment. The simulation-based framework presented in this article leverages partial knowledge of the system to enable rapid estimations of the performance and functional validation. It encompasses the injection of disturbances, the analysis of failure scenarios, and the use of processor-in-the-loop (PIL) procedures for validation purposes. This work aims to employ detailed modeling and simulation techniques and use publicly available technical data and work from the literature to eliminate the need for physical testing and instrumentation, enabling the development of models that accurately reflect the real-world behavior under defined operating conditions. The proposed framework has the potential to facilitate rapid prototyping and system reconfiguration, contributing to shorter development cycles and improved industrial efficiency by reducing both production times and the associated costs for established automotive subsystems where high precision is nonessential.

1. Introduction

Industry 5.0 builds on Industry 4.0 by steering innovation towards a more sustainable, resilient, and human-focused manufacturing paradigm, aligning industrial progress with societal needs [1]. In this context, the concept of human–machine interaction (HMI) [2], which reduces the physical demand on workers, becomes highly relevant to companies. At the same time, Virtual Factory (VF) platforms can drastically cut costs and development times by supporting simulations and virtual testing activities across the entire product life cycle [3,4]. One of the most significant contributions in this context derives from simulation-based and model-based system design, which enables early virtual testing and the optimization of both products and production processes [5,6]. The use of model-based approaches and simulation techniques significantly reduces development costs and the time-to-market [7,8], providing manufacturers with the agility to rapidly adapt to evolving customer demands and market dynamics—an essential factor for maintaining competitiveness in today’s fast-changing industrial landscape [9]. Such efficiency extends beyond production and logistics, also impacting the design phase as a crucial step in industrial product development [10], where 70–80% of the final product cost is typically determined during the early development and design stages [11]. The use of model-based approaches has played a crucial role not only in simulating system operations but also in reproducing anomaly scenarios and failures and system diagnostics [12,13,14]. In the design phase, model characterization is typically carried out through parameter estimation, which involves setting up test benches to collect measurements using sensors and monitoring systems [15,16,17] or even deliberately damaging components to assess the system’s limits [18,19]. However, even with model-based design approaches, these procedures remain necessary, making the overall process slow and costly, especially for systems that do not require highly sophisticated or precise control operations. Moreover, a lack of accessible data often limits the ability of companies to implement accurate anomaly models or simulate relevant scenarios, such as failure conditions or energy consumption trends [20]. In this work, a design framework based on simulation and modeling is presented where a detailed electro-thermal model (ETDM) is employed for the development of automotive applications [21,22]. This approach enables the estimation of the model parameters and system validation by introducing anomalies and analyzing the evolution of the system variables. The process-in-the-loop (PIL) method is then employed to compare these variables and validate the system [23,24]. Leveraging simulations without the need for experimental data collection or physical test rigs enables a rapid and efficient system design process. With modern computational power, even complex system simulations are feasible, allowing for a quick assessment of a system’s behavior while ensuring compliance with the design specifications [25,26,27]. Starting from a system consisting of two power drives with partially unknown DC motor parameters, an initial estimation was performed through simulation. The process primarily relied on a trial-and-error approach, supported by comparisons with the characteristic curves of DC motors. By applying this approach, relevant system parameters were identified and used as a starting point for the detailed development of the electro-thermal model. In this study, the ETDM models a smart latch system used in car doors, which comprises two power drives: Power Release (PR) and Cinch (CN). PR is responsible for locking and unlocking the latch and is controlled by a Hall effect position sensor, while CN ensures the door is fully closed and secured, relying on a current shunt sensor for control. Both functions are driven by low-power DC motors and H-bridge circuits operated using PWM pulses [28]. The thermal characteristics of both the motors and the MOSFETs in the H-bridges are also modeled. Robustness analyses are performed for single-loop control systems, evaluating the parameter uncertainties, delays, and sensor noise. Various fault scenarios are introduced to simulate anomalies that lead to system failures, and their effects are assessed and validated regarding existing products. Finally, these functions are tested under both normal conditions and induced anomalies using processor-in-the-loop (PIL) techniques for final validation [29,30,31]. In addition, the electro-thermal detailed model (ETDM) enables a holistic representation of the system’s real-world behavior and effectively exploits computational resources to support advanced simulations and analyses [32].

1.1. The Aim of This Work

The aim of this work is to propose a model-based design (MBD) procedure for system characterization and design, reducing the need for further experimental validation and the use of physical test benches, which is often time-consuming and expensive. Modern computing resources provide engineers with a broad set of tools to support this process. This work demonstrates how missing system parameters can be initially estimated using data from similar products and refined through simulations and trial-and-error methods, enabling early validation within the design specifications and modeling of fault scenarios. References to the literature and benchmark products help with approximating the real behavior, which is then verified using standard model-based design techniques such as processor-in-the-loop. In addition to reducing times and costs, this modeling strategy lays the foundation for building a Digital Twin (DT) of the asset [33,34], supporting system monitoring (once the asset has entered production), predictive maintenance, and performance optimization through data-driven methods [35,36].

1.2. Organization of This Paper

The structure of this paper is organized as follows:
  • Section 1: Objectives of the model-based design;
  • Section 2: Electro-thermal modeling of the smart latch system;
  • Section 3: Operation and verification of the Power Release and Cinch model specifications and parametric and disturbance robustness analyses of these models;
  • Section 4: Development and examination of the fault scenarios for both models;
  • Section 5: Validation using processor-in-the-loop simulations;
  • Section 6: Discussion of implementation constraints vs. the real-world behavior;
  • Section 7: Conclusions, analysis, and further developments.

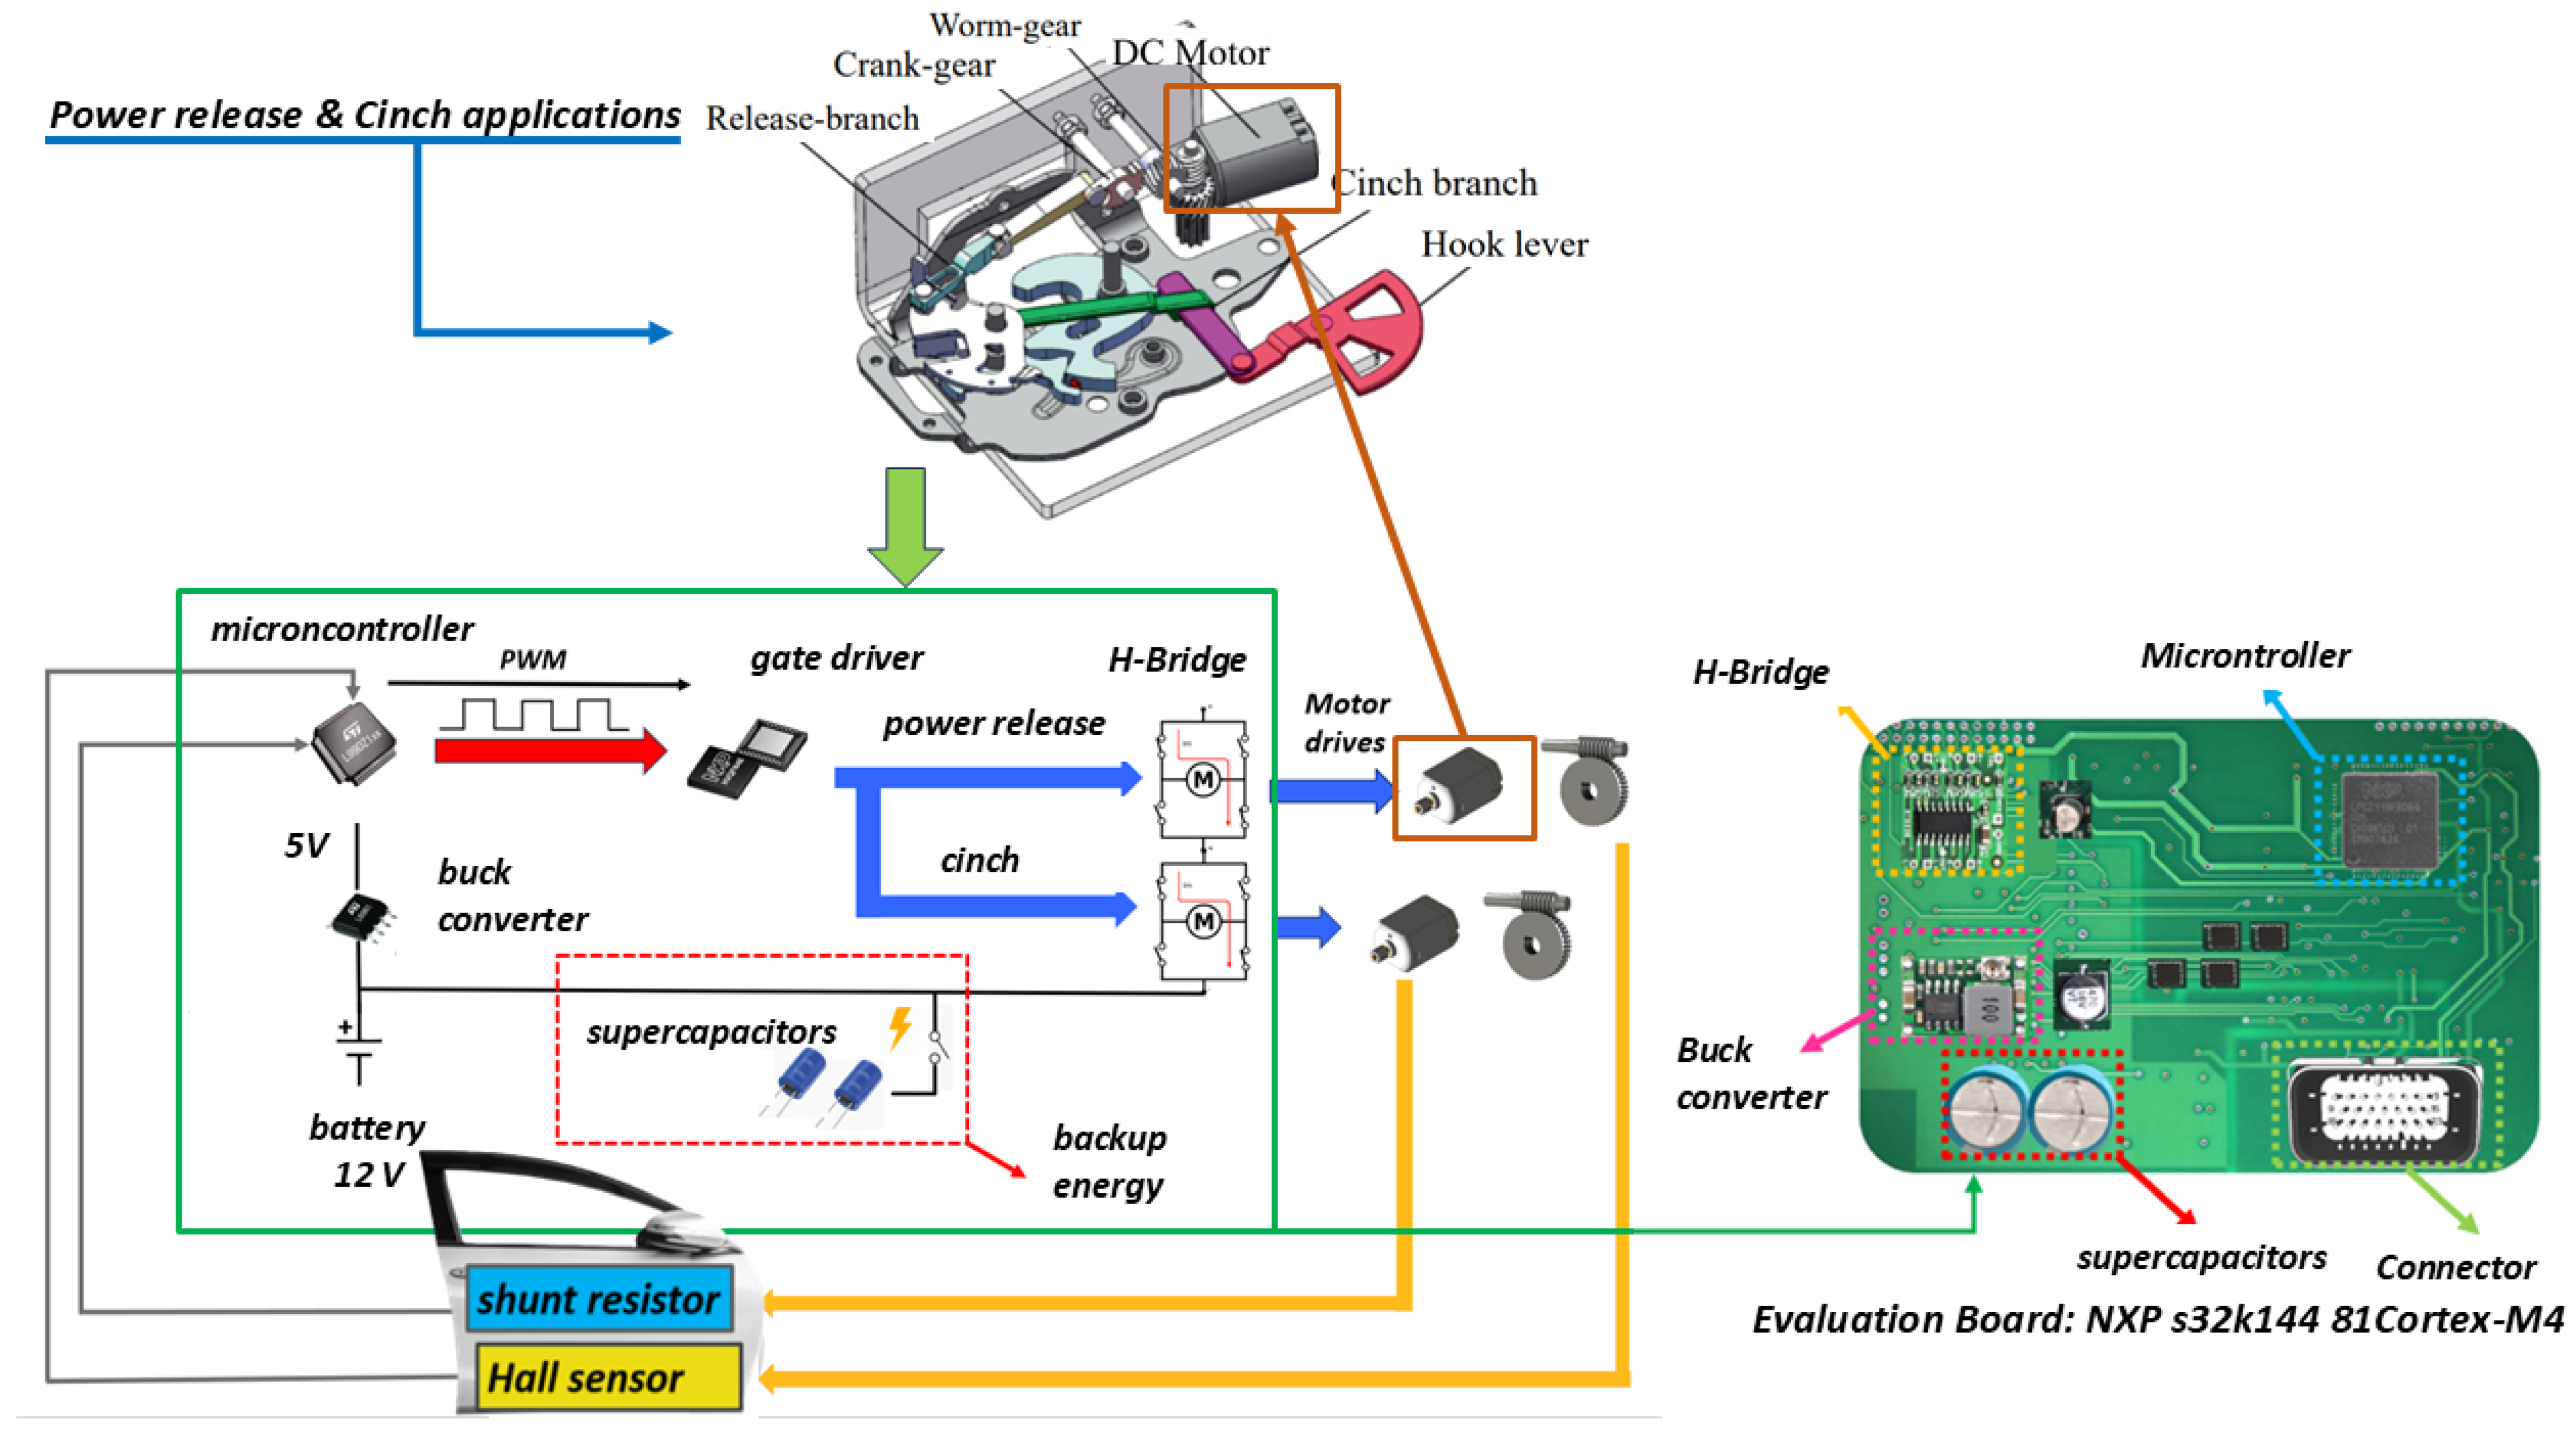
2. System Overview and Electro-Thermal Modeling

The system analyzed is a smart latch designed for medium-range vehicles, with its main components illustrated in Figure 1. The system includes two power supply branches: a 12 V battery for normal operation and a 9 V supercapacitor system (two 12 F, 4.5 V super-caps in parallel) for critical scenarios when the door is blocked, such as when deformation of the sheet metal of the door prevents the passenger from opening it from the inside. The system features a step-down DC/DC converter to provide 5 V power to the microcontroller (an NXP-short for Next eXPerience Semiconductors N.V. is a Dutch semiconductor company headquartered in Eindhoven, The Netherlands—model s32k144 with microcontroller architecture Cortex-M4) [37,38]. Two H-bridges are controlled via a Gate Driver Unit (GDU): one for the Power Release (PR) motor and the other for the Cinch (CN) motor [39,40]. As previously mentioned, the PR mechanism is responsible for engaging or disengaging the car door latch, while the CN system controls the release or retraction of the door, preventing abrupt slamming. These two functions operate hierarchically, with PR and CN interacting coordinately. The same drive typology is employed for both the PR and CN motors. Figure 1 illustrates the initial architecture of the electric drive, highlighting the modulation systems, the DC electric motors, and the control loops corresponding to each system (Power Release and Cinch). However, the control loops used for the available systems differ: in the Power Release system, the DC motor stop is controlled by a Hall effect position sensor, whereas in the Cinch system, control is achieved through a current feedback signal via a shunt resistor. Both signals serve as inputs to the microcontroller [28,41].
In this system, only the power drives and their control logic are modeled, excluding the components of the power supply to the H-bridge. This choice is motivated by the fact that the DC-DC converter exhibits a much faster dynamic compared to that of the downstream part of the system, and its behavior is represented by a stable second-order transfer function. The battery, on the other hand, is modeled as a constant voltage source since its influence is negligible due to the short operating time of the drives.

2.1. The Parameters and Specifications of the System

The complete set of parameters characterizing the system is not fully available a priori and will be determined through a simulation-based approach. These unspecified parameters must be identified within the operational boundaries established in Table 1, which specifies the nominal power supply voltages and maximum action times for all four working modes.
Table 2 reports the known operating parameters for both DC motor systems. However, some quantities remain unknown and must be identified to enable a complete description of the model. These include the armature inductances L a , the motor inertia J mot , and the viscous friction coefficients f. In addition, all of the thermal parameters governing the motor’s operation require experimental determination.
Figure 2 and Figure 3 present the measured characteristic curves of the DC motors employed in the Power Release (PR) and Cinch (CN) devices, respectively, which serve as the basis for this parameter estimation process.
The mathematical formulation used to model the DC motors in the proposed systems is presented below: Equation (1) represents the dynamic equilibrium of the equivalent electric circuit, where V a denotes the armature voltage, I a is the current absorbed by the armature windings, R a is the electrical resistance of the windings, and e is the electromotive force back (due to mechanical rotation). Equation (2) reports the mechanical rotation balance, where T m is the electromagnetic torque (generated as a result of the absorbed current), T l is the load torque, and T f ( ω ) represents the friction torque model included to account for the nonlinearities and dynamic effects typically encountered during the motor’s operation.
V a = R a I a + L a d I a d t + e
J m o t d ω d t = T m T l T f ( ω )
T f ( ω ) = 2 e ( T brk T c ) e ( ω ω st ) 2 ω ω st + T c tanh ( ω ω Coul ) + f ω
Equation (3) combines several components that reflect different aspects of mechanical friction. The first term 2 e ( T brk T c ) e ( ω ω st ) 2 ω ω st represents Stribeck friction, which models the transition from static to dynamic friction. The second term T c tanh ( ω ω Coul ) represents the Coulomb friction, modulated by the hyperbolic tangent function tanh, which varies with the angular velocity of the system divided by ω Coul , a characteristic velocity for Coulomb friction. The third term f ω represents the viscous friction, proportional to the angular velocity of the system and multiplied by the viscous friction coefficient f. This model is critical in controlling friction in mechanical systems, helping to improve the accuracy and efficiency in control systems such as robotics, power transmission, and actuators.
The remaining parameters in Equation (3) include T C o u l , which refers to the friction value of the Coulomb torque, and T b r k , which is related to the breakaway torque. As for the speeds, the respective values ω s t , which corresponds to the speed at which Stribeck friction ceases, and ω b r k , which corresponds to the speed at which the breakaway friction occurs, are also included.

2.2. Evaluations and Considerations for the Electro-Mechanic Parameters

To determine the various parameters of the model using a design-by-analogy approach, the values of J m o t and L a were directly selected based on DC motors with a similar geometry, power, mass, and electrical resistance. Given these considerations, the inertia and armature inductance of comparable motors are expected to fall within a narrow range for a given power, geometry, and mass [42]. Naturally, these values were chosen as initial estimates.
ω S t = ω b r k 2
ω C o u l = ω b r k 10
Subsequently, these parameters were chosen in a way that ensured ω b r k remained the only free parameter, as shown in Equations (4) and (5). To determine the friction parameters ω b r k , T c , T b r k , and f, both no-load and load tests were performed by applying different input voltages. Various parameters were observed to ensure consistency with the current, speed, and torque values from the graphs shown in Figure 2 and Figure 3. These parameter combinations were chosen by conducting simulations and adjustments using a trial-and-error procedure. The respective values determined through the simulations are reported in Table 3, highlighting the differences between the parameters estimated for the PR and CN systems.
These characteristics result from combining the a priori knowledge (provided by the manufacturer) shown in Figure 2 and Figure 3 and Table 2 with the dynamic model. Through an iterative fitting process, it was possible to obtain the model’s electro-mechanic parameters to replicate the realistic behavior of the two electric drives, as shown in Table 3.

2.3. The Thermal Parameters

To model the thermal behavior of the DC motor, a lumped parameter thermal network (LPTN) approach is adopted [43,44], as illustrated in Figure 4. In this model, the power dissipation in the windings due to Joule heating is given by P diss = R a I a 2 , while the iron losses P iron are neglected. Consequently, the equations governing the thermal parameters are expressed as follows:
C sw = c p , copper m copper + c p , iron m iron , C rm = c p , mag m mag , C ha , x = C ha , y = c p , aluminum m ha C ag = c p , air ρ air V air R sw = ln ( r w / r s ) 2 π K sw L sw , R ag = L ag N u · A g · K air , R rm = L rm K rm A rm , R ha , y = R ha , x = L ha K aluminum A ha
where r s and r w denote the shaft and winding radii, respectively. The Nusselt number, N u , is determined based on the Taylor number. The parameters V air and ρ air represent the air volume and density in the air gap, respectively. The temperature distribution of the DC motor is illustrated in Figure 4, while the corresponding thermal capacitances and resistances are detailed in Table 4 and Figure 4. Given the geometry of the DC motor, the thermal resistance of the rotor is modeled as cylindrical resistance, whereas all other resistances are treated as linear. Convective resistances to the external ambient are omitted from the model due to spatial constraints surrounding the installation location for the DC motor [45,46]. In this model, heat transfer is considered in two directions—along the x-axis and y-axis—while the axial heat flow is neglected. The parameters K sw , K air , K rm , and K aluminum represent the thermal conductivity values of copper, air, the magnet, and aluminum, respectively. The parameters A g , A rm , and A ha correspond to the base areas associated with the respective thermal resistances. Similarly, L sw , L a , L ag , and L a represent the longitudinal lengths of the thermal resistances related to the geometry of the DC motors. For the thermal capacitances C sw , C rm , C ha , x , and C ha , y , the specific heats at a constant pressure c p , i and the respective masses m i were used, where i denoted the material index.
Additionally, the armature resistance R a ( T ) varies with temperature T w i n d i n g ( t ) according to the equation R a ( T ) = R a 0 ( 1 + α ( T w i n d i n g ( t ) T a ) ) , where T a = 25   ° C denotes the ambient temperature, and R a 0 represents the initial resistance under standard conditions.
The thermal behavior of the MOSFETs in a single-phase DC drive inverter is crucial to determining their operational limits and ensuring reliability.
P t o t = R d s ( o n ) I d 2 P j o u l e + E s w ( o n ) + E s w ( o f f ) f s w P s w i t c h i n g + V g s Q G ( T O T ) f s w P d r i v e r
Equation (7) represents an estimation of the total power losses in a MOSFET during its operation in a power circuit. This expression includes three main components: (i) R d s ( o n ) I d 2 (Joule losses) represents the power dissipated due to the internal resistance of the MOSFET while conducting the current I d ; (ii) ( E s w ( o n ) + E s w ( o f f ) ) f s w (switching losses) represents the power dissipated during the turn-on and turn-off cycles of the MOSFET at a frequency f s w ; and (iii) V g s Q G ( T O T ) f s w (driver losses) represents the power dissipated by the MOSFET driver while supplying the necessary gate charge during switching cycles. Note that all the parameters necessary for a numerical estimate of the total dissipated power P t o t are made available by the manufacturer via the reference datasheet [47]. This equation is important for the design and optimization of electronic power systems, enabling minimization of the losses and improvement of overall system efficiency [48,49,50]. Additional power losses, such as those related to the equivalent series resistance (ESR), have not been considered, as the switching frequency of the H-bridge (10 kHz) is significantly lower than the range in which such effects typically become relevant in MOSFETs. Moreover, the magnetic losses in MOSFETs are negligible and thus have been omitted from the analysis.
Z t h ( t ) = i = 1 n R i 1 e t τ i T j ( t ) = P tot ( t ) · Z t h ( j c ) ( t ) + T ambient
Figure 5 represents the equivalent thermal circuit through which it is possible to estimate the junction temperature of the MOSFETs as a function of the power dissipated, the ambient temperature T a , and the thermal impedances Z t h , j c (between the junction and the houses) and Z t h , c a (between the houses and the environment). In Equation (8), a formal expression of the closed-form solution for the circuit model is given. The values of the thermal resistance R t h and the thermal capacity C t h components are reported in Table 5.
In the same case as that of the armature resistance of the DC motor, the drain–source resistance R D S ( o n ) of the MOSFETs was considered to be temperature-dependent on the junction temperature T j , following the parameter a = R D S ( o n ) / R D S ( o n , 25   ° C ) , as shown in Figure 6. In addition, the variation in the temperature of the case T c influences the percentage of dissipated power, indicated as P d e r and calculated using P d e r = ( P t o t % / P t o t , 25   ° C ) × 100 , as also reported in Figure 6. Finally, panel (c) of Figure 6 illustrates the gate–source voltage as a function of the total gate charge. All of these curves were obtained from the MOSFET datasheet. Table 6 reports the MOSFET parameters provided in the datasheet which were used to characterize both the thermal and electrical behavior of the component.

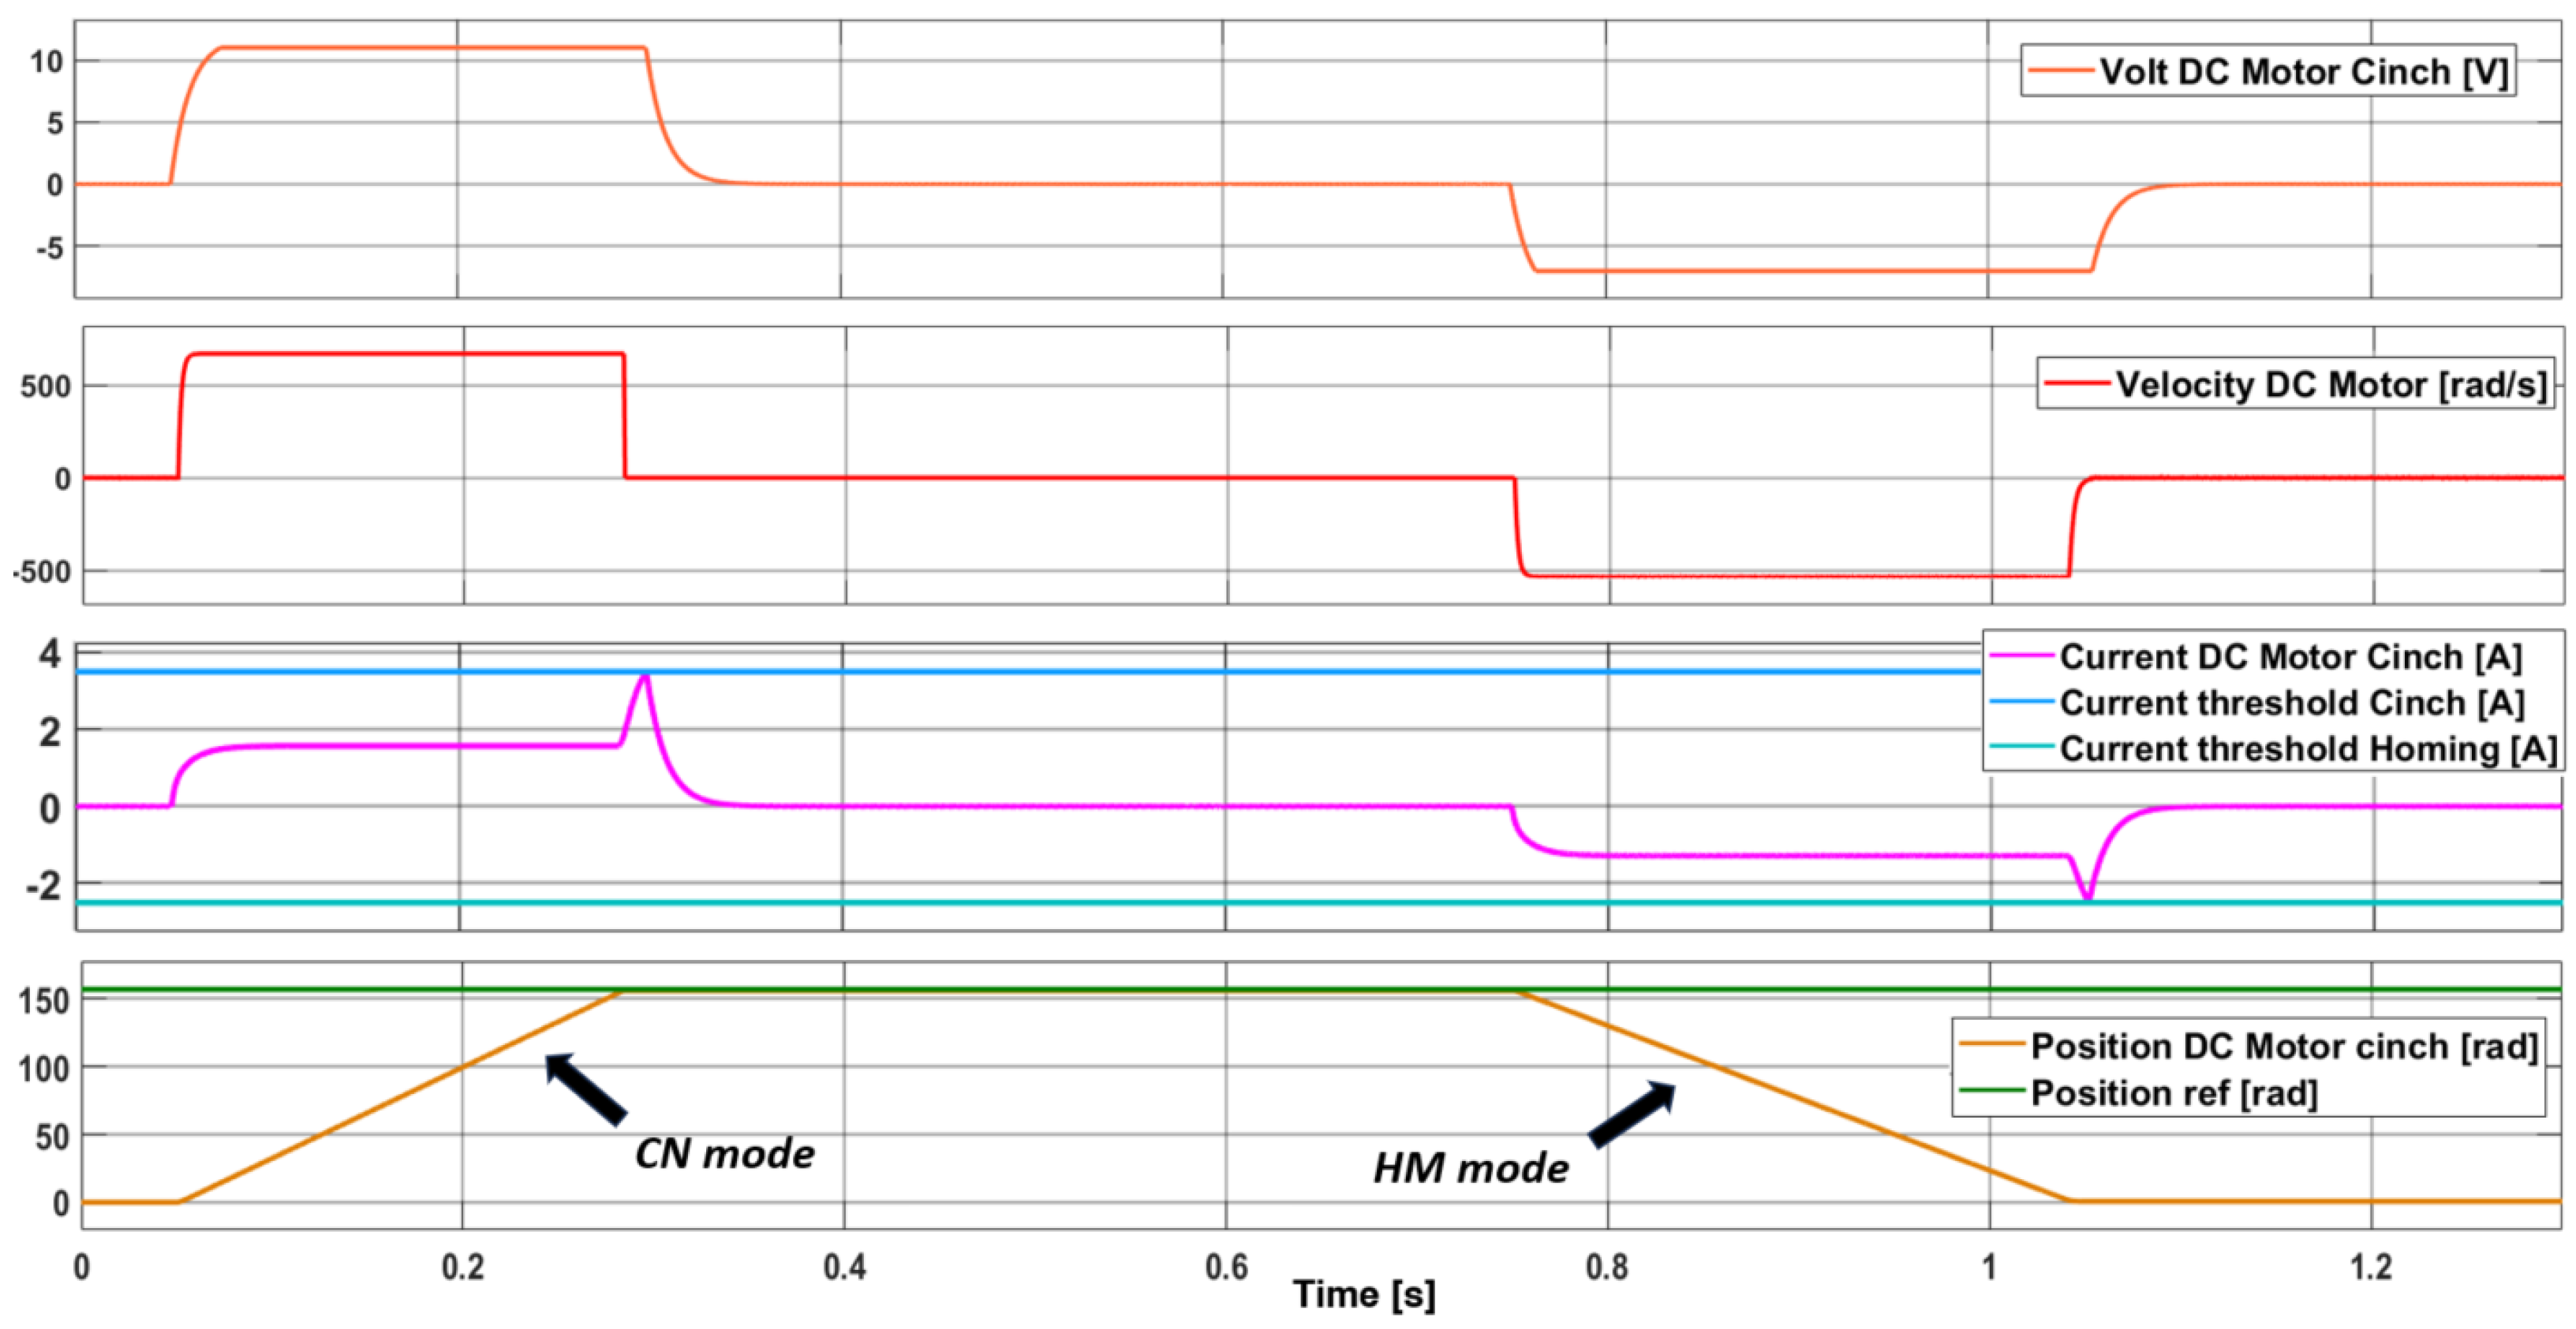
3. Single-Loop Motor Control

Figure 7 illustrates a single-loop motor control system, specifically the one associated with the Cinch system, where the feedback variable is the measured current. A similar structure is implemented for the Power Release system, with the feedback variable in this case being the position. The system is developed and simulated using the Simulink environment, as shown in Figure 8.
Figure 9 illustrates the operating logic of the Power Release system, where the switch signal sw and the position signal from the Hall effect sensor POS_SENS are taken as the inputs, while the output y_volt consists of a PWM drive signal. In the PR model, the system receives feedback solely from a Hall effect position sensor such that when the system reaches the desired position, the position signal changes from a logical value of 0 to 1, and vice versa when performing the reverse operation. This identifies the end of stroke; see Figure 10. In the CN model, the feedback is provided by a current sensor (shunt), which operates so that once the end of stroke is reached, the current increases until it reaches a threshold value. Once the threshold value is reached, the microcontroller stops powering the DC motor through PWM, as shown in Figure 11. This sharp increase in the current is achieved by applying an end-of-stroke brake to the rotor.
Although the systems operate according to hierarchical logic, their behavior was analyzed independently in this study. The control logic for both systems was developed using StateFlow, which modeled the system’s behavior through state machines and flow charts within the Simulink environment. In the Cinch model, the feedback variable is instead represented by the current measured using the shunt resistor. The simulation times adopted for the models are 0.5 s for the Power Release model and 1.5 s for the Cinch model, while the corresponding execution times are reported in Table 7.

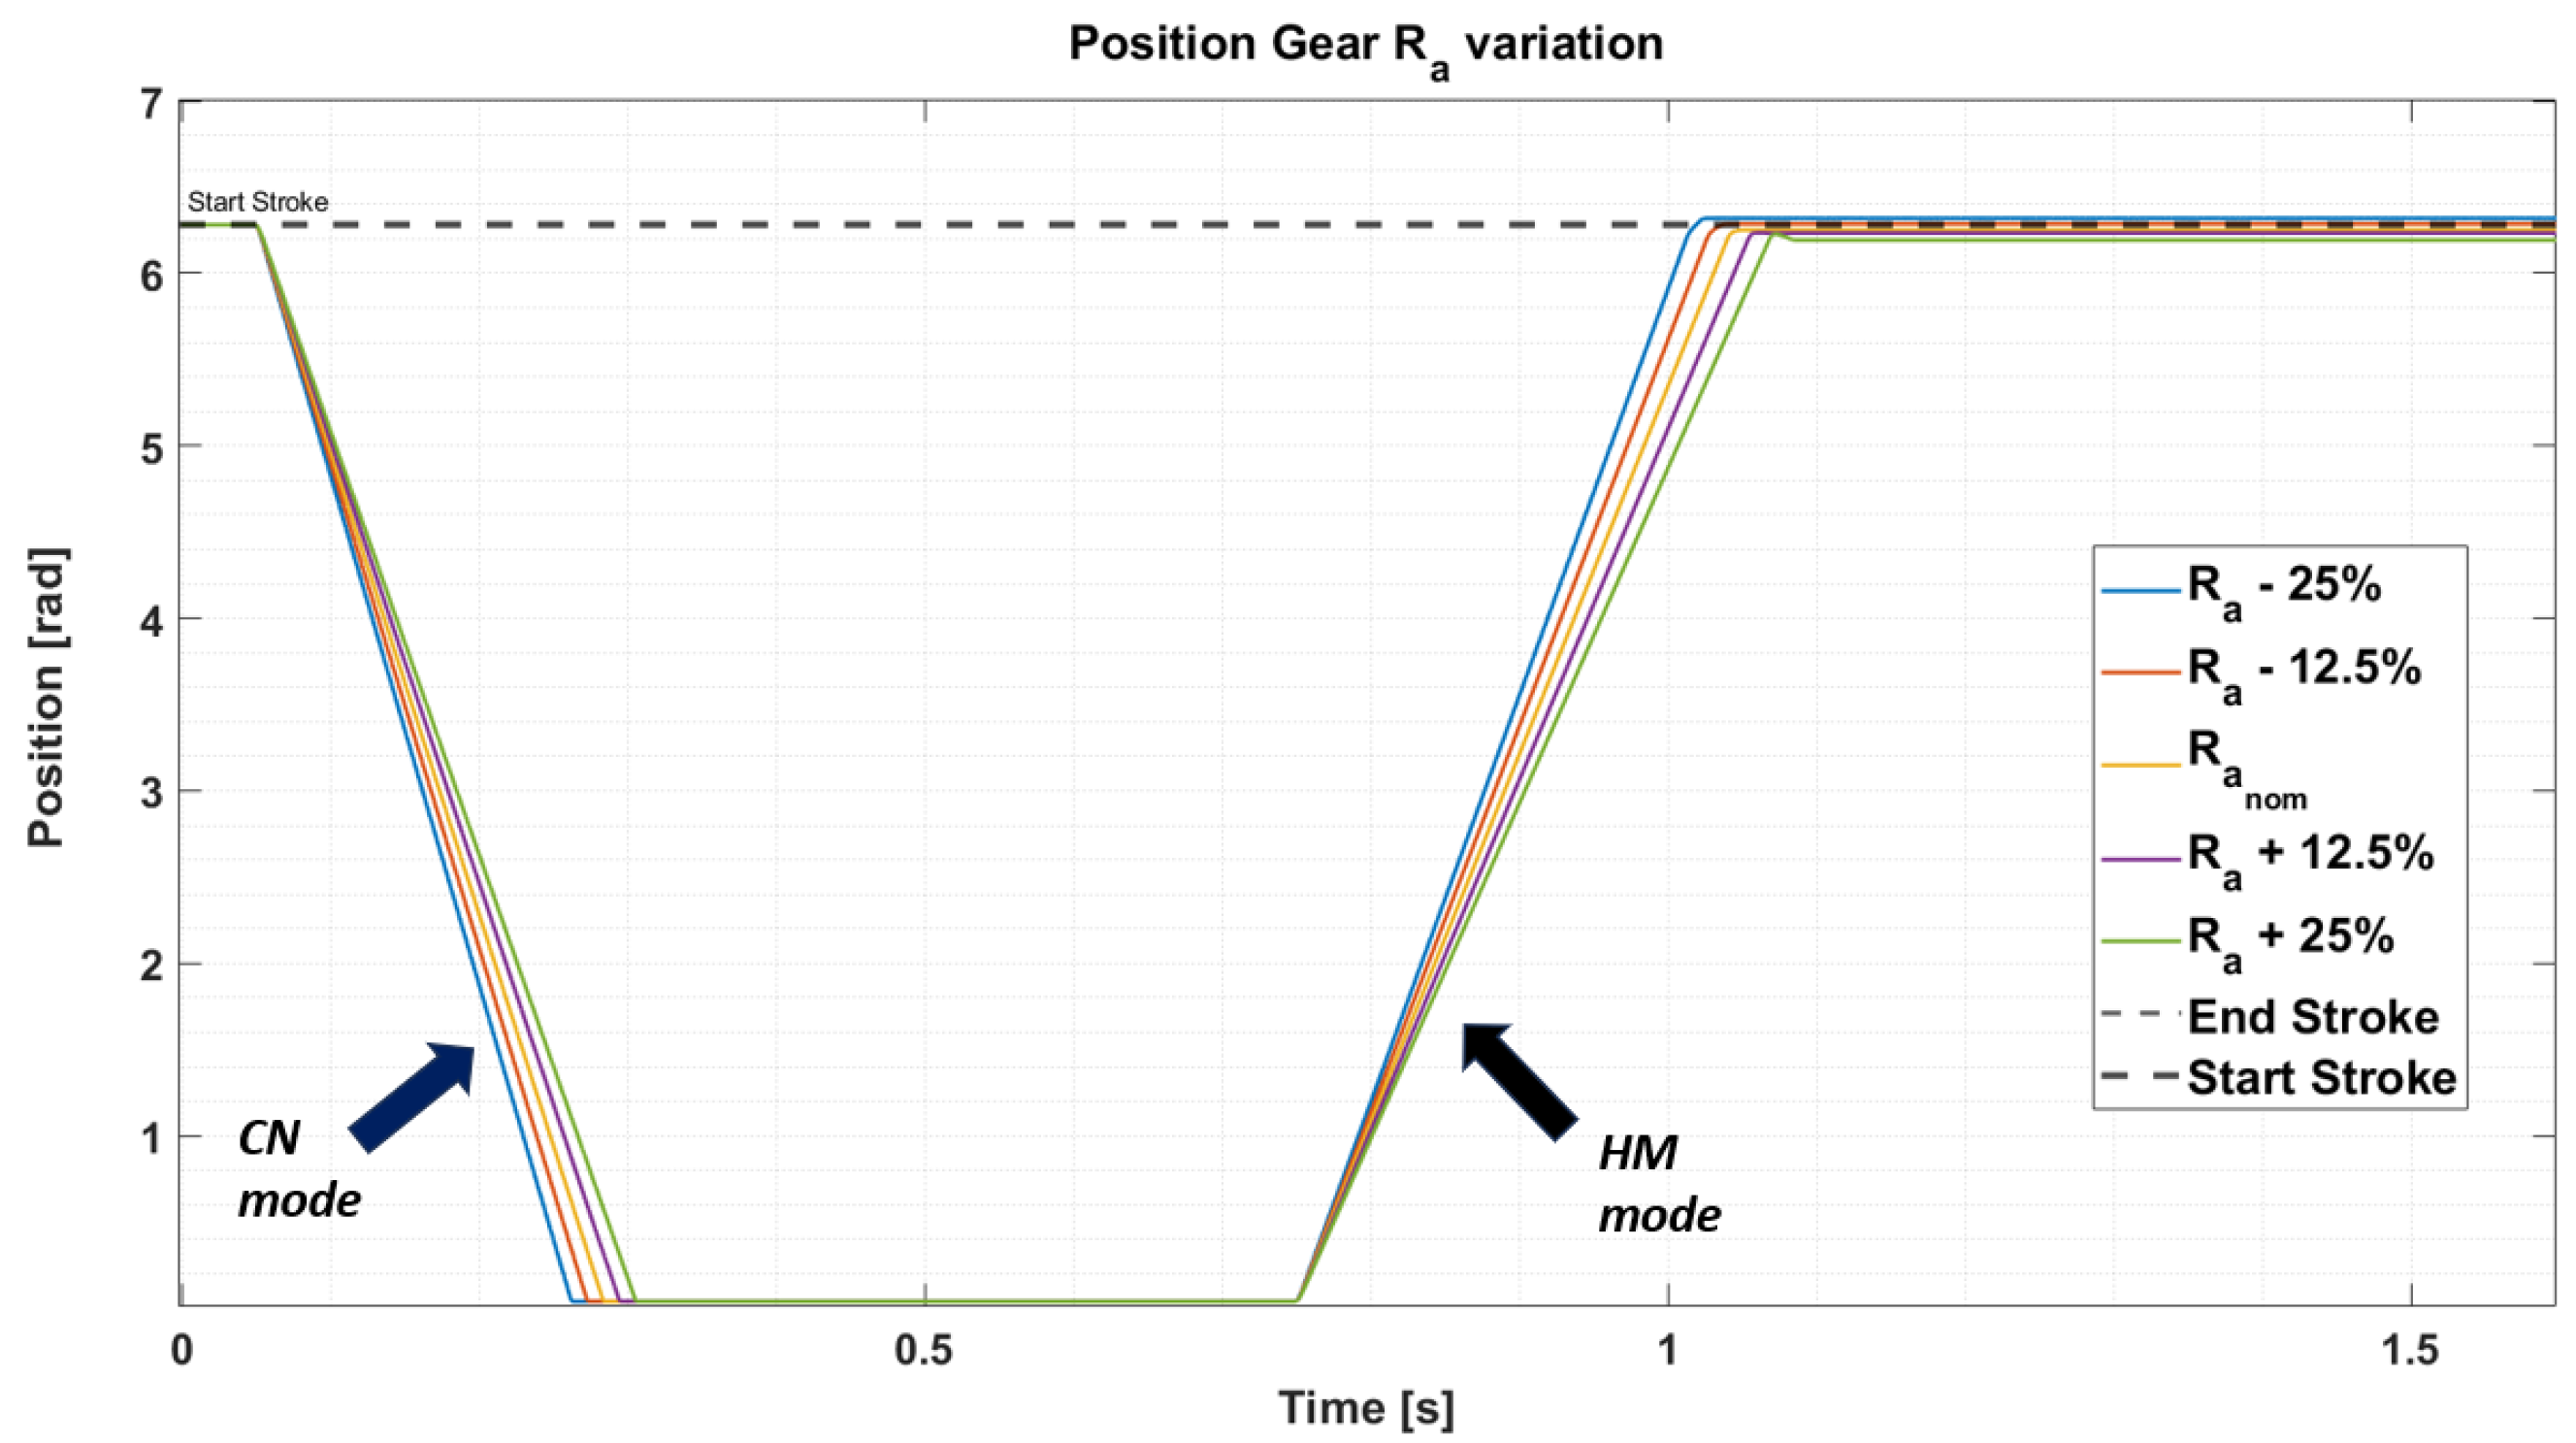
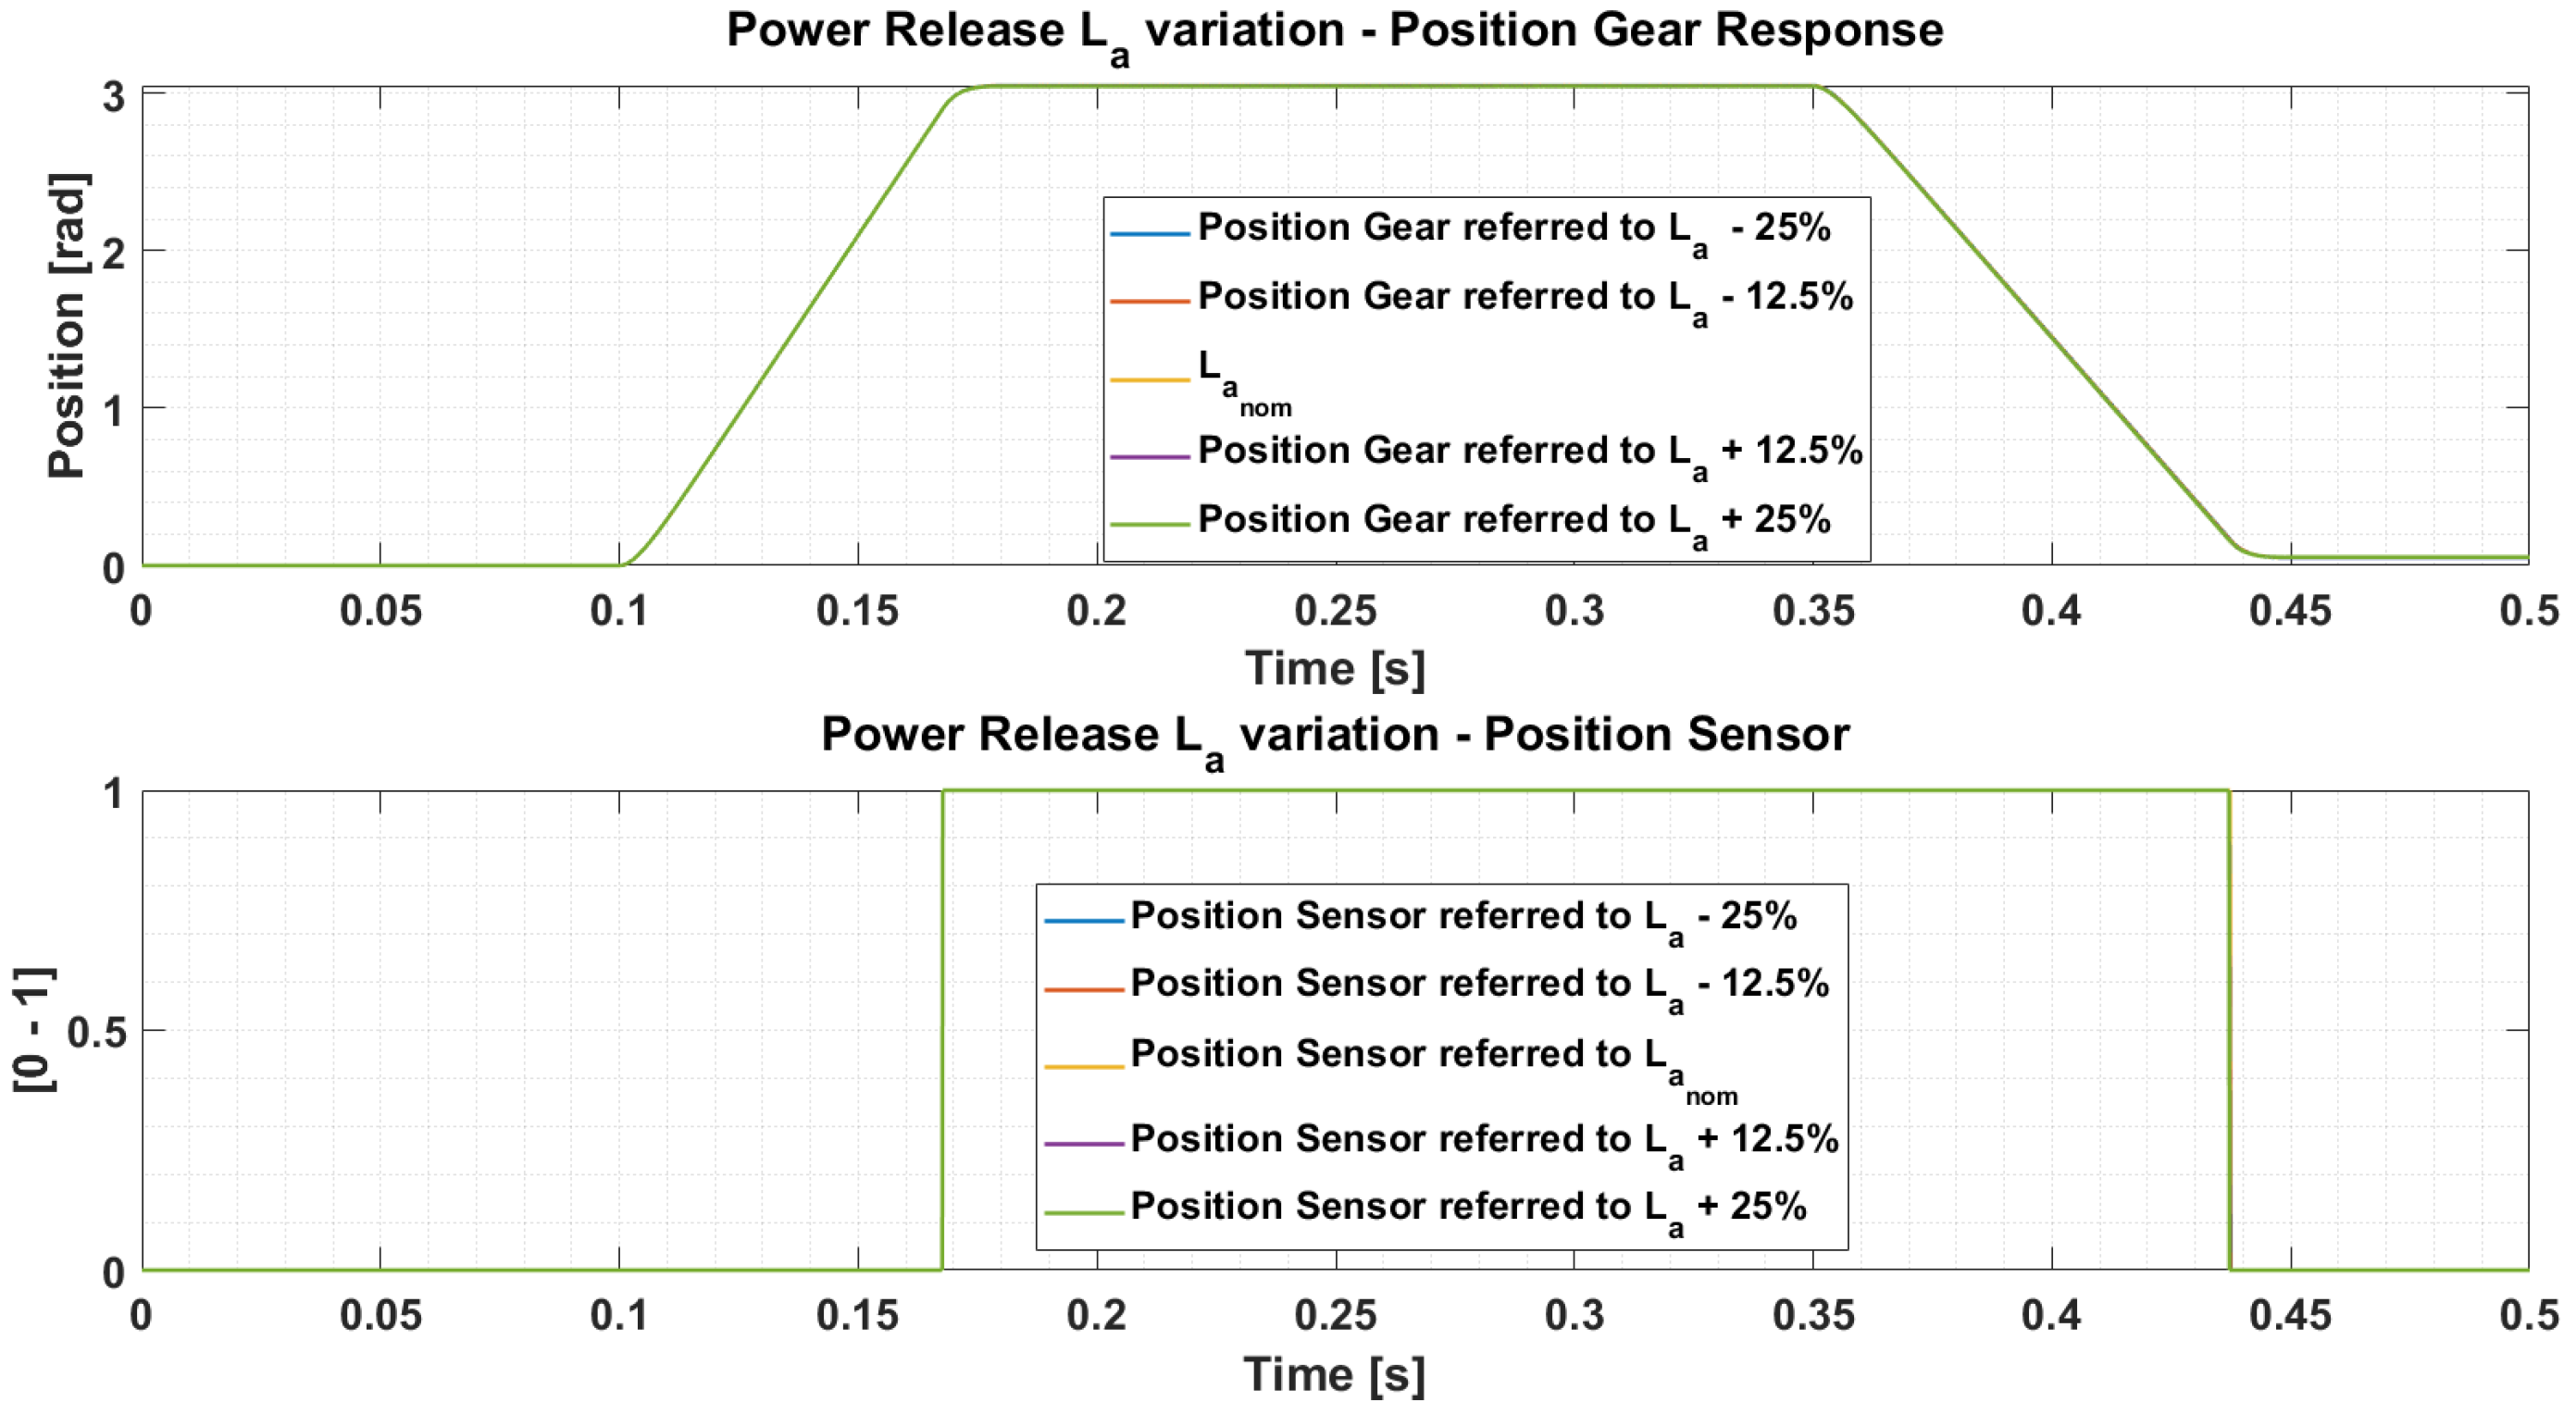
3.1. Analysis of the Robustness to Parametric Uncertainties

Uncertainties in the DC motor’s parameters are applied to both the PR and CN models to evaluate their ability to complete the operations within the timeframes specified by the technical requirements.
The robustness characteristics of the DC motor models under parametric uncertainties are evaluated for the case with a control loop, taking the ranges of variation in the parameters reported in Table 8 as a reference.
Figure 12, Figure 13 and Figure 14 show the effects of parametric variations on the parameters of the DC motors’ armature circuits for the CN system. In particular, the result of varying the inductance L a is much less significant than the effect of varying the stator resistance R a .
Similarly, parametric uncertainty analyses are conducted for the PR system. Figure 15, Figure 16 and Figure 17 illustrate the successful achievement of the target positions within the timeframes specified by the technical requirements despite variations in the parametric uncertainties (the simulation times used are the same as those for the previous Power Release model). Additionally, in the lower part of the graphs, it is possible to observe the logic of the Hall effect sensor, which switches from 0 to 1 upon reaching the end-of-stroke and vice versa in the opposite case.

3.2. The Robustness to Noise Disturbances and Delay Effects

Figure 18 and Figure 19 show robustness analyses of the CN system in the presence of additive current noise and a delay in the propagation of the current information, respectively. Within reasonable limits of such disturbances and uncertainties, the robustness of the one-loop control architecture is verified (the simulation times used are the same as those for the previous Cinch model).

4. Fault Analysis

4.1. A Simulation Analysis of Faults in the Hall Effect Sensor and Computation Errors in the Current Feedback

Fault models are simulated for both power drives. In the PR system, a failure is introduced into the Hall effect position sensor. This failure is modeled by altering the control logic. Specifically, the rotor of the DC motor reaches the end-of-stroke position and is held at the gear end. In Figure 20, the maximum current absorption is observed during the fault condition, with a peak of 4.6 A. This occurs because the blocked rotor position effectively acts as a brake on the system drive. In this scenario, the DC motor is powered at its maximum voltage (12 V) despite the motor speed dropping to zero and the position being blocked at the end of stroke. As a result, the microcontroller continues to supply power to the DC motor via PWM and the H-bridge.
Due to this fault in the sensor, the control logic is prevented from transitioning from state 0 to state 1, as shown in Figure 21.
In the case of a CN system failure, the microcontroller’s incorrect processing of the current signal from the shunt sensor is considered. In this failure scenario, despite the current reaching the threshold level, the control system continues to supply power to the DC motor via the H-bridge, even though the rotor has reached the end of its travel. The end of stroke is modeled as a brake that halts the DC motor’s speed in this fault scenario as well.
Figure 22 illustrates the DC motor’s variables. Although the current reaches the threshold, the system remains powered, leading to a peak in the current when the end position is reached. Figure 23 depicts the kinematic variables of the gear’s position and speed, highlighting the locking of the gear once the end of stroke is reached.

4.2. Analysis of Thermal Effects Under Fault Conditions

In Figure 24, the maximum power absorbed by the DC motors in the Power Release and Cinch systems with a locked rotor can be observed. Both systems draw their maximum current— 4.6 A for the Power Release system and 4.1 A for the Cinch system—when supplied at their maximum nominal voltages of 12 V for the Power Release system and 11 V for the CN system. During power absorption, a drop in the absorbed power can be noticed due to the increase in the electrical resistance, which results from the thermal effects occurring in both systems, as shown in Equation (9).
P d i s s = V a 2 R a ( T ( t ) )
The profiles of the maximum absorbed power were determined based on the thermal characteristics observed in the lumped parameter thermal network models for both systems. Figure 25 shows the thermal transients of the DC motor parameters, while Figure 26 reports those for the MOSFETs. The maximum absorbed power levels are constrained by the maximum temperatures that can be reached in these systems, specifically ensuring that for the motors, T max < 120   ° C , and for the MOSFETs, T max < 175   ° C [51,52]. Based on these constraints, the profiles of the maximum power absorption and the maximum absorption times were determined through a trial-and-error process, preventing overheating, which could lead to device failure. From the results of the thermal transients shown in Figure 25 and Figure 26, the maximum operating times without causing the DC motor to overheat were determined to be 7 s for the Power Release system and 9 s for the Cinch system. These times were identified by analyzing the thermal transients obtained from the lumped parameter thermal network models of the DC motors, as the temperatures reached in the MOSFETs were significantly lower than those in the DC motors.
The monitored temperatures were T winding , referring to the winding temperature of the DC motors, and the junction temperature T j for the MOSFETs.

5. PIL Simulations for One-Loop Control Systems

A further analysis is performed to validate the results obtained across continuous time for one-loop control systems. In this case, discrete mathematical models of the PR and CN systems are interfaced with an evaluation board (EVB) facilitating a processor-in-the-loop (PIL) [30,31]. For these types of simulations, an evaluation board is used, specifically the S32K144EVB-Q100, an NXP EVB for general automotive purposes, as shown in Figure 27. This board has an ARM Cortex M4F processor. The PIL method is employed to verify and validate the proposed ETDM system. Specifically, the simulated plant (the motor actuator) runs on the processor [23,24]. The C code for the control algorithm (originating from the switch that drives the DC motor block, as reported in Figure 8) needs to be validated; therefore, the C code when running on the microcontroller (EVB) executes the algorithm. The compiled code is downloaded to the embedded system (EVB) and executed on it [29]. The embedded system is then interfaced with the mathematical models (one-loop control models) running on the PC. The execution results on the embedded processor are monitored and compared with those from the previous continuous-time simulations. This process ensures that the code performs as expected within the target environment. The results of the PIL simulations are depicted in the following graphs, illustrating the performance of the one-loop control systems and the scenarios involving PR system failures in the Hall effect sensor. These graphs are superimposed onto those for the continuous-time models to facilitate a more precise comparison. The time step used for the PIL simulations is T s = 100   μ s .
Figure 28 shows the operation of the PR system in one loop across continuous time concerning the PIL simulation. In the graph, a slight delay is observed due to the temporal discretization of the PIL simulation. Overall, the PIL results demonstrate behavior similar to that previously simulated in continuous time (The simulation times used remain the same as those for the previously adopted Power Release and Cinch models. Table 9 reports the execution times for both models for each operating mode.).
Figure 29 illustrates the operation of the CN one-loop control system, where the PIL results demonstrate precise correspondence with the respective outputs of the continuous-time model’s variables. In this case, the effect of the delay introduced by temporal discretization is less pronounced.
Finally, Figure 30 shows the simulation in the case of a failure in the Hall effect position sensor, both in continuous time and for the PIL simulation. In the fault scenario, the rotor engaging through the gear reaches the end of stroke and repeatedly impacts it, preventing any further advancement. Even in this case, it is possible to achieve similar behavior overall. Moreover, since the fault scenario in the CN system is comparable to that in the PR system, the results of the PIL simulation related to the computation error for the current feedback in the CN system are also referenced in Figure 30.

6. Hardware Constraints in the Real World

The evaluation board used for the processor-in-the-loop (PIL) simulations is a development platform provided by NXP, featuring a 32-bit microcontroller based on the Arm Cortex-M4F core. This general-purpose microcontroller is well suited to automotive and industrial applications, operating at frequencies up to 112 MHz with 512 KB of Flash memory and 64 KB of RAM. These resources adequately support the execution of the control logic algorithms for both the Power Release and Cinch systems, including anomaly scenarios requiring enhanced data processing capabilities. As shown in Table 10, the computational requirements differ between models while remaining within the microcontroller’s capabilities.
In the PIL simulations, the host computer (an Intel Core i7-8750H, 12 cores, a 4.1 GHz max frequency) handles the compilation and facilitates Simulink-to-target communication. This configuration ensures a stable performance for both systems at the 100 µs simulation step common in real-time automotive applications [24]. While these simulations demonstrated computational efficiency, real-world Electronic Control Units (ECUs) may exhibit different performance characteristics, particularly under complex or high-load conditions. For comprehensive validation of the model-based design approach, Hardware-in-the-Loop (HIL) testing with replicated operational conditions and fault injection would be necessary to fully characterize the system behavior, especially regarding nonlinear effects.

7. Conclusions and Future Work

The approach proposed in this work provides a quick and efficient method for estimating the model’s initial parameters. Subsequently, the estimated parameters are integrated into the ETDM, and its performance is assessed relative to the system’s technical specifications. The robustness is then assessed by introducing parametric uncertainties into the DC motors (±25% variation in the motor parameters), along with noise and delays in the model, to determine whether the system consistently maintains compliance with the performance requirements. This robustness analysis provides an initial validation of the design. Fault scenarios are then characterized for both the Power Release and Cinch systems, which are part of the smart latch system. The use of the ETDM enables the correlation between the evolution of the electromechanical variables and the thermal behavior of the DC motors and the MOSFETs to be assessed [21,22]. These scenarios identify critical transient behaviors and allow for validation against similar systems to ensure consistency with the physical operation, defining the maximum allowable timeframes before the DC motors may potentially overheat or fail [51,52]. Finally, the PIL method validates the proposed ETDM by executing the algorithm’s control logic directly on the microcontroller, ensuring the correct embedded implementation [24,29].
The proposed model design procedure highlights the ease of executing the simulations, as the ETDM relies on lumped parameter models and trial-and-error techniques. This significantly reduces the design time, especially in the parameter estimation phases, where measurement instruments or test rigs are typically required. By adopting modeling through lumped parameters, such as lumped parameter thermal networks (LPTNs) [23,44], the simulation times are decreased further, while trial-and-error strategies remove the need for complex data acquisition and identification methods. Such a method is well suited to industrial applications that require rapid development cycles and cost-effective solutions [53,54]. The resulting model can serve as a preliminary prototype of a DT of the target system [33,34,35]. Validation of the control logic in the presence of real-world system failures requires a measurement campaign in which various products are subjected to operational stress. For modern companies, particularly in the automotive sector, this involves additional costs and an extension of the time-to-market, which are often considered unacceptable. These are the reasons why a model-based approach is increasingly required to complement complex tests, such as fault management and fault-tolerant control logic. In fact, this work proposes an analysis based on a dynamic electro-thermal model in which fault injections are performed according to the most realistic possible modeling of anomalies, allowing the reliability of the overall system to be validated. In future developments, further analyses will certainly be conducted, trying to recreate failure situations in a laboratory environment through an HIL approach in which it is possible to experimentally monitor a DC motor while still making it interact with a simulation to induce anomalous behavior without stressing the physical system. Although simple, this method builds on data from the scientific literature and similar existing products, offering an effective, fast, and low-cost framework aiming to achieve benefits in industrial design processes [1,8]. This renders it particularly suitable for modeling established automotive subsystems where high precision is nonessential. The approach demonstrates the strongest applicability in non-safety-critical applications with inherent fault tolerance, such as mirror adjusters, window regulators, and wiper mechanisms—systems where robustness to parameter variations and disturbances can ensure their reliable operation despite modeling uncertainties. Its effectiveness is inherently tied to the availability of reliable reference data for comparable systems, as demonstrated in our case study of the 12 V smart latch. While it is not appropriate for safety-critical systems like ABSs or ESPs that require SIL certification nor for novel components like LiDAR systems, this framework offers significant advantages for the rapid development cycles in common electromechanical subsystems, where detailed physical modeling would be prohibitively time-consuming or costly.

Author Contributions

Conceptualization: P.D., D.N. and S.S.; Methodology: P.D., D.N. and S.S.; Software: P.D. and D.N.; Validation: P.D. and D.N.; Formal analysis: P.D. and D.N.; Investigation: P.D., D.N. and S.S.; Resources: P.D., D.N. and S.S.; Data curation: P.D., D.N. and S.S.; Writing—original draft: P.D. and D.N.; Writing—review and editing: P.D. and S.S.; Supervision: P.D. and S.S.; Project administration: S.S.; Funding acquisition: S.S. All authors have read and agreed to the published version of the manuscript.

Funding

This work was partially supported by Progetto PNRR CN 1 “Centro Nazionale per Simulazioni, calcolo e analisi dei dati ad alte prestazioni”, CUP I53C22000690001 Spoke 6 “Multiscale Modeling and Engineering Applications”; and by Ministero dell’Istruzione, dell’Università e della Ricerca within the Project FoReLab (Future-oriented Research Lab) winner of Dipartimenti di Eccellenza.

Data Availability Statement

The data that support the findings of this study are available from the corresponding author, P.D., upon reasonable request.

Conflicts of Interest

The authors declare no conflicts of interest.

References

  1. Hein-Pensel, F.; Winkler, H.; Brückner, A.; Wölke, M.; Jabs, I.; Mayan, I.J.; Kirschenbaum, A.; Friedrich, J.; Zinke-Wehlmann, C. Maturity assessment for Industry 5.0: A review of existing maturity models. J. Manuf. Syst. 2023, 66, 200–210. [Google Scholar] [CrossRef]
  2. Yang, J.; Liu, Y.; Morgan, P.L. Human-machine interaction towards Industry 5.0: Human-centric smart manufacturing. Digit. Eng. 2024, 2, 100013. [Google Scholar] [CrossRef]
  3. Yildiz, E.; Møller, C. Building a virtual factory: An integrated design approach to building smart factories. J. Glob. Oper. Strateg. Sourc. 2021, 14, 608–635. [Google Scholar] [CrossRef]
  4. Yildiz, E.; Møller, C.; Bilberg, A.; Rask, J.K. Virtual prototyping: Evaluating the digital twin based virtual factory for new product introduction. Complex Syst. Inform. Model. Q. 2021, 29, 1–16. [Google Scholar] [CrossRef]
  5. Salierno, G.; Leonardi, L.; Cabri, G. The future of factories: Different trends. Appl. Sci. 2021, 11, 9980. [Google Scholar] [CrossRef]
  6. Mourtzis, D.; Ong, S.; Wang, X.V.; Panopoulos, N.; Stark, R.; Wang, L. Modelling, Design and Simulation as-a-Service Based on Extended Reality (XR) in Industry 4.0. In CIRP Novel Topics in Production Engineering: Volume 1; Springer: Berlin/Heidelberg, Germany, 2024; pp. 99–143. [Google Scholar]
  7. Schumacher, A.; Nemeth, T.; Sihn, W. Roadmapping towards industrial digitalization based on an Industry 4.0 maturity model for manufacturing enterprises. Procedia CIRP 2019, 79, 409–414. [Google Scholar] [CrossRef]
  8. Kiefer, D.; Grimm, F.; Straub, T.; Bitsch, G.; Van Dinther, C.; Höllig, J. Speeding up CNC tool manufacturing: Implementing explainable AI for setup time reduction and production agility. Procedia CIRP 2024, 130, 982–987. [Google Scholar] [CrossRef]
  9. Špirková, S.; Straka, M.; Saniuk, A. VR Simulation and Implementation of Robotics: A Tool for Streamlining and Optimization. Appl. Sci. 2024, 14, 4434. [Google Scholar] [CrossRef]
  10. Akundi, A.; Lopez, V. A review on application of model based systems engineering to manufacturing and production engineering systems. Procedia Comput. Sci. 2021, 185, 101–108. [Google Scholar] [CrossRef]
  11. Bodendorf, F.; Franke, J. A machine learning approach to estimate product costs in the early product design phase: A use case from the automotive industry. Procedia CIRP 2021, 100, 643–648. [Google Scholar] [CrossRef]
  12. Dalla Vedova, M.D.; Germanà, A.; Berri, P.C.; Maggiore, P. Model-based fault detection and identification for prognostics of electromechanical actuators using genetic algorithms. Aerospace 2019, 6, 94. [Google Scholar] [CrossRef]
  13. Kukreja, A.; Chopra, P. Model-Based Fault Detection for Series Elastic Actuators. In Proceedings of the 2024 7th International Conference on Mechatronics, Robotics and Automation (ICMRA), Wuhan, China, 20–22 September 2024; pp. 178–182. [Google Scholar] [CrossRef]
  14. Liu, Y.; Chen, Z.; Wei, L.; Wang, X.; Li, L. Braking Sensor and Actuator Fault Diagnosis with Combined Model-Based and Data-Driven Pressure Estimation Methods. IEEE Trans. Ind. Electron. 2023, 70, 11639–11648. [Google Scholar] [CrossRef]
  15. Trabucco, B.; Geng, X.; Kumar, A.; Levine, S. Design-Bench: Benchmarks for Data-Driven Offline Model-Based Optimization. In Proceedings of the 39th International Conference on Machine Learning, Baltimore, MD, USA, 17–23 July 2022; Chaudhuri, K., Jegelka, S., Song, L., Szepesvari, C., Niu, G., Sabato, S., Eds.; Proceedings of Machine Learning Research (PMLR): New York, NY, USA, 2022; Volume 162, pp. 21658–21676. [Google Scholar]
  16. Liu, X.; Wang, J.; Ouimet, J.A.; Phillip, W.A.; Dowling, A.W. Membrane characterization with model-based design of experiments. In Computer Aided Chemical Engineering; Elsevier: Amsterdam, The Netherlands, 2022; Volume 49, pp. 859–864. [Google Scholar]
  17. Li, W.J.; Li, D.S.; Zhang, J.W. Model-Based Design and Experimental Validation of Control System for a Three-Level Inverter. Electronics 2022, 11, 1979. [Google Scholar] [CrossRef]
  18. Zhang, L.; Wang, C.; Tan, T.; Chen, L.; Xu, Y. Experimental verification of characteristic parameter analysis method for pipeline leak before break. In Proceedings of the Journal of Physics: Conference Series, Guangzhou, China, 22–23 May 2024; IOP Publishing: Bristol, UK, 2024; Volume 2842, p. 012001. [Google Scholar]
  19. Mazza, B.; Patanè, S.; Cordiano, F.; Giliberto, M.; Barletta, G.; Franco, G. Electrical overstress effect characterization on Power MOS Trenchfet and correlation with time dependent dielectric breakdown. Microelectron. Reliab. 2021, 125, 114351. [Google Scholar] [CrossRef]
  20. Dini, P.; Paolini, D.; Saponara, S.; Minossi, M. Leaveraging Digital Twin & Artificial Intelligence in Consumption Forecasting System for Sustainable Luxury Yacht. IEEE Access 2024, 12, 160700–160714. [Google Scholar]
  21. Xu, Y.; Zhang, Y.; Zeng, M.; Huang, X.; Wang, Z. An electrothermal coupling model for estimating the internal temperature of lithium-ion battery based on microthermal resistance method. Electrochem. Commun. 2024, 166, 107776. [Google Scholar] [CrossRef]
  22. Zajac, P. Compact Thermal Modelling Tool for Fast Design Space Exploration of 3D ICs with Integrated Microchannels. Energies 2020, 13, 2217. [Google Scholar] [CrossRef]
  23. He, J.; Hosen, M.S.; Youssef, R.; Kalogiannis, T.; Van Mierlo, J.; Berecibar, M. A lumped electro-thermal model for a battery module with a novel hybrid cooling system. Appl. Therm. Eng. 2023, 221, 119874. [Google Scholar] [CrossRef]
  24. Dini, P.; Saponara, S. Processor-in-the-Loop Validation of a Gradient Descent-Based Model Predictive Control for Assisted Driving and Obstacles Avoidance Applications. IEEE Access 2022, 10, 67958–67975. [Google Scholar] [CrossRef]
  25. Gao, S.; Song, Y.; Chen, Y.; Yu, Z.; Zhang, R. Fast Simulation Model of Voltage Source Converters with Arbitrary Topology Using Switch-State Prediction. IEEE Trans. Power Electron. 2022, 37, 12167–12181. [Google Scholar] [CrossRef]
  26. Gurumurthy, S.K.; Mirz, M.; Amevor, B.S.; Ponci, F.; Monti, A. Hybrid Dynamic Phasor Modeling Approaches for Accurate Closed-Loop Simulation of Power Converters. IEEE Access 2022, 10, 101643–101655. [Google Scholar] [CrossRef]
  27. Yohanandhan, R.V.; Elavarasan, R.M.; Manoharan, P.; Mihet-Popa, L. Cyber-Physical Power System (CPPS): A Review on Modeling, Simulation, and Analysis with Cyber Security Applications. IEEE Access 2020, 8, 151019–151064. [Google Scholar] [CrossRef]
  28. Saponara, S.; Saletti, R.; Fanucci, L.; Roncella, R.; Marlia, M.; Taviani, C. Supercap-based energy back-up system for automotive electronic control units. In Applications in Electronics Pervading Industry, Environment and Society; Springer: Cham, Switzerland, 2014; pp. 1–11. [Google Scholar]
  29. Mina, J.; Flores, Z.; López, E.; Pérez, A.; Calleja, J.H. Processor-in-the-loop and hardware-in-the-loop simulation of electric systems based in FPGA. In Proceedings of the 2016 13th International Conference on Power Electronics (CIEP), Guanajuato, Mexico, 20–23 June 2016; IEEE: Piscataway, NJ, USA, 2016; pp. 172–177. [Google Scholar]
  30. Krishna Srinivasan, M.; Daya John Lionel, F.; Subramaniam, U.; Blaabjerg, F.; Madurai Elavarasan, R.; Shafiullah, G.; Khan, I.; Padmanaban, S. Real-time Processor-in-Loop investigation of a modified non-linear state observer using sliding modes for speed sensorless induction motor drive in electric vehicles. Energies 2020, 13, 4212. [Google Scholar] [CrossRef]
  31. Tramacere, E.; Luciani, S.; Feraco, S.; Bonfitto, A.; Amati, N. Processor-in-the-loop architecture design and experimental validation for an autonomous racing vehicle. Appl. Sci. 2021, 11, 7225. [Google Scholar] [CrossRef]
  32. Liu-Henke, X.; Jacobitz, S.; Scherler, S.; Göllner, M.; Yarom, O.A.; Zhang, J. A Holistic Methodology for Model-based Design of Mechatronic Systems in Digitized and Connected System Environments. In Proceedings of the ICSOFT, Virtual Event, 6–8 July 2021; pp. 215–223. [Google Scholar]
  33. Wang, H.; Li, H.; Wen, X.; Luo, G. Unified modeling for digital twin of a knowledge-based system design. Robot. Comput. Integr. Manuf. 2021, 68, 102074. [Google Scholar] [CrossRef]
  34. Wang, Y.; Steinbach, T.; Klein, J.; Anderl, R. Integration of model based system engineering into the digital twin concept. Procedia CIRP 2021, 100, 19–24. [Google Scholar] [CrossRef]
  35. Friederich, J.; Francis, D.P.; Lazarova-Molnar, S.; Mohamed, N. A framework for data-driven digital twins of smart manufacturing systems. Comput. Ind. 2022, 136, 103586. [Google Scholar] [CrossRef]
  36. Schnürer, D.; Hammelmüller, F.; Holl, H.J.; Kunze, W. Offline digital twin synchronization using measurement data and machine learning methods. Mater. Today Proc. 2022, 62, 2416–2420. [Google Scholar] [CrossRef]
  37. Nayak, P.S.R.; Kamalapathi, K.; Laxman, N.; Tyagi, V.K. Design and Simulation Of BUCK-BOOST Type Dual Input DC-DC Converter for Battery Charging Application in Electric Vehicle. In Proceedings of the 2021 International Conference on Sustainable Energy and Future Electric Transportation (SEFET), Hyderabad, India, 21–23 January 2021; pp. 1–6. [Google Scholar] [CrossRef]
  38. Nayanasiri, D.; Li, Y. Step-down DC–DC converters: An overview and outlook. Electronics 2022, 11, 1693. [Google Scholar] [CrossRef]
  39. Salem, Q.; Liu, L.; Xie, J. Dual Operation Mode of a Transformerless H-Bridge Inverter in Low-Voltage Microgrid. IEEE Trans. Ind. Appl. 2019, 55, 5289–5299. [Google Scholar] [CrossRef]
  40. Kocabicak, Z.; Demir, U. Design and optimization of an electromechanical actuator for the latch of a foldable vehicle seat. Mater. Test. 2020, 62, 749–755. [Google Scholar] [CrossRef]
  41. Saponara, S.; Bove, A.; Baronti, F.; Roncella, R.; Saletti, R.; Dente, D.; Leonardi, E.; Marlia, M.; Taviani, C. Thermal, electric and durability characterization of supercaps for energy back-up of automotive ECU. In Proceedings of the 2013 IEEE International Symposium on Industrial Electronics, Melbourne, Australia, 19–21 June 2013; pp. 1–6. [Google Scholar] [CrossRef]
  42. McAdams, D.A.; Wood, K.L. A quantitative similarity metric for design-by-analogy. J. Mech. Des. 2002, 124, 173–182. [Google Scholar] [CrossRef]
  43. Ding, X.; Bhattacharya, M.; Mi, C. Simplified thermal model of PM motors in hybrid vehicle applications taking into account eddy current loss in magnets. J. Asian Electr. Veh. 2010, 8, 1337–1343. [Google Scholar] [CrossRef]
  44. Cao, Y.; Zhu, S.; Yu, J.; Liu, C. Thermal Analysis of Dual-Axis-Direction Hybrid Excitation Generator for Electric Vehicles. Energies 2022, 15, 3011. [Google Scholar] [CrossRef]
  45. Dimolikas, K.; Kefalas, T.D.; Karaisas, P.; Papazacharopoulos, Z.K.; Kladas, A. Lumped-parameter network thermal analysis of permanent magnet synchronous motor. In Materials Science Forum; Trans Tech Publications: Baech, Switzerland, 2014; Volume 792, pp. 233–238. [Google Scholar]
  46. Manana, M.; Arroyo, A.; Ortiz, A.; Renedo, C.; Perez, S.; Delgado, F. Field winding fault diagnosis in DC motors during manufacturing using thermal monitoring. Appl. Therm. Eng. 2011, 31, 978–983. [Google Scholar] [CrossRef]
  47. neXperia. BUK7K52-60E—Dual N-Channel 60 V, 45 mΩ Standard Level MOSFET. 2015. Available online: https://www.nexperia.com/products/mosfets/automotive-mosfets/BUK7K52-60E.html (accessed on 2 July 2024).
  48. Dini, P.; Saponara, S.; Chakraborty, S.; Hosseinabadi, F.; Hegazy, O. Experimental Characterization and Electro-Thermal Modeling of Double Side Cooled SiC MOSFETs for Accurate and Rapid Power Converter Simulations. IEEE Access 2023, 11, 79120–79143. [Google Scholar] [CrossRef]
  49. Dini, P.; Ariaudo, G.; Botto, G.; Greca, F.L.; Saponara, S. Real-time electro-thermal modelling and predictive control design of resonant power converter in full electric vehicle applications. IET Power Electron. 2023, 16, 2045–2064. [Google Scholar] [CrossRef]
  50. Dini, P.; Basso, G.; Saponara, S.; Romano, C. Real-time monitoring and ageing detection algorithm design with application on SiC-based automotive power drive system. IET Power Electron. 2024, 17, 690–710. [Google Scholar] [CrossRef]
  51. Colmenares, D.; Kania, R.; Liu, M.; Sitti, M. Characterization and Thermal Management of a DC Motor-Driven Resonant Actuator for Miniature Mobile Robots with Oscillating Limbs. arXiv 2020, arXiv:2002.00798. [Google Scholar]
  52. Shoujun, S.; Weiguo, L.; Peitsch, D.; Schaefer, U. Detailed design of a high speed switched reluctance starter/generator for more/all electric aircraft. Chin. J. Aeronaut. 2010, 23, 216–226. [Google Scholar] [CrossRef]
  53. Leng, J.; Sha, W.; Wang, B.; Zheng, P.; Zhuang, C.; Liu, Q.; Wuest, T.; Mourtzis, D.; Wang, L. Industry 5.0: Prospect and retrospect. J. Manuf. Syst. 2022, 65, 279–295. [Google Scholar] [CrossRef]
  54. Matt, D.T.; Pedrini, G.; Bonfanti, A.; Orzes, G. Industrial digitalization. A systematic literature review and research agenda. Eur. Manag. J. 2023, 41, 47–78. [Google Scholar] [CrossRef]
Figure 1. A schematic representation of the system under consideration.
Electronics 14 01962 g001
Figure 2. Characteristics of the PR DC motor V a = 13 V at 25   ° C .
Electronics 14 01962 g002
Figure 3. Characteristics for CN DC motor V a = 12 V at 25   ° C .
Electronics 14 01962 g003
Figure 4. An equivalent circuit for thermal modeling of the DC motor.
Electronics 14 01962 g004
Figure 5. Thermal circuit model for MOSFET temperature estimation.
Electronics 14 01962 g005
Figure 6. Graphical characterization of the MOSFET’s behavior: (a) normalized drain–source on-state resistance a = R D S ( o n ) / R D S ( o n , 25   ° C ) as a function of the junction temperature T j ; (b) normalized total power dissipation P d e r % versus the mounting base temperature T m b ; and (c) the gate–source voltage V G S as a function of the total gate charge Q G for V D S = 14 V and V D S = 48 V.
Electronics 14 01962 g006
Figure 7. A block diagram model of the Power Release and Cinch systems with closed-loop control.
Electronics 14 01962 g007
Figure 8. MATLAB/Simulink v2024b implementation used to model Power Release and Cinch systems.
Electronics 14 01962 g008
Figure 9. The control logic of the Power Release and Cinch systems, showing the input and output signals.
Electronics 14 01962 g009
Figure 10. The DC motor’s position, velocity, and current in single-loop PR motor control.
Electronics 14 01962 g010
Figure 11. DC motor position, velocity, and current in single-loop CN motor control with current threshold.
Electronics 14 01962 g011
Figure 12. The response of the gear position in the CN system to the uncertainty R a .
Electronics 14 01962 g012
Figure 13. The response of the gear position in the CN system to the uncertainty L a .
Electronics 14 01962 g013
Figure 14. The response of the gear position in the CN system to the uncertainty K t .
Electronics 14 01962 g014
Figure 15. The response of the gear position and the Hall effect sensor position for the PR system to the uncertainty R a .
Electronics 14 01962 g015
Figure 16. The response of the gear position and the Hall effect sensor position for the PR system to the uncertainty L a .
Electronics 14 01962 g016
Figure 17. The response of the gear position and the Hall effect sensor position for the PR system to the uncertainty K b .
Electronics 14 01962 g017
Figure 18. Current response of the DC motor to noise disturbance in the current sensor.
Electronics 14 01962 g018
Figure 19. The response of the current of the DC motor to a delay in the current sensor.
Electronics 14 01962 g019
Figure 20. The DC motor during the fault on Hall effect sensor in PR system.
Electronics 14 01962 g020
Figure 21. The gear response during the fault in the Hall effect sensor in the PR system.
Electronics 14 01962 g021
Figure 22. The DC variables during the fault in the current sensor in the CN system.
Electronics 14 01962 g022
Figure 23. The gear response during the fault in the current sensor in the CN system.
Electronics 14 01962 g023
Figure 24. The maximum power that DC motors can absorb in PR and CN systems before failing.
Electronics 14 01962 g024
Figure 25. The temperatures in DC motors for the related power dissipated in PR and CN systems.
Electronics 14 01962 g025
Figure 26. T j and T C represent the temperatures in the junction and case of the MOSFETs corresponding to the power dissipated during faults in the PR and CN systems.
Electronics 14 01962 g026
Figure 27. The PIL simulation procedure for testing one-loop control systems.
Electronics 14 01962 g027
Figure 28. Continuous-time vs. PIL simulation for PR one-loop control system.
Electronics 14 01962 g028
Figure 29. Continuous-time vs. PIL simulation for CN one-loop control system.
Electronics 14 01962 g029
Figure 30. Continuous-time vs. PIL simulation used to test the Hall sensor fault in the PR system.
Electronics 14 01962 g030
Table 1. A summary table of the operation of the PR and CN systems.
Mode of Operation Nominal VoltageTimeout
PR door close7 V 0.2 s
PR door reset (RS)12 V 0.15 s
CN door open11 V3 s
CN door homing (HM)8 V4 s
Table 2. Initial parameters for PR and CN DC motors.
SymbolsThermal ParametersPRCNUnit
R a armature resistance2.6112.701 Ω
K b back EMF constant8.2511.349mVs/rad
K t constant torque8.2511.349m-Nm/A
Table 3. The parameters estimated for the PR and CN DC motors based on the simulations, including the given parameters.
SymbolsThermal ParametersPRCNUnit
R a Armature resistance2.6112.701 Ω
L a Armature inductance 10 5 3 × 10 6 H
JRotor inertia 10 7 1.066 × 10 7 kgm2
K b Back EMF constant8.2511.349mVs/rad
K t Torque constant8.2511.349mNm/A
fViscous friction coefficient 1.532 × 10 8 10 8 Nms/rad
T b r k Breakaway torque0.1950.118mNm
T C o u l Coulomb friction torque0.1950.1165mNm
ω b r k Breakaway speed11rad/s
Table 4. Thermal parameter values for PR and CN DC motors.
SymbolsThermal ParametersPRCNUnit
R s w shaft–winding resistance6.256.64W/K
R a g convection thermal resistance in the air gap14.4315.35W/K
R r m rotor–magnet resistance25.2726.55W/K
R h a , x housing–air resistance, x-direction4.154.41W/K
R h a , y housing–air resistance, y-direction4.154.41W/K
C s w shaft–winding capacitance3.53.72J/K
C a g air gap capacitance0.010.011J/K
C r m rotor–magnet capacitance7.517.97J/K
C h a , x housing–air capacitance, x-direction4.524.78J/K
C h a , y housing–air capacitance, y-direction4.524.78J/K
α thermal coefficient for winding resistance 3.93 × 10 3 2.15 × 10 3 Ω / K
Table 5. Thermal parameters for MOSFETs in the inverter.
SymbolThermal ParameterValue
R t h , j c Junction-to-Case Thermal Resistance 1.031 W/K
R t h , c a Case-to-Sink Thermal Resistance 2.086 × 10 3 W/K
C junction Junction Thermal Capacitance 3.647 J/K
C case Case Thermal Capacitance 4.846 J/K
Table 6. The fundamental parameters reported in the MOSFET datasheet.
SymbolDescriptionMinTypMaxUnit
R D S ( o n ) Drain–source on-state resistance3545m Ω
V G S ( t h ) Gate threshold voltage2.43.04.0V
Q G Total gate charge4.9nC
t on Turn-on delay time4.3ns
t off Turn-off delay time8.4ns
t rise Rise time5.1ns
t fall Fall time5.4ns
Table 7. The execution and timeout times for the different operating modes.
Mode OperationExecution TimeTimeout
Power Release—RS (Reset) Mode0.075 s0.15 s
Power Release—PR Mode0.1 s0.25 s
Cinch—CN Mode0.3 s3 s
Cinch—HM Mode0.35 s4.5 s
Table 8. Parametric variations in DC motor model for robustness analysis.
ParametersMinNominalMax
R a 2.023  Ω 2.701  Ω 3.376  Ω
L a 2.25 × 10 6  H 3 × 10 6  H 3.75 × 10 6  H
K t 8.512 mVs/rad11.349 mVs/rad14.186 mVs/rad
K b 8.512 mNm/A11.349 mNm/A14.186 mNm/A
Table 9. The execution and timeout times for the different operating modes related to the PIL simulations.
Mode OperationPIL Execution TimeTimeout
Power Release—RS Mode0.08 s0.15 s
Power Release—PR Mode0.1 s0.2 s
Cinch—CN Mode0.32 s3 s
Cinch—HM Mode0.37 s4 s
Table 10. Computational resource utilization for PR and CN control models related to PIL simulations.
MetricParameterPRCNUnit
FlashProgram memory usage5045KB
RAMData memory usage7.56KB
t step Execution time per step5550 μ s
Disclaimer/Publisher’s Note: The statements, opinions and data contained in all publications are solely those of the individual author(s) and contributor(s) and not of MDPI and/or the editor(s). MDPI and/or the editor(s) disclaim responsibility for any injury to people or property resulting from any ideas, methods, instructions or products referred to in the content.

