Article

Quality Assurance of the Whole Slide Image Evaluation in Digital Pathology: State of the Art and Development Results

1
AR/VR Laboratory, John von Neumann Faculty of Informatics, Obuda University, 1034 Budapest, Hungary
2
Image Analysis Department, 3DHISTECH Ltd., 1141 Budapest, Hungary
3
Applied Cyber-Medical Systems Research Team, Laboratory of Parallel and Distributed Systems, Institute for Computer Science and Control (SZTAKI), Hungarian Research Network (HUN-REN), 1518 Budapest, Hungary
4
BioTech Research Center, Obuda University, 1034 Budapest, Hungary
*
Author to whom correspondence should be addressed.
Electronics 2025, 14(10), 1943; https://doi.org/10.3390/electronics14101943 (registering DOI)
Submission received: 28 March 2025 / Revised: 8 May 2025 / Accepted: 9 May 2025 / Published: 10 May 2025

Abstract

:
One of the key issues in medicine is quality assurance. It is essential to ensure the quality, consistency and validity of the various diagnostic processes performed. Today, the reproducibility and quality assurance of the analysis of digitized image data is an unsolved problem. Our research has focused on the design and development of functionalities that can be used to greatly increase the verifiability of the evaluation of digitized medical image data, thereby reducing the number of misdiagnoses. In addition, our research presents a possible application of eye-tracking to determine the evaluation status of medical samples. At the beginning of our research, we looked at how eye-tracking technology is used in medical fields today and investigated the consistency of medical diagnoses. In our research, we designed and implemented a solution that can determine the evaluation state of a tomogram-type 3D sample by monitoring physiological and software parameters while using the software. In addition, our solution described in this paper is able to capture and reconstruct/replay complete VR diagnoses made in a 3D environment. This allows the diagnoses made in our system to be shared and further evaluated. We set up our own equations to quantify the evaluation status of a given 3D tomogram. At the end of the paper, we summarize our results and compare them with those of other researchers.

1. Introduction

1.1. Whole Slide Images and Quality Control in Digital Pathology

The production of digitized pathology samples is a complex task involving a number of interdependent processes [1,2,3,4]. The main stages of this process are shown in Figure 1. In order to obtain a sample that can be evaluated either by automatic image processing algorithms or by a physician, the process should always start with the biopsy sample. During this process, a tissue sample is taken from the area in question, which can then be examined digitally or with a microscope by a doctor/researcher. After biopsy sampling, the following steps are taken to digitize the sample:
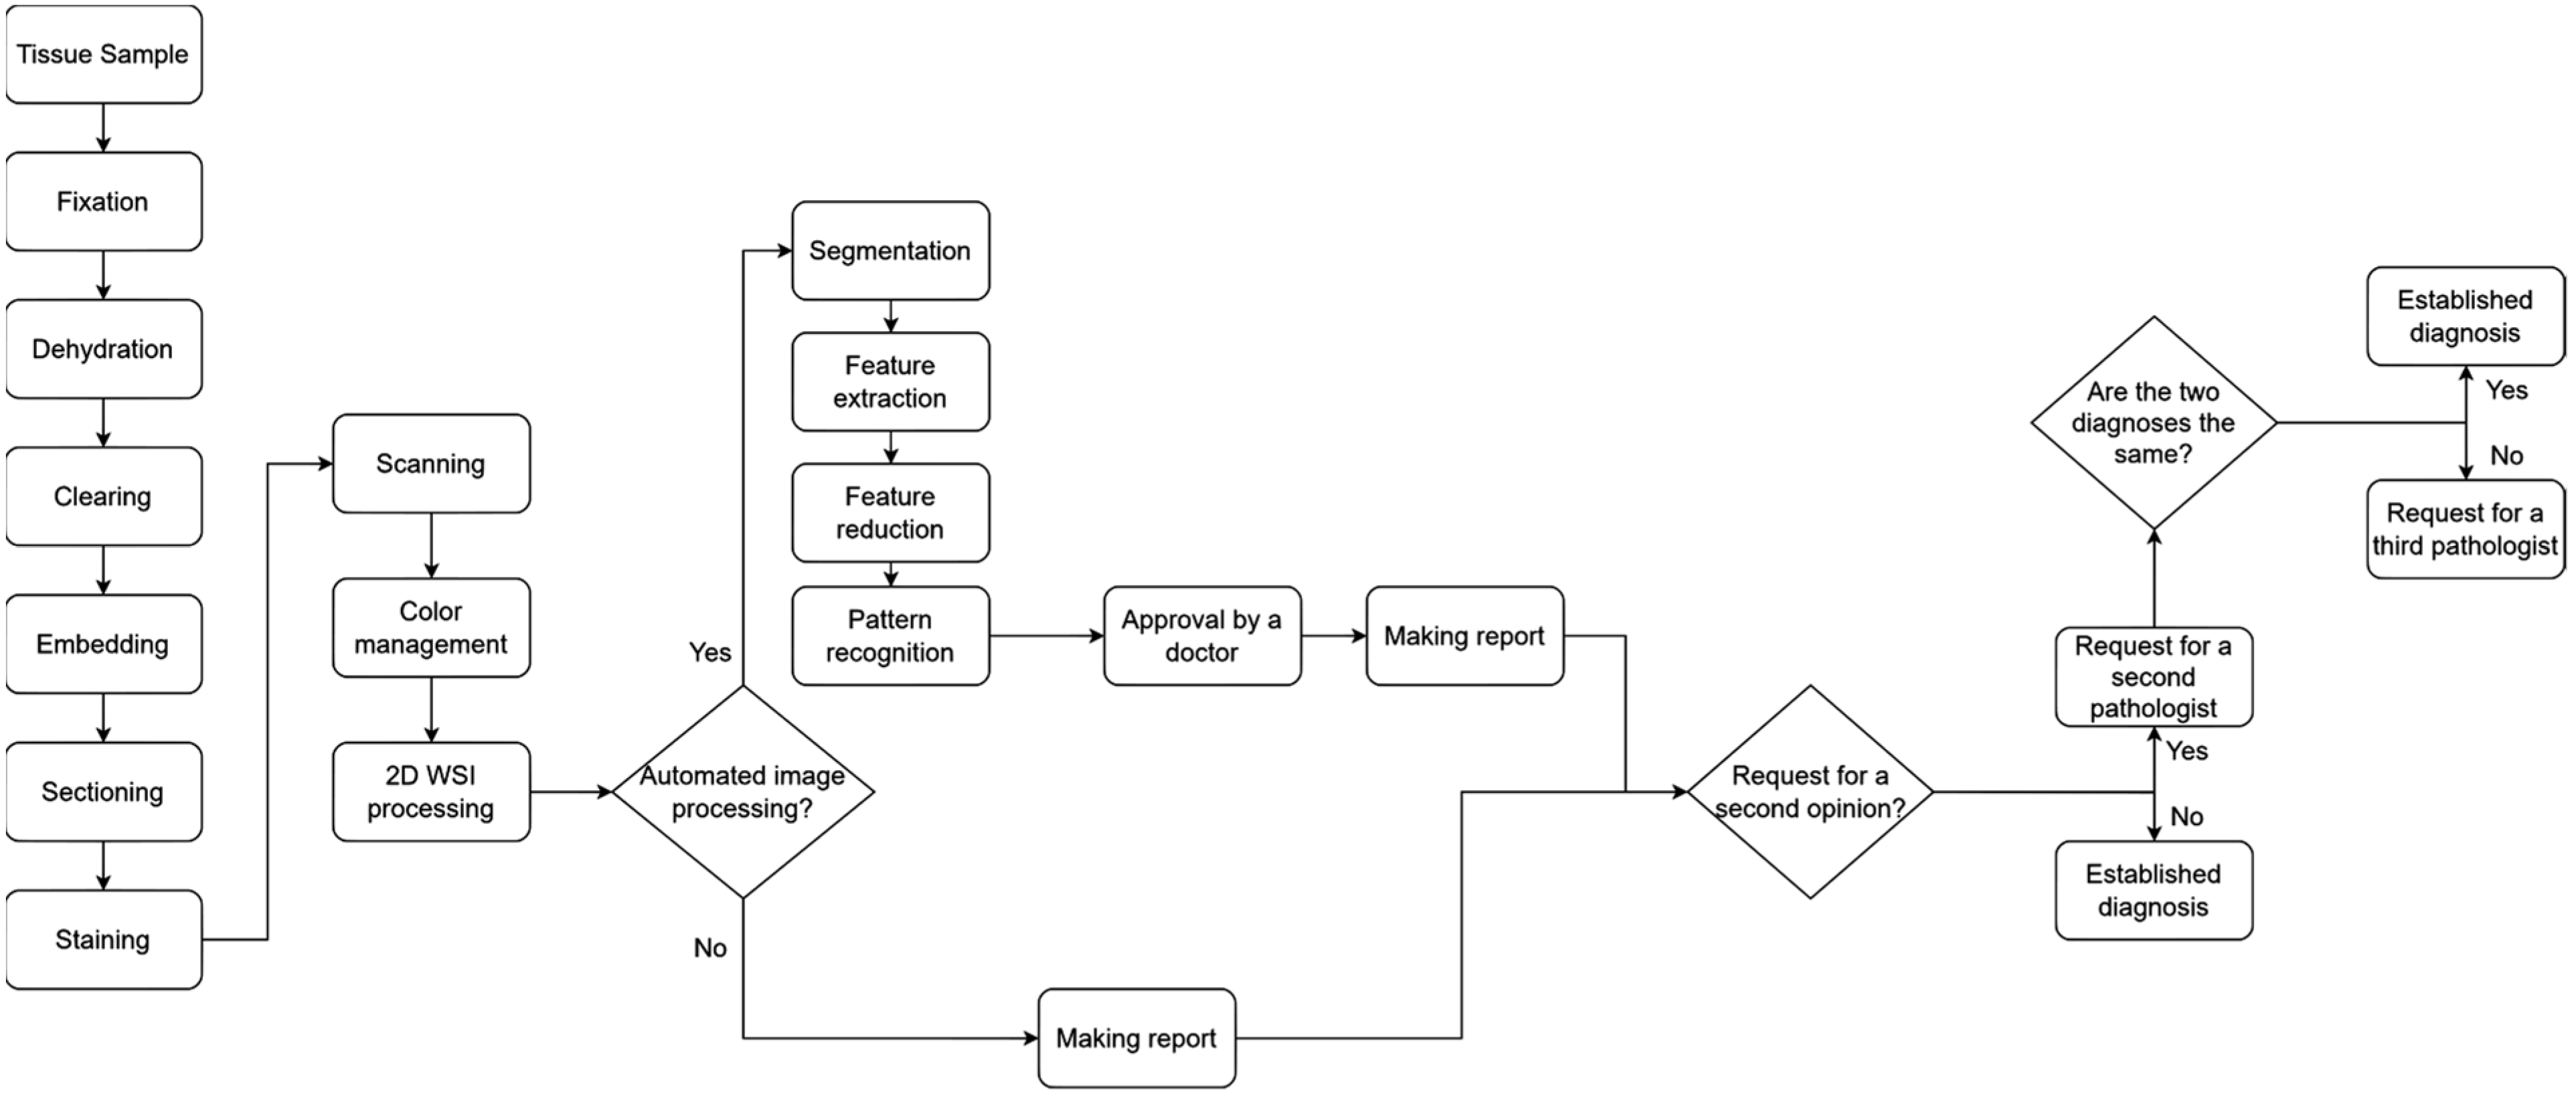
  • Fixation: In this step, various chemicals are used to fix the tissue structure in its natural shape. The practical purpose of fixation is to prevent or stop the degenerative processes that start when a tissue is deprived of blood supply. The most-used fixative is 10% neutral buffered formalin.
  • Dehydration: In this step, ethanol is added to the tissue sample. The water removed with ethanol causes the sample to harden, which supports the examination of the tissue samples with light microscopes.
  • Clearing: In this step, organic solvents are added to the sample to help remove ethanol and allow the wax to infiltrate the sample. One such solvent is xylene.
  • Embedding: In this step, the tissue sample is infiltrated with paraffin wax. This results in a paraffin block which, after hardening, allows thin slices (layers) to be cut from it.
  • Sectioning: In this step, the hardened sample is cut into layers using a microtome. The most commonly used layer thickness is 4–5 μm.
  • Staining: Most cells are transparent and therefore would not show up on examination. To avoid this, some staining material should be used to highlight features that are relevant to the current study. The most commonly used stain is hematoxylin and eosin (H&E).
The stained sample is digitized using so-called sample scanners, which produce high-resolution WSI (whole slide image) samples that can be evaluated with different image processing algorithms, shared over a network or archived in databases [5]. The appearance of image scanners allows software processing and the manipulation of digitized samples. An example of such manipulation could be the modification of the color space of the digitized sample. The digitization of biopsy samples allows for “manual” analysis of image data and the use of automated image processing algorithms.
Image pyramiding is an image processing technique in which an image is broken down into several levels of resolution to access different levels of detail. This technique is particularly useful in digital pathology [6], as the analysis of microscopic images often requires the quick visualization of details and the accurate identification of important structures [7]. The resolution of the WSI images can reach up to 100,000 pixels × 100,000 pixels and the size of one sample can exceed 3 GB. However, when making a diagnosis, doctors/researchers do not examine “just” one such sample, but a whole series of samples, which may consist of thousands of samples with the resolution mentioned above. Today, it is a major challenge to visualize a complete pathological serial section in 3D at native resolution [8,9,10,11]. The main reason for this difficulty is the number of samples and the resolution of each sample. To be able to visualize even a single sample at native resolution, it is common practice in the industry to use the so-called image pyramid technique [12,13].
One possible way of storing a high-resolution WSI image is to use a tiled pattern, where the entire image is stored in rectangular regions one after the other. This can be seen in Figure 2. Although it has a more complex structure, it provides direct access to these subregions. Tile size has a significant impact on the performance, and its optimal value is influenced by many factors. These can be the resolution of the viewer display and the size of the physical storage [14]. The image pyramid consists of three main parts. These are the following:
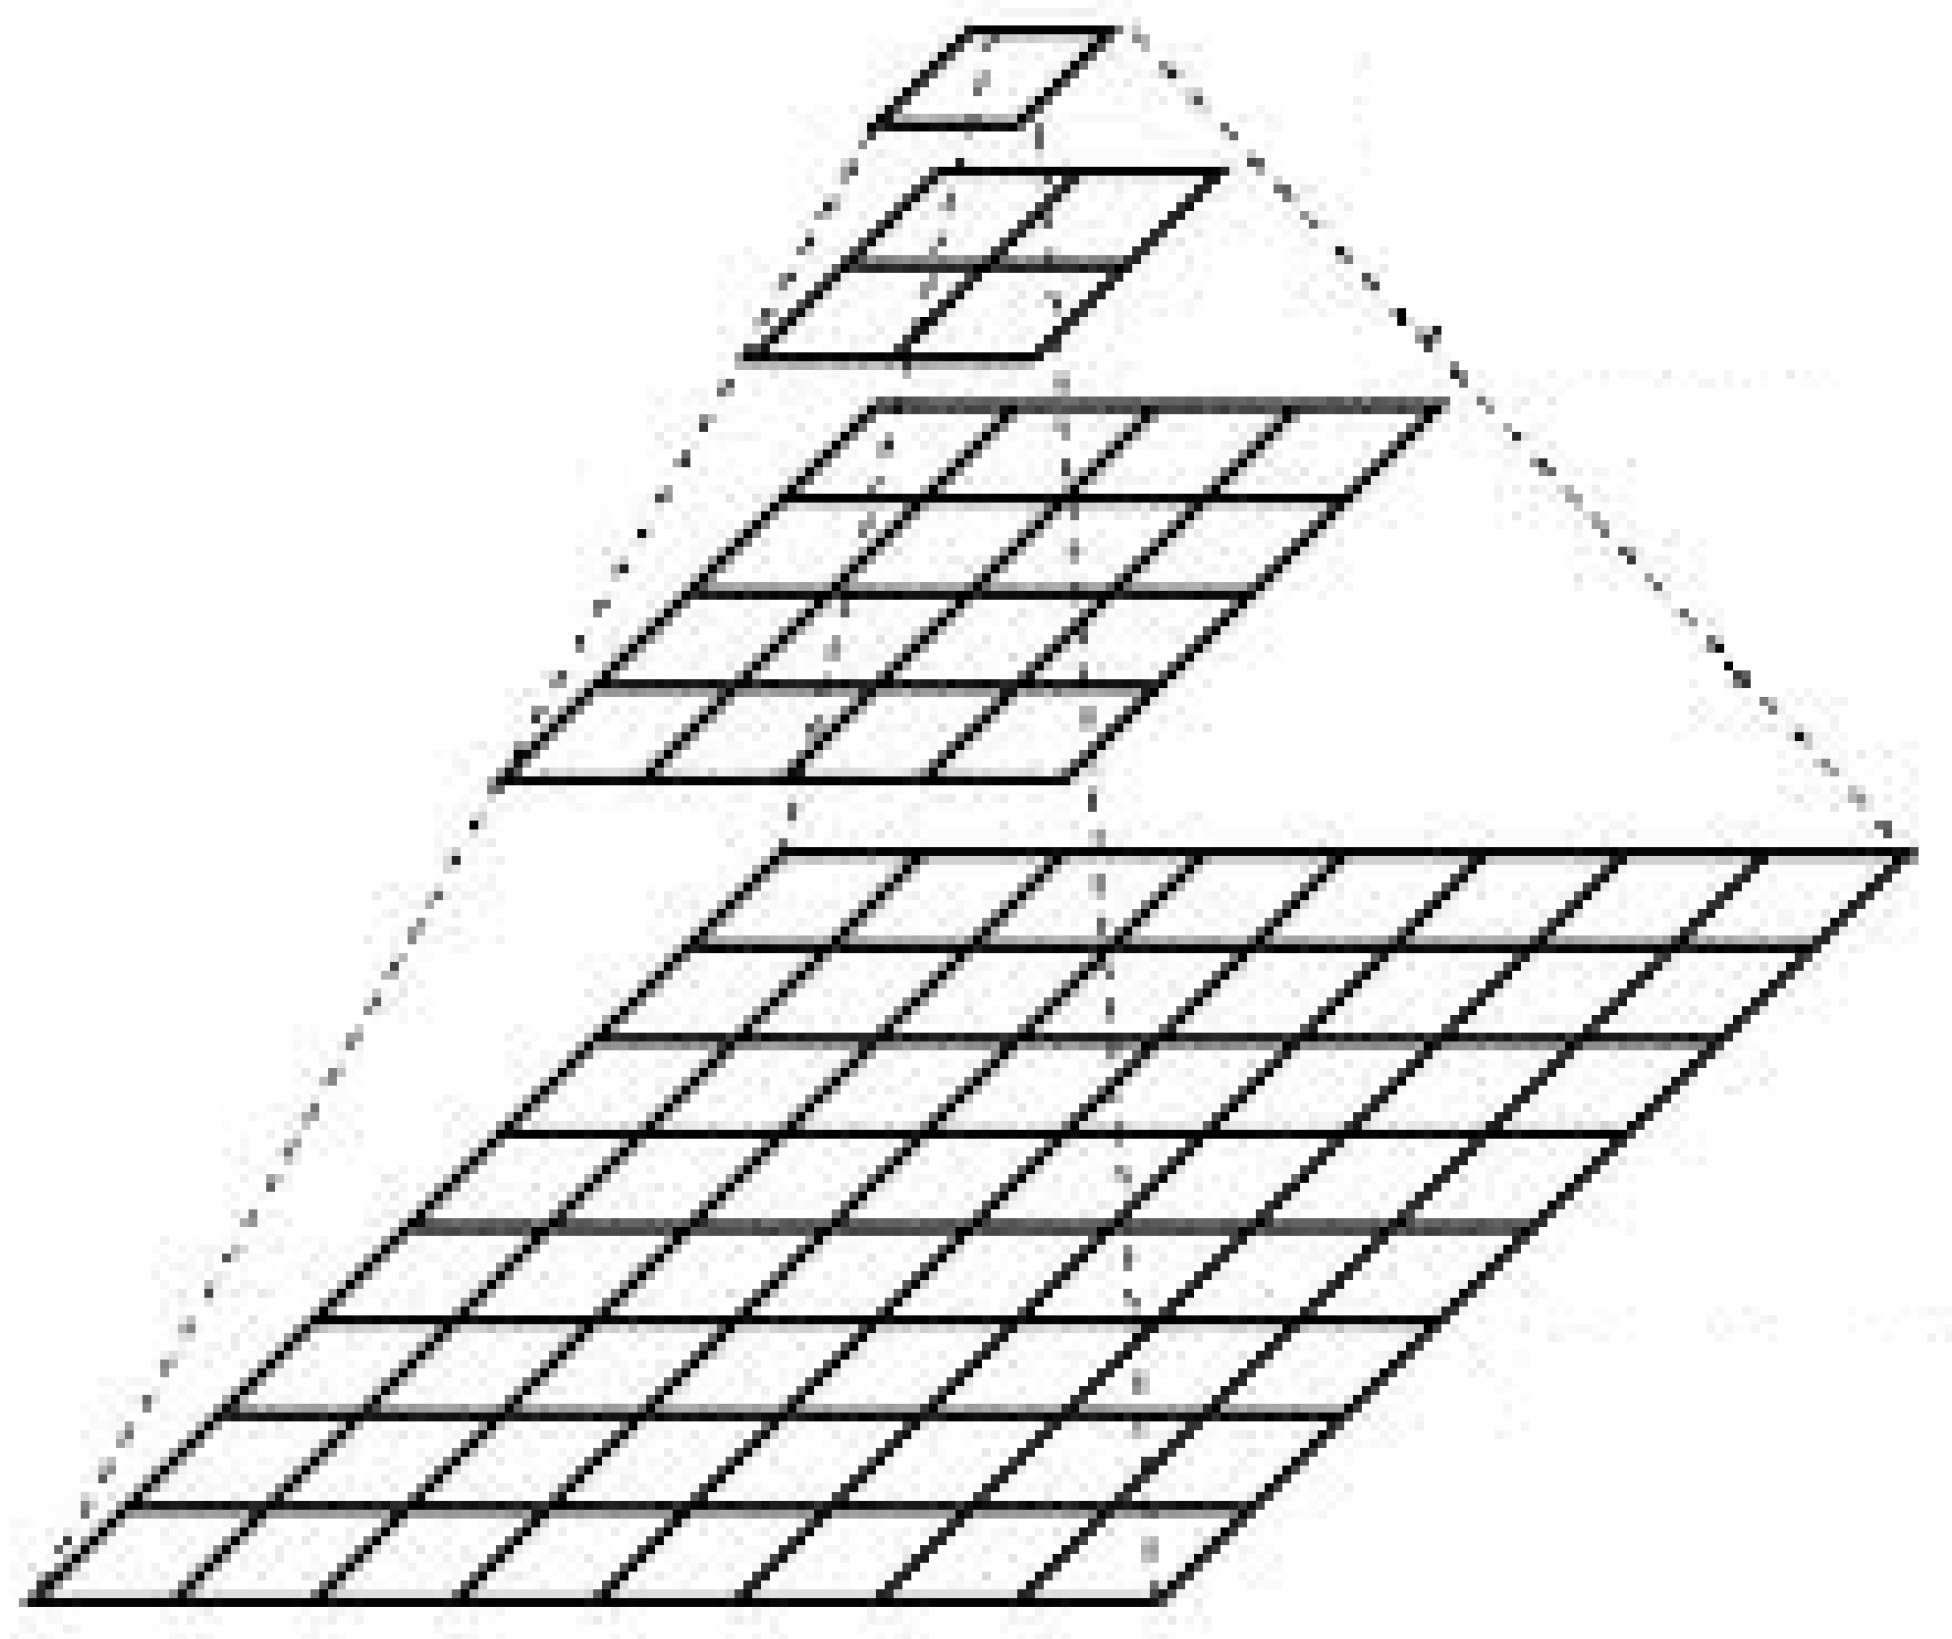
  • Base image: The highest-resolution image, which contains the most detail.
  • Pyramidal levels: The original image is broken down into lower-resolution versions at different levels, with each level containing an image of progressively reduced size and resolution.
  • Processing software: The image pyramid is often used in software that allows navigation between different levels, so the user can quickly switch between high-resolution and low-resolution images.
A high degree of optimization can be achieved by using the image pyramid. Only tiles in the field of view (FOV) at a given magnification level are displayed at a time. In other words, at low magnification only a low-resolution image is loaded, and at the highest magnification the original high-resolution image tiles are loaded [15].
CAD systems aim to speed up and refine diagnostic processes [16,17,18]. These systems are able to quickly process massive amounts of clinical data and then find hidden correlations between them. Today’s CAD systems include those that are capable of continuous learning, enabling them to refine their decisions by reviewing new diagnostic cases. There are many factors that have led to the research and application of CAD systems coming to the fore [19]. These factors include the following:
  • The complexity of establishing a diagnosis;
  • The need to analyze huge amounts of complex clinical data;
  • The great progress in computer science.
Nowadays, a number of CAD systems are published that use machine learning to process the data and discover the relationship between them. In addition, the use of different pattern recognition techniques is also common in CAD systems, as the proper classification of structures is of paramount importance when processing image data.
Today, there is still a lot of research underway regarding the development of these and similar systems and on their applicability in everyday medicine [20,21]. If we stick strictly to medical image processing, one of the great advantages of these systems is their consistency. In all cases, we can be sure that the system has examined the entire tissue sample and provides information to the doctors based on the results. Unfortunately, there is currently no tool that can be used to make sure that the doctor has looked at the entire tissue image during the diagnosis, especially in the case of 3D visualization of tissue samples. The research presented in this paper provides a solution to this problem.
The remarkable progress in quality management over the past half century [22,23,24] has led to the development of diagnostic services and the growing need for continuous improvement. It is becoming a moral responsibility to ensure the best possible care for patients, and the introduction of a quality management system (QMS) in health services and laboratories automatically becomes a necessity [25].
The discipline of pathology is undergoing a digital transformation, with pathology samples being scanned, reviewed, and stored in digital format [26,27]. Digital workflows can bring many benefits to healthcare systems. These include reliable and fast searching and retrieval of digital images, digital review and comparison of historical pathology slides at any time, the enabling of telepathology, use of computational tools, and sharing of digital images for research and educational purposes.
A laboratory quality management system is a set of systematic activities that aims at developing workflow steps during clinical decision-making. A QMS includes processes such as the following:
  • Developing and controlling workflows from the pre-analytical until post-analytical phases;
  • Managing resources;
  • Performing assessments and continuous improvement to ensure consistent quality results.
The World Health Organization’s Quality Management Manual provides guidelines for the basic structure of a QMS system [28]. The implementation of a QMS is critical to ensure reliable quality results for clinical decision-making for all laboratory activities (including image processing).

1.2. Sensing Methods in Medicine

Nowadays, the use of eye-tracking is one of the most common ways used to assess the validity of image data. Research into the use of eye-tracking technology has been carried out in several medical fields, such as the following:
  • Radiology [29];
  • Dentistry [30];
  • Mammography [31];
  • Neuroscience [32].
The various eye-tracking solutions provide the following possibilities:
  • Automatically calculate how much of each image has been examined by the professional;
  • Determine how much time has been spent on the different areas of the sample;
  • Determine which areas may have been missed during processing.
As 3D visualization technologies become more widespread, the use of technologies to track user interactivity in the new environment becomes essential. Eye-tracking can provide the ability to determine how long a user has been looking at a particular area of space in a 3D environment and to calculate the evaluation coverage of that object based on these data. There is also a lot of research underway today to combine 3D medical imaging with various eye-tracking technologies [33,34,35].
In addition to being used by doctors/researchers to monitor the evaluation of specific medical samples, eye-tracking technology is used to diagnose patients. This is confirmed by numerous scientific publications [36]. One common application of technology is in neurology. There is a lot of research being read today in which eye-tracking technology is being applied to various neurological disorders such as attention deficit hyperactivity disorder (ADHD), autism spectrum disorder (ASD), Parkinson’s disease, and Alzheimer’s disease. In these diseases, researchers have observed different eye movements from healthy eyes using different eye-tracking technologies. Biomarkers predictive of these diseases could include reduced saccadic velocity or impaired smooth pursuit [37].
In addition to quality assurance of the evaluation of various image data and early detection of neurological disorders, the technology has proven to be useful in the development of surgical skills. Research has shown that by using different eye-tracking or pupil-tracking solutions, it is possible to perform certain operations in robotic surgery based on where the surgeon is looking at a given moment [38]. This could simplify complex operations and increase the accuracy of procedures.
The P300 is an electroencephalographic (EEG) wave recorded as the brain’s response when a person perceives an unusual or attention-grabbing stimulus [39,40,41]. The P300 component of the event-related brain potential (ERP) is a sensitive, non-invasive, and convenient measure of cognitive impairment resulting from a variety of disorders. Application-oriented research on the use of the P300 measure as a cognitive assessment tool for a wide range of neurological and psychiatric conditions has spread rapidly over the past decade [42]. The P300 value has a standard latency between 280 and 600 ms depending on the task and the age of the subject, following stimulus presentation. In our research, we used this measure to determine whether a given area had been inspected by the user for a sufficient period of time.

1.3. Consistency and Reproducibility of Medical Diagnoses

The reproducibility and consistency of medical diagnoses is still an active area of research. Various studies have been published about the extent to which a medical diagnosis is reproducible and whether the right decision has been made based on the available data. In their article, the authors investigated whether the same doctor, when evaluating the same medical sample at two consecutive points in time, reaches the same conclusion. In some cases, only 53% of the cases studied showed a match between diagnoses made at different times [43].
There have been several studies that anonymously test the accuracy of various past diagnoses. One such example is the work of Haggenmüller, S [44] and colleagues, who examined 792 melanoma-suspicious samples diagnosed in the past with the help of eight expert pathologists. The paper shows that 14.9% of the expert diagnoses made by local pathologists in the past, and 33.5% by dermatologists, were disagreed on. The article highlights the difficulty of early diagnosis of various pathological lesions (especially melanoma). It also shows the need for a tool that would allow the doctor to record and share the entire diagnostic process. This would allow other doctors to see exactly what he or she saw, so that second opinions can be sought and given more quickly and accurately.
In our research, we designed and developed a system that can be used to eliminate diagnostic errors due to inconsistency. Our solution provides the possibility to capture a complete diagnostic workflow. Recording the entire diagnostic workflow, in addition to improving the accuracy of diagnoses, could be useful in the future for many other reasons. One such area could be medical education, where students can replay and analyze a medical case at any number of times. The implementation of this functionality within our research is shown in Section 3.1. We implemented this with a combination of software and hardware tools that provide the possibility to investigate user’s physiological parameters at runtime. The architecture of our solution can be seen in Section 3.

2. Materials and Methods

In our research, we used Godot graphics engine version 4.2 to develop our 3D reconstruction solution. For our research, we used the HTC Vive Focus 3 VR device and the eye-tracking module developed by the manufacturer for the headset. The graphical engine used in our research communicates with the VR device using OpenXR library and reads the eye-tracking data from the headset’s sensor using the OpenXR Eye-Tracking API 1.0. Because of the possibilities offered by the graphical engine, we used the .NET environment and the scripting language of the graphical engine for the practical implementation of our research.
In our research, we used anonymized digitized pathology serial sections. The resolution of the first serial section used in our development was 36,352 × 53,248 pixels. This serial section contained 89 layers with the previously mentioned resolution. The resolution of the second serial section used in the implementation was 35,584 × 35,840 and was composed of 50 layers. The term layer is used to refer to the number of samples that build up the entire serial section. To ensure that the individual layers of the digitized pathology serial sections were properly transformed together, SlideMatch [45] software version 2.0 was used. The mentioned software was developed by the German company called MicroDimensions (Munich, Germany). The layers transformed using this software were displayed in 3D by the 1.0 version of the PathoVR software. The two serial sections used in our study were both H&E-stained samples. For both serial sections, digital copies of the physical samples were made using a Pannoramic 150 Digital Scanner. The mentioned device was manufactured by a Hungarian company called 3DHISTECH (Budapest, Hungary). The .mrxs file format was used to store the digitized format of both samples.
To reconstruct a previously established diagnosis, we need to simultaneously monitor several different types of parameters. These parameters can come from many different types of hardware and software, and users, making it difficult to monitor and store. One possible way to move these parameters into a common space is to use virtual reality. In our research described in this paper, we used a multi-user virtual space that we have published in our previous papers [46].
We developed our own system to monitor and save the different data generated during the diagnosis in VR environment. The architecture of this module is shown in Section 3.1. In addition, based on the measurement data of the eye-tracking sensor, we formulated our own equations to determine the state of examination of a serial section. These equations are given in Section 3.4.

3. Results

Quality assurance is one of the most important processes in medicine. When evaluating image data, we must always be sure that we are drawing the right conclusions from the available data. Decisions made when examining imaging data must be information-justifiable, consistent, and in all cases, verifiable. In our previous research [46,47], we published our work on 3D visualization of digitized medical samples and the interactions between user and virtual samples. Based on these functionalities, this paper aims to improve the quality of the diagnosis made. In our current research, we have created a system capable of fully reconstructing diagnoses performed on digitized pathology serial section in 3D space, so that all examinations performed within our system can be repeated and verified. In our research, we developed functionalities to test diagnoses made on 3D pathological serial sections in a virtual 3D environment. An example of the 3D pathological serial section used in our research is shown in Figure 3.
The main objective of our research was to ensure the evaluation of digitized pathology serial sections used in digital pathology. To this end, we designed and developed functionalities that, in addition to the existing tools, can further increase the certainty that each sample has been processed with the appropriate quality. During our research, we developed functionalities such as the following:
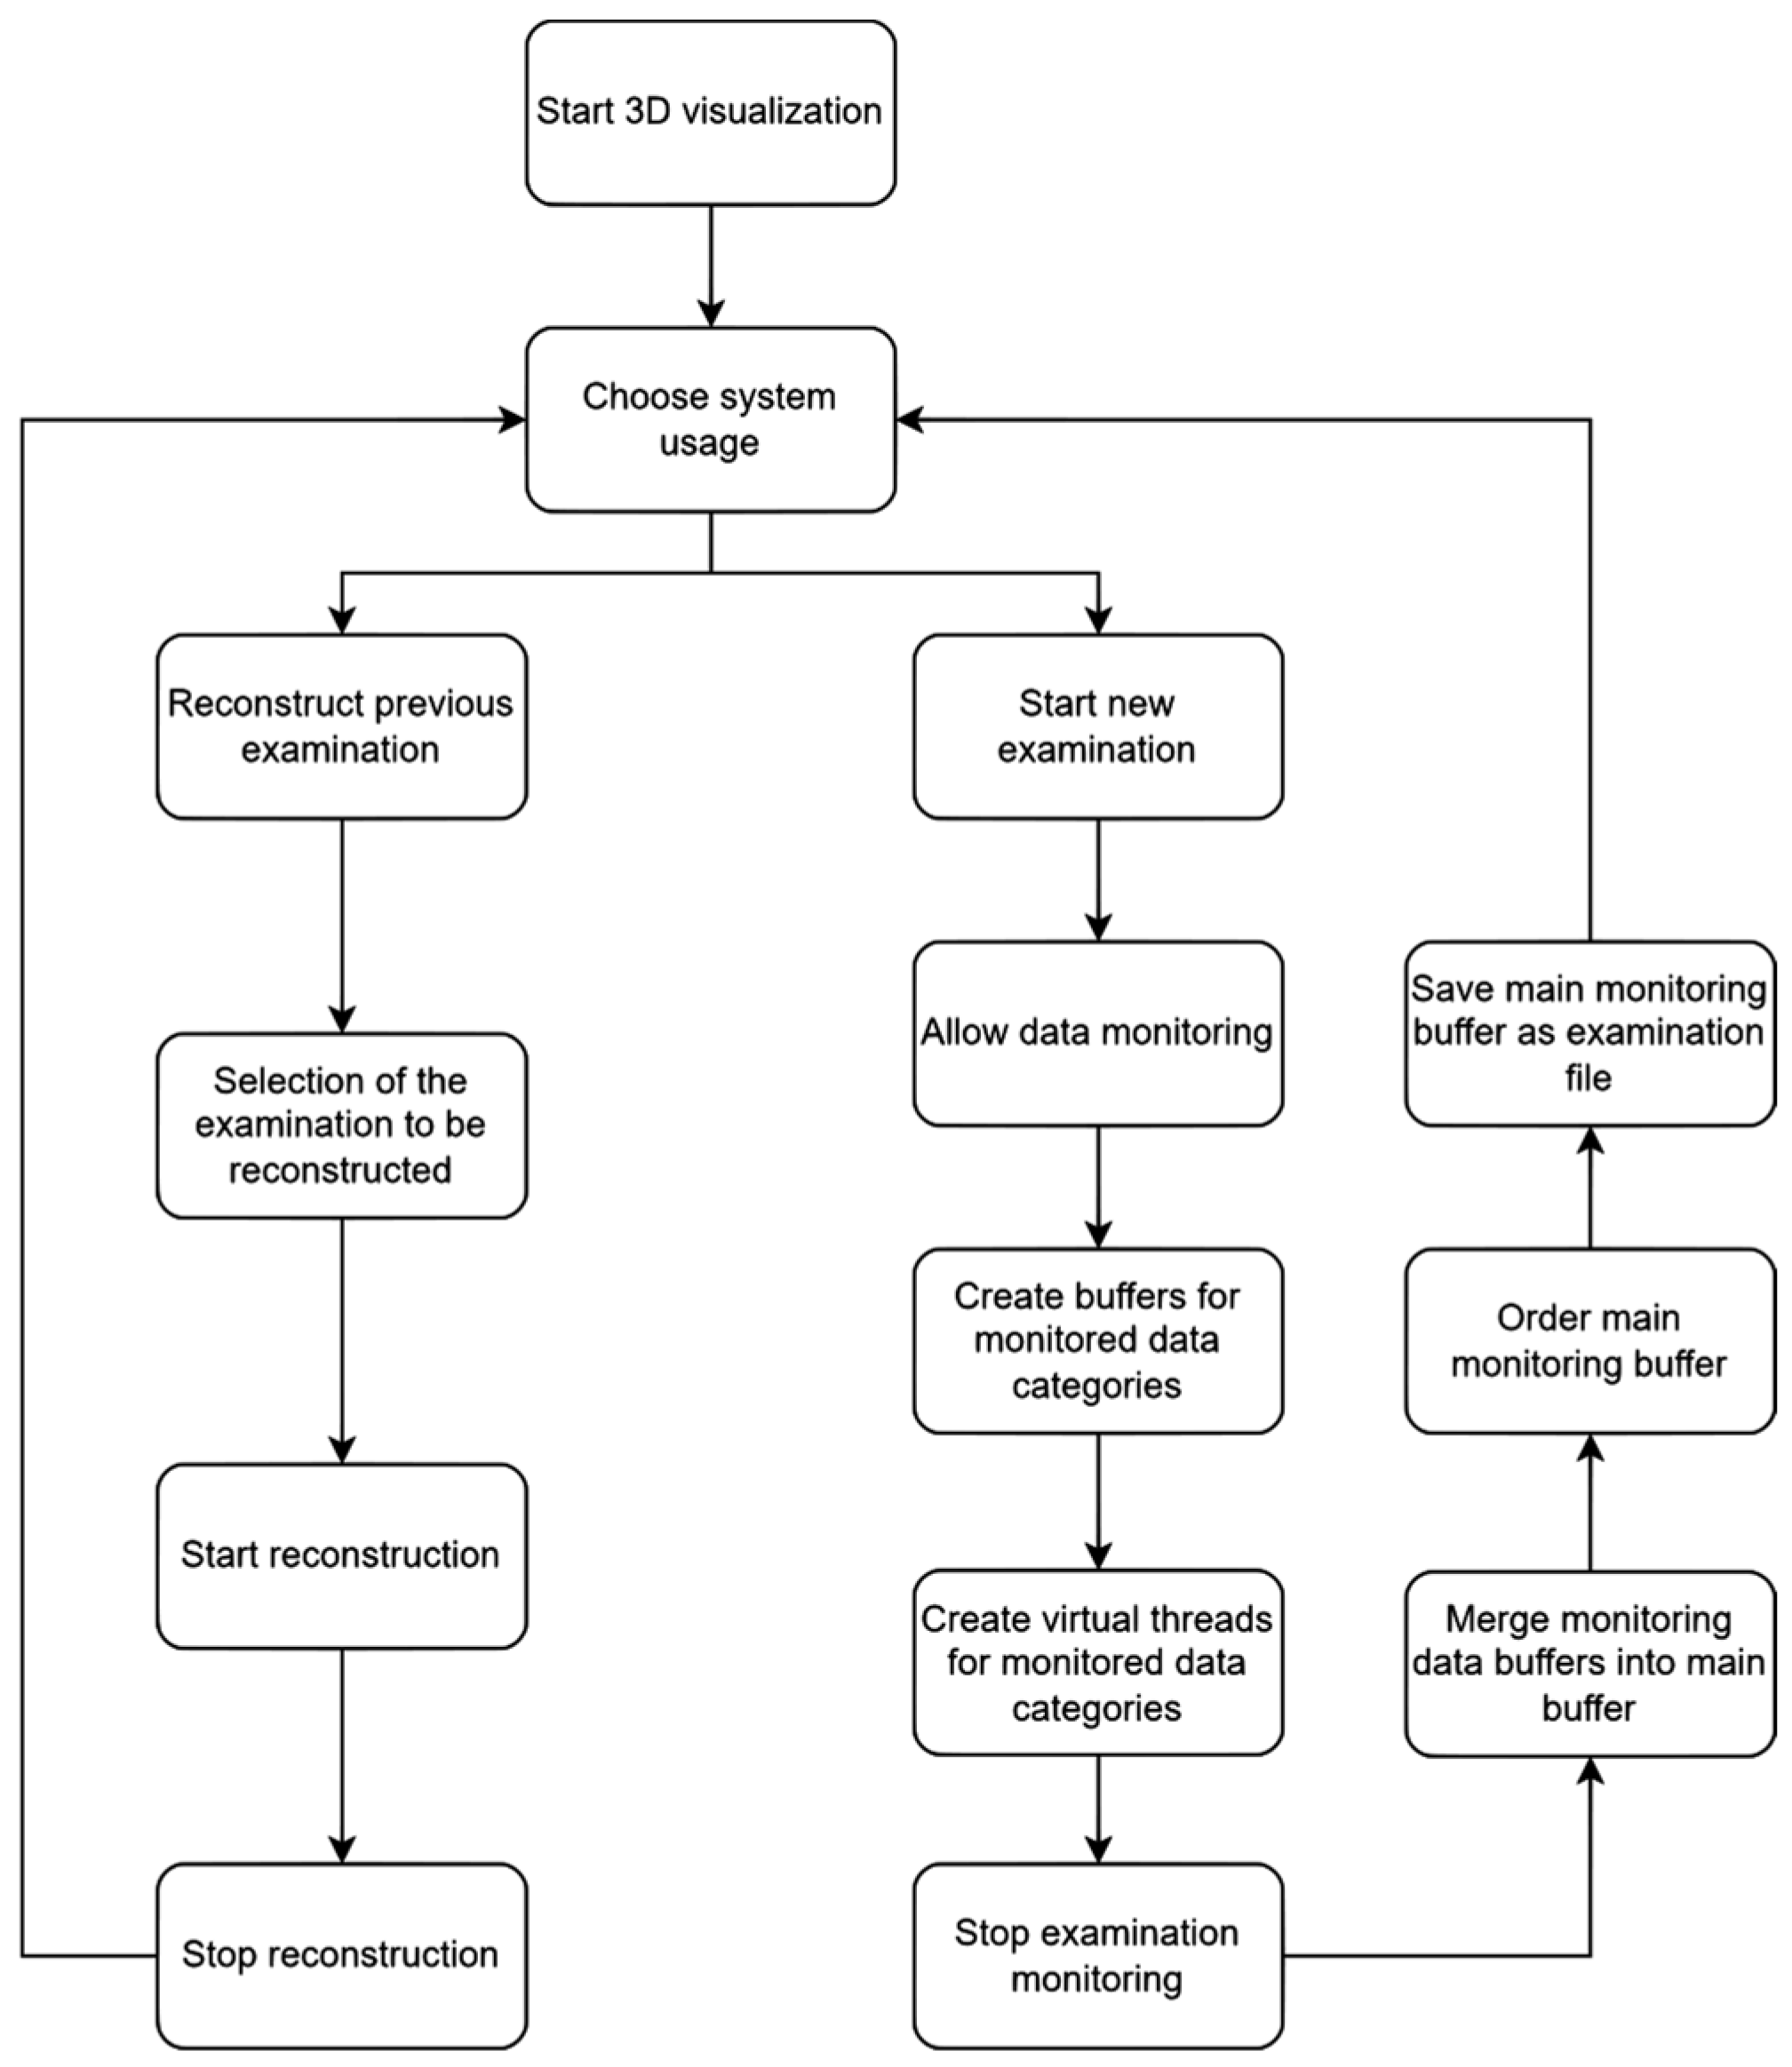
  • Monitoring and reproduction of 3D diagnosis;
  • Millisecond data recording in 3D virtual reality environment;
  • Introduction and definition of primary and adjacent zooming areas;
  • Determination of sample evaluation by eye-tracking.
By applying the solutions described in this article, the quality of the evaluation of digitized medical image data can be improved in the future. The architecture of the system presented in this paper is shown in Figure 4.
Figure 4 shows that in our solution, the data collection module and the reconstruction module are integrated into one system. This allows the user to choose at software start-up whether to record a new examination or to reconstruct an existing one. It can be seen in Figure 4 that in order to record the different user data the user has to agree to this; without this, the recording of the user data cannot start.

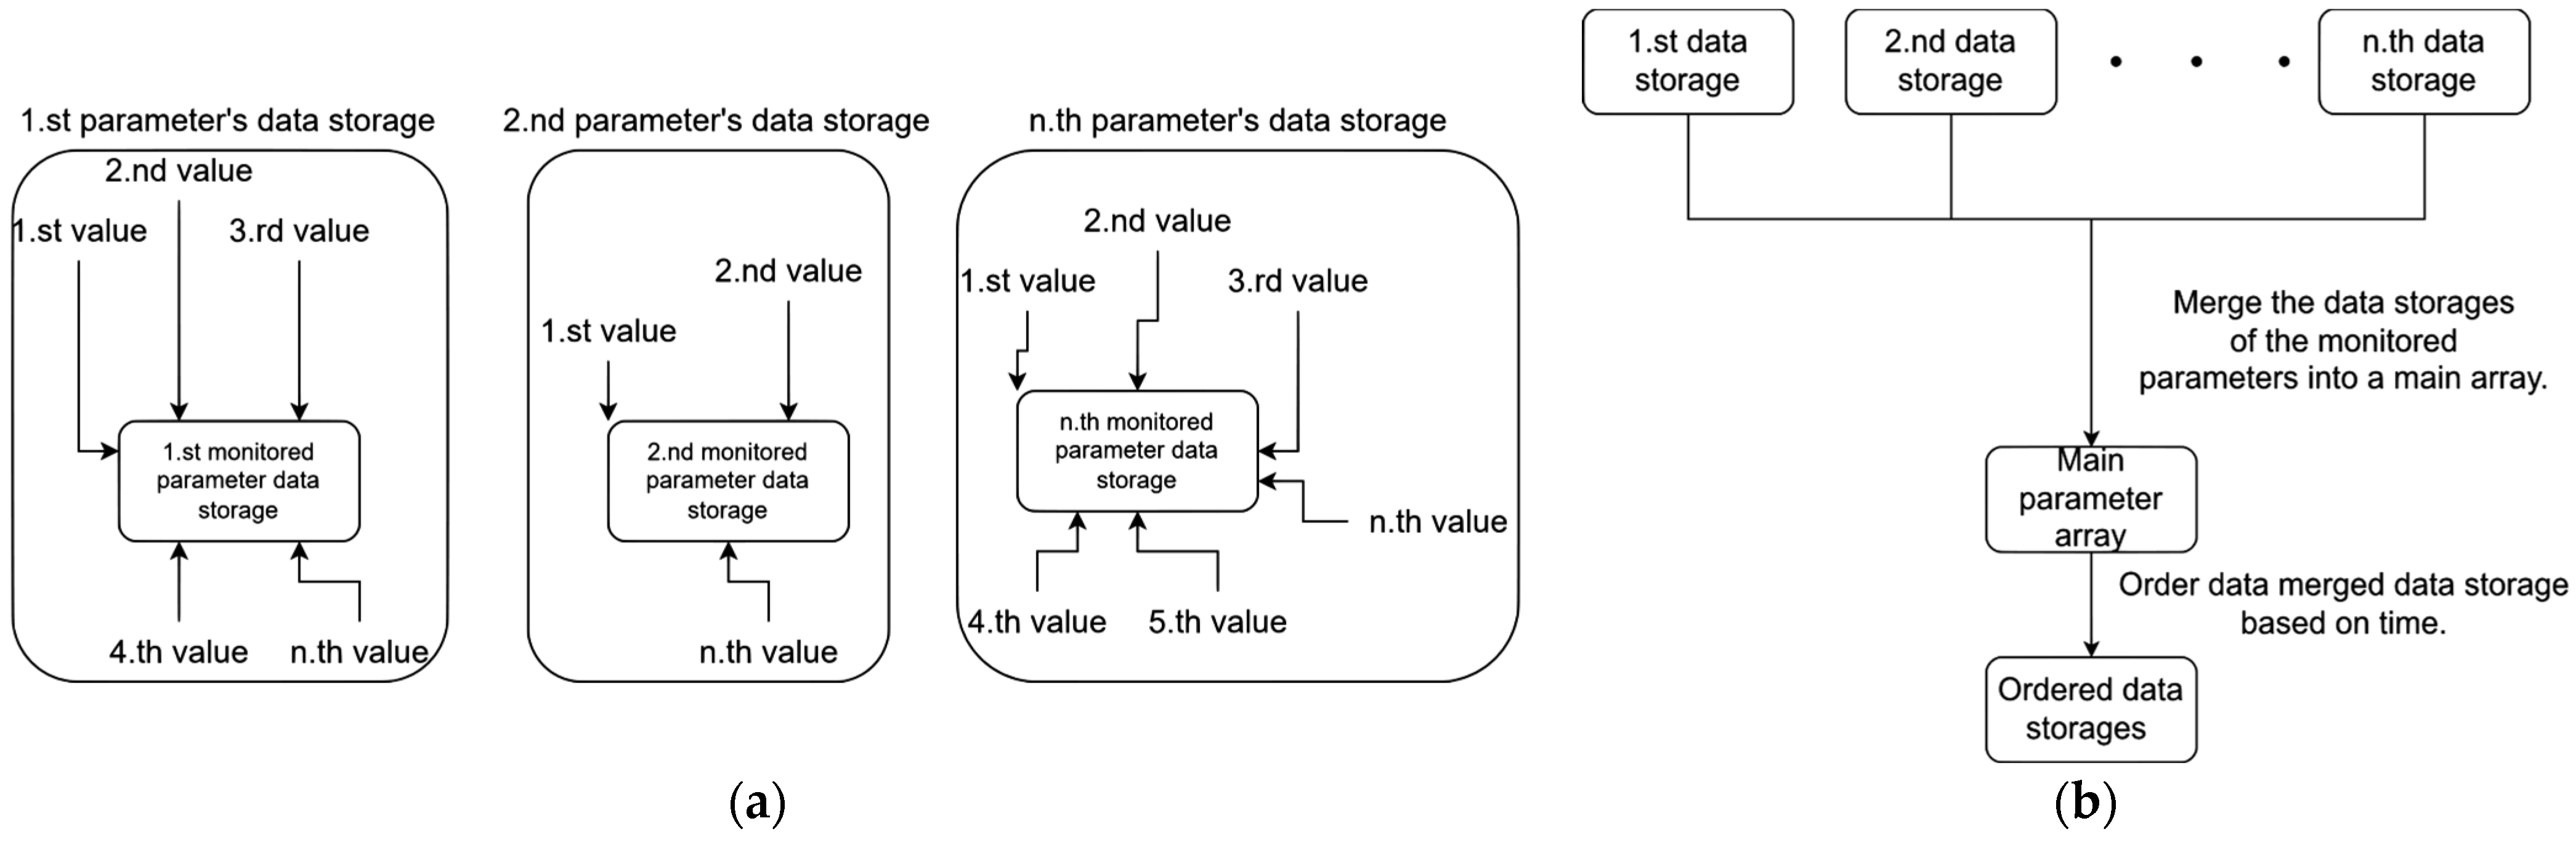
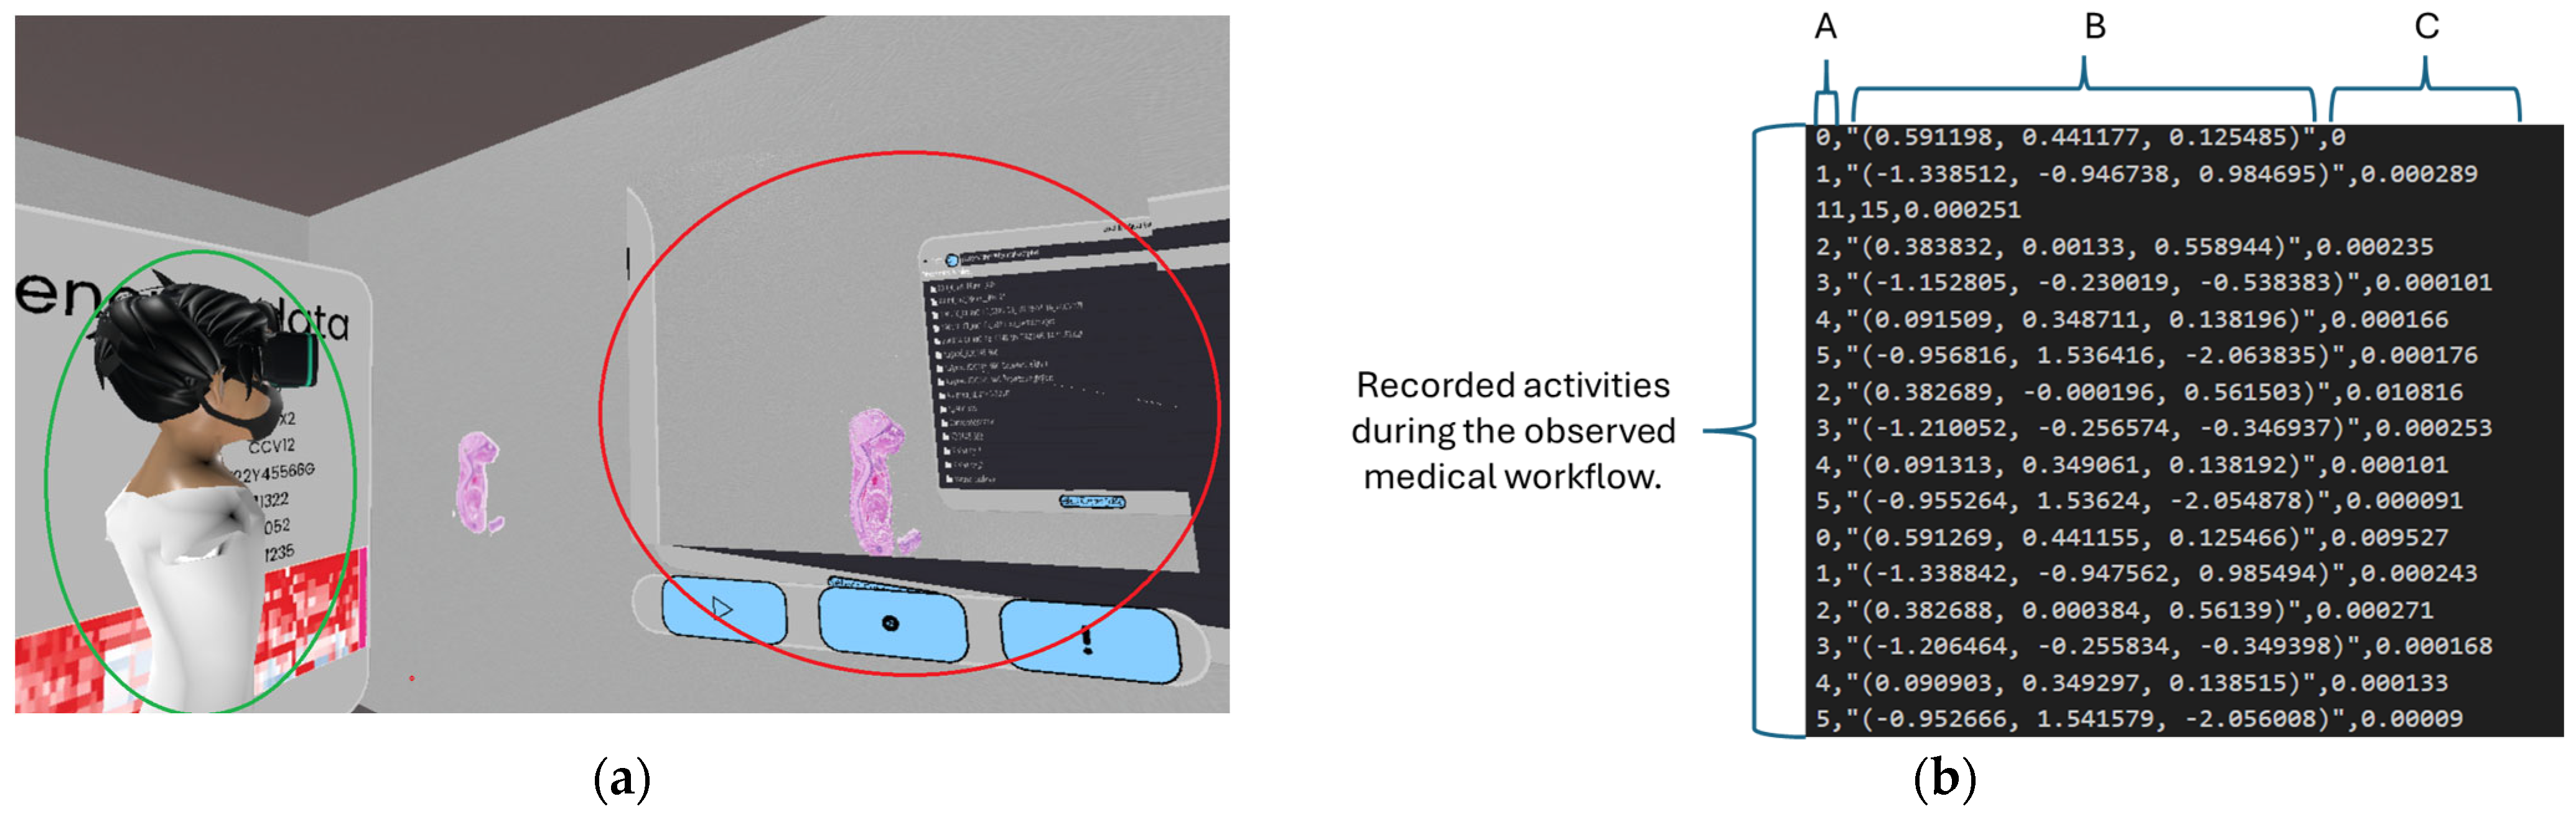
3.1. Parameter Recording During 3D Medical Sample Evaluation

Our previous results in this area are presented in the following paper [48]. Our research has focused on the evaluation of digitized medical samples. For this purpose, we designed and developed a system that can capture a complete 3D virtual reality (VR) session within PathoVR software [49,50,51,52]. PathoVR software can display data from a wide range of imaging modalities in 3D format. Examples include CT, MRI, and SPECT.
The run-time parameter saving was implemented using several stacking steps. In the first step, the user starts a recording, thus agreeing to record the data generated during use. In the second step, we create as many buffers as we want to record parameters at runtime. In these buffers we record the data associated with each parameter. In the third step, the user stops the data recording. In the fourth step, the different buffers are aggregated into a common buffer and then sorted according to their time stamp parameter. Performing the last step also results in a time-sorted array that can be replayed to reconstruct the original session. The use of different buffers per parameter and the merging of buffers are shown in Figure 5.
Our solution currently monitors 10 different parameters in real time and saves the associated data. The following parameters are monitored:
  • User movement in 3D space;
  • User rotation in 3D space;
  • The user’s left hand’s movement in 3D;
  • The user’s left hand’s rotation in 3D;
  • The user’s right hand’s movement in 3D;
  • The user’s right hand’s rotation in 3D;
  • The movement of the medical sample in 3D;
  • The rotation of the medical sample in 3D;
  • The graphical user interface usage in the software;
  • The medical sample loading.
The file structure we developed to record the various parameters listed is shown in Figure 6b.
Using our data monitoring solution, it is possible to reconstruct VR diagnostic processes; an example of such a reconstruction is shown in Figure 6a. Two users were using the system when Figure 6 was taken. The first one, from whose point of view the picture was taken, is an active uploader, while the second one (circled in green) is a reconstruction for a previous user. Figure 6 also shows the menu circled in red that represents the field of view of the reconstructed user. With this solution, we can see exactly what was seen by the user who recorded the scenario. To protect the user’s privacy, we will not store any data from the monitored session that contain personal information. In addition, the user must always consent to the initiation of data recording. This is illustrated in the Figure 4.
To be able to monitor and store the right data in the right format at runtime, we designed and created our own file structure. The structure we used in our research is a .csv-based solution. The data file stores the data recorded for each parameter line by line. Each row is made up of three parts. The first contains the unique identifier of the parameter type being monitored, the second contains the data associated with the parameter being monitored, and the third contains the time stamp data associated with the parameter. With these three pieces of information, we can fully reconstruct the parameter under monitoring, in case we have a recorded session. An example of data storage in our file structure can be seen in Figure 6b.

3.2. Testing the Parameter Monitoring

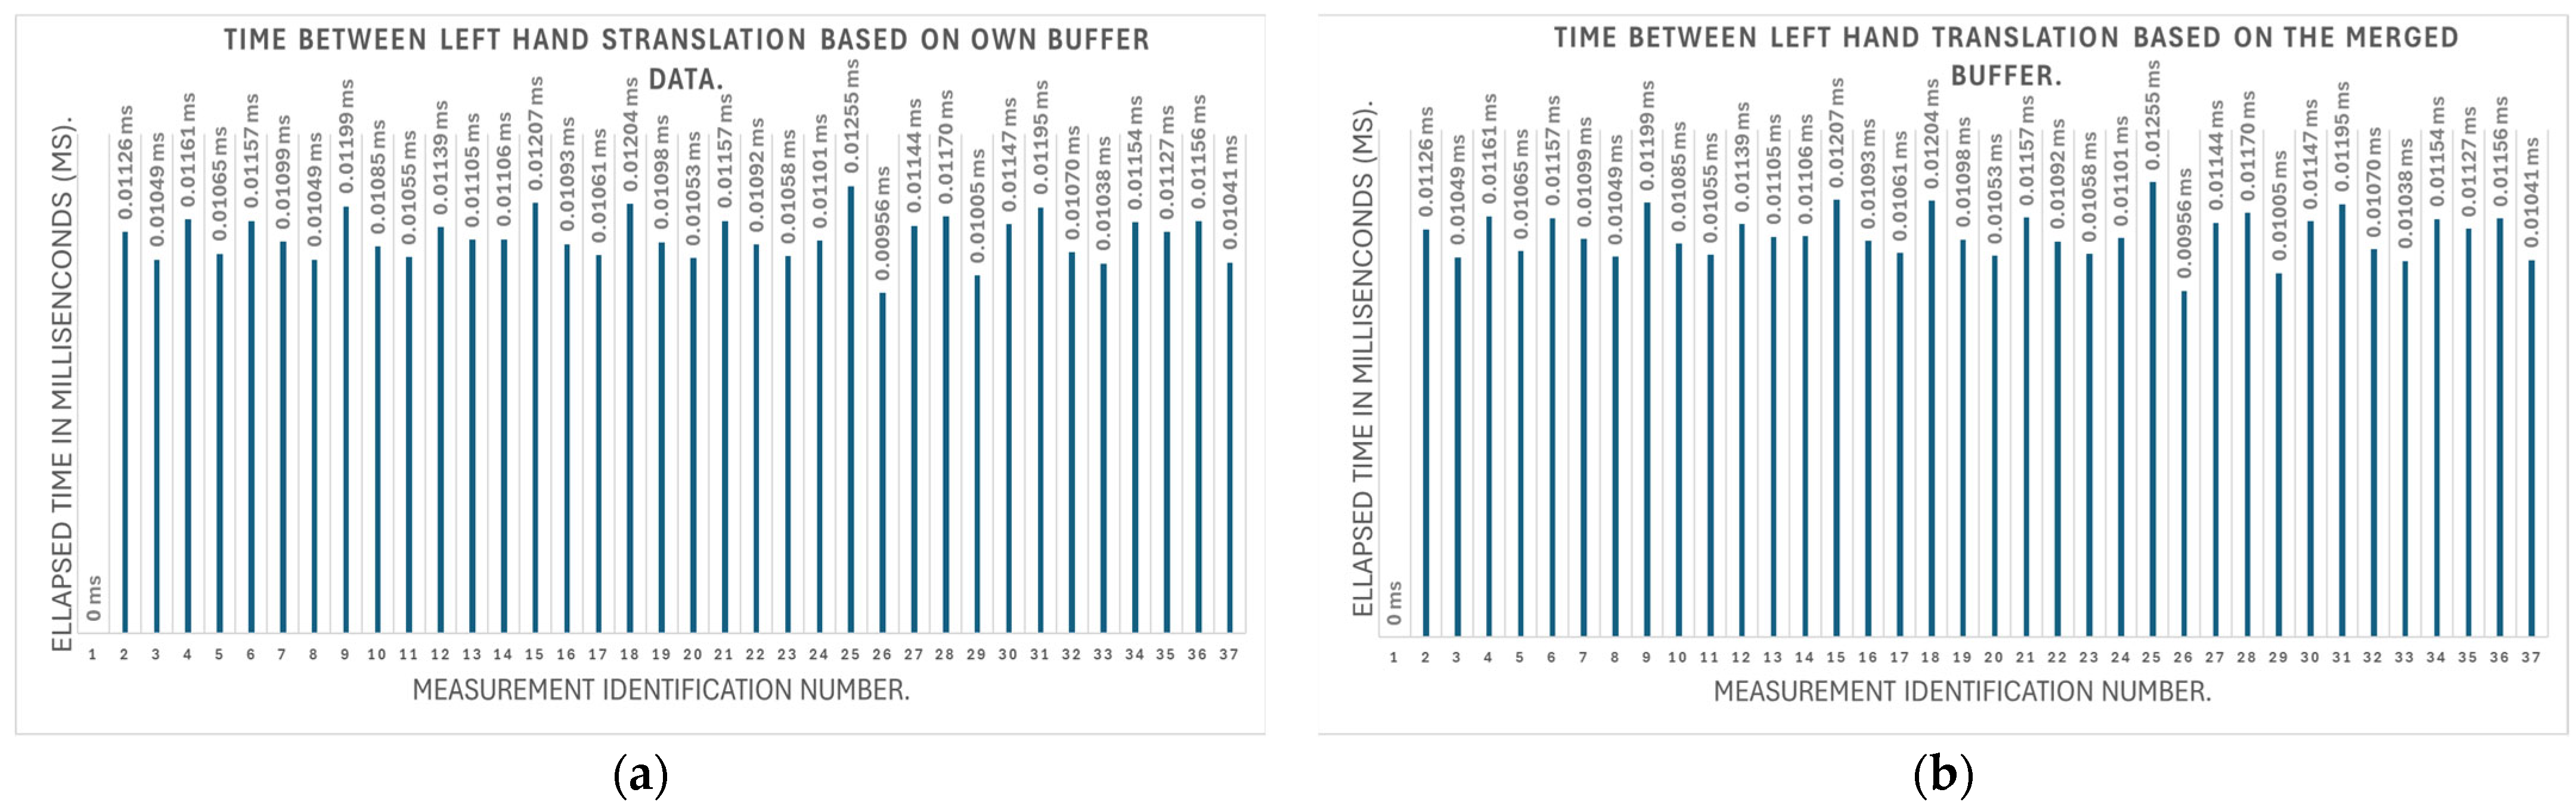
3.2.1. Testing the Accuracy of Parameter Monitoring

In our research, we considered it important to test the functionality of all the developed functionalities. In this test environment, we examined whether our system maintains the time elapsed between the execution of each action. This is of paramount importance because it allows us to avoid distortion when replaying a monitored session. In the test presented in the paper, the time differences between the user’s left controller movements in 3D space were investigated. The measurement data are presented in Figure 7.
In each column of the Figure 7, the time elapsed between different occurrences of the activity under test (user’s left-hand movement) is shown. Figure 7a shows the time elapsed between the occurrences of the activity when data are captured and saved to their own buffer, while Figure 7b shows the time elapsed between the occurrences of the activity when data are saved into the common merged buffer. In our solution, a merged buffer is a container in which the contents of the separate buffers for different activities are summarized and ordered by time. We use this merged buffer to replay the saved session. The equal heights of the columns with the same row number in Figure 7a,b indicate that each occurrence of the activity under study was played back at the same speed as it was recorded.
Our test was to see whether the data summarization in the central buffer and the temporal ordering did not distort the temporal reconstruction of the measured and recorded data for the different parameters under test. The test case shows that we have successfully created a system that can maintain millisecond accuracy while monitoring and saving parameters. The measurement to support this is shown in Figure 7. The heights of the individual columns are the same in Figure 7a,b, which means that the time elapsed between the occurrences of the parameter under test is not distorted by the use of our parameter monitoring and recording mechanics.

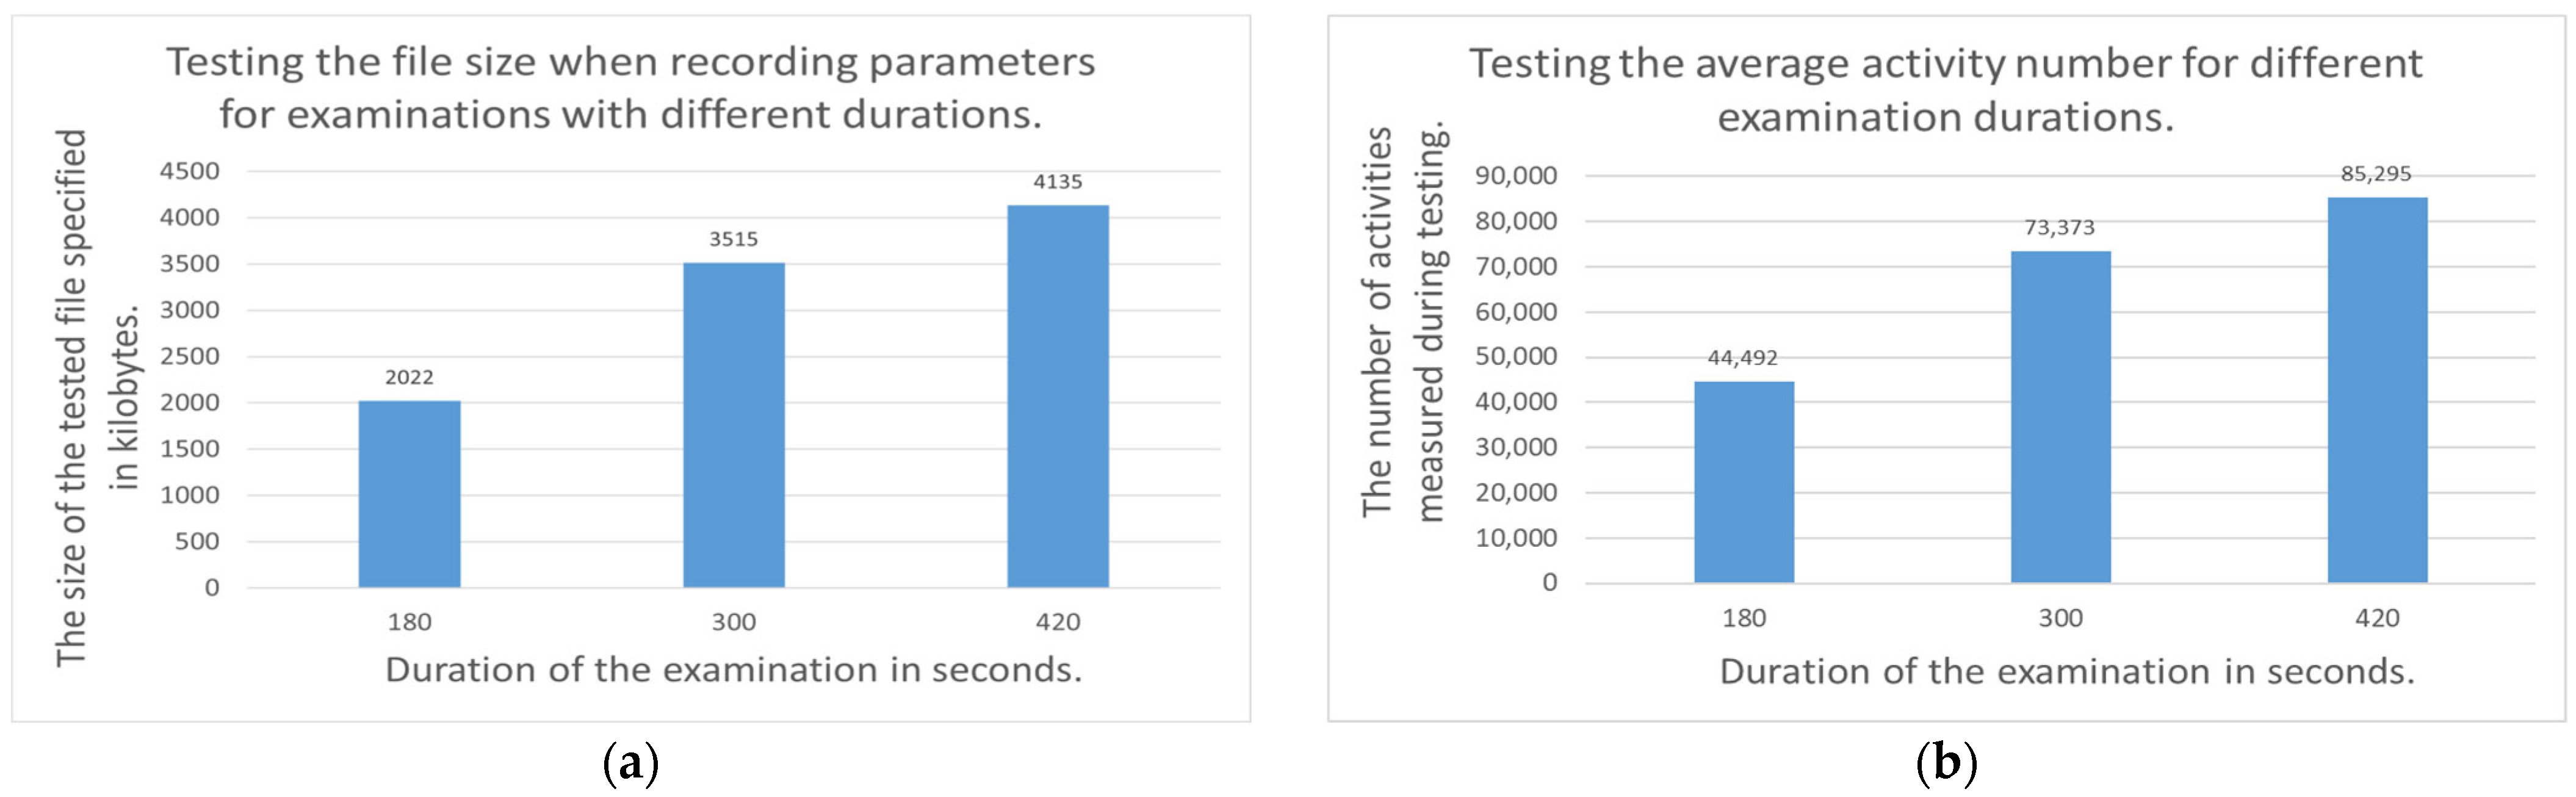
3.2.2. Examination of the Recording File Generated During Parameter Monitoring

Important information for our research was the variation in the size of the generated measurement file depending on the duration of the 3D examination. In our study, we set up a test environment in which three subjects examined the same 3D pathology serial section. During the test, the sampling rate was 90 FPS, which means that in one second, we check 90 times if there was any activity. Each of the three subjects had to examine the 3D tissue sample once for 2 min, once for 5 min, and once for 7 min. From these measurements an average was calculated for the result file size and number of activities. The test results are shown in the Figure 8.
Both the result file size and the number of activities are user-dependent values. If a certain user is more active during the evaluation of the samples, more data will be generated in the result file, or if a certain user is less active, the result file size will be smaller. Nevertheless, our preliminary expectation during testing was that we should see an increase both in the size of the file and in the number of activities in the event that the examination lasts longer.
Figure 8 shows that our preliminary expectations were confirmed after testing. If we look at the size of the result file in Figure 8a, we see that there was a 73.837% increase in the case where the examination lasted 5 min compared to the 2 min examination. If we look at the number of activities in Figure 8b, we also see an increasing trend. If we compare the 7 min examination with the 5 min examination, we see that there has been a 16.244% increase.
Due to the steep increase in the size of result files, archiving measurements should be a key issue in the further development of our solution.

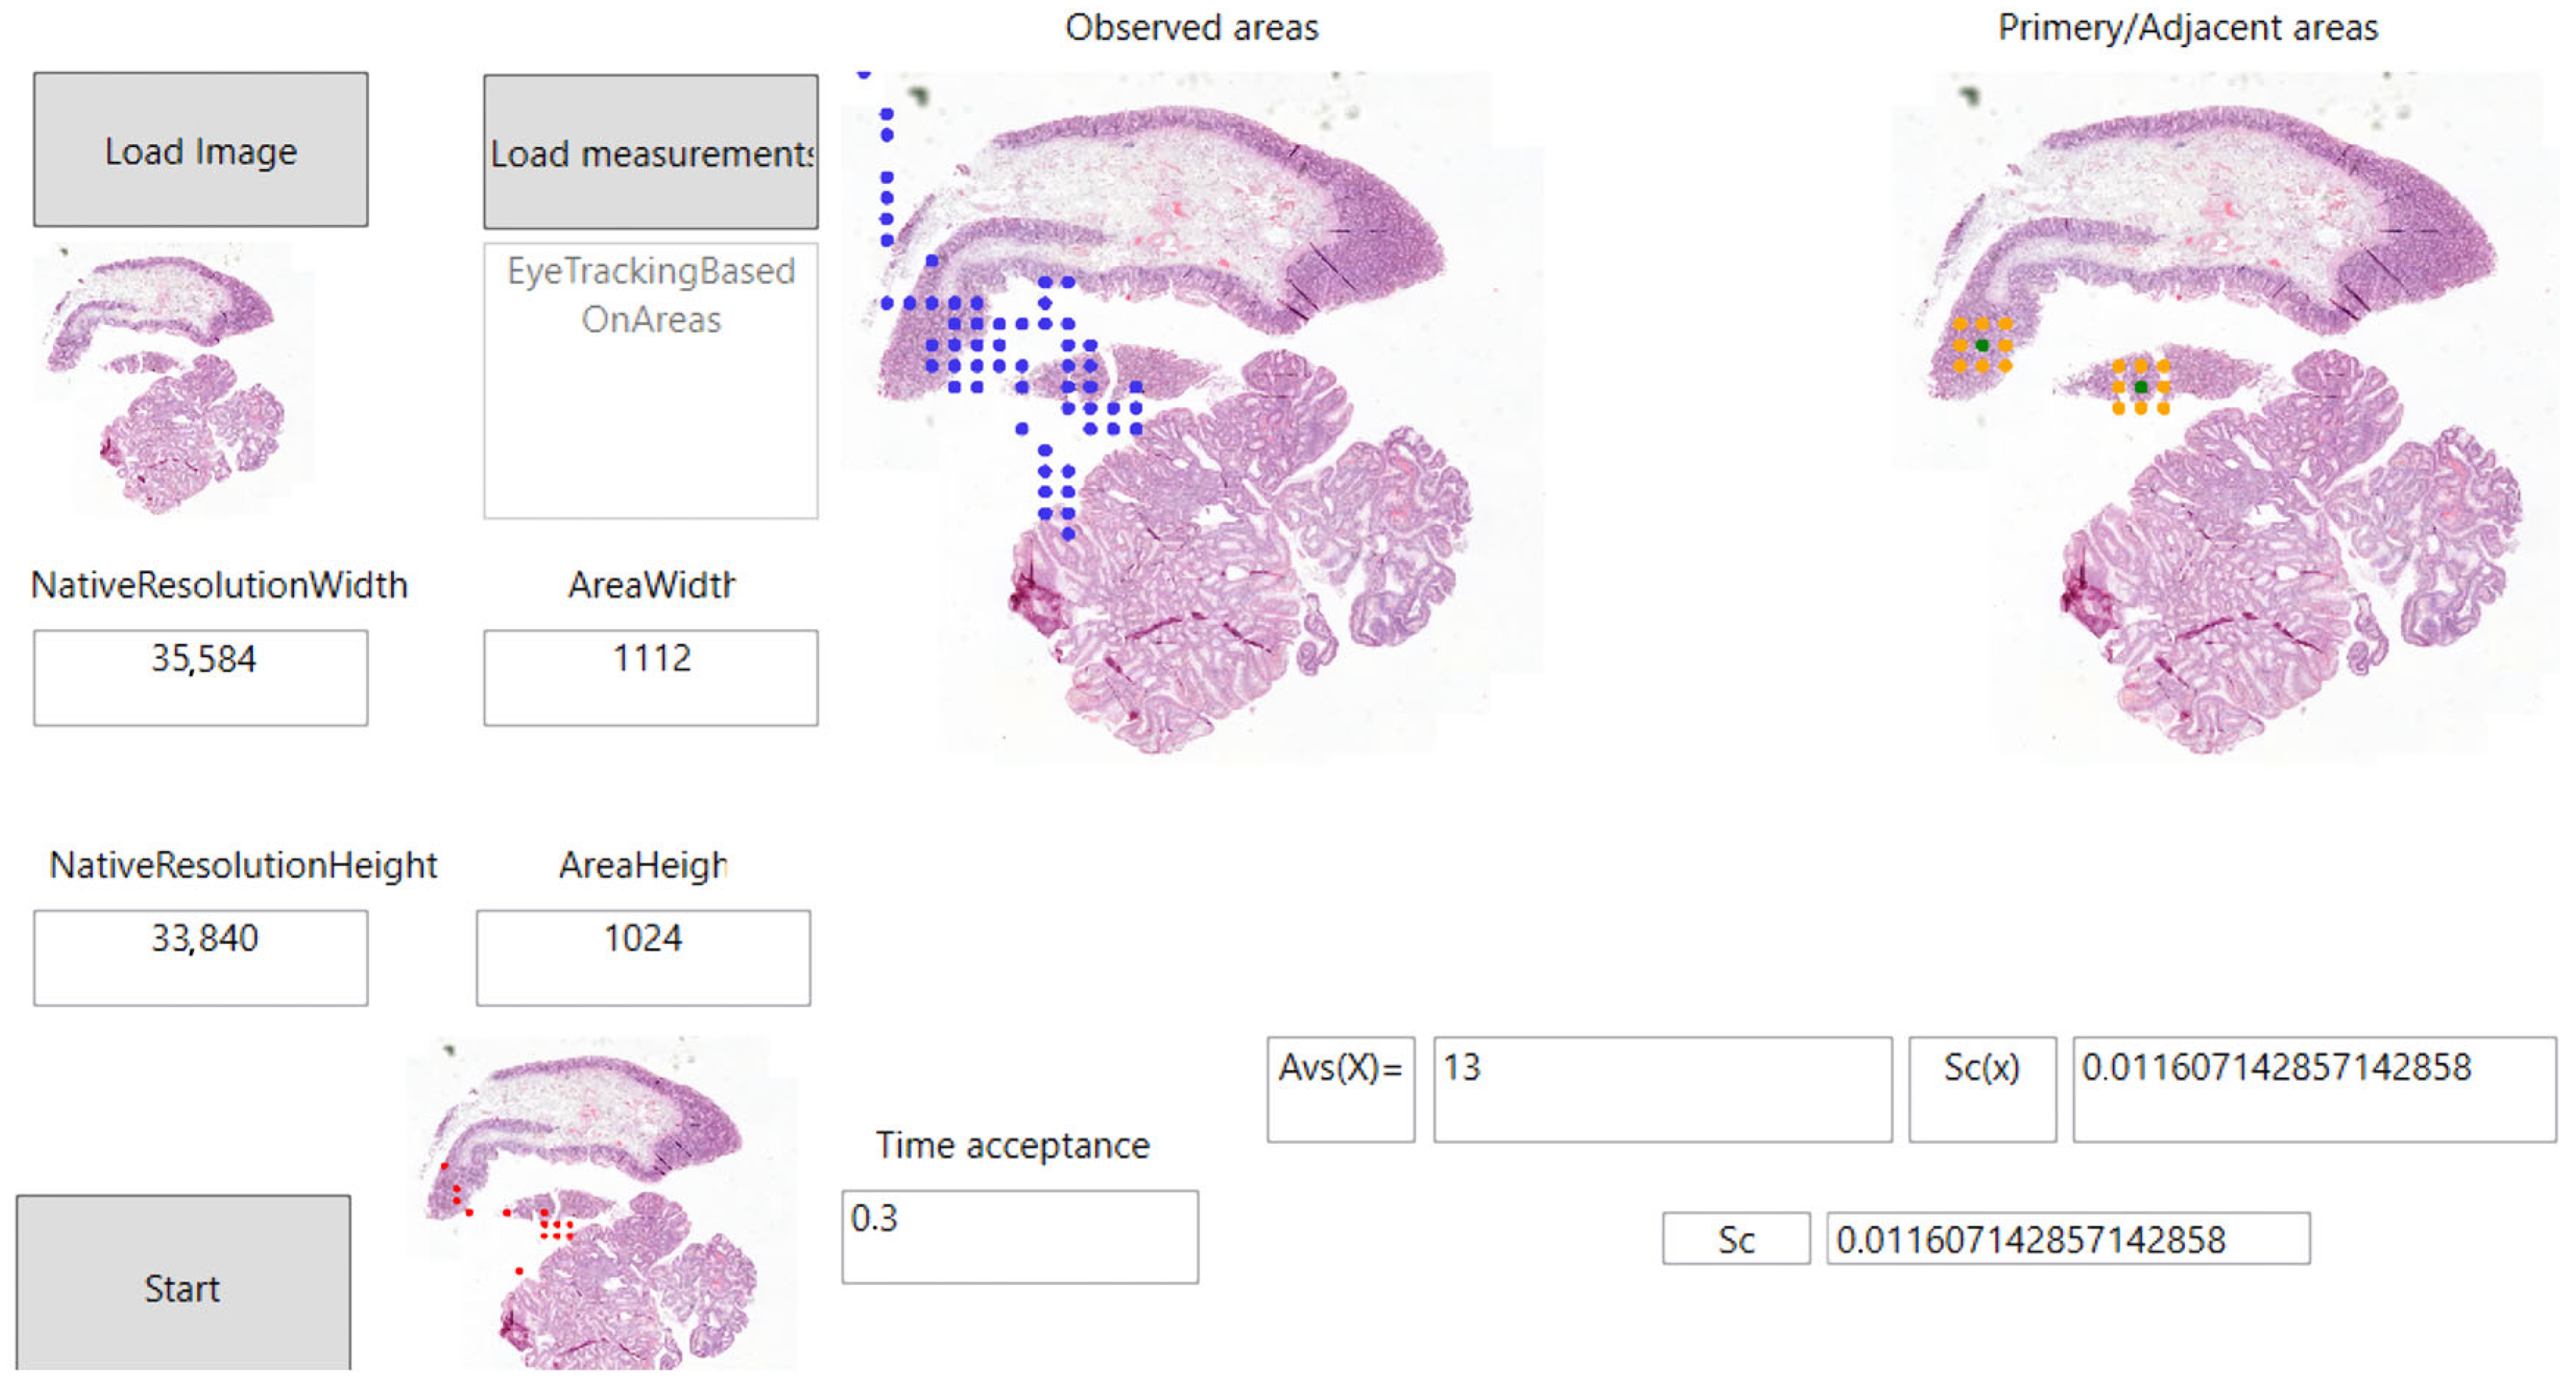
3.3. The Definition of Primary and Adjacent Zooming Areas in 3D Medical Image Evaluation

Building on the magnification functionality, we introduced the concepts of primary and adjacent zooming areas used in the evaluation of medical samples. To use primary and adjacent areas, we need to divide the medical sample currently being tested into smaller areas. The smaller the areas we use, the more detail we can give about which parts of the diagnosis the doctor has examined. A configuration file was used to determine the size of the area used. This allows us to specify the area size we want to apply before runtime. This breakdown of areas is shown in Figure 9. In our research, the primary and adjacent areas have the following meanings:
  • Primary zooming area: We consider areas on which the user has applied a magnification function as the primary area in our research. The area around the selected area can be examined in 3D by the user in the depth of the full serial section. Primary zooming areas can be seen in Figure 9 with a green color.
  • Adjacent zooming area: In our research, we consider as adjacent zooming areas those areas that have been displayed in 3D by the user, but for which the user did not zoom in directly, but on one of their adjacent areas. This is shown in orange in Figure 9.
By using primary zooming and adjacent zooming areas, it is possible to quantify the percentage of areas that the user has inspected in 3D, based on the total number of areas in the series. In addition, the metrics also indicate the percentage of the areas of the sample on which the user has triggered the zoom function. The primary and adjacent zooming areas are defined when the user starts the zoom function on a given area. The coordinates of a primary zooming area and the adjacent zooming areas are defined with the concept of the eight-neighborhood technique. When using the eight-neighborhood technique, the area where the user has started the zooming function (primary zooming area) is the center and the neighboring areas are defined as adjacent zooming areas.
In order to mark the corresponding area not only on the given sample but also on the whole series section as primary/adjacent areas, Equation (1) was applied.
i   1 , , N   \ N   N +
S i = X 1 , Y 1 , i X , Y 1 , i X + 1 , Y 1 , i X 1 , Y , i X , Y , i X + 1 , Y , i X 1 , Y + 1 , i X , Y + 1 , i X + 1 , Y + 1 , i
The abbreviations in Equation (1) have the following meanings:
  • S i : Matrix containing the coordinates of the primary and adjacent areas;
  • N : The total number of samples in the total pathological serial section;
  • i : The index of the currently selected sample in the series section.
The areas marked with the method used in Equation (1) are shown in Figure 9.

3.4. Using Eye-Tracking for the Quality Assurance of Medical Image Processing

During our research, it was of paramount importance to be able to determine how much time the doctor/researcher spent in each area during the examination of the displayed sample and where they triggered the magnification function. In order to obtain the most accurate data possible on the coverage of the sample evaluation, we used eye-tracking technology. We combined our previously developed 3D visualization solution [46] with the capabilities of eye-tracking in a virtual reality environment. The VR headset used in our research allowed us to obtain direct data on the user’s eye movements. This allowed us to measure how long the user looked at each area of the medical sample, with an accuracy of up to milliseconds.
The following VR tools and accessories were used in our research:
  • Vive Focus 3 VR device;
  • Vive Focus 3 Eye tracker extension.
Thanks to the add-on used and the compatibility of the graphics engine, a continuous stream of data on the user’s eye movements can be obtained. Using the above-mentioned eye-tracking extension, data on eye movements were obtained at 120 Hz. To put eye-tracking into practice, we used a so-called raycast solution. This means that a collision line was started from the eye position provided by the eye-tracking hardware in the graphics engine. We then examined which part of the medical sample that line collides with. The visualization of the eye-tracking data recorded during the data capture is shown in Section 3.5.
In order to use eye-tracking data to determine the extent to which the entire serial section has been processed, we have defined Equations (2)–(4). Figure 10 shows the relationship of the equations. These are as follows:
A v s x = 0       A t ( x ) < P a v t 1       A t x   P a v t
The abbreviations in Equation (2) have the following meanings:
  • A v s ( x ) : Evaluation status of areas currently being examined;
  • A t ( x ) : Time spent on the area being examined;
  • P a v t : The limit value at which the area currently being examined is considered to have been evaluated.
S c ( x ) = i = 0 A n A v s ( i ) A n
The symbols in Equation (3) have the following meanings:
  • S c ( x ) : The evaluation status of a given digitized pathology sample;
  • A n : The total number of areas in a given digitized pathology sample.
S c = i = 0 N s j = 0 A n i A v s ( i , j ) N s × A n
The symbols in Equation (4) have the following meanings:
  • N ; : The total number of samples in the total pathological serial section;
  • A n i : The number of areas in a given sample of a digitized pathology serial section.
The applications of Equations (2)–(4) build on each other. First, the areas that have been tested by the user for more than the acceptance threshold are identified. Next, the number of areas within a given sample is examined and the number of areas considered to have been evaluated is considered. We then do this for all the samples within that serial section. Figure 11 shows the practical application of Equations (2)–(4).

3.5. Testing the Eye-Tracking Solution and the Primary and Adjacent Areas

In order to test the runtime saving of the eye-tracking parameters, we created a testing environment. In this environment, dedicated test software displays eye-tracking data and the location of the primary and adjacent areas. The user interface of this testing software can be seen in Figure 11.
In Figure 11, red dots indicate the areas where the user has spent at least 0.03 s allocated to the minimum evaluation. The minimal acceptance value ( P a v t ) defined based on the P300 value can vary widely, depending on the age of the user or the complexity of the task. In our research, we used an average value. In addition, the current solution would support the definition of different user types, for whom we use different minimum acceptance values to define the areas under investigation. This value is described in Section 1.2. The software also shows the points where the user has zoomed in; these are shown in green, and are the primary zooming areas introduced in Section 3.3. Based on our equations, the state of the evaluation of the current serial section is 0.0116. The value may be low because, as shown in Figure 11, 13 areas were observed for more time than the minimum time required. In addition, the total sample was made up of 1120 areas, so only a small proportion of the total areas was processed. The solution currently presented in this paper examines parts of the medical sample that do not contain tissue samples. In the future, the solution could be complemented with an object detection algorithm, which would be used to evaluate only those areas where tissue samples are located. Figure 11 shows the adjacent zooming areas in orange. We can see that these areas are located around the primary zooming areas (green areas). Figure 11 shows with blue the areas that the user has examined for at least a moment.
In order to test the accuracy of eye-tracking, we also conducted tests in which we visualized the user’s eye movements on one of the medical samples used in our research. The results of the measurements taken during testing are shown in the Table 1. Three test subjects participated in the test. The following parameters were tested:
  • Total number of areas viewed by the user;
  • How many times did the user look inside the defined testing area;
  • Total time spent by the user reviewing the defined test area;
  • Total time spent examining parts of the tissue outside the defined testing area.
As we can see in Table 1, the test was used to see how accurate the eye-tracking used in our research was. During the testing, the subjects were asked to evaluate the area with their gaze marked with a red rectangle in Figure 12. Throughout the testing, we kept checking which part of the sample the subject was currently looking at.
During the tests with three different subjects, a total of 488 measurements were taken, of which 116 were cases where the subject looked inside the marked area. Table 1 shows that the first test subject looked inside the marked area 20.58% of the time, the second test subject 33.87%, and the third test subject 19.84%. Figure 12 shows that all subjects also looked at the parts of the sample that were outside the marked area. In parallel, the amount of time the user spent inside and outside the marked area was measured continuously throughout the testing. Table 1 shows that in all cases the test subjects spent the majority of their time inside the designated area. In image (a), the tester spent 87.86% of the time inside the marked area, in image (b) the tester spent 90.66% of the time, and in image (c) the tester spent 63.57% of the time.

4. Discussion

The basic idea of our research is to develop a system that can provide different quality assurance functionalities to users. To achieve this, our research used VR technology and eye-tracking to determine the evaluation status of a given serial section using our own equations. In addition to these results, in our research we designed and developed a system to capture and share a complete 3D VR pathology image processing session.
Our research had two main objectives. The first was to present the current state of art and the latest technologies in the field of quality assurance in the evaluation of digital medical images. With the first half of our research, we wanted to provide the reader with a review of the current state of development in this area. In the course of our research, we were faced with the fact that, specifically, quality assurance in the evaluation of medical image data is an area where the application of eye-tracking technology could be particularly useful. We have therefore integrated the use of this technology into our own developments. The second goal of our research was to design and develop proprietary solutions that can be applied to improve the quality of image data evaluation in the future.
The results of our research in VR session capture show that during VR usage we were able to successfully capture our pre-set parameters and then reconstruct the previous 3D session based on these parameters. We envisage that this solution could be applied in the education of medical students and in the provision of diagnostic second opinions. In the first case, it would be sufficient for a renowned educator/researcher/physician to perform the diagnostic workflow only once in the VR environment we developed. Once this has been recorded, the students can re-watch and observe the small but crucial steps of the diagnosis as many times as they like. In the second case, a user can record their entire session and then share it with a colleague. The shared session can then be loaded into our system and reconstructed by the colleague, so they can tap into each other’s thinking and, although not at the same time, make a joint diagnosis. Capturing a complete virtual session has many positive aspects. The benefits of VR session recording are as follows:
  • Full sessions can be shared:
    Sharing full sessions can make it easier to obtain second/third opinions. The user can share the entire recorded 3D session with a colleague, so that his/her colleague will see exactly what he/she saw in 3D. This solution avoids misunderstandings when diagnosing image data.
  • Verifiability of the medical image data examination process:
    Since the entire 3D session is recorded, we can reconstruct past 3D evaluations using different algorithms. This allows us to examine which parts of the sample were examined by the physician and for how long. We can also check whether the whole area of the sample was examined when making the diagnosis, and whether any parts were excluded.
  • Improving medical education materials:
    Three-dimensional VR sessions captured with our solution could be suitable for use in medical education. It is sufficient for the instructor/researcher to record a complete session only once, which can then be shared with students. The students can then replay the 3D diagnostic session recorded by the instructor as many times as they wish.
In our results presented in Section 3.4, we have generated our own equations to determine the evaluation coverage of a pathology serial section displayed in full 3D. To determine this desired evaluation coverage metric, we have applied an eye-tracking technique. Using eye-tracking, we were able to determine which areas were examined for how long by the user. The claims made in the literature we used in our research and our findings on these claims are shown in Table 2.
The advantages of the solution presented in this paper include the ability to capture medical image data for evaluation and to determine the overview of individual samples. The trade-offs of the presented solution are that it currently only works within the previously described PathoVR software system and that it does not currently support common standards such as HDF5.

5. Conclusions

To summarize our research, at the beginning of this article, we introduced the reader to the technologies that are directly related to the area we are researching. We then presented the current state of our research area, presenting the reader with the latest published results in the field of quality assurance with a focus on the evaluation of medical image data. In the next section of this article, we present the reader with the results of recent research on the reproduction of medical diagnoses. We have built a system capable of capturing, sharing, and reconstructing full VR workflows, and we have created our own equations to determine the evaluation status of a complete medical sample. The data-capture solution created in our research is able to record, with millisecond accuracy, the different activities that the user performs in 3D space while making a diagnosis. In this research, we have introduced the so-called primary and adjacent zooming area reporting in the 3D evaluation of digitized medical samples. Using these concepts, we are able to isolate the areas of the medical sample on which the user has triggered magnification functions. In the future, the logical separation of these areas may also contribute to the determination of the evaluation status of medical image data.
In the future, we plan to extend the list of monitored parameters related to VR session recording, so that we can obtain an even more complex picture of the 3D diagnostic steps of a given user. In addition, we plan to extend our equations for the evaluation of the full sequence metric with additional parameters. This means that we plan to monitor not only eye-tracking but also other human physiological parameters during the evaluation of the displayed image data. In the future, we plan to measure the user’s EEG data at runtime, so that we can assign dynamic minimum acceptance times to each area of the displayed sample. Furthermore, a possible future development area for our system is the support of multi-user scenarios. In this case, we need to monitor which user is associated with which parameter changes and actions. Moreover, machine learning has huge potential for advancing our research. If we monitor and save enough research, we could look for patterns between different tissue lesions and the course of evaluations.

Author Contributions

Conceptualization, M.V.; methodology, M.V.; software, M.V.; validation, M.V.; formal analysis, M.V. and M.K.; investigation, M.V.; resources, B.M. and M.K.; data curation, M.V.; writing—original draft preparation, M.V.; writing—review and editing, M.V.; visualization, M.V.; supervision, B.M. and M.K.; project administration, M.K.; funding acquisition, M.K. All authors have read and agreed to the published version of the manuscript.

Funding

The research was supported by the 2024-2.1.1 University Research Scholarship Program of the Ministry for Culture and Innovation from the source of the National Research, Development, and Innovation Fund. The authors would like to thank the 2019-1.3.1-KK-2019-00007 “Innovációs szolgáltató bázis létrehozása diagnosztikai, terápiás és kutatási célú kiberorvosi rendszerek fejlesztésére” national project for the financial support.

Data Availability Statement

The datasets presented in this article are not readily available because of legal or ethical reasons. Requests to access the datasets should be directed to Miklos Vincze.

Acknowledgments

The authors would like to thank the AIAM (Applied Informatics and Applied Mathematics) doctoral school of Obuda University, Budapest, Hungary, for their support in this research. The research was supported by the 2024-2.1.1 University Research Scholarship Program of the Ministry for Culture and Innovation from the source of the National Research, Development, and Innovation Fund.

Conflicts of Interest

Author Bela Molnar was employed by the company 3DHISTECH Ltd. The remaining authors declare that the research was conducted in the absence of any commercial or financial relationships that could be construed as a potential conflict of interest.

References

  1. Angel Arul Jothi, J.; Mary Anita Rajam, V. A survey on automated cancer diagnosis from histopathology images. Artif. Intell. Rev. 2017, 48, 31–81. [Google Scholar] [CrossRef]
  2. Pena, G.; Andrade-Filho, J. How Does a Pathologist Make a Diagnosis? Arch. Pathol. Lab. Med. 2009, 133, 124–132. [Google Scholar] [CrossRef]
  3. Saalfeld, S.; Saalfeld, P.; Berg, P.; Merten, N.; Preim, B. How to Evaluate Medical Visualizations on the Example of 3D Aneurysm Surfaces. In Proceedings of the Eurographics Workshop on Visual Computing for Biology and Medicine, Bergen, Norway, 7–9 September 2016. [Google Scholar]
  4. Smith, B.; Hermsen, M.; Lesser, E.; Ravichandar, D.; Kremers, W. Developing image analysis pipelines of whole-slide images: Pre- and post-processing. J. Clin. Trans. Sci. 2021, 5, e38. [Google Scholar] [CrossRef] [PubMed]
  5. Sorell, T.; Li, R. Digital Pathology Scanners and Contextual Integrity. Digit. Soc. 2023, 2, 56. [Google Scholar] [CrossRef]
  6. Bankhead, P.; Loughrey, M.B.; Fernández, J.A.; Dombrowski, Y.; McArt, D.G.; Dunne, P.D.; McQuaid, S.; Gray, R.T.; Murray, L.J.; Coleman, H.G.; et al. QuPath: Open source software for digital pathology image analysis. Sci. Rep. 2017, 7, 16878. [Google Scholar] [CrossRef]
  7. Sobirov, I.; Saeed, N.; Yaqub, M. Super Images—A New 2D Perspective on 3D Medical Imaging Analysis. arXiv 2023, arXiv:2205.02847. [Google Scholar]
  8. Wang, S.; Feng, W.; Guo, W. A Survey on 3D Medical Image Visualization. Adv. Mater. Res. 2012, 546–547, 416–419. [Google Scholar] [CrossRef]
  9. Gao, Y.; Chen, X.; Yang, Q.; Lasso, A.; Kolesov, I.; Pieper, S.; Kikinis, R.; Tannenbaum, A.; Zhu, L. An effective and open source interactive 3D medical image segmentation solution. Sci. Rep. 2024, 14, 29878. [Google Scholar] [CrossRef]
  10. Falk, M.; Ynnerman, A.; Treanor, D.; Lundström, C. Interactive Visualization of 3D Histopathology in Native Resolution. IEEE Trans. Vis. Comput. Graph. 2018, 25, 1008–1017. [Google Scholar] [CrossRef]
  11. Umirzakova, S.; Ahmad, S.; Khan, L.U.; Whangbo, T. Medical image super-resolution for smart healthcare applications: A comprehensive survey. Inf. Fusion 2024, 103, 102075. [Google Scholar] [CrossRef]
  12. Marques Godinho, T.; Lebre, R.; Silva, L.B.; Costa, C. An efficient architecture to support digital pathology in standard medical imaging repositories. J. Biomed. Inform. 2017, 71, 190–197. [Google Scholar] [CrossRef]
  13. Ruusuvuori, P.; Valkonen, M.; Kartasalo, K.; Valkonen, M.; Visakorpi, T.; Nykter, M.; Latonen, L. Spatial analysis of histology in 3D: Quantification and visualization of organ and tumor level tissue environment. Heliyon 2022, 8, e08762. [Google Scholar] [CrossRef] [PubMed]
  14. Adelson, E.H.; Anderson, C.H.; Bergen, J.R.; Burt, P.J.; Ogden, J.M. Pyramid methods in image processing. RCA Eng. 1984, 29, 33–41. [Google Scholar]
  15. Ashman, K.; Zhuge, H.; Shanley, E.; Fox, S.; Halat, S.; Sholl, A.; Summa, B.; Brown, J.Q. Whole slide image data utilization informed by digital diagnosis patterns. J. Pathol. Inf. 2022, 13, 100113. [Google Scholar] [CrossRef]
  16. Arimura, H.; Magome, T.; Yamashita, Y.; Yamamoto, D. Computer-Aided Diagnosis Systems for Brain Diseases in Magnetic Resonance Images. Algorithms 2009, 2, 925. [Google Scholar] [CrossRef]
  17. Chan, H.-P.; Doi, K.; Galhotra, S.; Vyborny, C.J.; MacMahon, H.; Jokich, P.M. Image feature analysis and computer-aided diagnosis in digital radiography. I. Automated detection of microcalcifications in mammography. Med. Phys. 1987, 14, 538–548. [Google Scholar] [CrossRef]
  18. Giger, M.L.; Doi, K.; MacMahon, H. Image feature analysis and computer-aided diagnosis in digital radiography. 3. Automated detection of nodules in peripheral lung fields. Med. Phys. 1988, 15, 158–166. [Google Scholar] [CrossRef]
  19. Yanase, J.; Triantaphyllou, E. A Systematic Survey of Computer-Aided Diagnosis in Medicine: Past and Present Developments. Expert Syst. Appl. 2019, 138, 112821. [Google Scholar] [CrossRef]
  20. Williams, B.; Knowles, C.; Treanor, D. Maintaining quality diagnosis with digital pathology: A practical guide to ISO 15189 accreditation. J. Clin. Pathol. 2019, 72, 663–668. [Google Scholar] [CrossRef]
  21. Mcauliffe, M.; Lalonde, F.; McGarry, D.P.; Gandler, W.; Csaky, K.; Trus, B. Medical Image Processing, Analysis & Visualization in Clinical Research. In Proceedings of the 14th IEEE Symposium on Computer-Based Medical Systems, CBMS 2001, Bethesda, MD, USA, 26–27 July 2001; Volume 14, p. 386. [Google Scholar] [CrossRef]
  22. Chong, Y.; Bae, J.; Kang, D.W.; Kim, G.; Han, H. Development of quality assurance program for digital pathology by the Korean Society of Pathologists. J. Pathol. Transl. Med. 2022, 56, 370–382. [Google Scholar] [CrossRef]
  23. Weng, Z.; Seper, A.; Pryalukhin, A.; Mairinger, F.; Wickenhauser, C.; Bauer, M.; Glamann, L.; Bläker, H.; Lingscheidt, T.; Hulla, W.; et al. GrandQC: A comprehensive solution to quality control problem in digital pathology. Nat. Commun. 2024, 15, 10685. [Google Scholar] [CrossRef]
  24. Aeffner, F.; Zarella, M.D.; Buchbinder, N.; Bui, M.M.; Goodman, M.R.; Hartman, D.J.; Lujan, G.M.; Molani, M.A.; Parwani, A.V.; Lillard, K.; et al. Introduction to Digital Image Analysis in Whole-slide Imaging: A White Paper from the Digital Pathology Association. J. Pathol. Inform. 2019, 10, 9. [Google Scholar] [CrossRef] [PubMed]
  25. Xi, C.; Cao, D. Quality management in anatomic pathology: The past, present, and future. iLABMED 2023, 1, 75–81. [Google Scholar] [CrossRef]
  26. Wright, A.I.; Dunn, C.M.; Hale, M.; Hutchins, G.G.A.; Treanor, D.E. The Effect of Quality Control on Accuracy of Digital Pathology Image Analysis. IEEE J. Biomed. Health Inf. 2021, 25, 307–314. [Google Scholar] [CrossRef] [PubMed]
  27. Brixtel, R.; Bougleux, S.; Lézoray, O.; Caillot, Y.; Lemoine, B.; Fontaine, M.; Nebati, D.; Renouf, A. Whole Slide Image Quality in Digital Pathology: Review and Perspectives. IEEE Access 2022, 10, 131005–131035. [Google Scholar] [CrossRef]
  28. World Health Organization. Laboratory Quality Management System: Handbook; World Health Organization: Geneva, Switzerland, 2011; p. 247. [Google Scholar]
  29. Beard, D.V.; Johnston, R.E.; Toki, O.; Wilcox, C. A study of radiologists viewing multiple computed tomography examinations using an eyetracking device. J. Digit. Imag. 1990, 3, 230–237. [Google Scholar] [CrossRef]
  30. Suwa, K.; Furukawa, A.; Matsumoto, T.; Yosue, T. Analyzing the eye movement of dentists during their reading of CT images. Odontology 2001, 89, 54–61. [Google Scholar] [CrossRef]
  31. Kundel, H.L.; Nodine, C.F.; Krupinski, E.A.; Mello-Thoms, C. Using gaze-tracking data and mixture distribution analysis to support a holistic model for the detection of cancers on mammograms. Acad. Radiol. 2008, 15, 881–886. [Google Scholar] [CrossRef]
  32. Holmqvist, K.; Nyström, M.; Andersson, R.; Dewhurst, R.; Jarodzka, H.; Van de Weijer, J. Eye Tracking: A Comprehensive Guide to Methods and Measures; Oxford University Press: Oxford, UK, 2011; Available online: https://global.oup.com/academic/product/eye-tracking-9780199697083?cc=nl&lang=en& (accessed on 18 March 2025).
  33. Gong, H.; Hsieh, S.S.; Holmes, D.R., III; Cook, D.A.; Inoue, A.; Bartlett, D.J.; Baffour, F.; Takahashi, H.; Leng, S.; Yu, L.; et al. An interactive eye-tracking system for measuring radiologists’ visual fixations in volumetric CT images: Implementation and initial eye-tracking accuracy validation. Med. Phys. 2021, 48, 6710–6723. [Google Scholar] [CrossRef]
  34. Leveque, L.; Bosmans, H.; Cockmartin, L.; Liu, H. State of the Art: Eye-Tracking Studies in Medical Imaging. IEEE Access 2018, 6, 37023–37034. [Google Scholar] [CrossRef]
  35. Wang, S.; Ouyang, X.; Liu, T.; Wang, Q.; Shen, D. Follow My Eye: Using Gaze to Supervise Computer-Aided Diagnosis. IEEE Trans. Med. Imaging 2022, 41, 1688–1698. [Google Scholar] [CrossRef] [PubMed]
  36. Sqalli, M.T.; Aslonov, B.; Gafurov, M.; Mukhammadiev, N.; Sqalli Houssaini, Y. Eye tracking technology in medical practice: A perspective on its diverse applications. Front. Med. Technol. 2023, 5, 1253001. [Google Scholar] [CrossRef]
  37. Lev, A.; Braw, Y.; Elbaum, T.; Wagner, M.; Rassovsky, Y. Eye tracking during a continuous performance test: Utility for assessing ADHD patients. J. Atten. Disord. 2020, 26, 245–255. [Google Scholar] [CrossRef] [PubMed]
  38. Chen, I.-H.A.; Ghazi, A.; Sridhar, A.; Stoyanov, D.; Slack, M.; Kelly, J.D.; Collins, J.W. Evolving robotic surgery training, improving patient safety, with the integration of novel technologies. World J. Urol. 2020, 39, 2883–2893. [Google Scholar] [CrossRef]
  39. Picton, T. The P300 Wave of the Human Event-Related Potential. J. Clin. Neurophysiol. Off. Publ. Am. Electroencephalogr. Soc. 1992, 9, 456–479. [Google Scholar] [CrossRef]
  40. Polich, J.; Herbst, K. P300 as a clinical assay: Rationale, evaluation, and findings. Int. J. Psychophysiol. Off. J. Int. Organ. Psychophysiol. 2000, 38, 3–19. [Google Scholar] [CrossRef] [PubMed]
  41. Singh, A.; Sodani, A.K.; Chouksey, D.; Jain, R. Value of P300 as a Screening Tool of Cognitive Impairment in Epilepsy: A Prospective Study from India. Rom. J. Neurol. 2021, 20, 161–168. [Google Scholar] [CrossRef]
  42. Pan, J.-B.; Takeshita, T.; Morimoto, K. P300 as a measure of cognitive dysfunction from occupational and environmental insults. Env. Health Prev. Med. 1999, 4, 103–110. [Google Scholar] [CrossRef]
  43. Jackson, S.L.; Frederick, P.D.; Pepe, M.S.; Nelson, H.D.; Weaver, D.L.; Allison, K.H.; Carney, P.A.; Geller, B.M.; Tosteson, A.N.; Onega, T.; et al. Diagnostic Reproducibility: What Happens When the Same Pathologist Interprets the Same Breast Biopsy Specimen at Two Points in Time? Ann. Surg. Oncol. 2017, 24, 1234–1241. [Google Scholar] [CrossRef]
  44. Haggenmüller, S.; Wies, C.; Abels, J.; Winterstein, J.T.; Heinlein, L.; Nogueira Garcia, C.; Utikal, J.S.; Wohlfeil, S.A.; Meier, F.; Hobelsberger, S.; et al. Discordance, accuracy and reproducibility study of pathologists’ diagnosis of melanoma and melanocytic tumors. Nat. Commun. 2025, 16, 789. [Google Scholar] [CrossRef]
  45. The Site of the SideMatch Software. Available online: https://www.micro-dimensions.com/slidematch (accessed on 29 February 2024).
  46. Vincze, M.; Molnar, B.; Kozlovszky, M. 3D Visualization in Digital Medicine Using XR Technology. Future Internet 2023, 15, 284. [Google Scholar] [CrossRef]
  47. Biricz, B.; Jónás, V.; Vincze, M.; Benhamida, A.; Paulik, R.; Kozlovszky, M. User friendly virtual reality software development and testing. In Proceedings of the 2022 13th IEEE International Conference on Cognitive Infocommunications (CogInfoCom), Budapest, Hungary, 21–23 September 2022; pp. 000087–000092. [Google Scholar] [CrossRef]
  48. Monitoring the Examination of Digitised Pathology Samples in a 3D VR Environment (MTMT). Available online: https://m2.mtmt.hu/gui2/?mode=browse&params=publication;35167933 (accessed on 17 February 2025).
  49. Padmapriya, S.T.; Parthasarathy, S. Ethical Data Collection for Medical Image Analysis: A Structured Approach. ABR 2024, 16, 95–108. [Google Scholar] [CrossRef] [PubMed]
  50. Manjunath, K.N.; Rajaram, C.; Hegde, G.; Kulkarni, A.; Kurady, R.; Manuel, K. A Systematic Approach of Data Collection and Analysis in Medical Imaging Research. Asian Pac. J. Cancer Prev. APJCP 2021, 22, 537–546. [Google Scholar] [CrossRef]
  51. Kiryati, N.; Landau, Y. Dataset Growth in Medical Image Analysis Research. J. Imaging 2021, 7, 155. [Google Scholar] [CrossRef]
  52. Egevad, L.; Cheville, J.; Evans, A.J.; Hörnblad, J.; Kench, J.G.; Kristiansen, G.; Leite, K.R.; Magi-Galluzzi, C.; Pan, C.C.; Samaratunga, H.; et al. Pathology Imagebase—A reference image database for standardization of pathology. Histopathology 2017, 71, 677–685. [Google Scholar] [CrossRef]
Figure 1. The pipeline of the preparation of digitized pathological tissue samples.
Electronics 14 01943 g001
Figure 2. The architecture of an image pyramid.
Electronics 14 01943 g002
Figure 3. Three-dimensional samples from the pathological serial sections used in our research.
Electronics 14 01943 g003
Figure 4. The architecture of our 3D examination recording/reconstruction solution.
Electronics 14 01943 g004
Figure 5. The architecture of runtime parameter recording. (a) Figure showing the use of separate buffers for different monitoring parameters. (b) Merging and ordering of the different buffers.
Electronics 14 01943 g005
Figure 6. (a) Reconstruction/playback of a recorded 3D session. (b) An example of parameter generation during a VR medical image processing session. (A) The ID that identifies the data type. (B) The data associated with the recorded data type. (C) Time stamp parameter of the data generated during the VR session.
Electronics 14 01943 g006
Figure 7. Time elapsed between different activities of a given parameter. (a) The temporal differences between each occurrence of the measured parameter, looking at the parameter’s own buffer, before merging. (b) The time differences between each occurrence of the measured parameter when looking at the merged buffer.
Electronics 14 01943 g007
Figure 8. Measuring the size of the result file generated when the examination parameters were recorded. (a) Changes in the size of the result file during examinations with different duration. (b) Variation in the average activity number for examination with different duration.
Electronics 14 01943 g008
Figure 9. The primary zooming areas and the adjacent zooming areas of a sample. In the image, green squares indicate primary zooming areas, orange squares indicate adjacent zooming areas, and transparent squares indicate areas that have not been examined.
Electronics 14 01943 g009
Figure 10. Diagram showing the relationship between Equations (2)–(4).
Electronics 14 01943 g010
Figure 11. The results of the testing of our eye-tracking-based quality assurance equations.
Electronics 14 01943 g011
Figure 12. The visualization of the eye-tracking data on one of the pathological samples. The area marked by the red rectangle in the figure was the area that users had to evaluate with their eyes during the testing. (a) Visualization of the eye-tracking test results for the first tester. (b) Visualization of the eye-tracking test results for the second tester. (c) Visualization of the eye-tracking test results for the third tester.
Electronics 14 01943 g012
Table 1. Testing the time measurement related to eye-tracking.
Tester IDNumber of All MeasurementsNumber of Measurements Within the Testing AreaTime Spent Inside the Testing Area. (Second)Time Spent Outside the Testing Area. (Second)Measurements in the Test Area (%)
123849123,13117,00320.58
212442118,55812,21133.87
31262519,91911,41119.84
Table 2. The summary of the connection between the current study and previous researches.
Findings from the Research Used in the Current Study.Results of the Actual Study
In the article, the authors state that the analysis and evaluation of digitized pathology samples is typically performed manually by highly skilled physicians/researchers [51].In the article, the authors state that the analysis and evaluation of digitized pathology samples is typically performed manually by highly skilled physicians/researchers. We fully agree with this statement, which is why we have created a system capable of monitoring, saving, and reconstructing the evaluation of a skilled pathologist.
The article notes that there are currently few quality assurance programs for users in digital pathology [24].We agree with the findings of the research, but the number of such programs is growing. The aim of our research presented in this paper was also to design and build a system that can track and score the evaluation status of a given serial section.
In their paper, the authors present the design and creation of a reference image database in which pathologists can further train themselves [52].In our research, we designed and built a system similar to the one in the linked article. The presented system can capture and share complete 3D diagnostic sessions, allowing doctors/researchers to further train themselves by examining the diagnostic routine of a colleague.
In their paper, the authors mention that gaze-tracking is a subjective parameter and that there is a large variation between users. The authors suggest that a separate solution should be developed to increase the accuracy of gaze-tracking [35].We agree with the author’s statement. Consequently, our future development goals include the design and development of a system that eliminates variability in input data.
The authors present a solution that can find and categorize artifacts that may be generated during the preparation of tissue samples [23]. Detection and identification of these defects can improve the quality of diagnosis.The authors’ solution and the solution presented in this paper can complement each other well, to provide the widest possible range of quality control for the evaluation of tissue samples. The authors’ work can detect and categorize artifacts generated during sample preparation, while the solution presented in this paper can capture the diagnoses performed on samples that are considered good.
Disclaimer/Publisher’s Note: The statements, opinions and data contained in all publications are solely those of the individual author(s) and contributor(s) and not of MDPI and/or the editor(s). MDPI and/or the editor(s) disclaim responsibility for any injury to people or property resulting from any ideas, methods, instructions or products referred to in the content.

