PreEdgeDB: A Lightweight Platform for Energy Prediction on Low-Power Edge Devices


Abstract
1. Introduction
- (1)
- We develop a lightweight energy prediction model optimized for edge devices with low power consumption.
- (2)
- The proposed PreEdgeDB system improves prediction accuracy by optimizing time-series data while minimizing processing overhead.
- (3)
- We validate the effectiveness of our approach using real-world industrial datasets and demonstrate its superiority over existing methods.
2. Related Work
3. Preliminaries
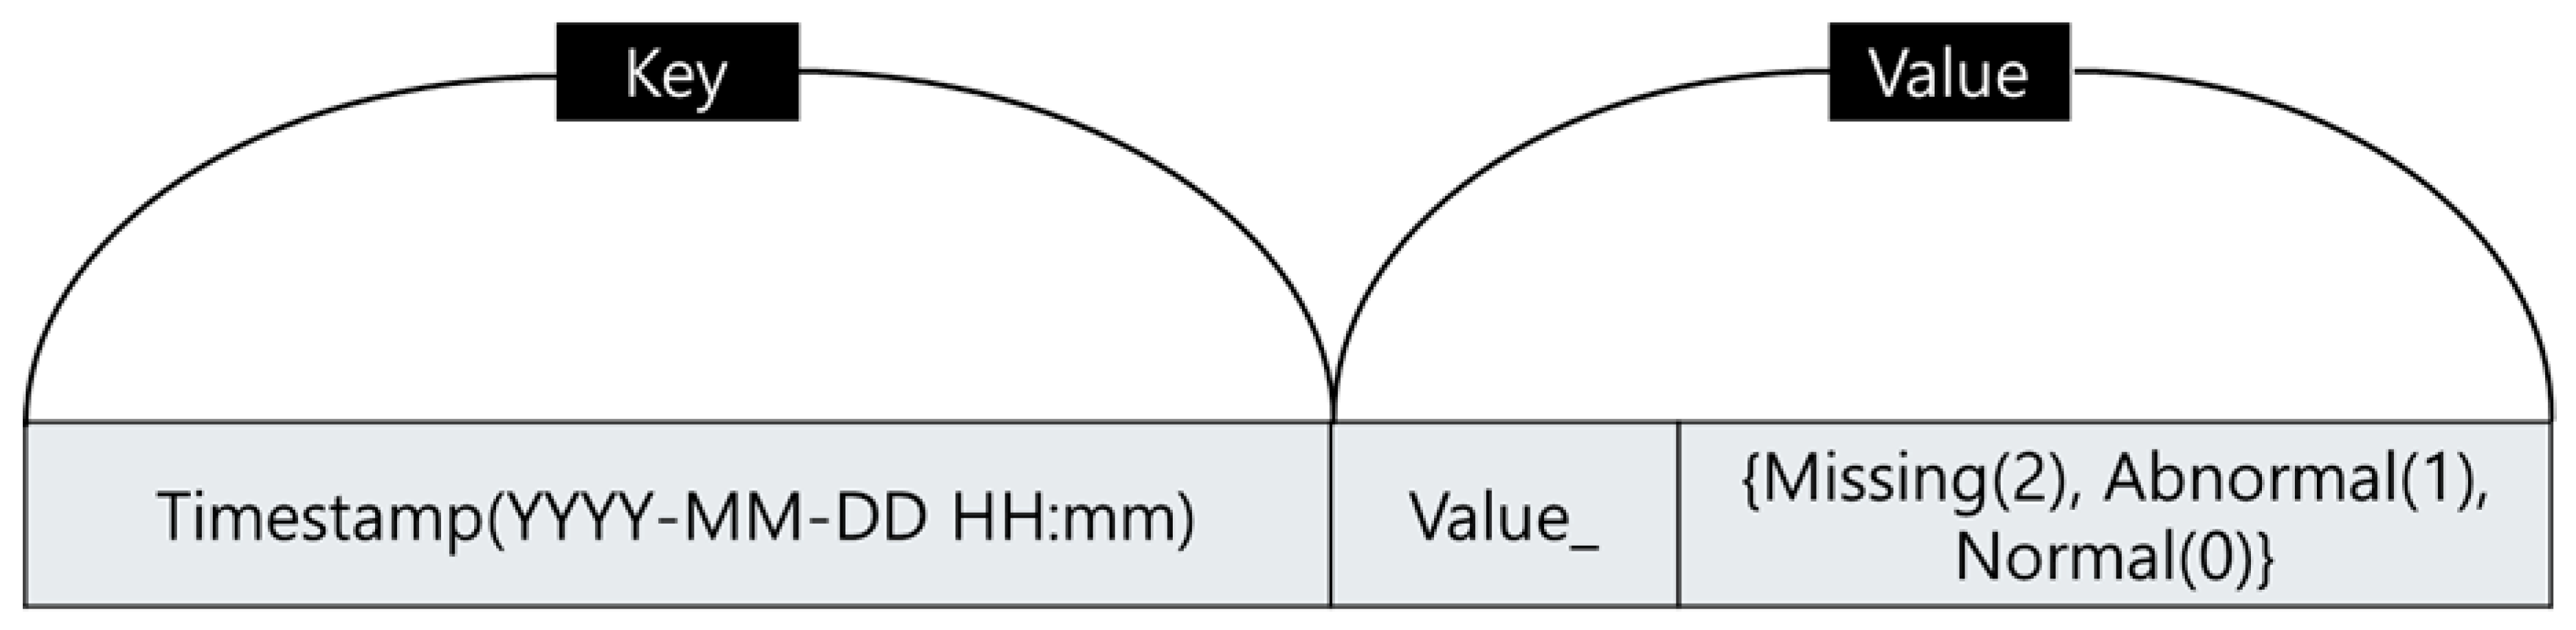
3.1. Data Preprocessing
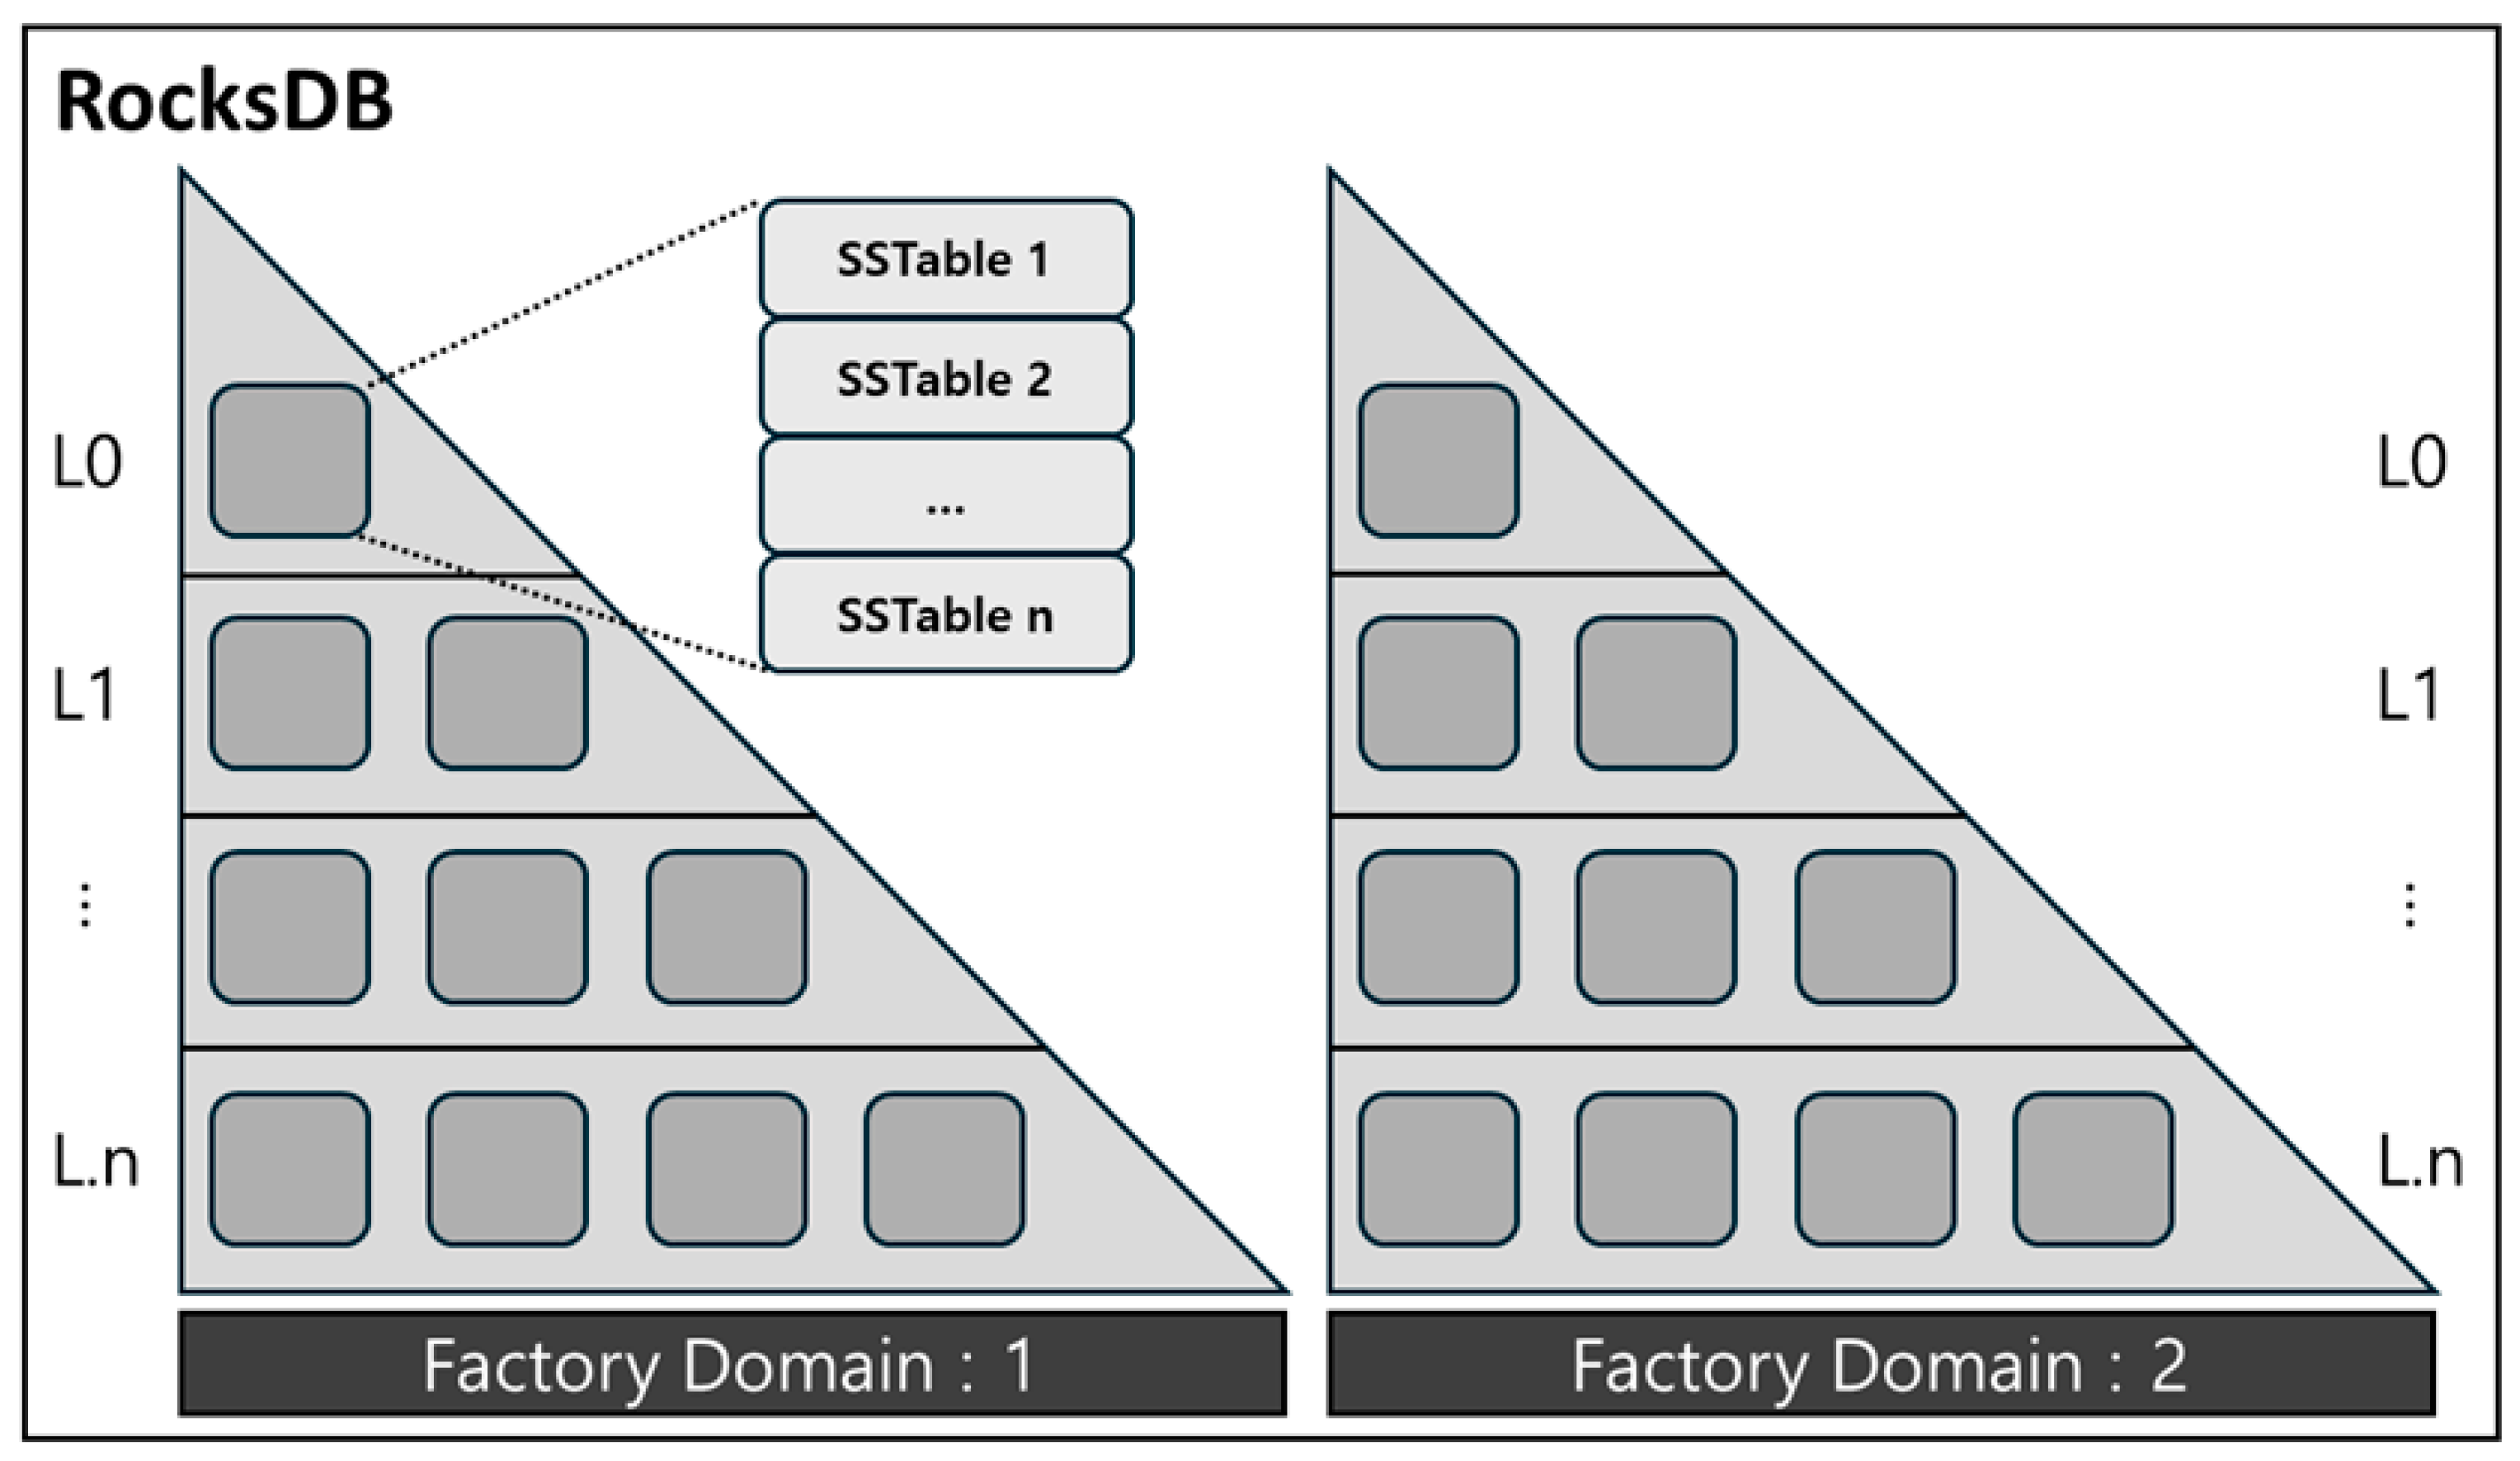
3.2. RocksDB
3.3. Artificial Intelligence
3.3.1. MLP
3.3.2. LSTM
3.3.3. LightGBM
3.4. Performance Metrics for AI Models
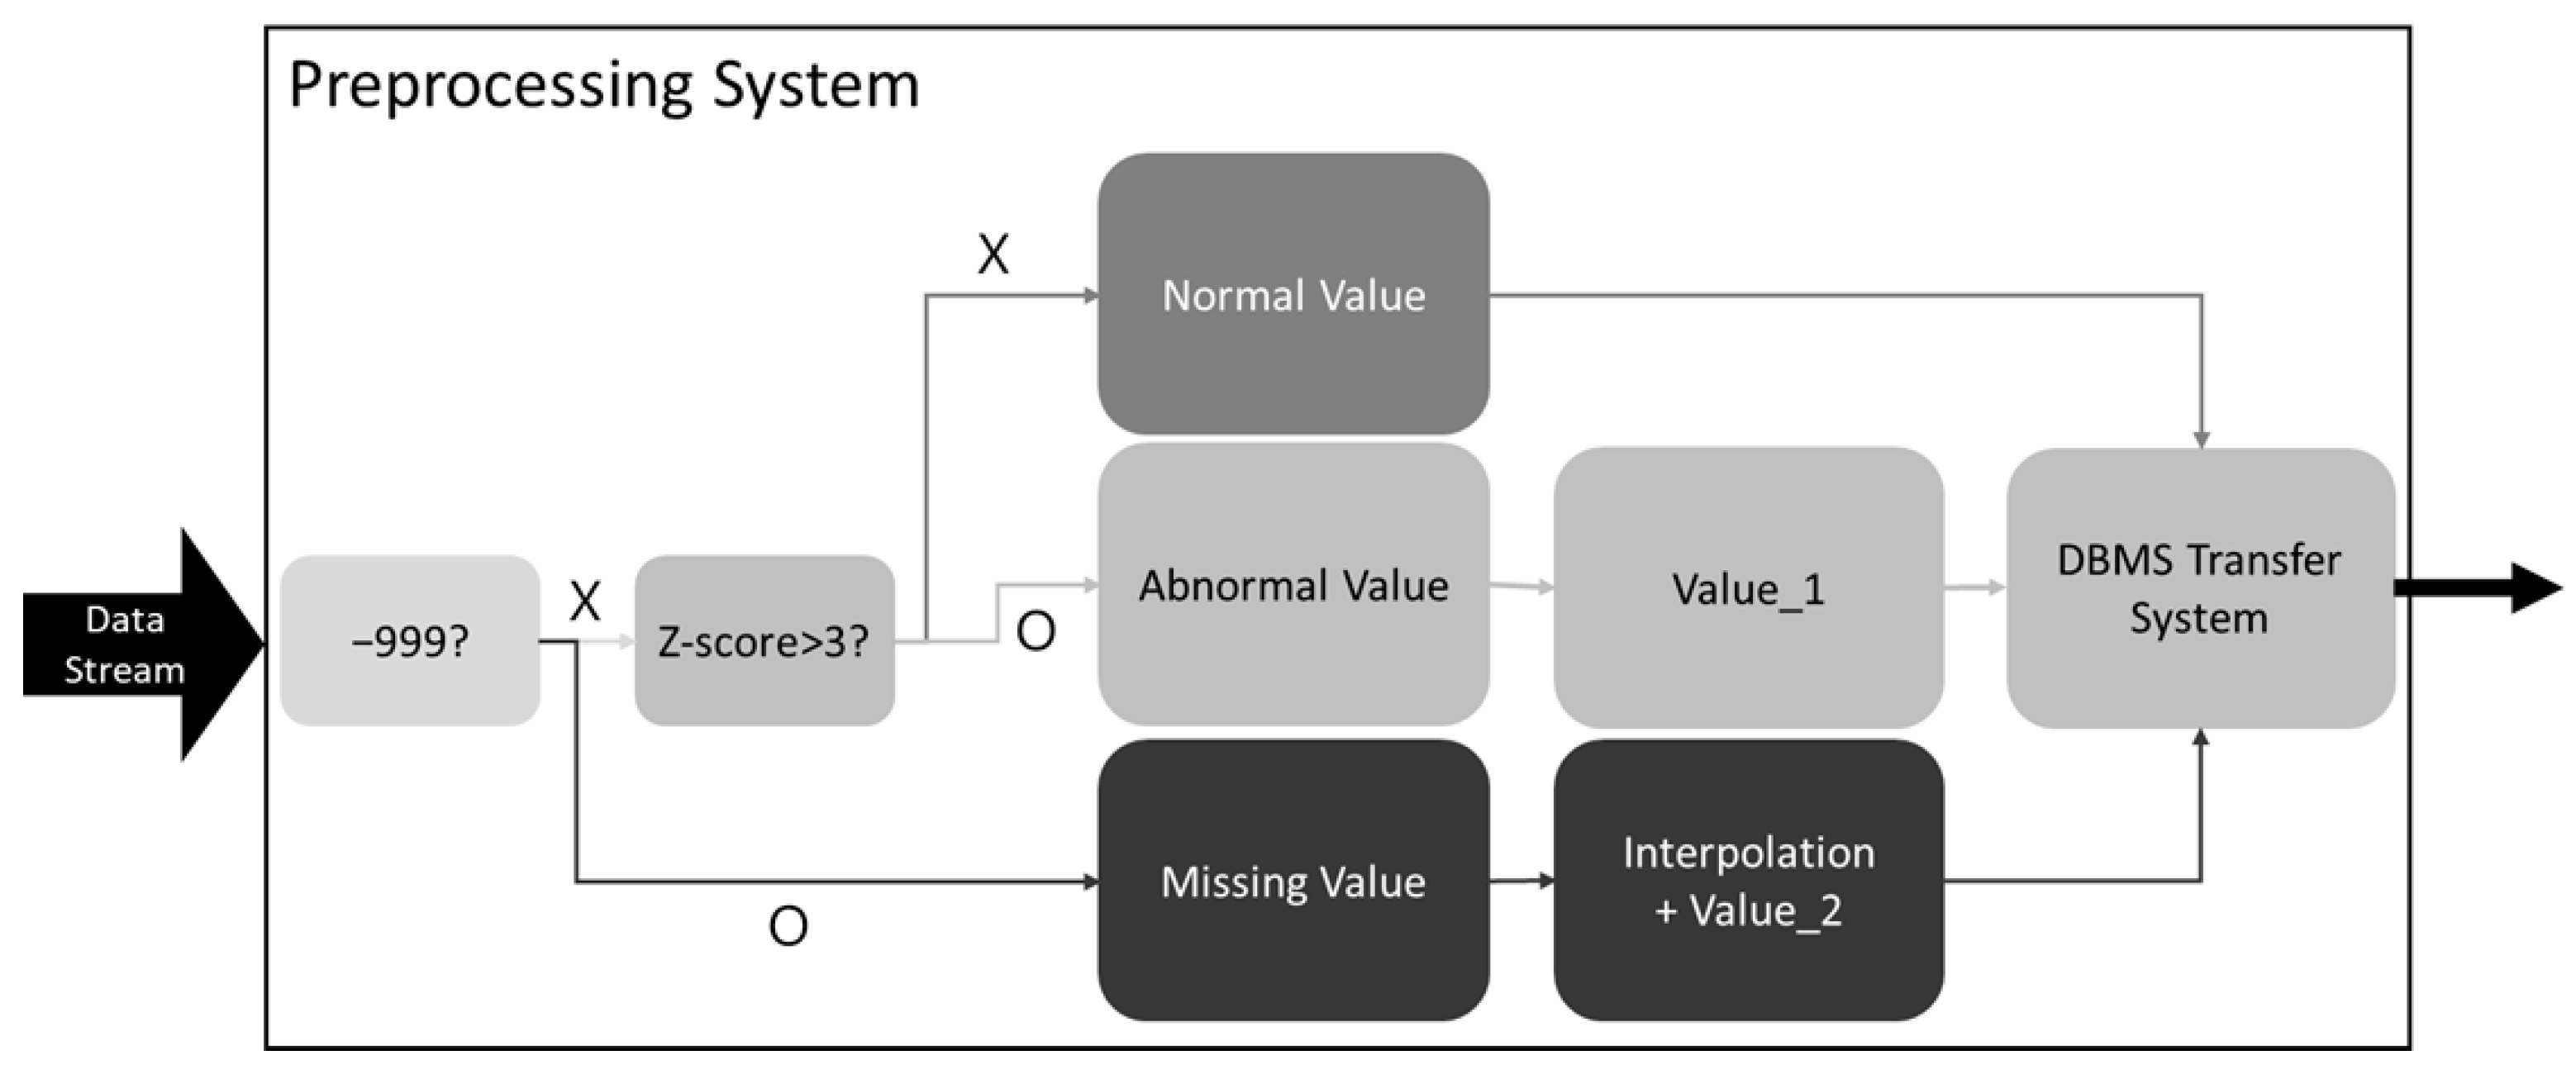
4. Preprocessing Methodology
5. Time-Series Data Optimization in PreEdgeDB
6. Experimental Evaluation
6.1. Used Data Type
6.2. Dataset and Experimental Settings
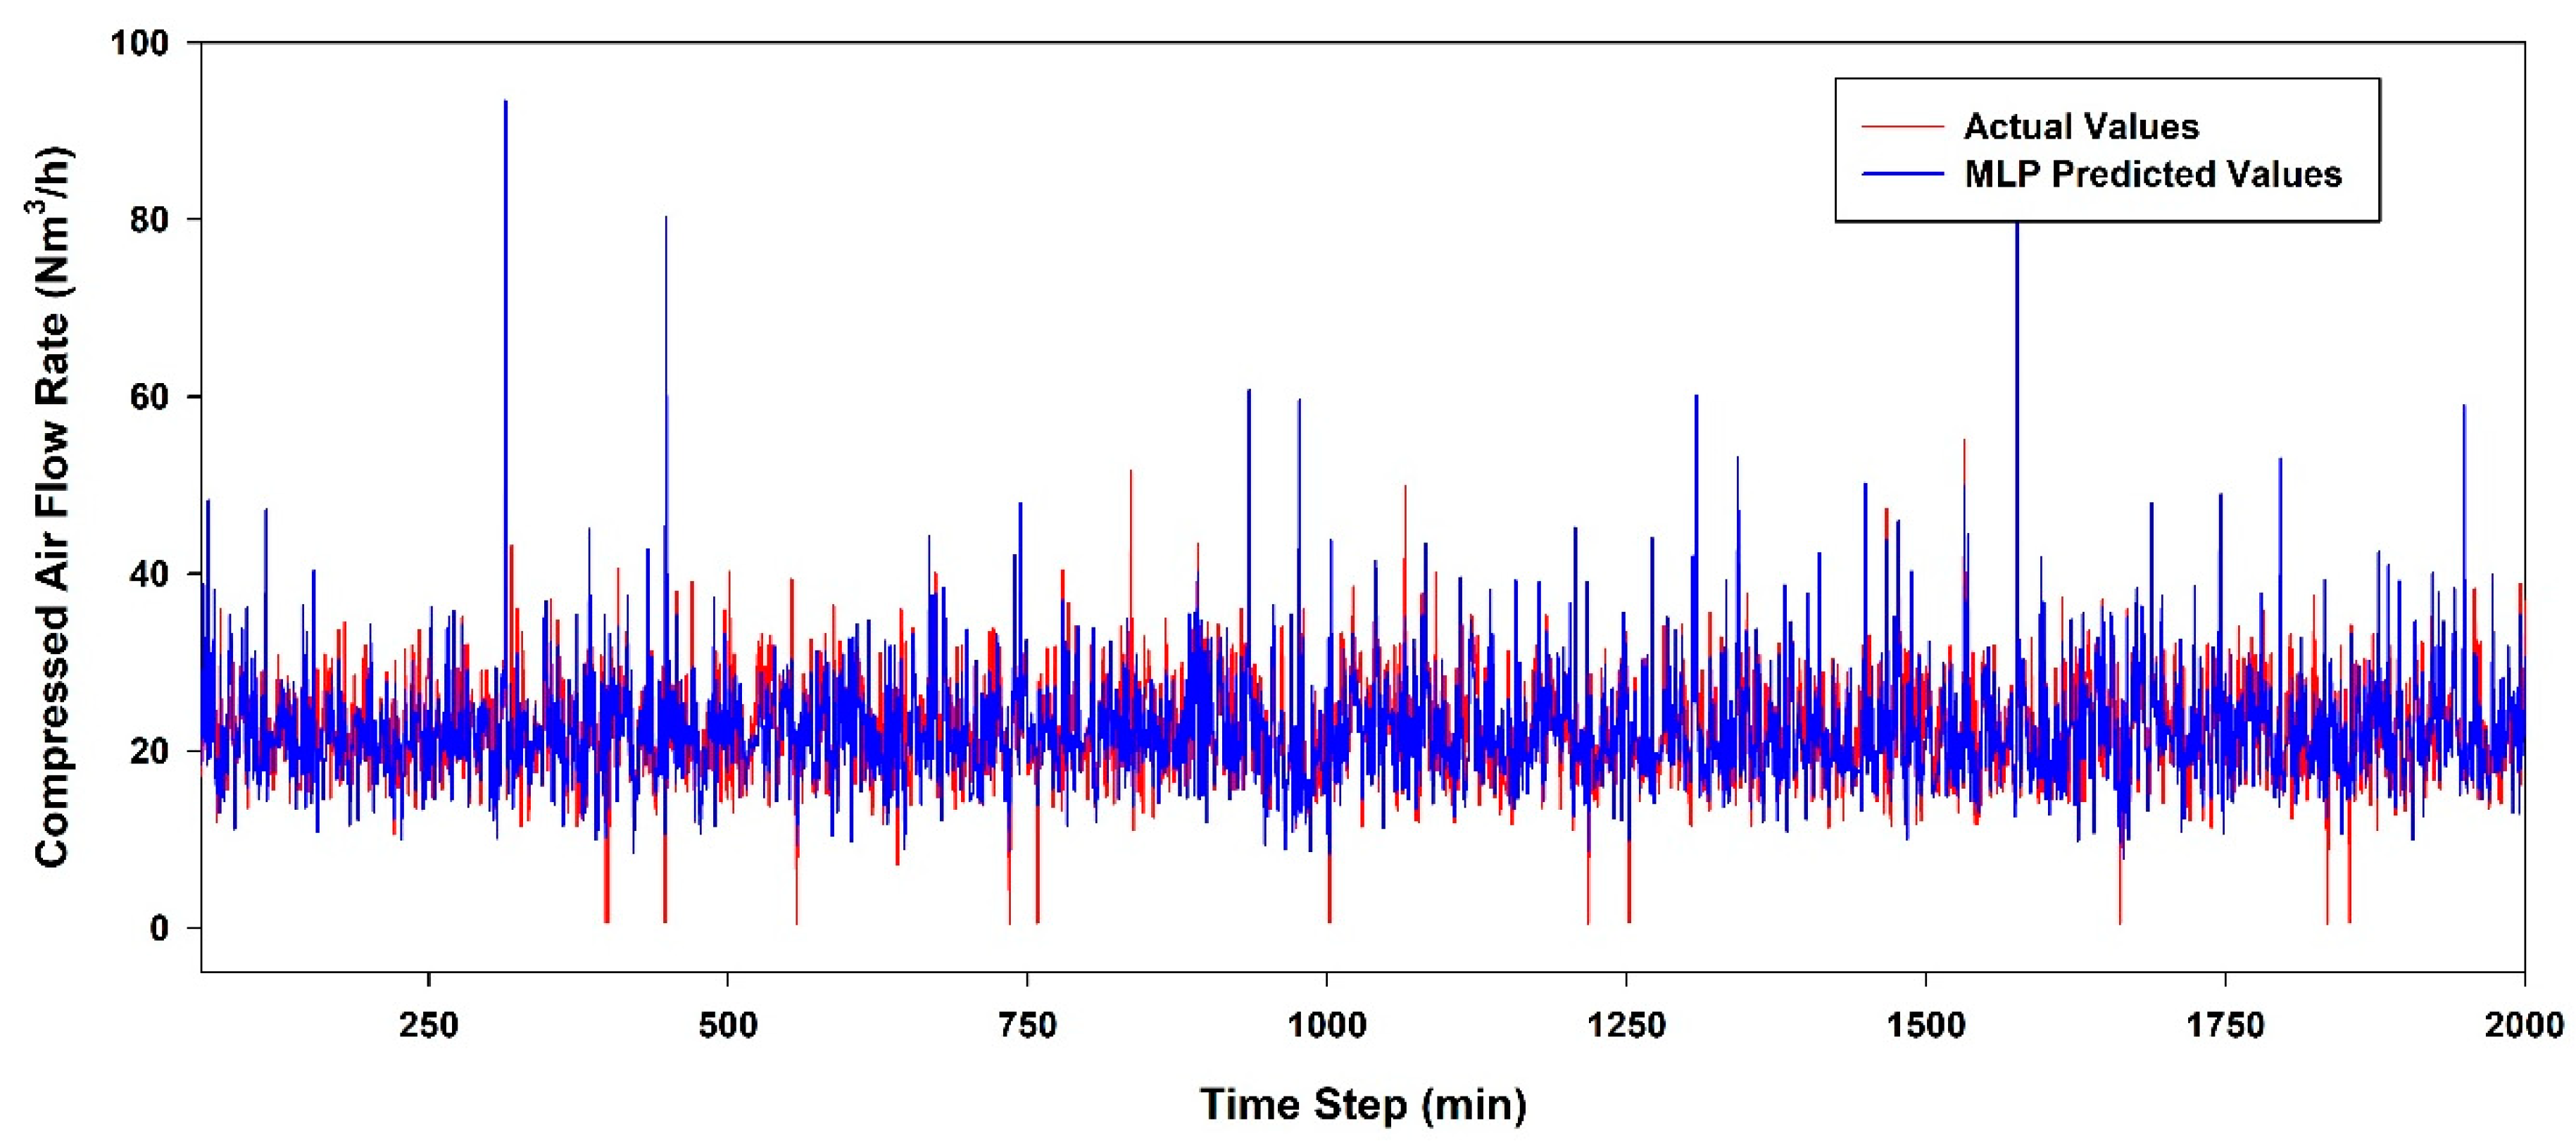
6.3. Performance Evaluation According to the AI Model
7. Discussion and Limitations
8. Conclusions
Author Contributions
Funding
Data Availability Statement
Conflicts of Interest
Abbreviations
| MLP | Multilayer perceptron |
| AI | Artificial intelligence |
| LSTM | Long short-term memory |
| DBMS | Database management system |
| CPU | Central processing unit |
References
- Ministry of Trade. Industry and Energy. 3rd Basic Energy Plan. Available online: https://www.korea.kr/briefing/pressReleaseView.do?newsId=156334773 (accessed on 27 March 2025).
- Korea Energy Agency. Energy Usage Statistics for 2023. Available online: https://www.energy.or.kr/front/board/List9.do (accessed on 27 March 2025).
- Kim, H. Transformation of Energy, Environmental Plant Industry, Carbon Neutrality, and Digitalization. Available online: http://www.engjournal.co.kr/news/articleView.html?idxno=2801 (accessed on 27 March 2025).
- Facebook. RocksDB. Available online: https://rocksdb.org/ (accessed on 27 March 2025).
- Zhu, G.; Liu, D.; Du, Y.; You, C.; Zhang, J.; Huang, K. Toward an intelligent edge: Wireless communication meets machine learning. IEEE Commun. Mag. 2020, 58, 19–25. [Google Scholar] [CrossRef]
- Merenda, M.; Porcaro, C.; Iero, D. Edge machine learning for AI-enabled IoT devices: A Review. Sensors 2020, 20, 2533. [Google Scholar] [CrossRef] [PubMed]
- Murshed, M.S.; Murphy, C.; Hou, D.; Khan, N.; Ananthanarayanan, G.; Hussain, F. Machine learning at the network edge: A survey. ACM Comput. Surv. 2021, 54, 1–37. [Google Scholar] [CrossRef]
- Yazici, M.T.; Basurra, S.; Gaber, M.M. Edge machine learning: Enabling smart internet of things applications. Big Data 2018, 6, 26. [Google Scholar] [CrossRef]
- Verhelst, M.; Murmann, B. Machine learning at the edge. In NANO-CHIPS 2030: On-Chip AI for an Efficient Data-Driven World; Springer: Cham, Switzerland, 2020; pp. 293–322. [Google Scholar] [CrossRef]
- Liu, F.; Tang, G.; Li, Y.; Cai, Z.; Zhang, X.; Zhou, T. A survey on edge computing systems and tools. Proc. IEEE 2019, 107, 1537–1562. [Google Scholar] [CrossRef]
- Cho, W.; Lee, H.; Gu, J.-H. Optimization techniques and evaluation for building an integrated lightweight platform for AI and data collection systems on low-power edge devices. Energies 2024, 17, 1757. [Google Scholar] [CrossRef]
- Karunaratna, S.; Maduranga, P. Artificial intelligence on single board computers: An experiment on sound event classification. In Proceedings of the 2021 5th SLAAI International Conference on Artificial Intelligence (SLAAI-ICAI), Colombo, Sri Lanka, 6–7 December 2021. [Google Scholar] [CrossRef]
- Iqbal, U.; Davies, T.; Perez, P. A review of recent hardware and software advances in GPU-accelerated edge-computing single-board computers (SBCs) for computer vision. Sensors 2024, 24, 4830. [Google Scholar] [CrossRef] [PubMed]
- Guato Burgos, M.F.; Morato, J.; Vizcaino Imacaña, F.P. A review of smart grid anomaly detection approaches pertaining to artificial intelligence. Appl. Sci. 2024, 14, 1194. [Google Scholar] [CrossRef]
- Google. LevelDB. Available online: https://github.com/google/leveldb (accessed on 27 March 2025).
- MySQL. MySQL. Available online: https://www.mysql.com/ (accessed on 27 March 2025).
- Oracle. OracleDB. Available online: https://www.oracle.com/kr/database/ (accessed on 27 March 2025).
- Microsoft. LightGBM. Available online: https://github.com/microsoft/LightGBM (accessed on 27 March 2025).
- Lee, H.; Park, J.; Cho, W.; Kim, D.; Gu, J. Energy demand/supply prediction and simulator UI design for energy efficiency in the industrial complex. J. Converg. Cult. Technol. 2024, 10, 693–700. [Google Scholar] [CrossRef]
- Hochreiter, S.; Schmidhuber, J. Long short-term memory. Neural Comput. 1997, 9, 1735–1780. [Google Scholar] [CrossRef] [PubMed]
- ASHRAE. ASHRAE Guideline. Available online: https://www.ashrae.org/technical-resources/standards-and-guidelines (accessed on 27 March 2025).
- Wikipedia. Programmable Logic Controller. Available online: https://en.wikipedia.org/wiki/Programmable_logic_controller (accessed on 27 March 2025).
- Wikipedia. OPC Unified Architecture. Available online: https://en.wikipedia.org/wiki/OPC_Unified_Architecture (accessed on 27 March 2025).
- Wikipedia. Z-Score. Available online: https://en.wikipedia.org/wiki/Standard_score (accessed on 27 March 2025).
- Wikipedia. Column Family. Available online: https://en.wikipedia.org/wiki/Column_family (accessed on 27 March 2025).
- HardKernel. Odroid M1S. Available online: https://www.hardkernel.com/shop/odroid-m1s-with-8gbyte-ram-io-header/ (accessed on 27 March 2025).
- Wikipedia. Neural Processing Unit. Available online: https://en.wikipedia.org/wiki/Neural_processing_unit (accessed on 27 March 2025).


| Category | Related Work | PreEdgeDB |
|---|---|---|
| Edge device role | Primarily for data collection, with AI models offloaded to servers | Performs data collection, preprocessing, storage, and prediction independently |
| Database usage | Typically file DBs or MyRocks, configured arbitrarily | Optimized RocksDB for low-resource environments |
| AI model application | Small AI models offloaded to cloud or server | Runs LightGBM entirely on the edge, being capable of standalone operation |
| System architecture | Reliant on servers/cloud | Fully functional on local devices, with independent operation |
| Key limitation | Inability to adapt to low-resource devices | Capable of standalone operation on edge devices |
| Data type applied | Various sensor data and large-scale variables | Optimized for predicting single-factory data |
| Parameter | Setting Value |
|---|---|
| Block_Cache_Size | 256 MB |
| Write_Buffer_Size | 32 MB |
| Max_Write_Buffer_Number | 2 |
| Level_Compaction_Dynamic_Level_Bytes | True |
| Max_Background_Compactions | 1 |
| Max_Background_Flushes | 1 |
| Compression | LZ4 |
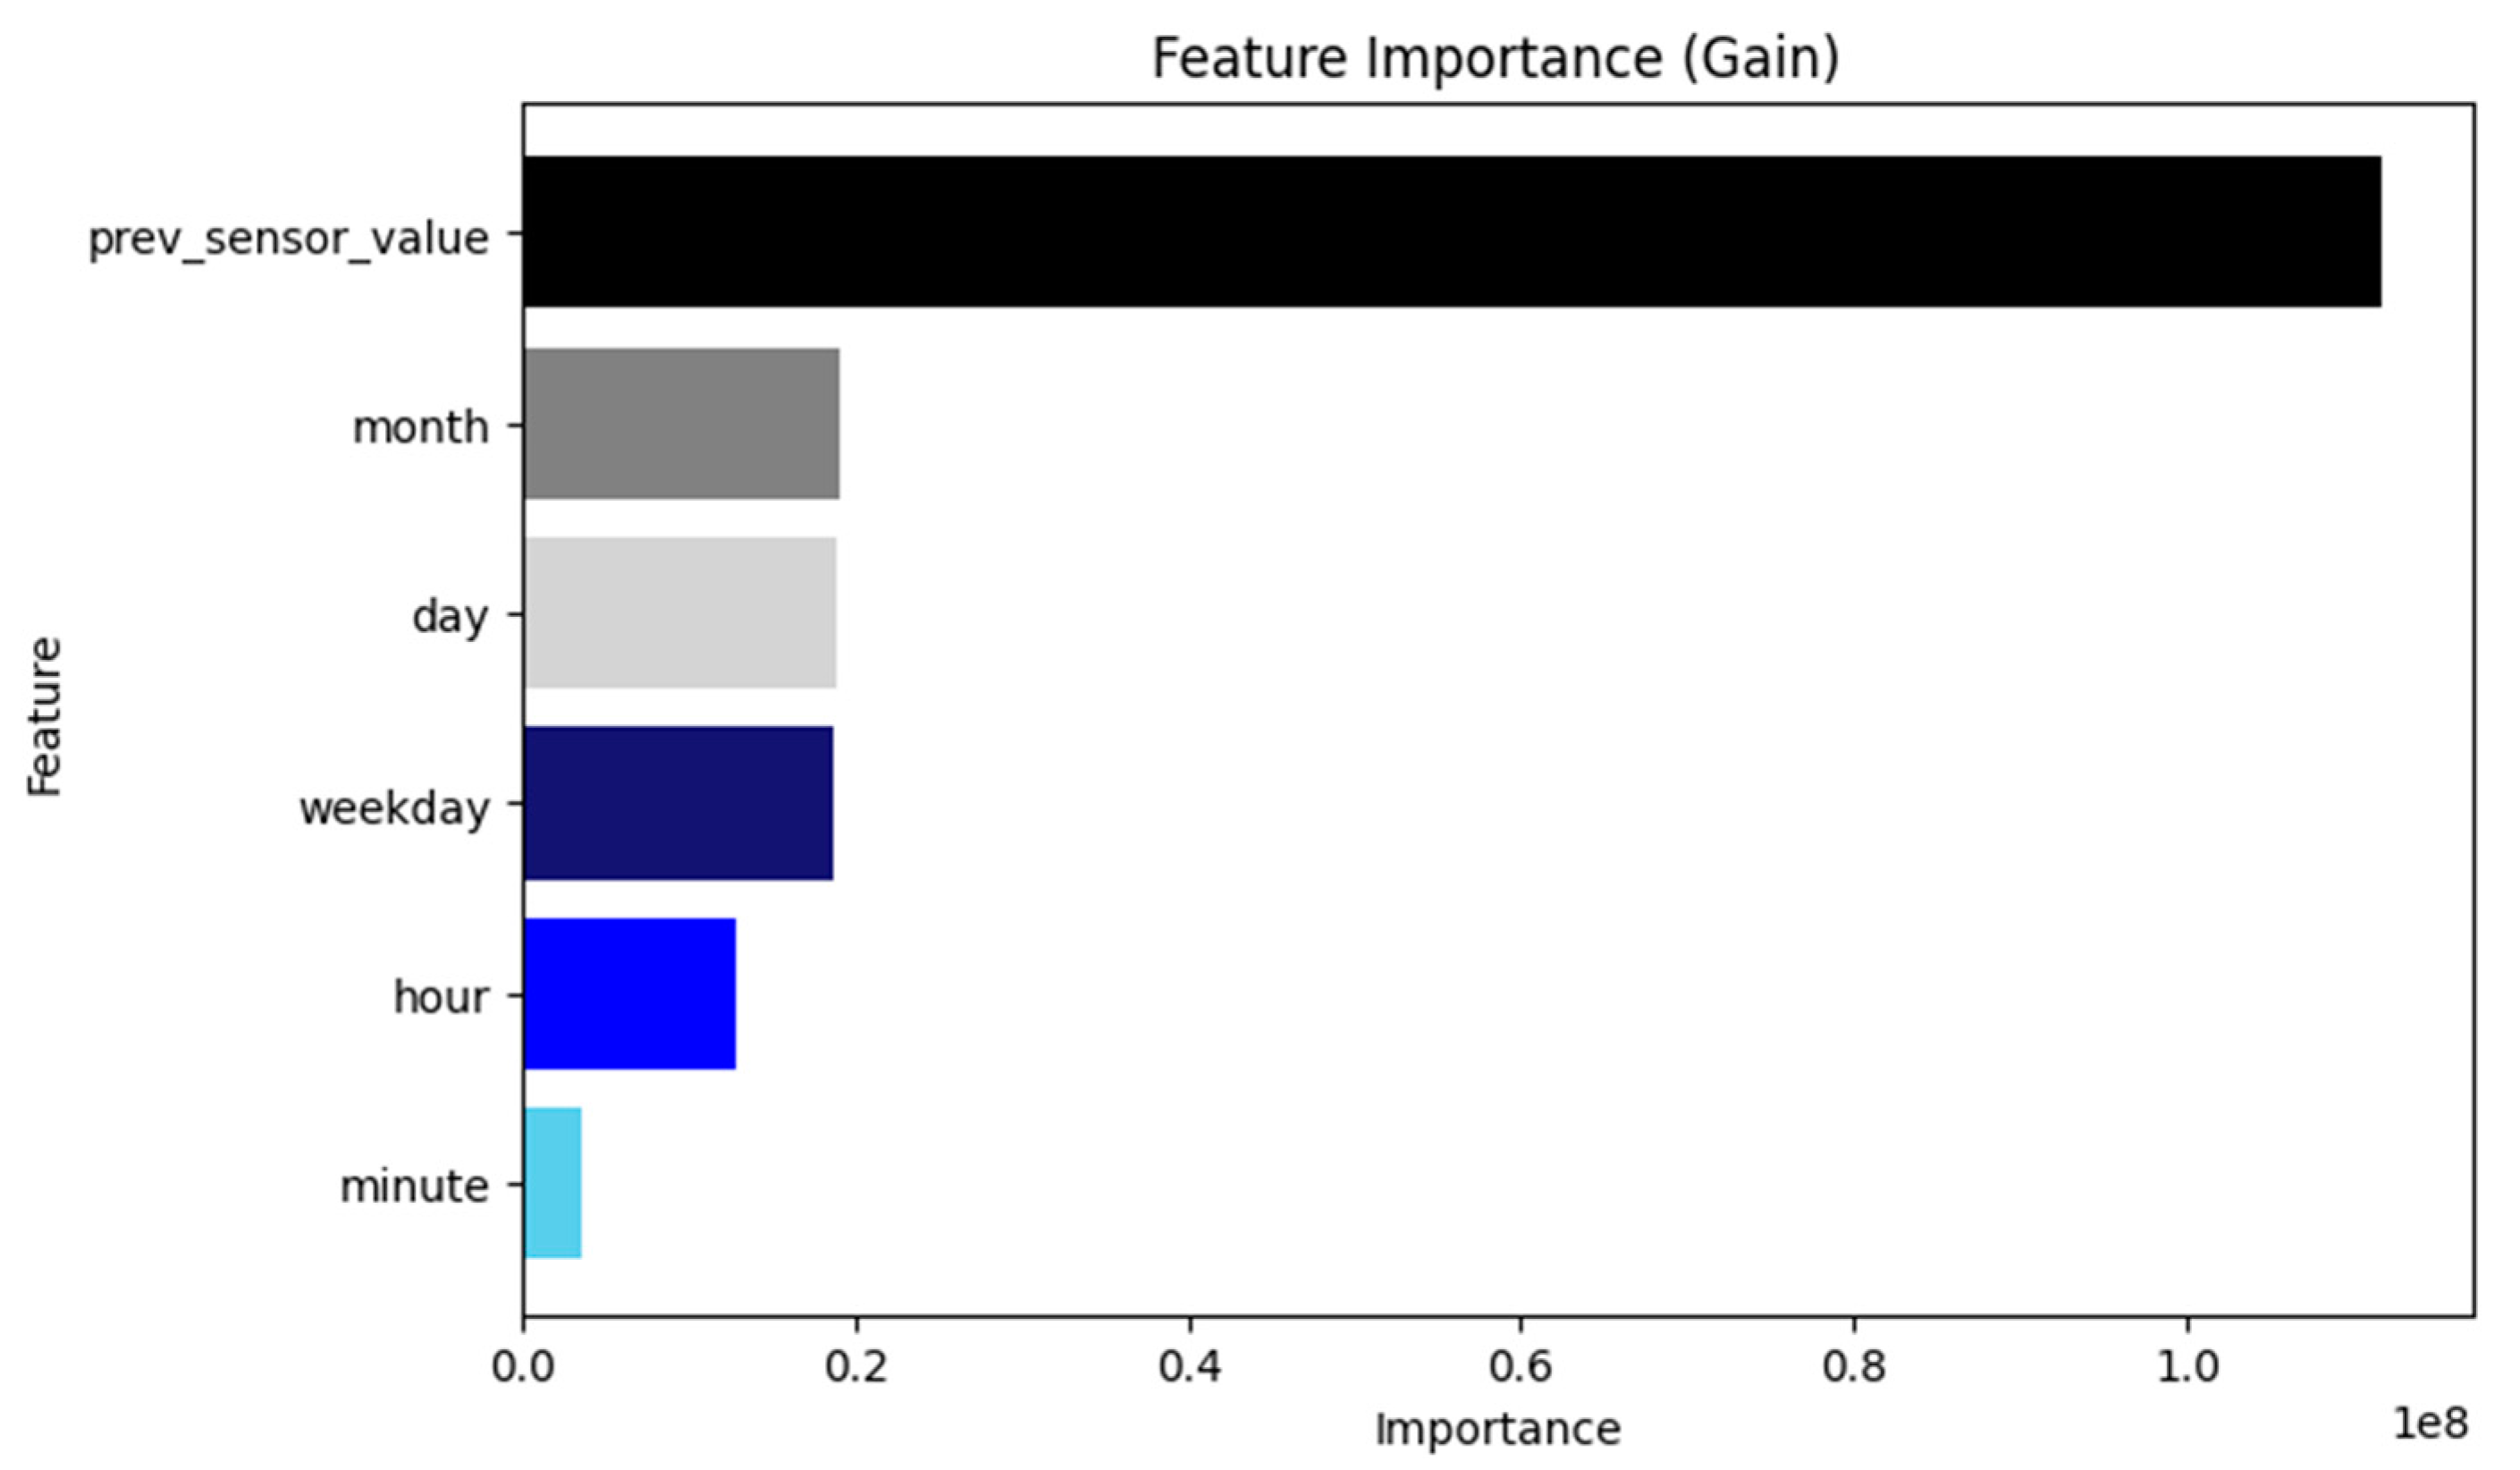
| Utilized Data |
|---|
| Month |
| Day |
| Hour |
| Minute |
| Weekday |
| Compressed air flow |
| AI Algorithm | CV(RMSE) | |
|---|---|---|
| MLP | 29.32% | 0.2564 |
| LSTM | 26% | 0.4124 |
| Hybrid model | 20.48% | 0.6394 |
| LightGBM | 14.36% | 0.8240 |
Disclaimer/Publisher’s Note: The statements, opinions and data contained in all publications are solely those of the individual author(s) and contributor(s) and not of MDPI and/or the editor(s). MDPI and/or the editor(s) disclaim responsibility for any injury to people or property resulting from any ideas, methods, instructions or products referred to in the content. |
© 2025 by the authors. Licensee MDPI, Basel, Switzerland. This article is an open access article distributed under the terms and conditions of the Creative Commons Attribution (CC BY) license (https://creativecommons.org/licenses/by/4.0/).
Share and Cite
Cho, W.; Kim, D.; Lim, B.; Gu, J. PreEdgeDB: A Lightweight Platform for Energy Prediction on Low-Power Edge Devices. Electronics 2025, 14, 1912. https://doi.org/10.3390/electronics14101912
Cho W, Kim D, Lim B, Gu J. PreEdgeDB: A Lightweight Platform for Energy Prediction on Low-Power Edge Devices. Electronics. 2025; 14(10):1912. https://doi.org/10.3390/electronics14101912
Chicago/Turabian StyleCho, Woojin, Dongju Kim, Byunghyun Lim, and Jaehoi Gu. 2025. "PreEdgeDB: A Lightweight Platform for Energy Prediction on Low-Power Edge Devices" Electronics 14, no. 10: 1912. https://doi.org/10.3390/electronics14101912
APA StyleCho, W., Kim, D., Lim, B., & Gu, J. (2025). PreEdgeDB: A Lightweight Platform for Energy Prediction on Low-Power Edge Devices. Electronics, 14(10), 1912. https://doi.org/10.3390/electronics14101912