1. Introduction
Class AB audio power amplifiers are characterized by higher efficiency compared to Class A and lower linear distortion compared to Class B amplifiers. Due to the good balance between efficiency and sound reproduction quality, Class AB power amplifiers are still the most commonly used amplifiers in high-performance audio systems. In commercial use, however, Class D power amplifiers are taking the lead, as their high efficiency means that they dissipate only small amounts of waste heat. As a result, these amplifiers do not require large heatsinks and are therefore much cheaper to manufacture. In terms of sound reproduction quality, Class AB audio amplifiers are superior to Class D amplifiers [
1,
2,
3,
4].
Circuit solutions aimed at increasing the efficiency of Class AB power amplifiers while maintaining high linearity focus on regulating the amplifier’s supply voltage as a function of the output signal amplitude. This approach led to the development of Class G and Class H amplifiers.
In Class G audio amplifiers, the supply voltage can be switched between two or more discrete levels, which significantly improves efficiency at low output signal amplitudes. However, drawbacks of this class include signal distortion during transitions between supply voltage levels and unchanged efficiency compared to Class AB when the amplifier is operating at the maximum discrete supply voltage level [
5,
6,
7,
8]. The drawbacks of Class G can be overcome by using Class H amplifiers, where the supply voltage is continuously adjusted to the output signal amplitude. Class H audio amplifiers retain the linearity of Class AB and achieve an efficiency of over 80% [
9,
10,
11].
Although Class H power amplifiers represent the state of the art in circuit-based solutions for improving efficiency, their practical implementation complexity limits their wider application. However, this research study aims to determine the extent to which the efficiency of a Class AB amplifier can be increased by applying a non-circuit-based solution to this class of amplifier. Original Class AB audio amplifiers are characterized by relatively low efficiency, leading to the generation of significant amounts of waste thermal energy, which is mainly dissipated via the output transistors to the heatsink and the environment.
Thermal energy can be converted into electrical energy using thermal devices, which are typically categorized into two groups:
- –
The first category consists of devices that operate on the principle of well-known thermodynamic cycles.
- –
The second category consists of thermoelectric generators.
Devices operating on thermodynamic cycles convert thermal energy into mechanical energy, which is then converted into electrical energy with the help of a generator. These devices generally require high operating temperatures and the use of a working fluid. The complexity of such systems, which include turbines, generators, and similar components, as well as the relatively low temperatures generated by power amplifiers, are the reasons why these devices are not suitable for use within power amplifiers [
12,
13,
14,
15].
Thermoelectric generators, which fall into the second category, provide a direct conversion of thermal energy into electrical energy. A thermoelectric generator consists of a large number of thermocouples electrically connected in series and thermally connected in parallel placed between ceramic substrates. Based on the Seebeck effect, when the thermocouples are exposed to a temperature gradient at their ends, a potential difference is induced at their terminals. Semiconductor materials have excellent properties for thermoelectric applications, and therefore, they are the preferred choice for the construction of thermocouples [
16,
17]. Due to their numerous advantages, thermoelectric generators will be applied to the power amplifier in this work.
The main drawback that limits the wider application of thermoelectric generators is the low efficiency of thermoelectric conversion. Despite this disadvantage, they have several advantages. Thermoelectric generators contain no moving parts or working fluids, making them silent and maintenance-free, and they can operate continuously for more than 100,000 h. Unlike other thermal devices, they perform a direct energy conversion and operate without vibrations, which is particularly important in mechanically sensitive environments. They are also environmentally friendly, as they do not generate any by-products during conversion. Thermoelectric generators respond instantly electrically to thermal excitation, with response times on the order of nanoseconds. Their size can be adapted to a variety of applications and they are suitable for operation in a wide range of temperatures [
18,
19,
20].
1.1. Related Papers
All existing studies in the literature share the approach of using the waste heat generated by RF power amplifiers as a heat source. There is a lack of research on the application of thermoelectric generators in audio power amplifiers.
In [
21], the authors addressed the problem of significant waste heat generated by RF power amplifiers in base stations. The use of thermoelectric generators could recover some of this energy and convert it into electrical energy. The article lacks detailed information on the design of the overall system and the measurement results; the authors only outline possible ways of utilizing the converted energy.
A similar study, but with a more detailed analysis and a comparison of the measurement results with the results of the model simulations, is presented in [
22]. The model was developed based on the analogy between electrical and thermal parameters, and the measurements were performed on a Class E power amplifier in a transmitter circuit (1 W, 2.45 GHz). In this class of amplifier, less thermal energy is dissipated because the output transistors act as switches, thus avoiding the linear mode of operation.
The inefficiency of base stations in broadband networks is discussed in [
23]. Authors concluded that a major factor contributing to inefficiency is the generation of excess thermal energy at the output transistors of the power amplifiers. This research is based on the development of a mathematical model of a thermoelectric generator derived from equations of heat transfer physics and thermoelectric effects. The model was used to optimize the number, height, and cross-sectional area of thermocouples to maximize power generation and conversion efficiency. However, the study does not include measurement results from a physical setup to validate the simulation results.
In [
24], the authors applied a thermoelectric generator to the output transistors of a Class F RF power amplifier (10 W, 3.2–3.8 GHz) to recover excess thermal energy. The idea was to feed the converted energy back into the power supply circuit to increase the overall efficiency of the power amplifier system. The conclusions are based on measurement results of an experimentally established setup, which shows a maximum efficiency increase of 1.1 percentage points. The article lacks detailed information on the system design.
The push–pull mode of operation for thermoelectric generators applied to Class AB power amplifiers is presented in [
25]. An analysis of the effects of different amplifier output powers on the power generated at the load connected to the thermoelectric generator was also carried out. The study also investigated the use of different thermal configurations of thermoelectric generators, namely single connection, thermal series, and parallel connection.
1.2. Objectives of This Work
All conclusions in this paper are based on measured results from an experimentally created model. Measurements were performed on a single pair of amplifier output transistors, hereafter referred to as the single-ended mode of operation, followed by a theoretical analysis of the push–pull operating mode. The measurements were performed both with a single TEG and with a thermal series connection of TEGs. The objectives of this study include the following:
- –
Evaluation of the effects of different switching times in single-ended mode of operation on the amount of energy generated and the temperatures reached in the system.
- –
Evaluation of the effects of heatsinks with different thermal resistances on the amount of energy generated and the temperatures reached in the system.
- –
Theoretical analysis of the push–pull mode of operation of thermoelectric generators.
- –
Calculation of the thermoelectric conversion efficiency and the percentage increase in the overall efficiency of the power amplifier system in the case of applying the push–pull operating mode of thermoelectric generators. The increase in system efficiency refers to the case where all the converted energy is fed back into the power supply circuit of the amplifier.
In addition to investigating the increase in system efficiency, the main objective of this study is to determine the extent to which smaller heatsinks can be used in combination with the amplifier by applying the push–pull mode of operation. Since the size and cost of heatsinks used in combination with Class AB power amplifiers are their biggest limiting factors in application, the use of the push–pull mode and a predefined switching time should allow the use of smaller heatsinks without the risk of overheating the semiconductor components in the system.
2. Methods and Measurements
The measurements in this study were performed with commercially available TEG models applied to a Class AB audio power amplifier.
The heat source was the power dissipation of the complementary output transistor pair of the Class AB amplifier, which delivers a rated power of 100 W at a load resistance of 4 Ω. The TEG model used with the designation “SP1848-27145” consists of 127 thermocouples made of the semiconductor material Bi2Te3 and has the dimensions 40 mm × 40 mm × 3.4 mm. The empirically determined value of the resistance connected to the TEG output for electrical matching is 5.1 Ω.
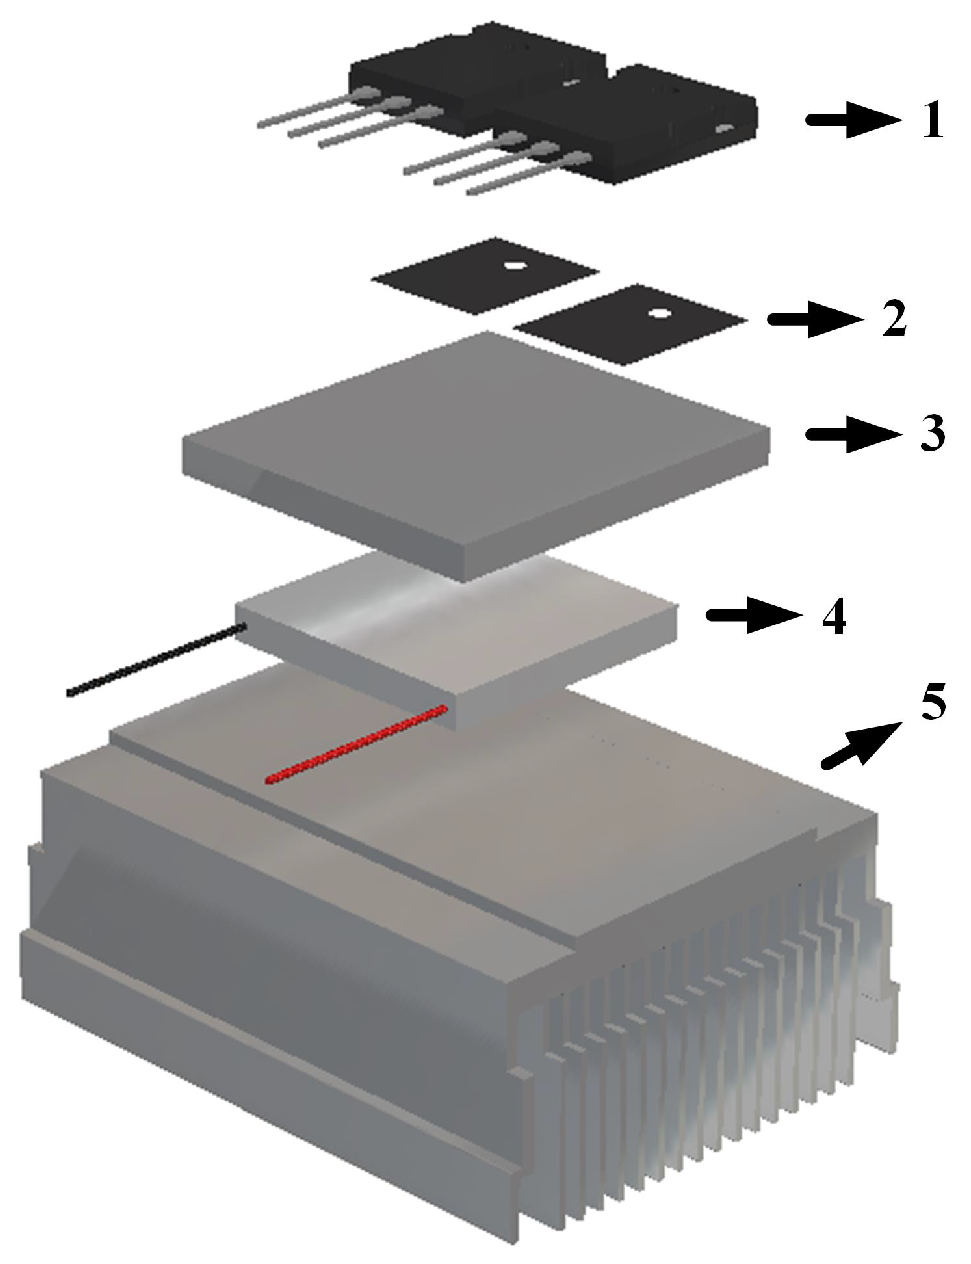
Figure 1 shows the assembly diagram of the system where the measurements were taken. The system consists of the following:
A complementary pair of power amplifier output transistors (Toshiba 2SC5200 and 2SA1943).
Silicone mica sheets on the collectors of the transistors for electrical insulation [
26].
Heat spreader in the form of an aluminum plate.
Thermoelectric generator (dimensions: 40 mm × 40 mm × 3.4 mm).
Heatsink used to dissipate the thermal energy on the cold side of the TEG.
It is not indicated in the diagram, but thermal paste was applied to the surfaces of the TEGs in order to reduce the overall thermal contact resistance. In addition to the single connected TEG, measurements were also carried out on a thermal series combination of TEGs consisting of two TEGs physically arranged next to each other.
The measuring devices used for the measurements are as follows:
- –
Digital multimeter, GW Instek GDM-356, to measure the temperature. The accuracy of the measured temperature is in the range of ±(1% + 7 digits of the resolution of the instrument) in the measuring range of 0–400 °C. The multimeter is calibrated for use with a type K thermocouple.
- –
A digital bench multimeter, HP (Hewlett Packard) 34401A, for measuring the voltage across the resistor connected to the TEG output. The accuracy of the measured voltage is in the range of ±(0.0015% of reading + 0.0004% of range).
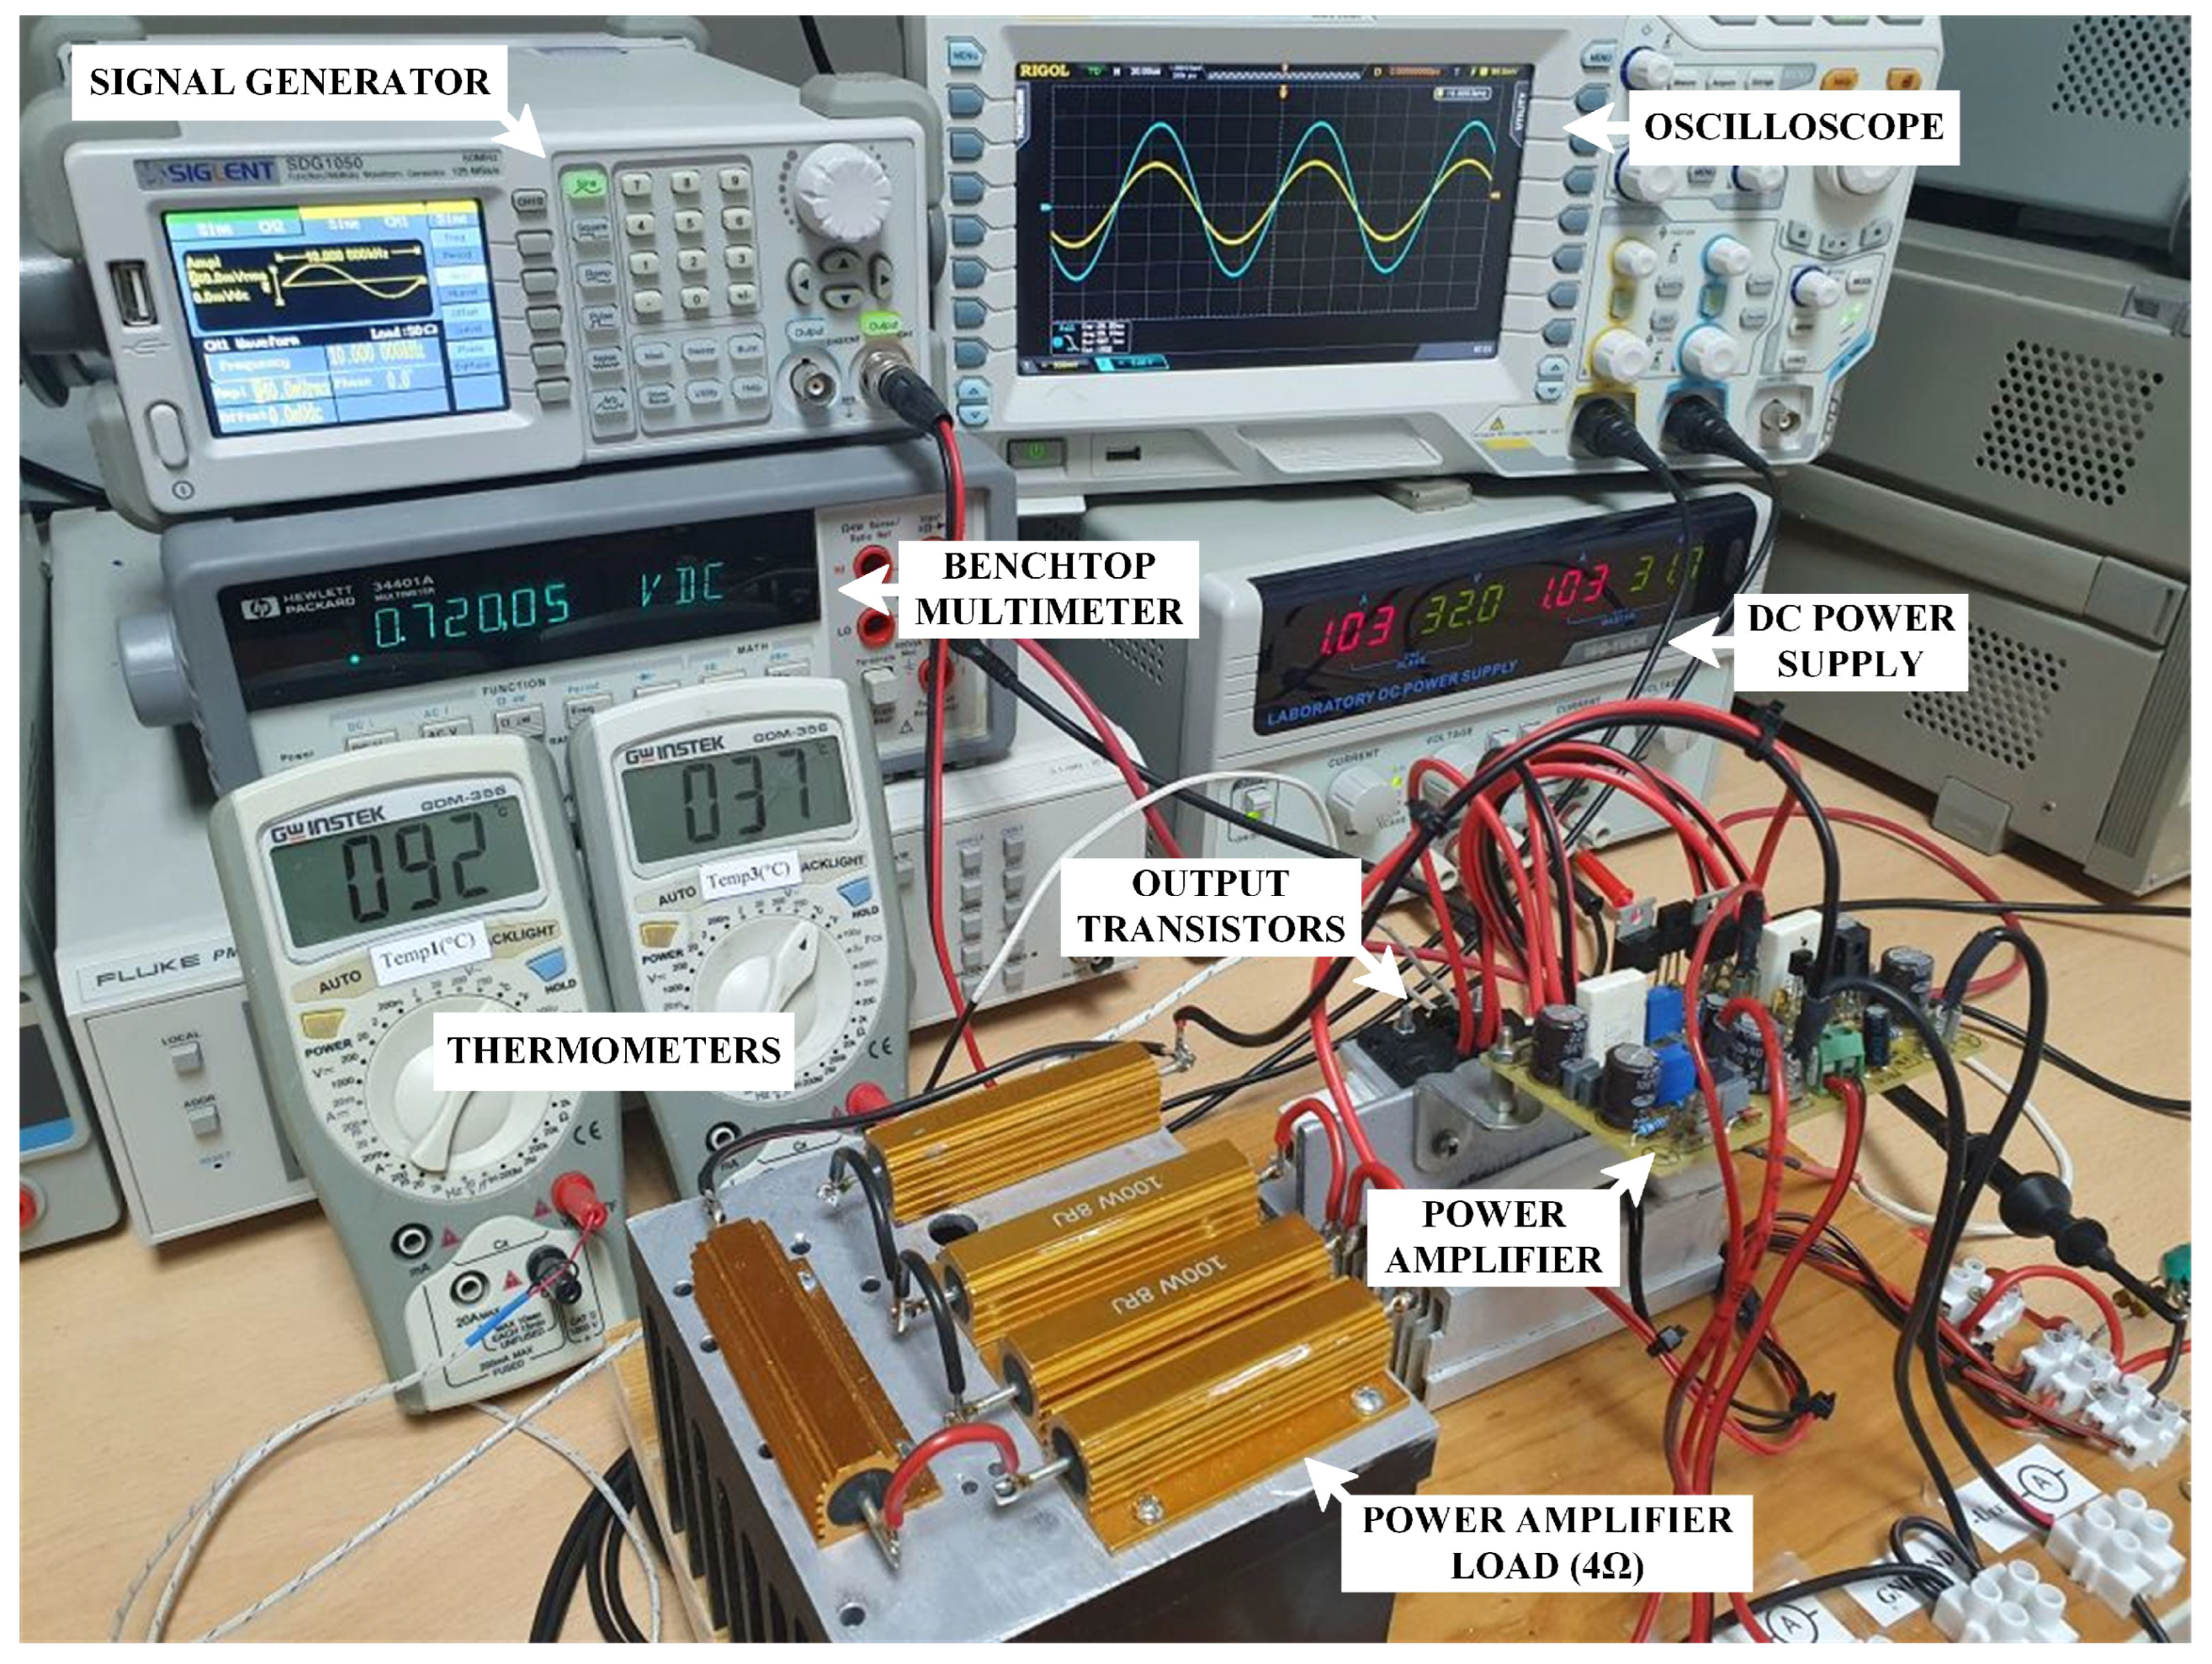
All conclusions in this paper were made based on measurements performed with the experimental setup shown in
Figure 2. In addition to the components mentioned, the setup also included a signal generator, an oscilloscope, and a laboratory power supply. For the initial measurements, different output power levels of the amplifier were used, while the measurements were carried out in single-ended mode with the amplifier output power set to 50 W. The frequency of the input signal was 10 kHz. The specified power and frequency values were chosen with the intention of being midway between the rated power of the amplifier and the frequency spectrum audible to the human ear, considering that the audio power amplifier was used.
Measurements were taken during a 10 min interval of amplifier operation, while certain graphs were shown for a longer period of time when the amplifier was switched off. The temperatures of the hot and cold sides of the TEG were measured directly and the temperature gradient was calculated based on the measured values. The power generated at the load connected to the output of the TEG was calculated based on the voltage measured across a resistor of known value. The total power generated in the thermal series connection of TEGs was calculated by summing the power generated by each TEG.
Measurements in the single-ended mode of the TEG operations were performed for different switching times, simulating the switching intervals between the systems in the proposed push–pull mode of TEG operation. The switching times were set at 30 s, 60 s, and 120 s, and continuous amplifier operation over a period of 10 min was also considered. Based on the measurement results in single-ended mode, a theoretical analysis of the push–pull mode was performed. As mentioned above, the application of the push–pull mode of operation would allow the use of smaller heatsinks in Class AB power amplifiers, allowing them to compete in size with Class D power amplifiers.
Finally, all measurements were repeated under the same conditions using heatsinks with different thermal resistances. Both smaller and larger heatsinks were used compared to the heatsink used in the initial measurements. The effects of the thermal resistance of the applied heatsink on the amount of energy generated by the TEG can be found in [
27,
28,
29,
30,
31]. The paper concludes with an illustration of the thermoelectric efficiency of the TEGs and the potential increase in the system efficiency if the converted energy were fed back into the amplifier’s power supply circuit using some sort of DC-DC converter.
3. Results
After the practical implementation of the thermoelectric energy conversion system, measurements were taken. The initial measurements investigated the effects of different amplifier powers on the achieved temperatures and the voltage generated at the TEG load.
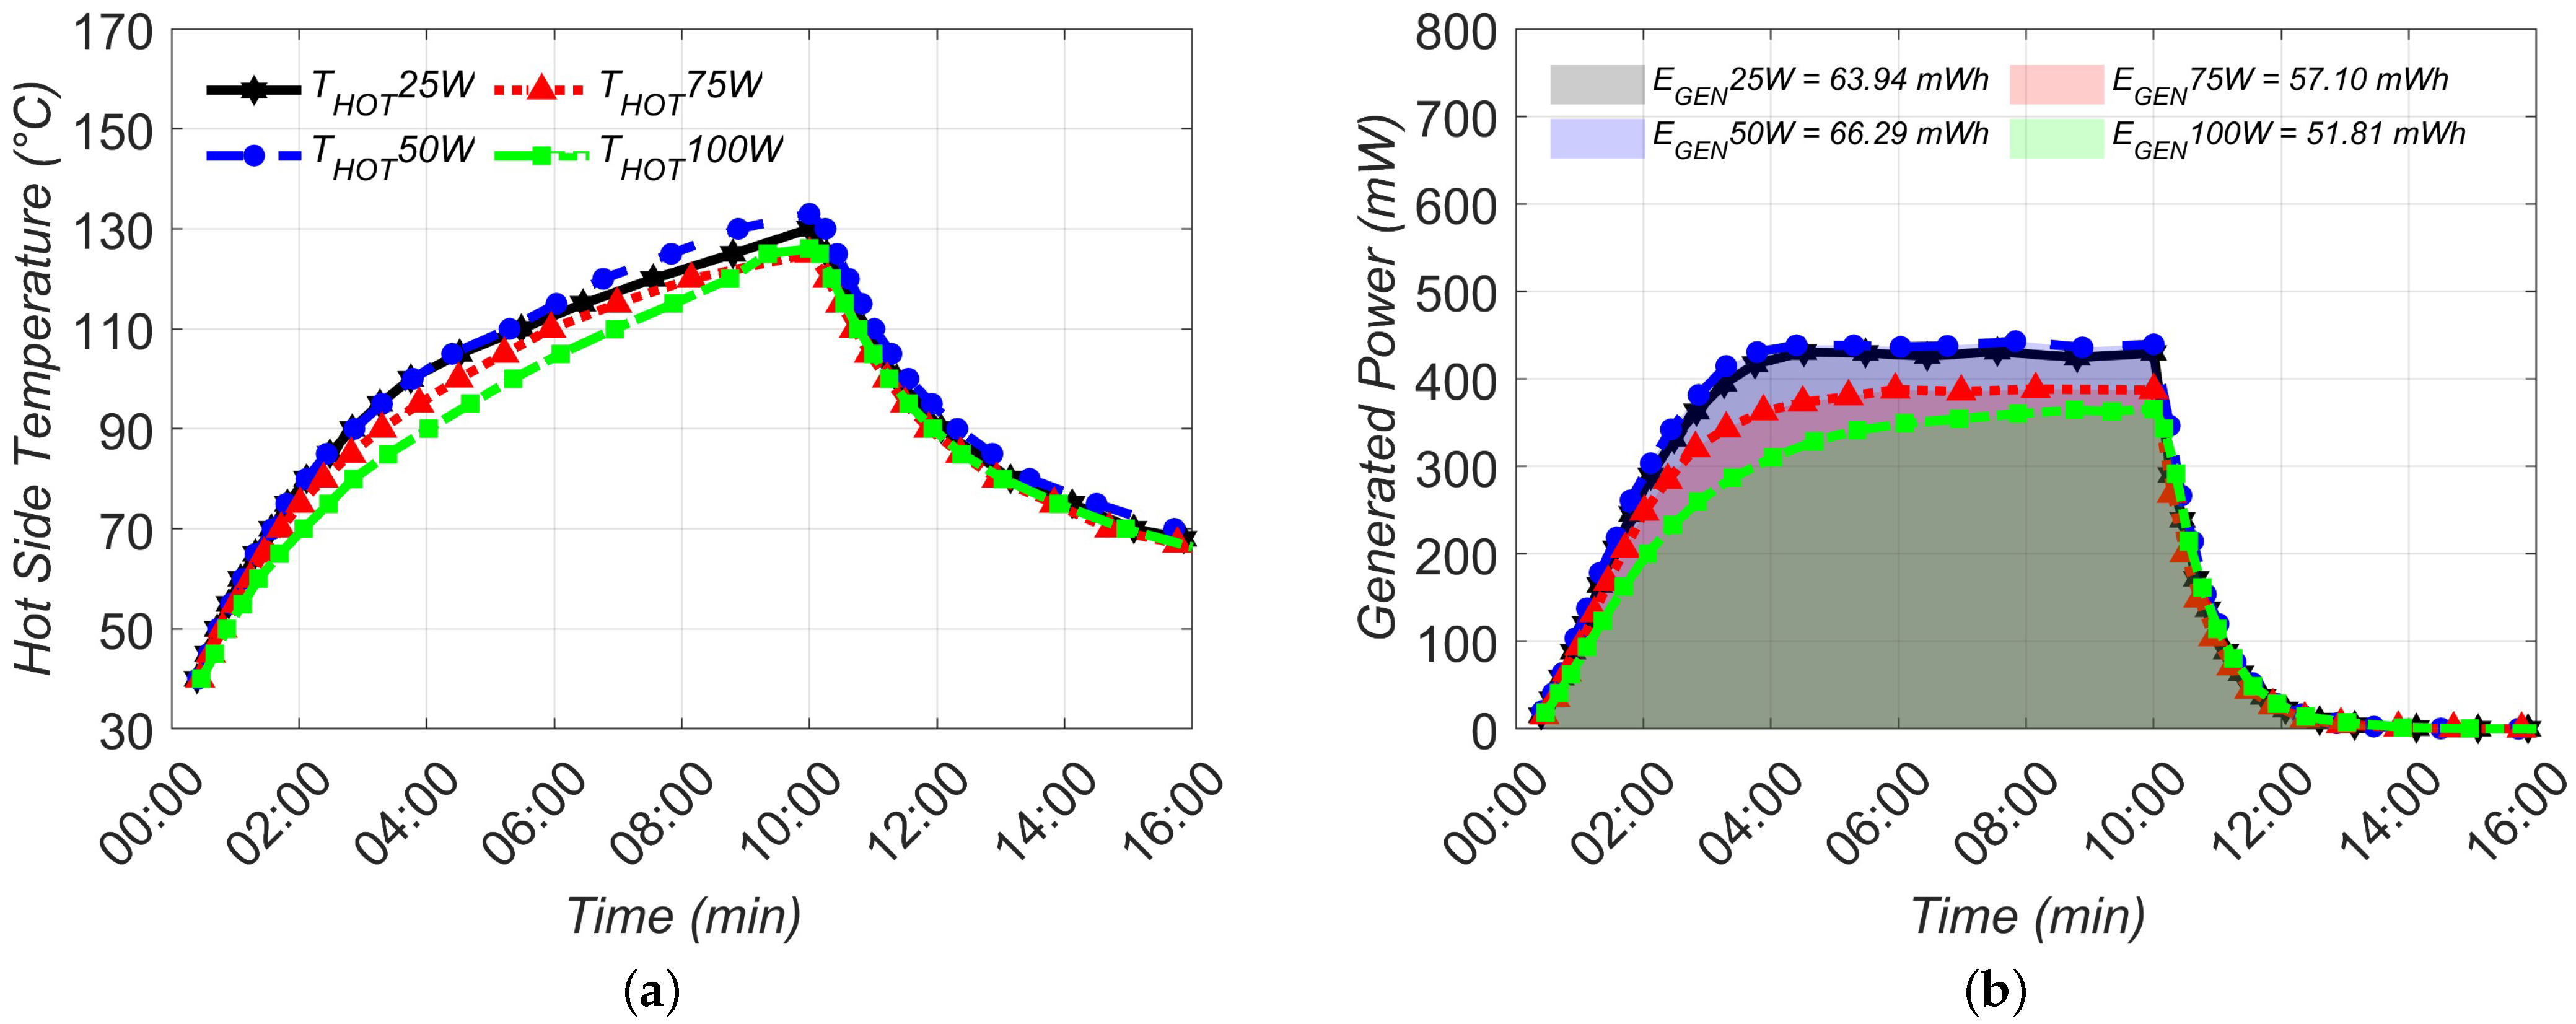
The results obtained for a single TEG connection are shown in
Figure 3. The graph in
Figure 3a shows the temperature generated at the output transistors of the amplifier (hot side temperature), while the graph in
Figure 3b shows the power generated using this thermal configuration (generated power).
The graphs of the temperature generated at the output transistors and the total power generated by the use of thermally series-connected TEGs are shown in
Figure 4. The power graph was obtained by summing the power generated on the load of each individual TEG in such a connection.
The graphs show the temperatures generated on the hot side and the power generated during a 10 min operating interval of the amplifier. After the amplifier was switched off, temperature and voltage measurements were continued. Several conclusions can be drawn based on the results shown in the graphs:
- –
Higher temperatures on the hot side and higher powers at the TEG loads were achieved at the lower amplifier output powers.
- –
The temperature and power values were higher with a thermal series connection of TEGs than when using a single connected TEG.
- –
With the heatsink used, the hot side temperature reached 150 °C in a relatively short time.
- –
After switching off the power amplifier, the TEGs continued to generate power at the load until the temperature gradient at their ends disappeared.
Since a temperature of 150 °C is specified as the maximum value at which the complementary pair of output transistors can operate, the amplifier must be switched off when this temperature is reached to avoid overheating. The values of the energy generated at the TEG loads during the heating period (up to the 10th minute), the cooling period (after the 10th minute), and the percentage of energy released during the cooling period relative to the heating period (
) are shown in
Table 1. The energy values are given for different amplifier powers and thermal connections. The table shows that for a single TEG connection, the energy generated during the cooling phase was about 10%, while for a thermally series connection, it was about 20% of the energy generated during the heating phase.
3.1. Single-Ended Mode of TEG Operations
As mentioned in the objectives of this work, in order to reduce the dimensions of the Class AB power amplifier system by using a smaller heatsink and to enable continuous operation of the amplifier, the push–pull mode of TEG operations was proposed.
To realize the mentioned mode of operation, two thermoelectric energy conversion systems (as shown in
Figure 1) had to be set up and work together. The idea of push–pull operation is based on the fact that TEGs continue to generate energy even after the power amplifier is switched off. By using two thermoelectric conversion systems, one system would heat up and generate energy while the other system produces energy during the cooling phase. By varying the switching times between the systems (operating pairs of output transistors), the temperature generated at the amplifier’s output transistors could be controlled so that smaller heatsinks could be used.
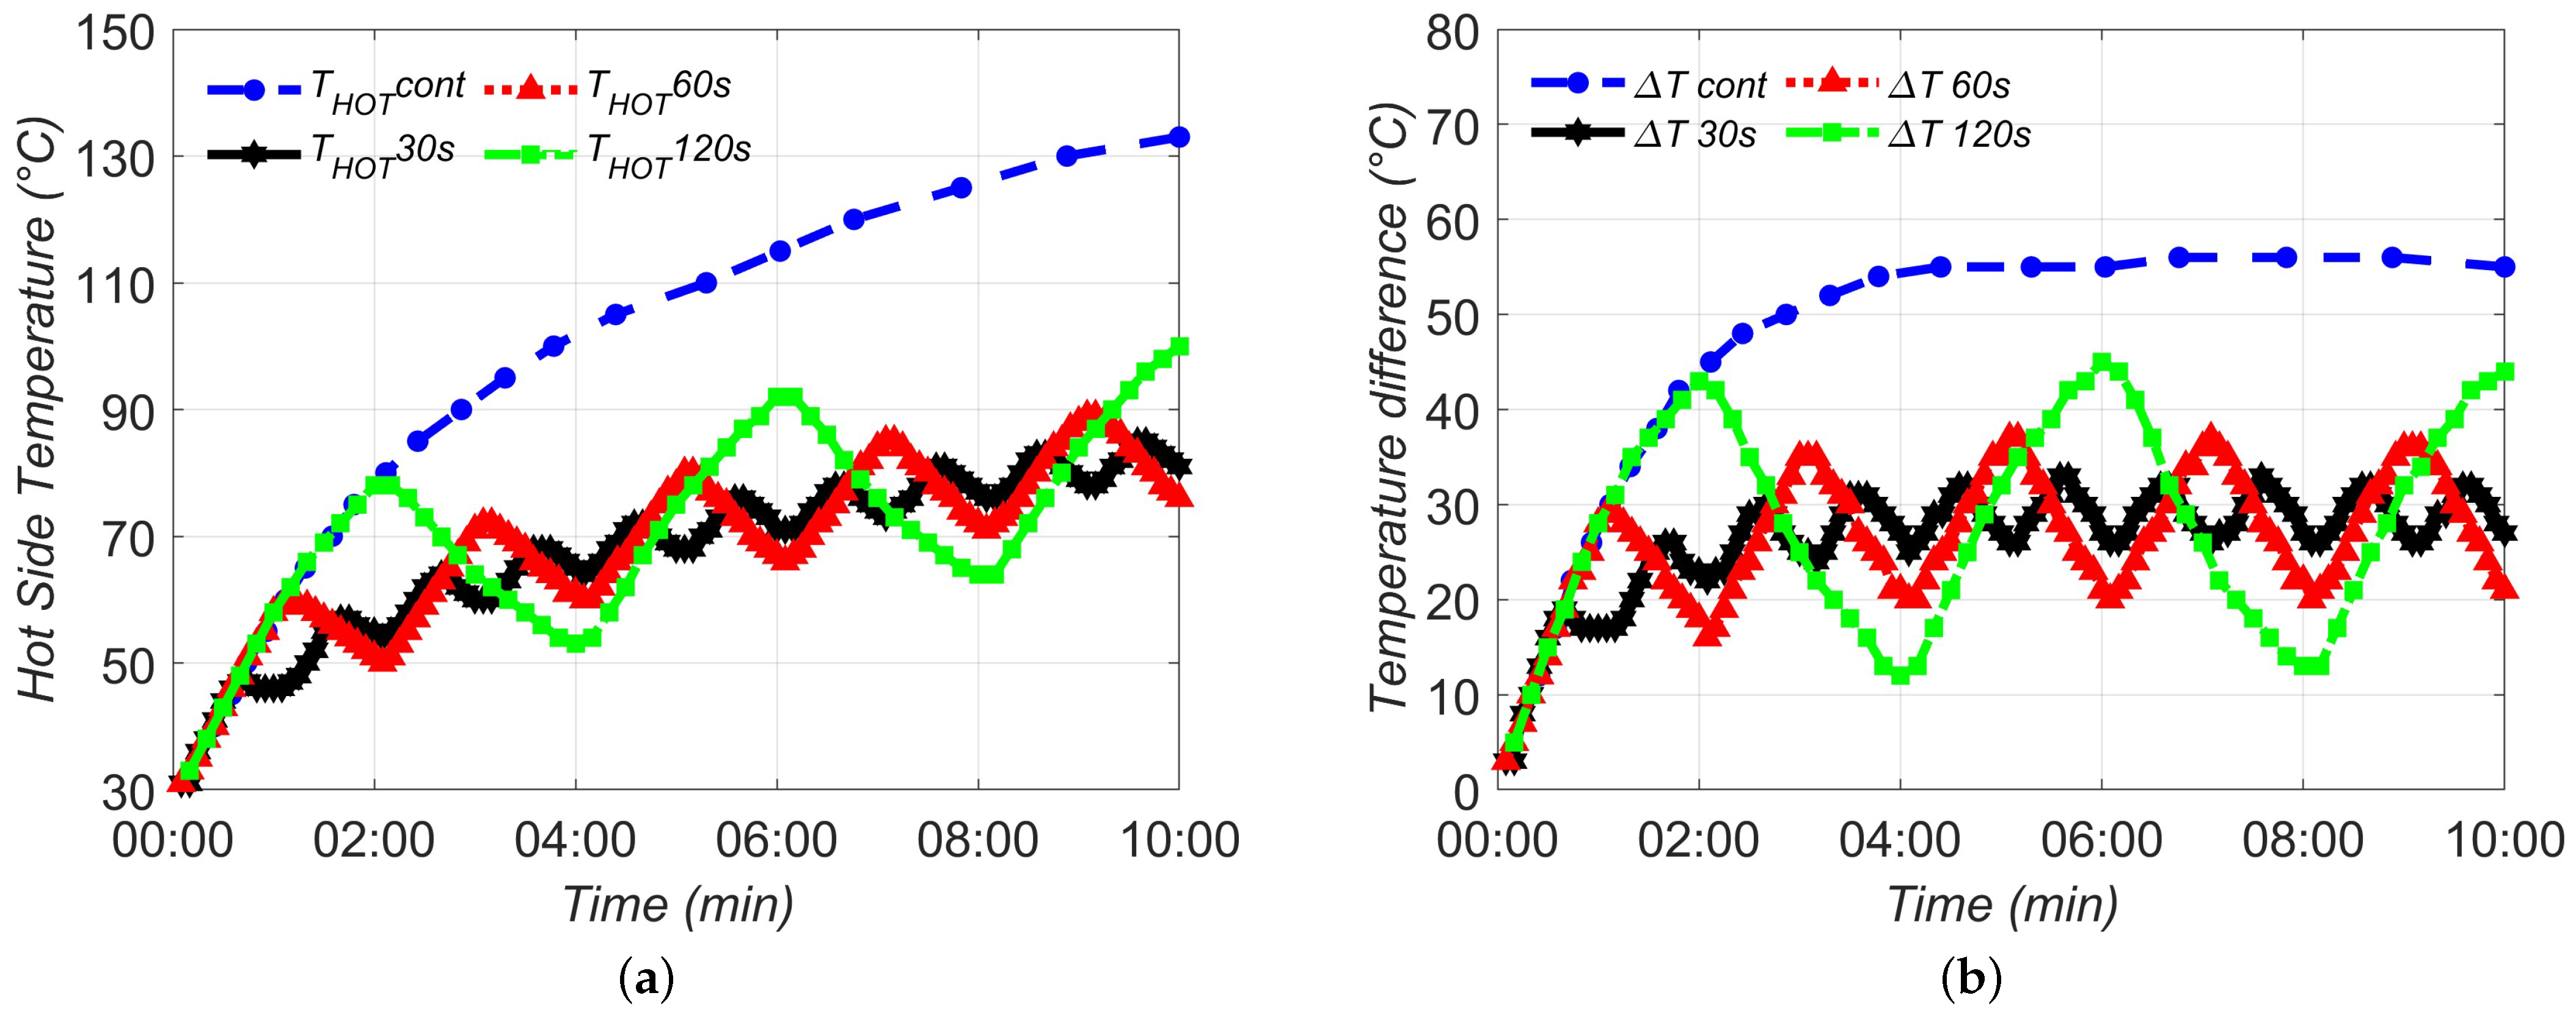
A theoretical analysis of the push–pull operation mode was performed on the basis of measurement results in the single-ended mode of TEG operations. The graphs of the hot side temperature and the achieved temperature difference for a single connected TEG in continuous operation and at different interruption times are shown in
Figure 5. The graphs show that the temperature on the hot side tended to increase over time, while the peak values of the temperature difference remained almost constant. With more frequent interruptions, the values of the hot side and the temperature difference were lower. Thus, the temperature on the hot side reached about 130 °C during continuous operation, while it dropped to about 80 °C during the interruptions that occurred every 30 s at the end of the measurement.
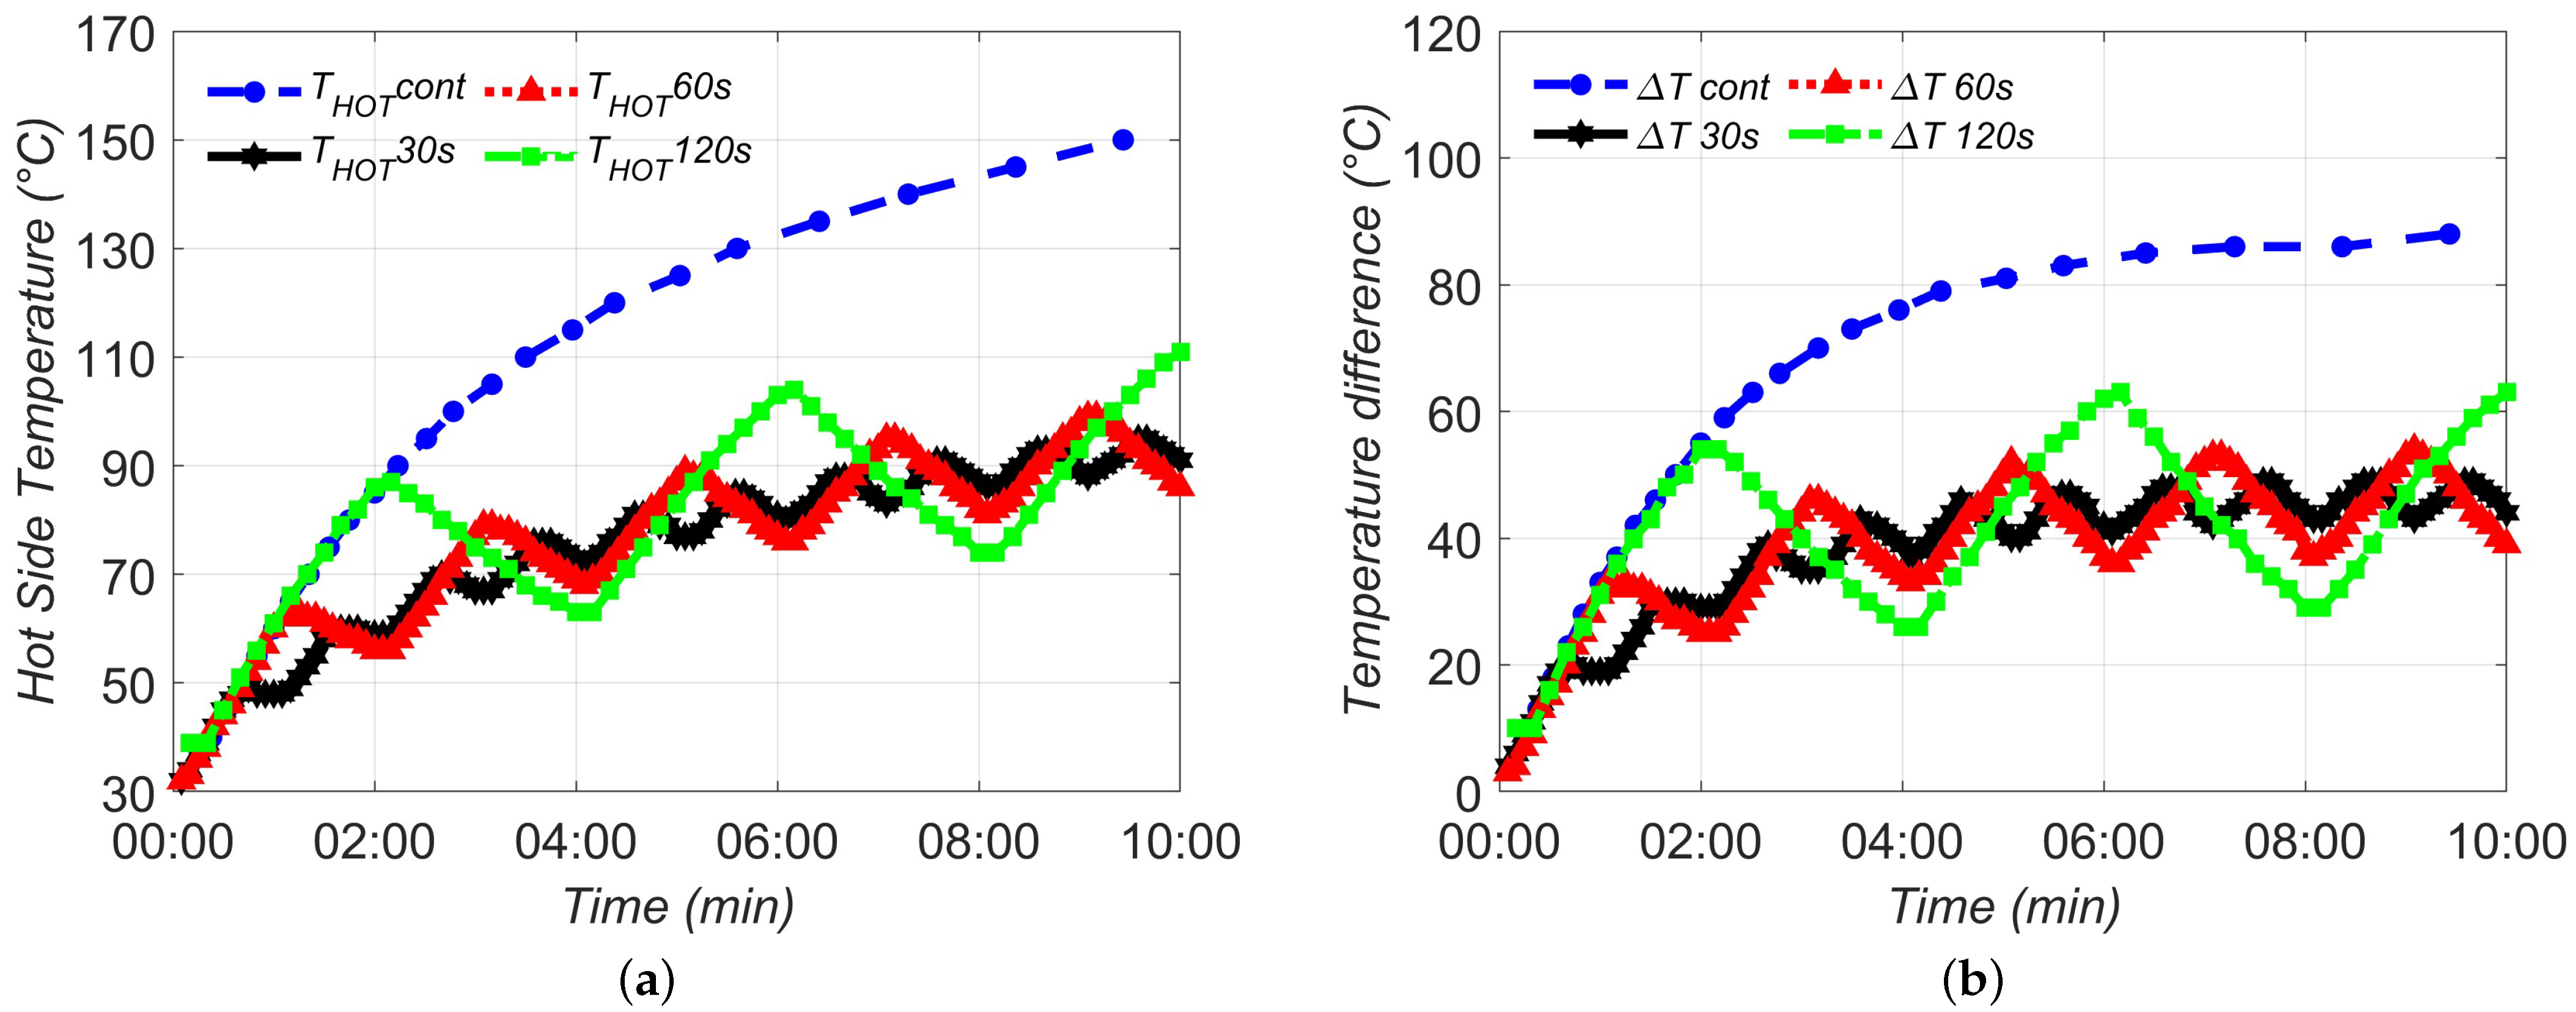
Following the measurements carried out for a single connected TEG,
Figure 6 shows the graphs of the hot side temperature and the temperature difference in the push–pull operation mode for the thermal series connection of TEGs. The conclusions drawn for the single connected TEG also apply in this case, with the difference that the thermal series connection of TEGs showed higher temperature values, both for the temperature of the hot side and for the temperature difference achieved. Thus, the measurement in continuous operation would have had to be aborted before the 10th minute because the temperature of the output transistors reached 150 °C. The specified temperature in the datasheet of the used output transistors was marked as the transistor’s threshold temperature, above which internal transistor structures may be damaged. Therefore, the amplifier had to be switched off once the transistor temperature reached this value. Based on the measured voltages at the load of each TEG in the thermal series connection of the TEGs, it was found that the voltages were similar in magnitude, which means that the overall temperature gradient was evenly distributed across the individual TEGs.
The generated power (energy) values for the individually connected and the thermal series connections of TEGs are shown in
Figure 7. It can be concluded from the graphs that the highest power and thus energy was generated in continuous operation (area marked in blue). However, continuous operation with the heatsink used led to high temperature values on the hot side, as can be seen in
Figure 5 and
Figure 6. Since the range of generated power values in the graphs of
Figure 7 is consistent, it is obvious that higher amounts of energy were generated in the thermal series connection of TEGs. As with the temperature values, more frequent interruptions led to lower values for the generated power and energy. The choice of interruption time or switching in the push–pull operation mode should be selected as a compromise between the values of the hot side temperatures and the energy generated at the TEG load. With more frequent switching, the values of the temperatures generated will be lower, as will the values of the energy generated. The same applies to longer switching times.
3.2. Push–Pull Mode of TEG Operations
Based on the calculated values of the generated power for the individually connected TEG shown in
Figure 7a and the thermal series connection of the TEGs shown in
Figure 7b, the push–pull mode of TEG operations was analyzed theoretically.
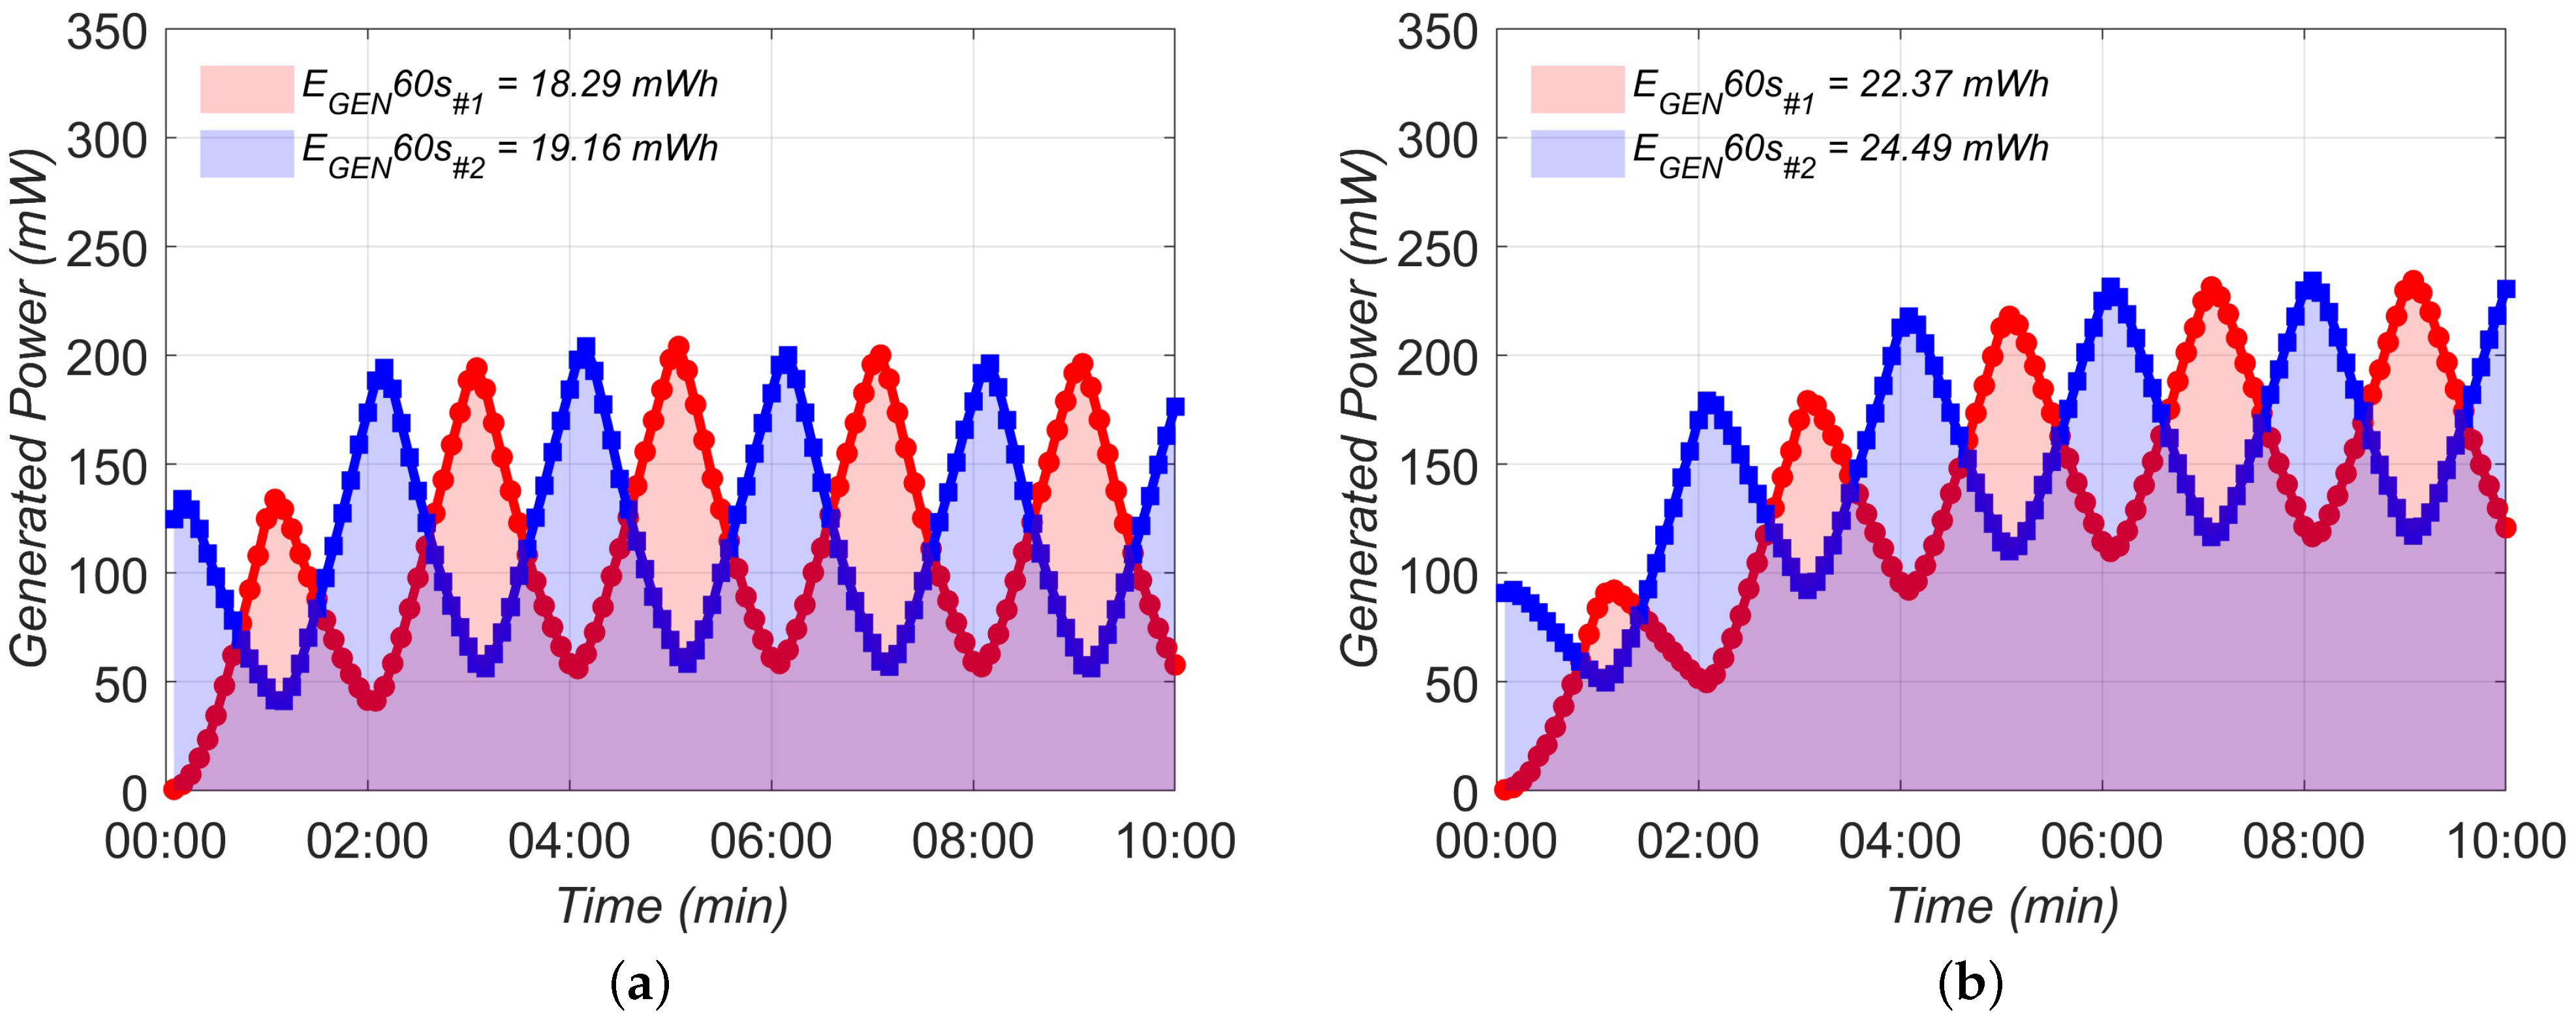
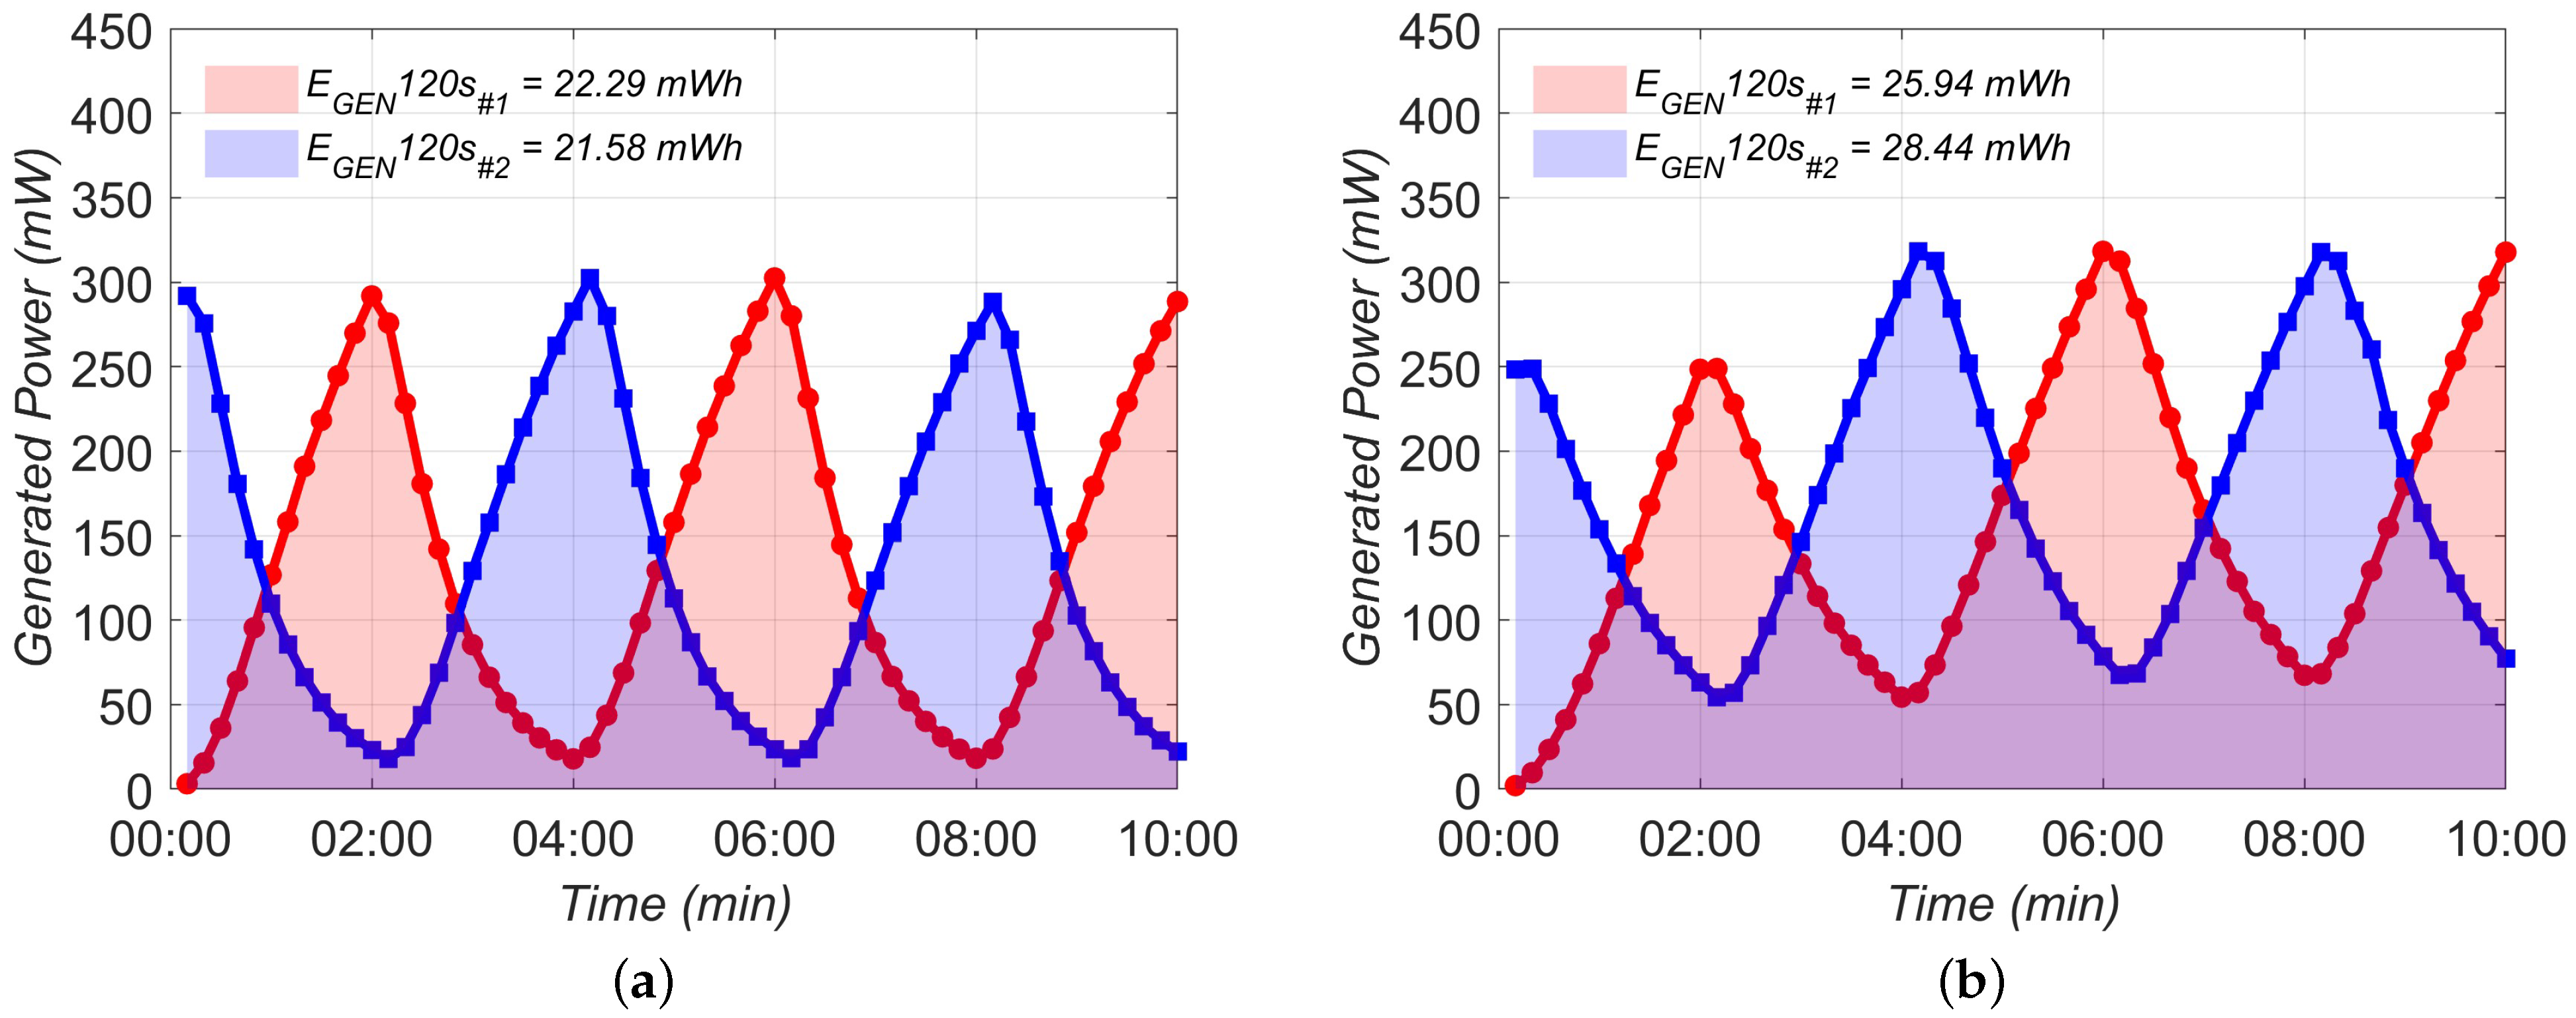
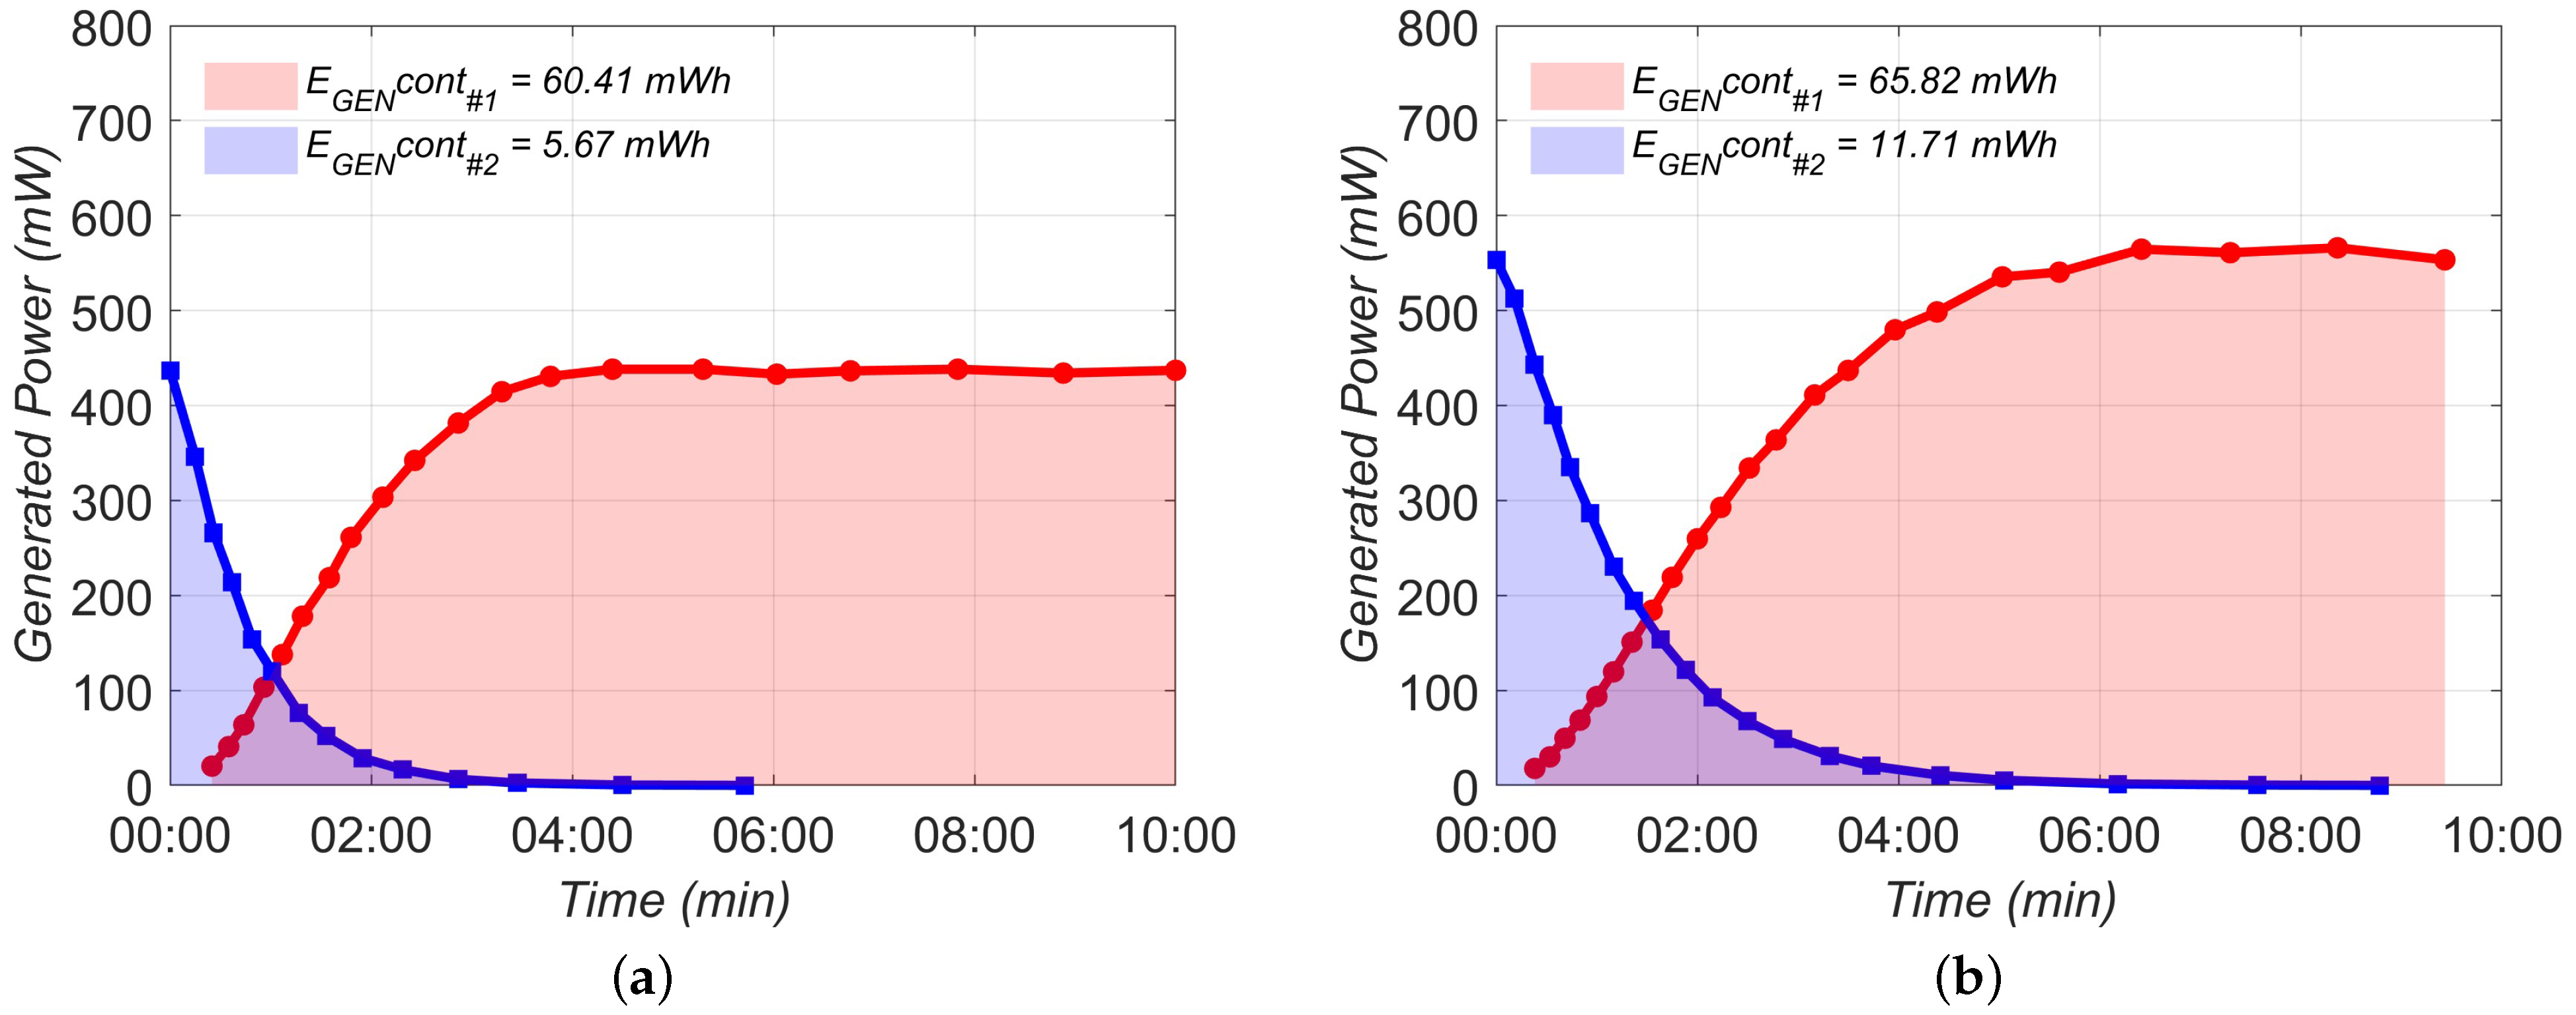
The graphs of the generated power (energy) resulting from the push–pull operation mode and different switching times between the systems are shown in
Appendix A (
Figure A1,
Figure A2,
Figure A3 and
Figure A4). The measurements were carried out at a time interval of 10 min or until a temperature of 150 °C was reached on the hot side, taking into account switching times of 30 s, 60 s, and 120 s, and continuous operation during the operating time of the amplifier. By summing the power generated with each of the systems, the graphs shown in
Figure 8 were obtained. For the individually connected TEG, the generated power (energy) values are shown in
Figure 8a, while for the thermal series connection, the values are shown in
Figure 8b.
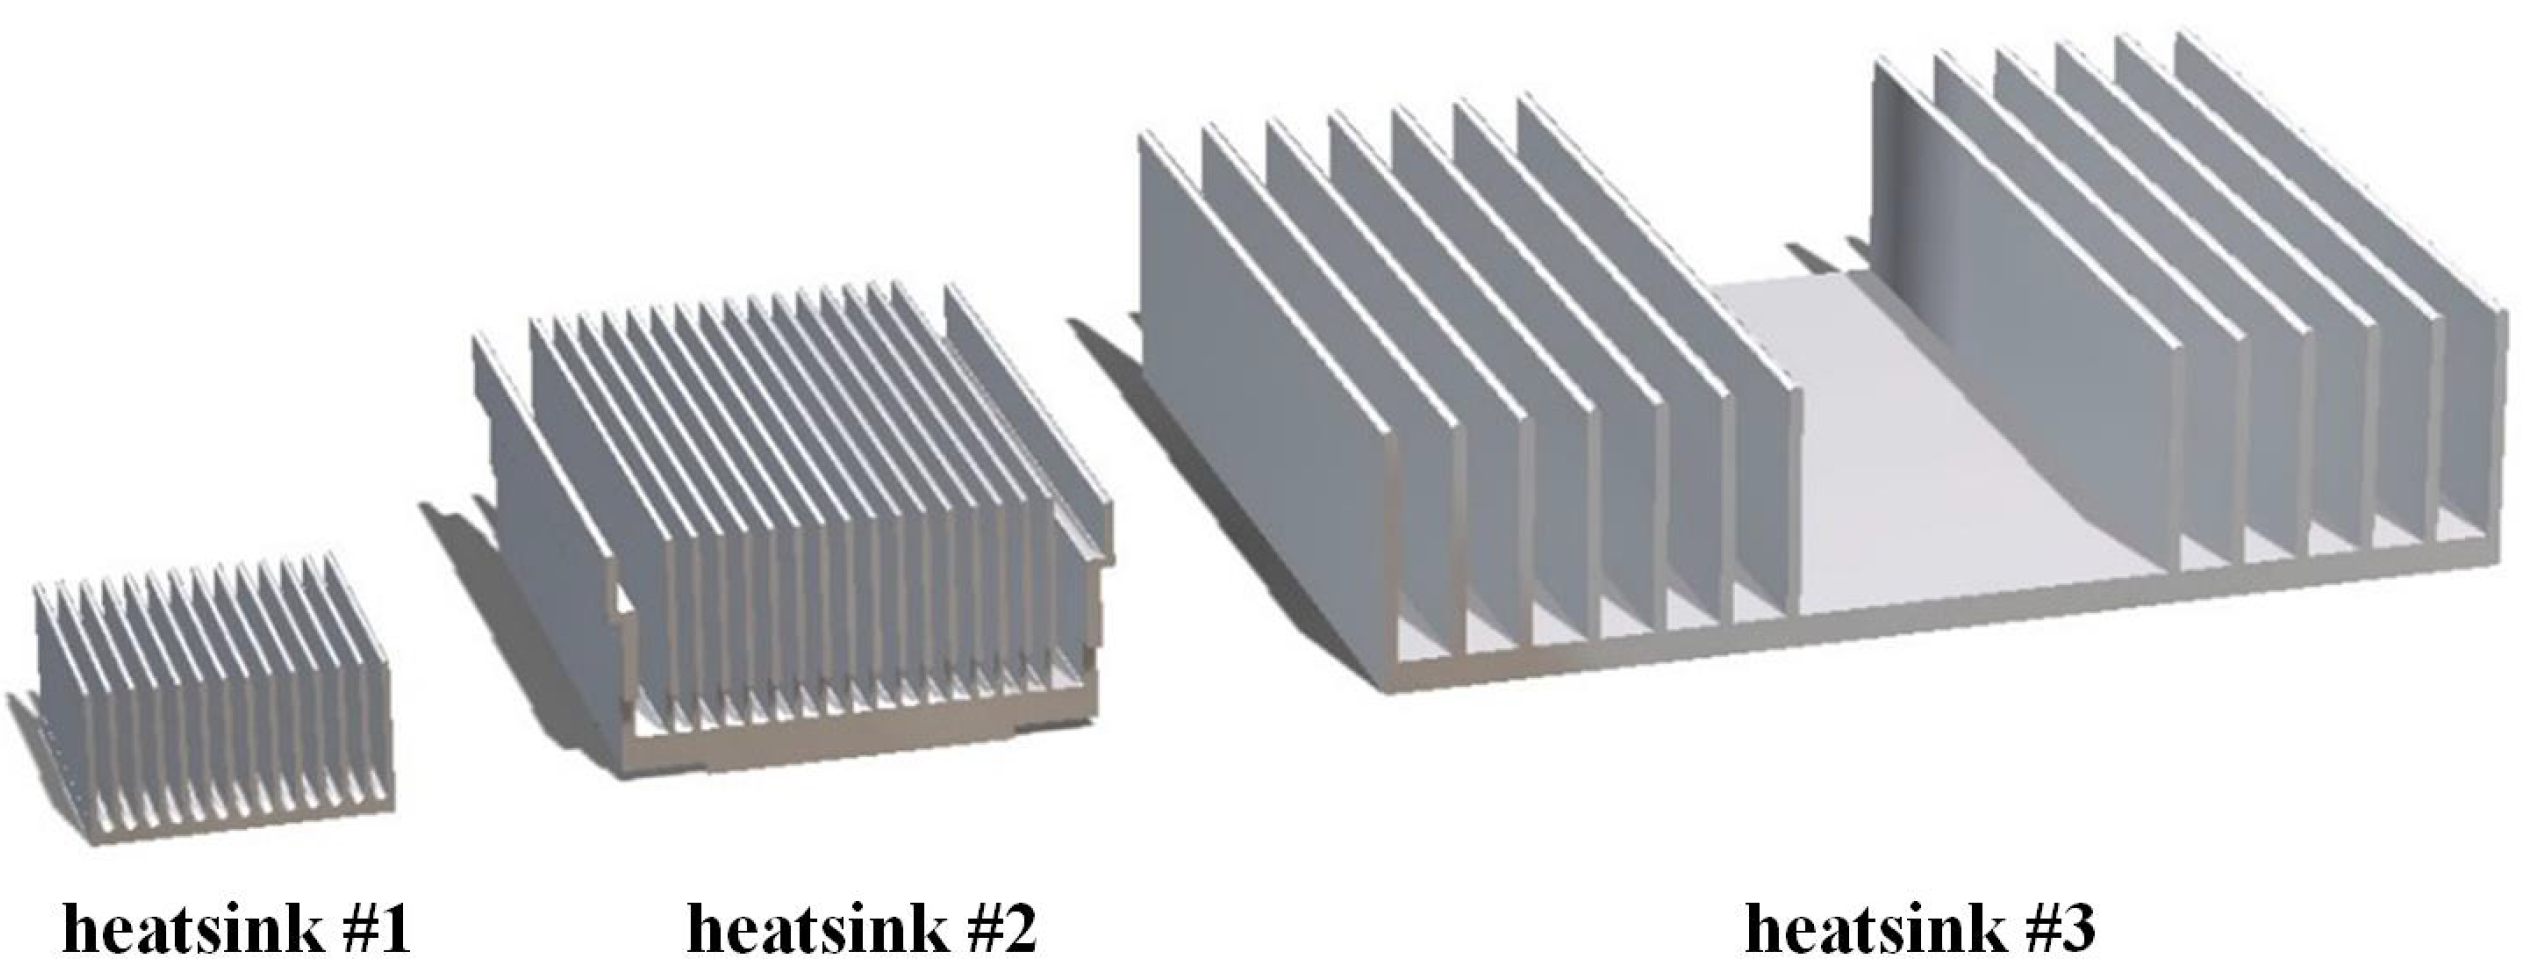
3.3. The Impact of Heatsinks with Different Thermal Resistances
All previous analyses were carried out using the heatsink labeled ‘heatsink #2’. The measurements in single-ended operation mode and the analysis of the push–pull operation mode were then repeated, but using a heatsink with a higher thermal resistance (‘heatsink #1’) and a lower thermal resistance (‘heatsink #3’). The heatsink design used in the further analyses is shown in
Figure 9.
The dimensions of the heatsinks used, including the surface area and thickness of the top plate, as well as the number, length, and thickness of the fins, are listed in
Table 2.
The values of the generated temperature on the hot side and the total generated energy in the push–pull mode of TEG operations using different thermal connections, switching times, and heatsink types are shown in
Table 3. Temperatures that reach 150 °C before the end of the 10 min measurement interval (amplifier operation) are marked in red in the table. As already noted, more frequent switching between the systems leads to lower temperatures on the hot side. Further conclusions from the analysis are as follows:
- –
In general, using a heatsink with a higher thermal resistance resulted in higher temperatures on the hot side and lower generated energy values.
- –
The shading of the gradient in the results obtained with ’heatsink #3’ shows that the temperature on the hot side and the energy generated increased with longer switching times between the systems.
The results in the table show that the use of a heatsink with lower thermal resistance has a positive effect on the performance of the TEGs.
3.4. System Efficiency Increase
In this subsection, the values of thermoelectric efficiency
and the estimated increase in efficiency of the Class AB power amplifier system
are presented, assuming that all the energy generated in the push–pull mode of TEG operation is fed back into the power supply of the amplifier. These efficiency values are listed in
Table 4, taking into account the efficiency for different thermal connections, switching times, and the use of different heatsink types.
The thermoelectric conversion efficiency of TEGs (
) was calculated as the ratio of the electrical energy generated at the output terminals of the TEGs in the push–pull mode of operation (
) to the thermal energy dissipated by the amplifier output transistors (
) (
1). The waste thermal energy was calculated as the difference between the energy supplied by the laboratory power supply powering the amplifier and the output power delivered to the amplifier’s load, which, in this case, was 50 W.
The increase in efficiency of the power amplifier system (
), in the case where the converted energy is fed back to the amplifier’s power supply circuit, was calculated using (
2). In this expression,
represents the calculated efficiency of the amplifier without the application of TEGs, operating at an output power of 50 W (51.43%), while the new efficiency value,
, is calculated when the energy generated by the TEGs is subtracted from the amplifier’s supply voltage.
It can be seen from the gradient shading in
Table 4 that the efficiency increased when a heatsink with lower thermal resistance was used. The highest efficiencies were achieved by using ‘heatsink #3’. In this case, the thermoelectric conversion efficiency was at least 1.097%, while the estimated increase in the power amplifier system’s efficiency was 0.275%.
The exact thermoelectric conversion efficiency cannot be precisely determined due to the unknown power loss of the output transistors. Initially, it was assumed that the entire difference between input and output power was dissipated by the output transistors (which is not entirely correct), so the calculated thermoelectric conversion efficiency should be at least equal to the stated value. As for the estimated increase in efficiency of the Class AB power amplifier, it is more accurate to speak of the overall efficiency of the system, since the amplifier continues to dissipate the same amount of waste heat energy. The only change is that the input power of the amplifier now includes the energy generated by the TEGs.
4. Discussion
Based on the measurements carried out on the experimentally developed thermoelectric system, the results were discussed in a broader context. A comparison of the measured results with those presented in the existing literature was made, along with considerations of the obtained results in relation to the hypotheses and aims of this research, as outlined in the “Objectives of this work” section.
Since existing studies do not consider the application of TEGs to power amplifiers with the aim of reducing the dimensions of the heatsinks used, the comparison was based on the improvements in thermoelectric conversion efficiency and amplifier efficiency reported in the literature.
Compared to the study conducted in [
22], where the measured thermoelectric conversion efficiency was 0.074%, our work showed that the conversion efficiency reached at least 1.097%, depending on the choice of heatsink used and the thermal connections of the TEGs. Regarding the use of converted energy to improve amplifier efficiency, the authors in [
24] achieved an efficiency increase of 1.1%, while in our work, this value reached 0.275%.
The results available in the literature are not fully comparable with those obtained in our research due to differences in amplifier classes, output powers, TEG models, heatsinks with different thermal resistance values, and other factors. Our research has demonstrated that the components of the thermoelectric system play a significant role in the results obtained. However, regardless of the choice of system components, the values obtained remain in the same order of magnitude, as the low thermoelectric efficiency of TEGs is a limiting factor for achieving significant improvements.
The use of smaller heatsinks in Class AB power amplifiers would lead to their wider application and make them competitive with Class D amplifiers. The main idea of this work is to apply TEGs to the output transistors to convert part of the thermal energy into electrical energy, which would result in a smaller amount of thermal energy dissipated on the heatsink and consequently, the use of smaller heatsinks. In addition to the smaller heatsinks, the converted energy could be fed back into the amplifier’s power supply circuit, increasing the efficiency of the Class AB amplifier system.
Initial measurements showed that the use of smaller heatsink and TEGs on the amplifier’s output transistors caused the transistors to reach high temperatures in a very short time. To protect the output transistors from overheating, the amplifier must be switched off. After the amplifier was switched off, the TEGs continued to generate energy for a certain period of time until the temperature gradient at their ends disappeared.
This finding led to the development of a new TEG operating mode, presented in this paper. It is the push–pull mode of TEG operations, which enables continuous amplifier operation and the use of smaller heatsinks on the output transistors.
The theoretical analysis of the push–pull mode of TEG operations is based on results measured on a single pair of output transistors, operating in the so-called single-ended mode of TEG operations. In addition to the analysis of an individually connected TEG, an analysis was also conducted using a thermal series connection of TEGs. This thermal configuration leads to a higher thermoelectric conversion efficiency, but has the drawback that the output transistors reach high temperatures in a shorter time.
The analysis of the push–pull mode of TEG operation includes the impact of different switching times between the systems, different thermal configurations of the TEGs, and the use of heatsinks with different thermal resistances on the temperatures generated and the energy in the system. Although the highest amounts of energy were achieved in continuous operation, this mode is not sustainable due to the high temperatures reached. It is possible to regulate the temperature of the output transistors by varying the switching times between the systems in the push–pull operation of the TEGs. More frequent switching between the systems generates less energy, but also reduces the temperatures at the output transistors. When selecting the optimum switching time between the systems, a balance should be found between the temperatures reached and the energy generated at the load.
Since the push–pull operation of TEGs is not mentioned in the available literature, the results obtained cannot be compared with existing findings. The original hypothesis that the use of TEGs on the output transistors would allow the use of smaller heatsinks has not been confirmed. On the contrary, higher thermoelectric conversion efficiencies of TEGs can be achieved by using larger heatsinks. The limiting factor preventing the realization of this hypothesis is the currently low efficiency of thermoelectric conversion by TEGs. Once significant progress is made in semiconductor materials research and the thermoelectric conversion efficiency of TEGs improves, the proposed hypothesis will become valid.
5. Conclusions
The wider application of Class AB audio power amplifiers is limited by their relatively low efficiency and the need for large heatsinks. The original assumption that TEGs placed between the output transistors and the heatsink would absorb some of the thermal energy and allow the use of smaller heatsinks in Class AB power amplifiers has not been confirmed. On the contrary, the use of larger heatsinks leads to higher thermoelectric efficiency and higher converted energy. If the converted energy is fed back into the power supply circuit, the efficiency of the system increases only insignificantly. The size of the heatsink used in a Class AB power amplifier system with TEGs must be selected as a compromise between the system temperatures achieved and the amount of energy converted. The low thermoelectric conversion efficiency of TEGs is a limiting factor that prevents the use of smaller heatsinks and a significant improvement in the efficiency of the power amplifier system. This outcome can only be achieved through considerable progress in the development of semiconductor materials for the manufacture of thermocouples, which will lead to a significant increase in the thermoelectric conversion efficiency of TEGs.


