
PDS-YOLO: A Real-Time Detection Algorithm for Pipeline Defect Detection


Abstract
1. Introduction
2. Materials and Methods
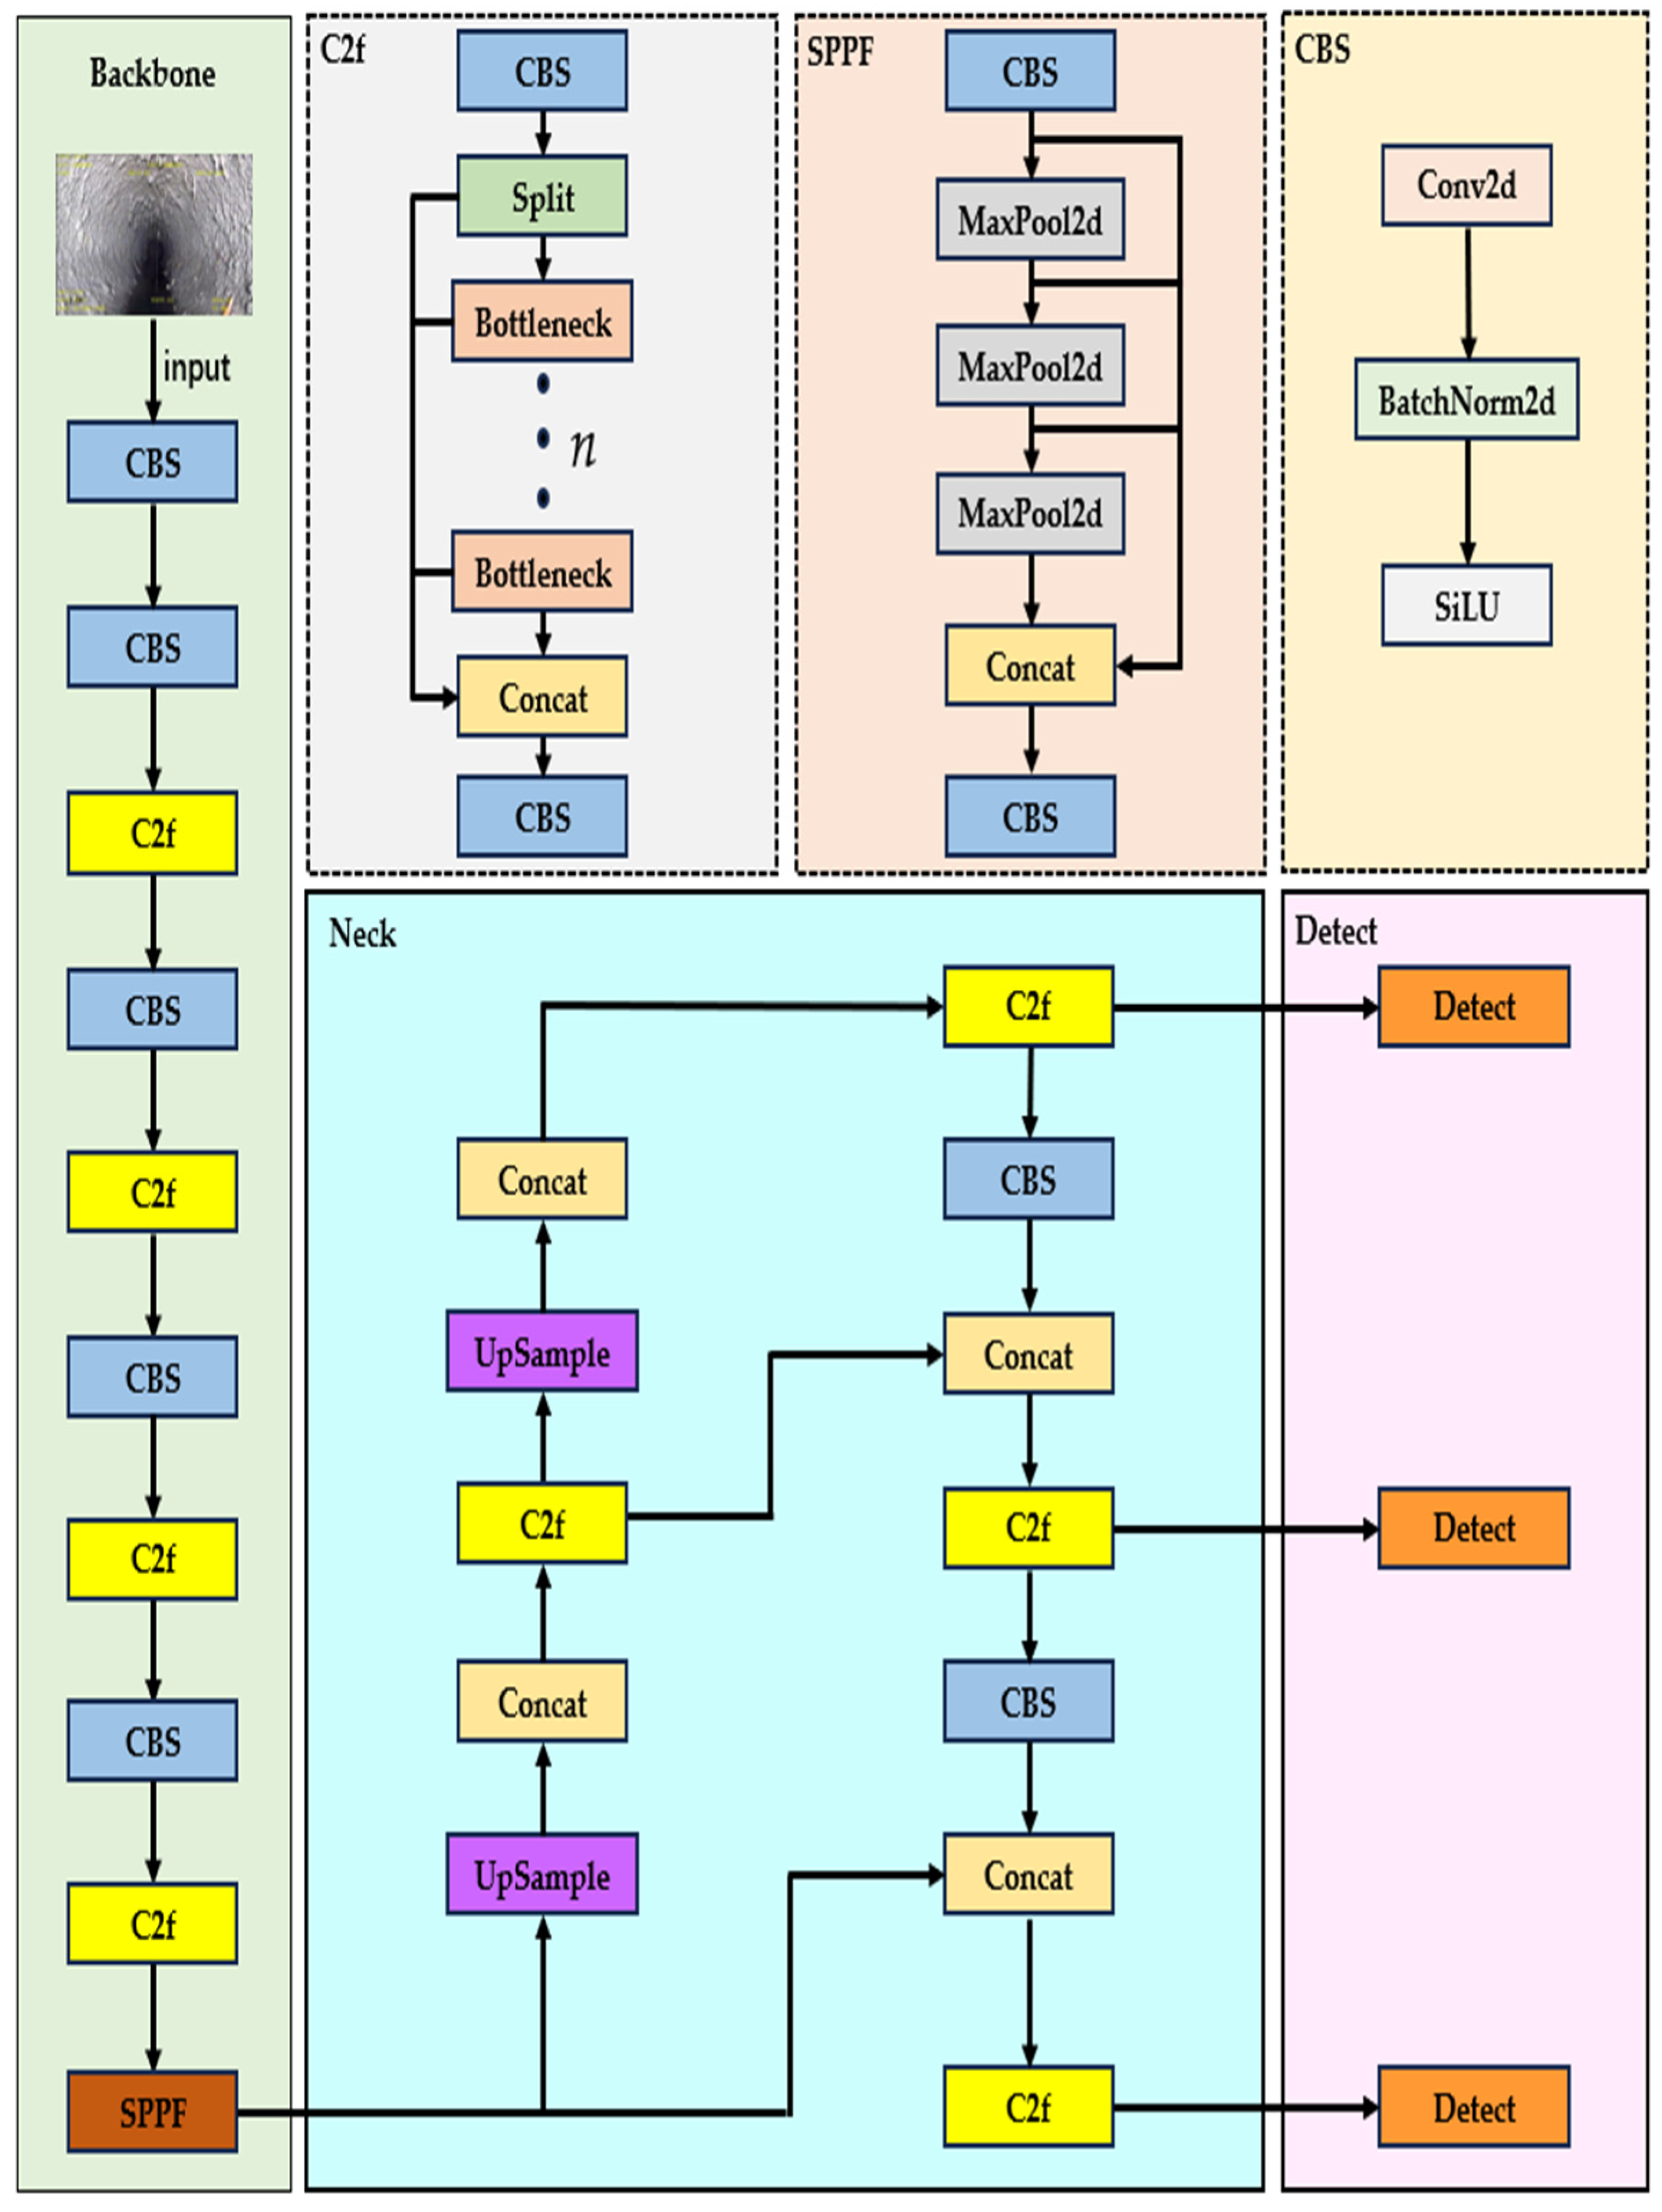
2.1. YOLOV8 Model
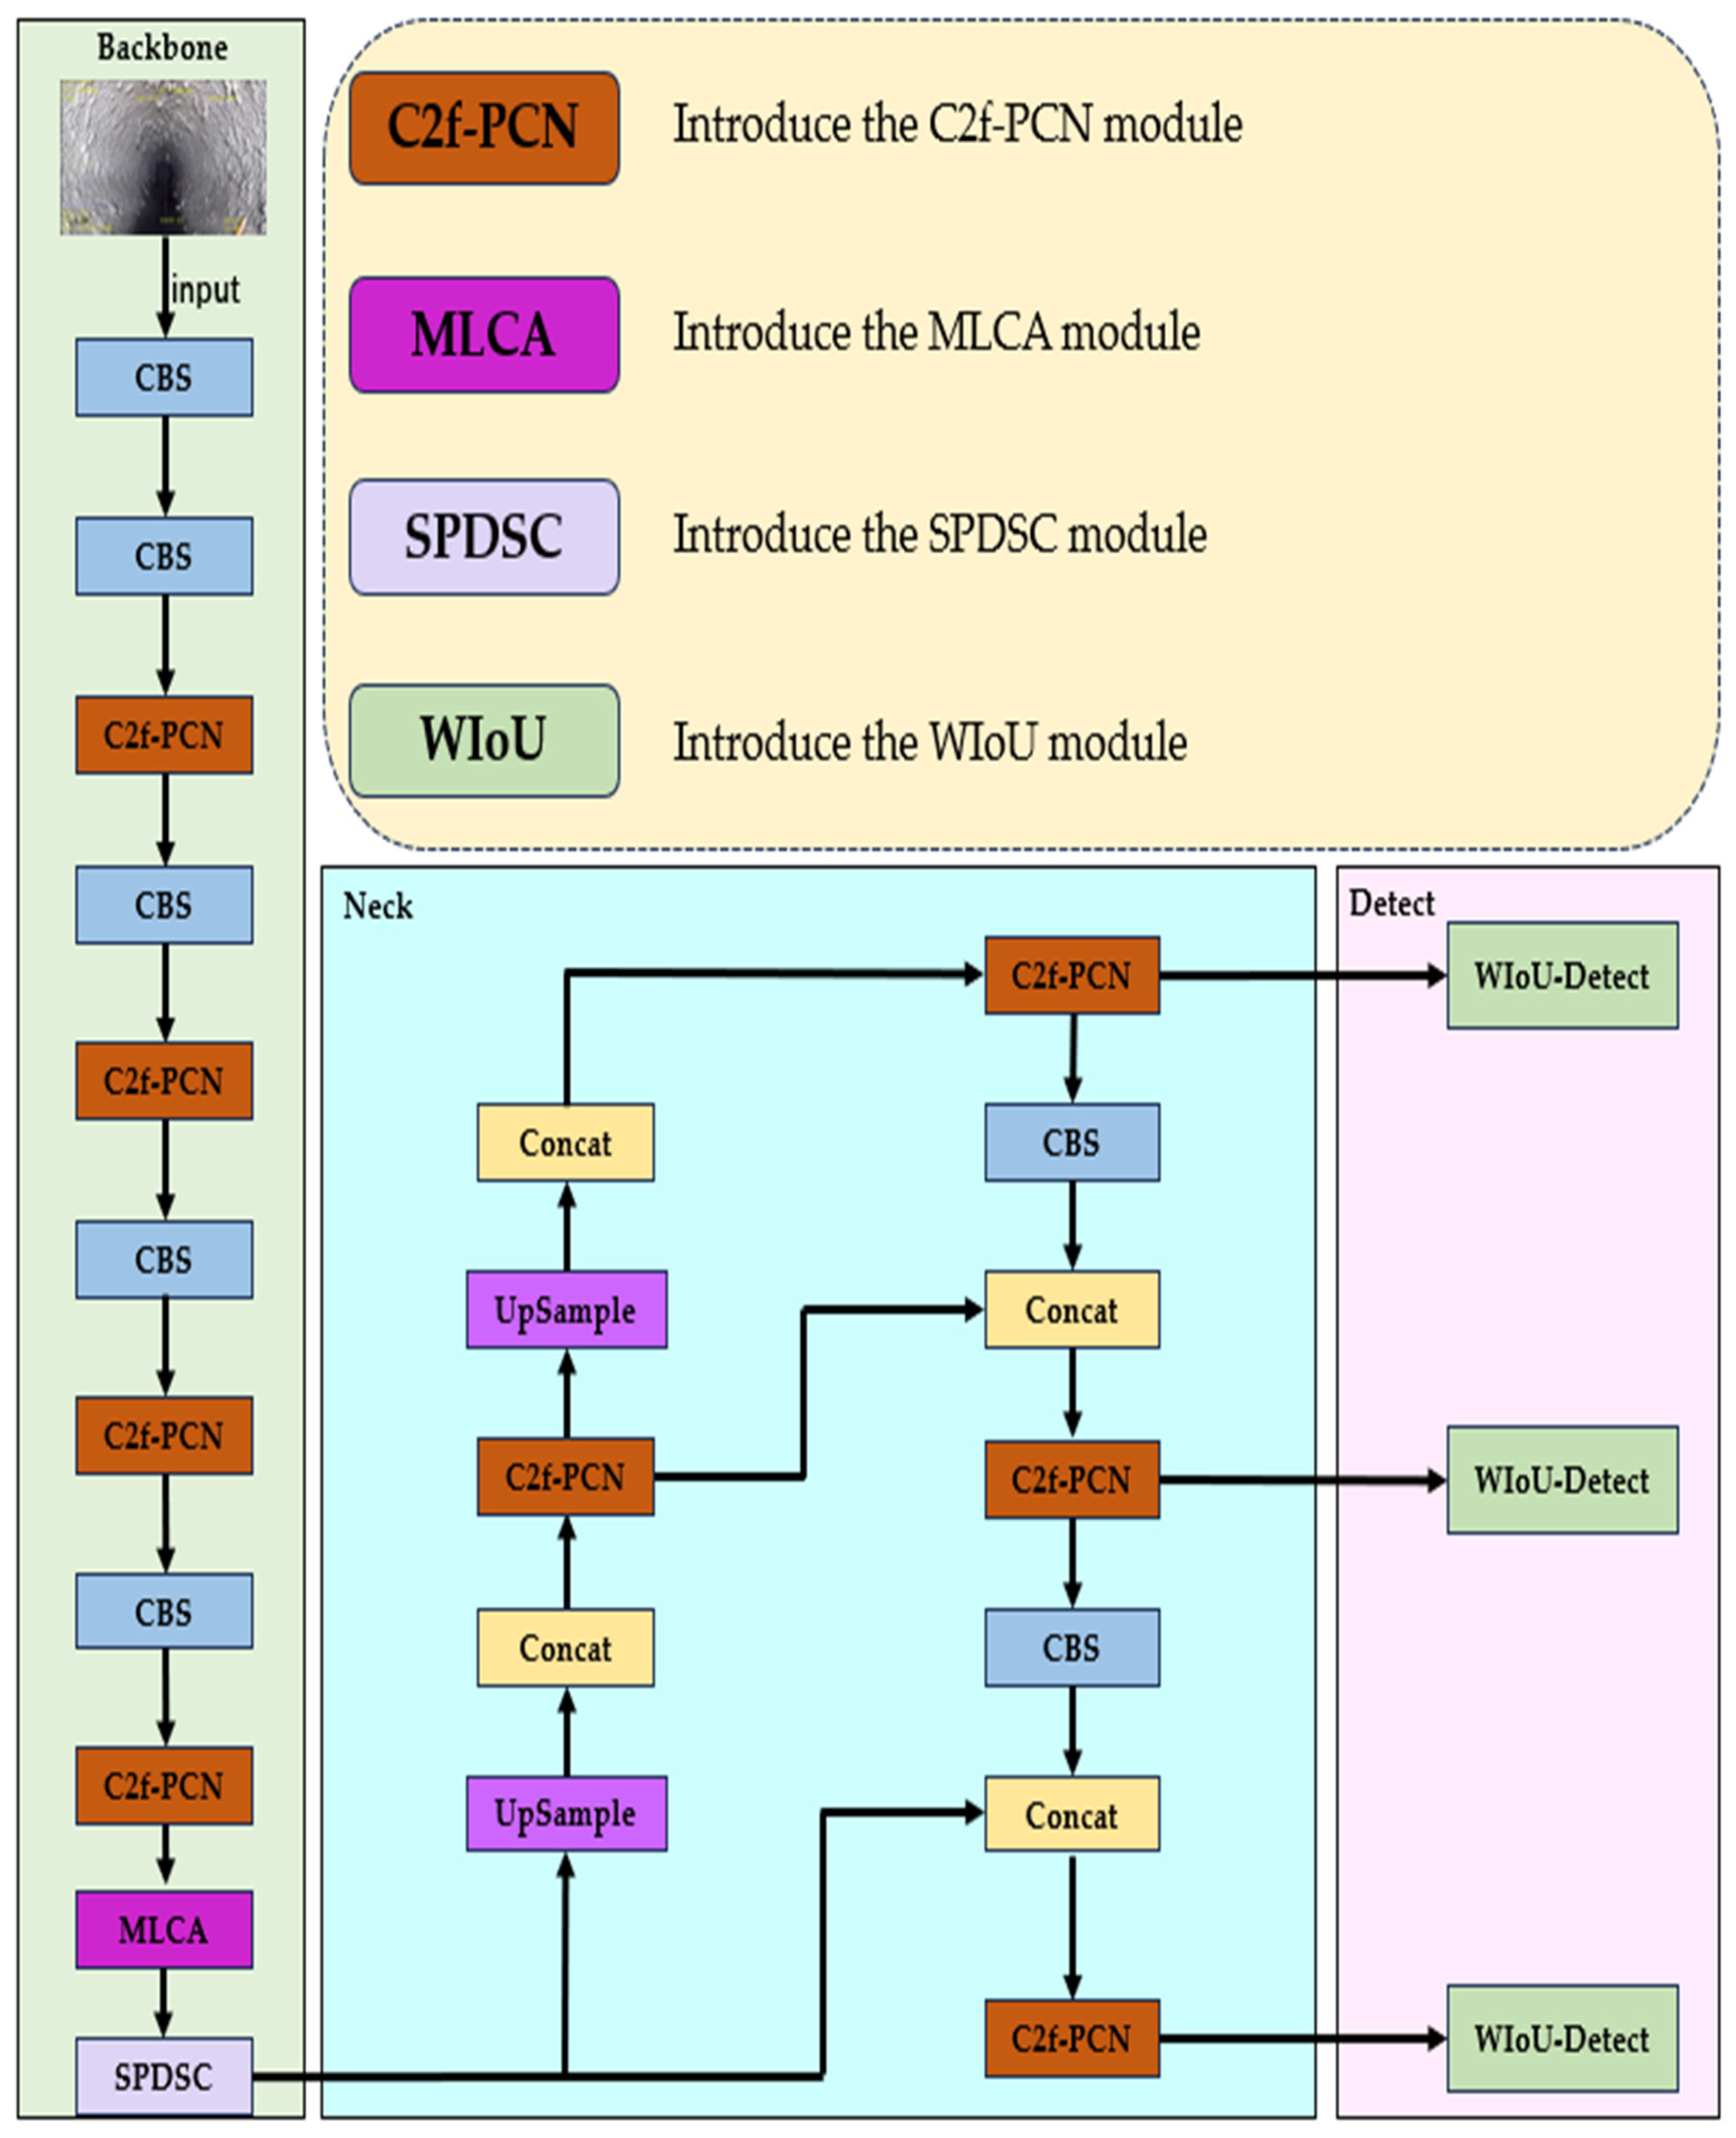
2.2. PDS-YOLO Model
2.2.1. C2f-PCN Module
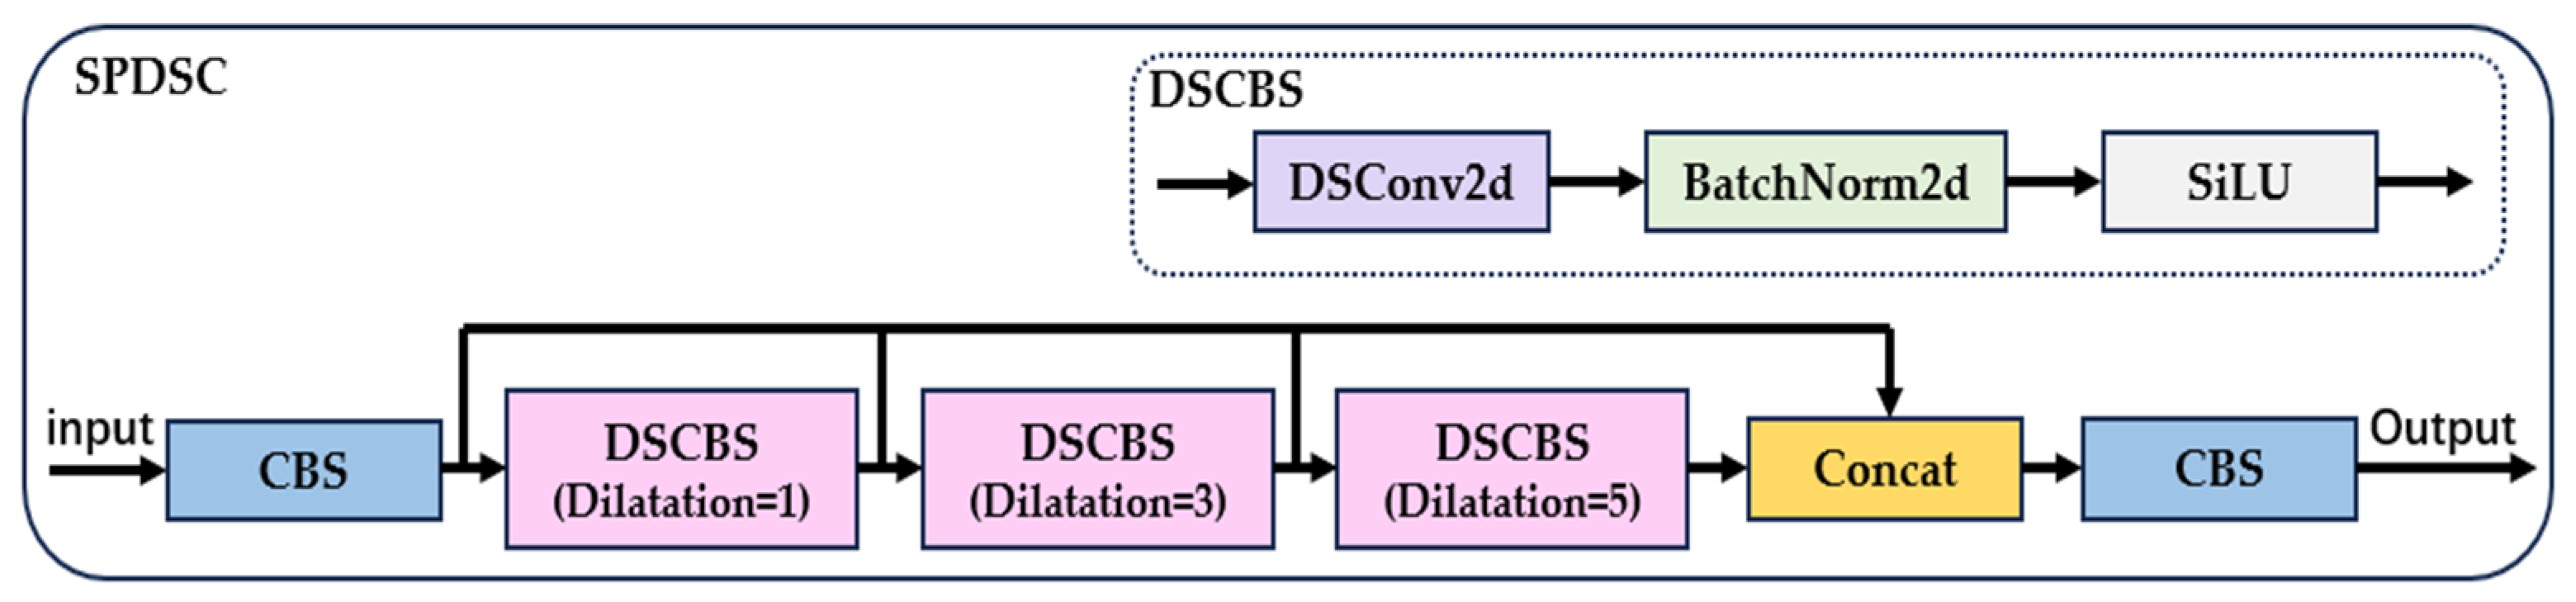
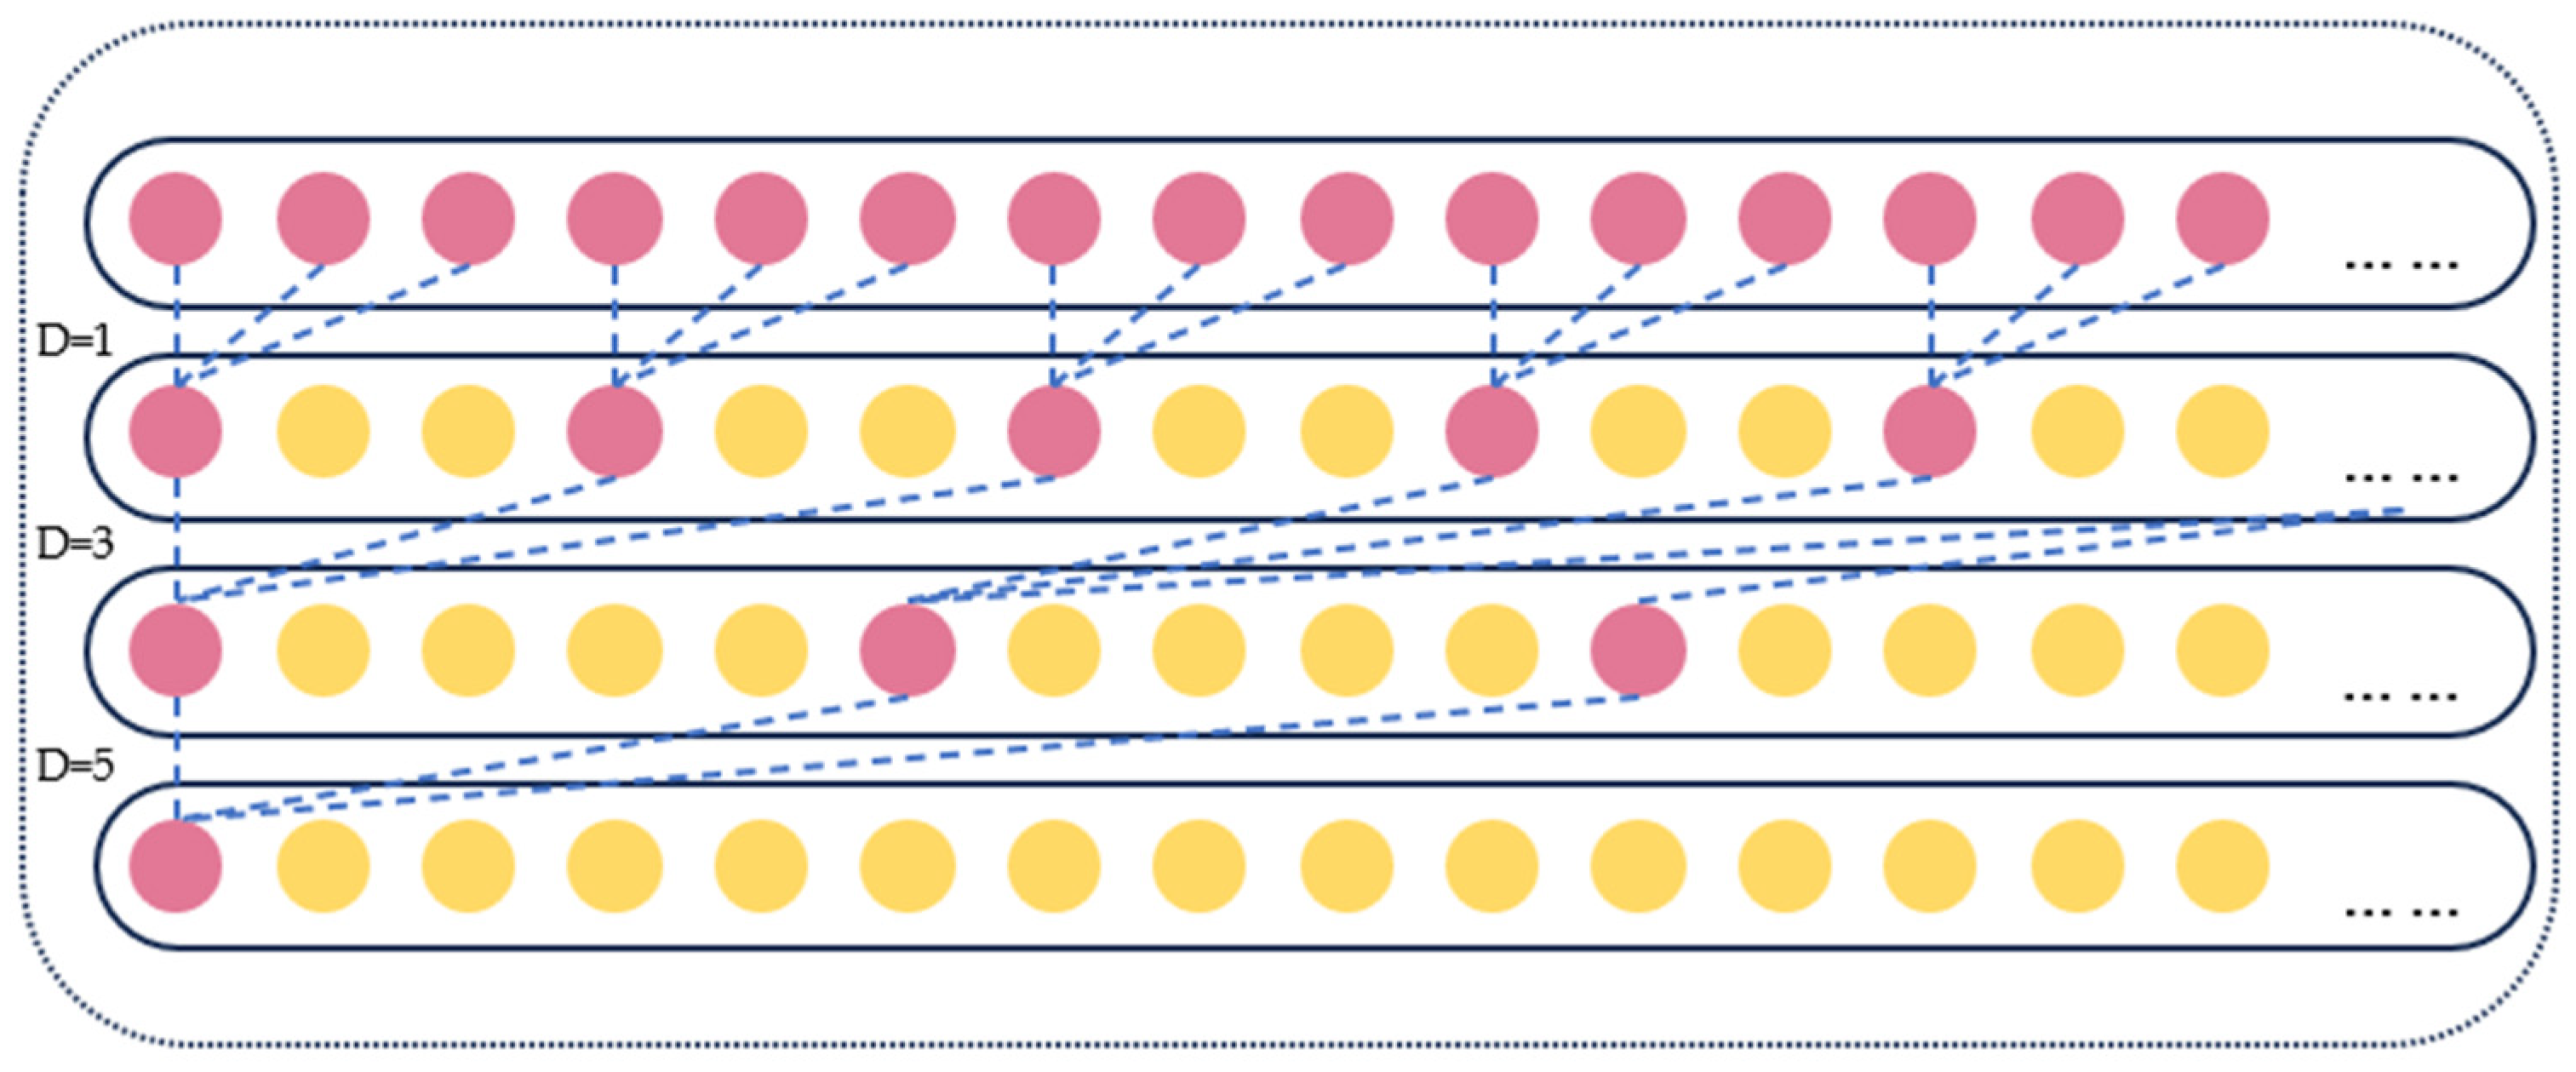
2.2.2. SPDSC Module
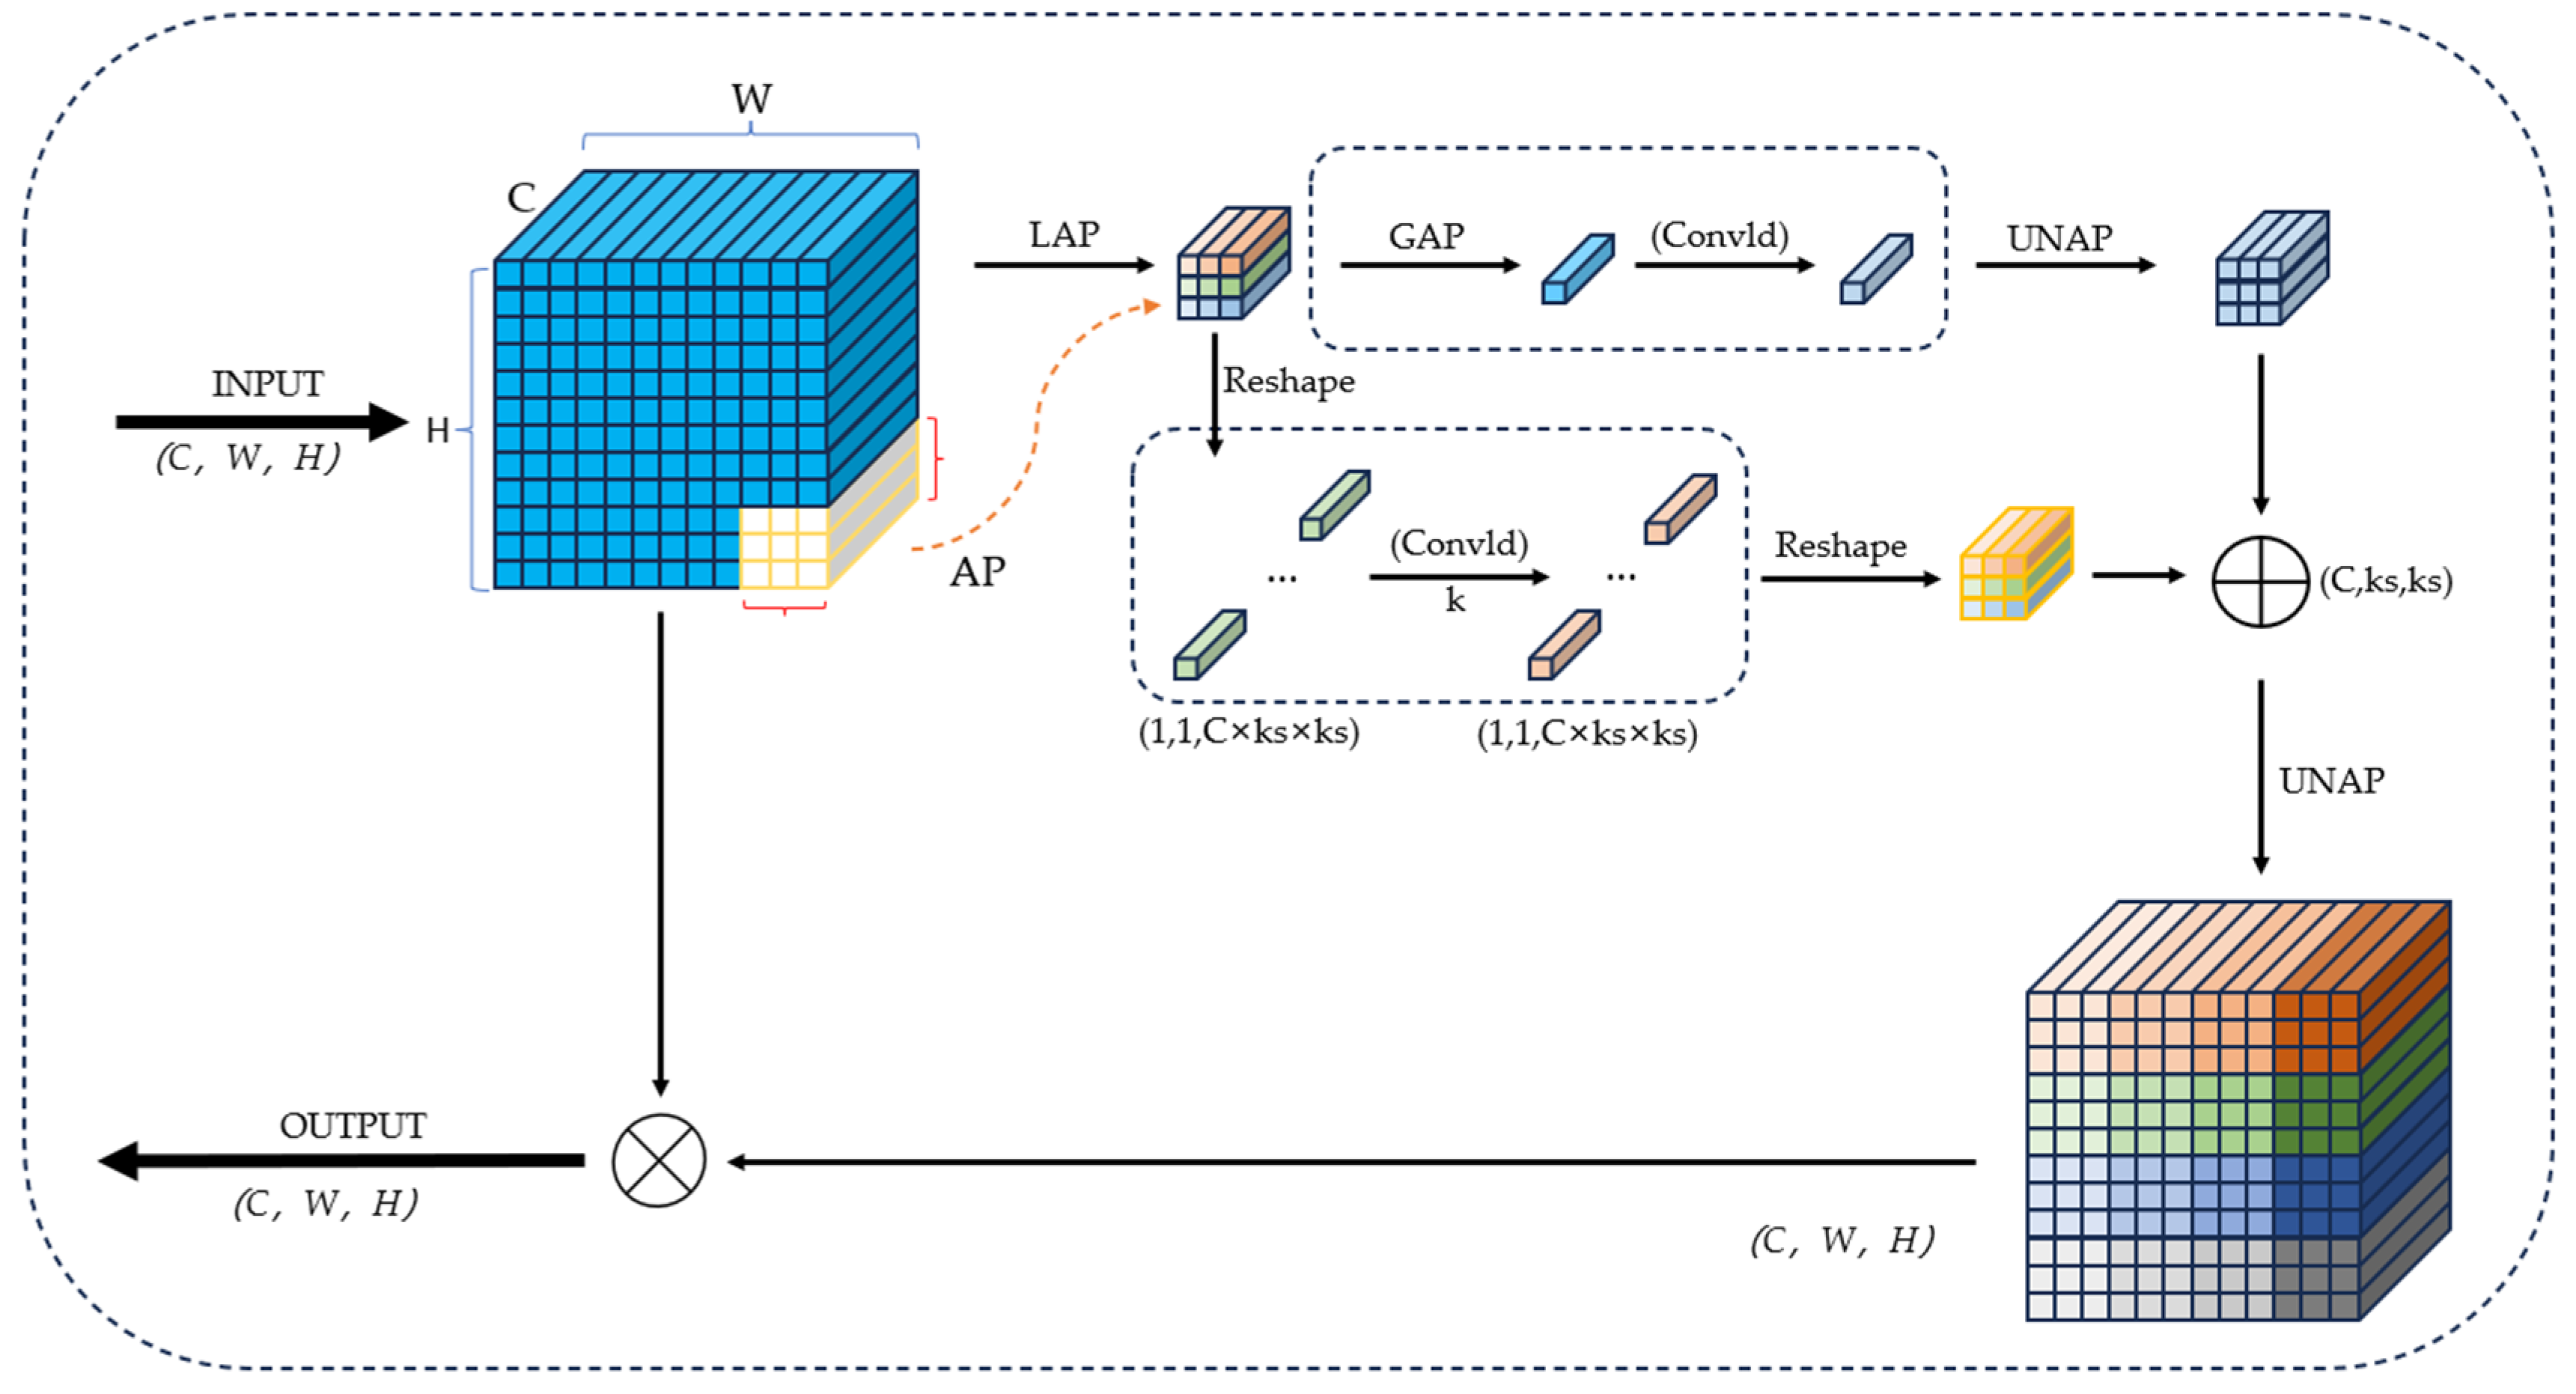
2.2.3. MLCA Module
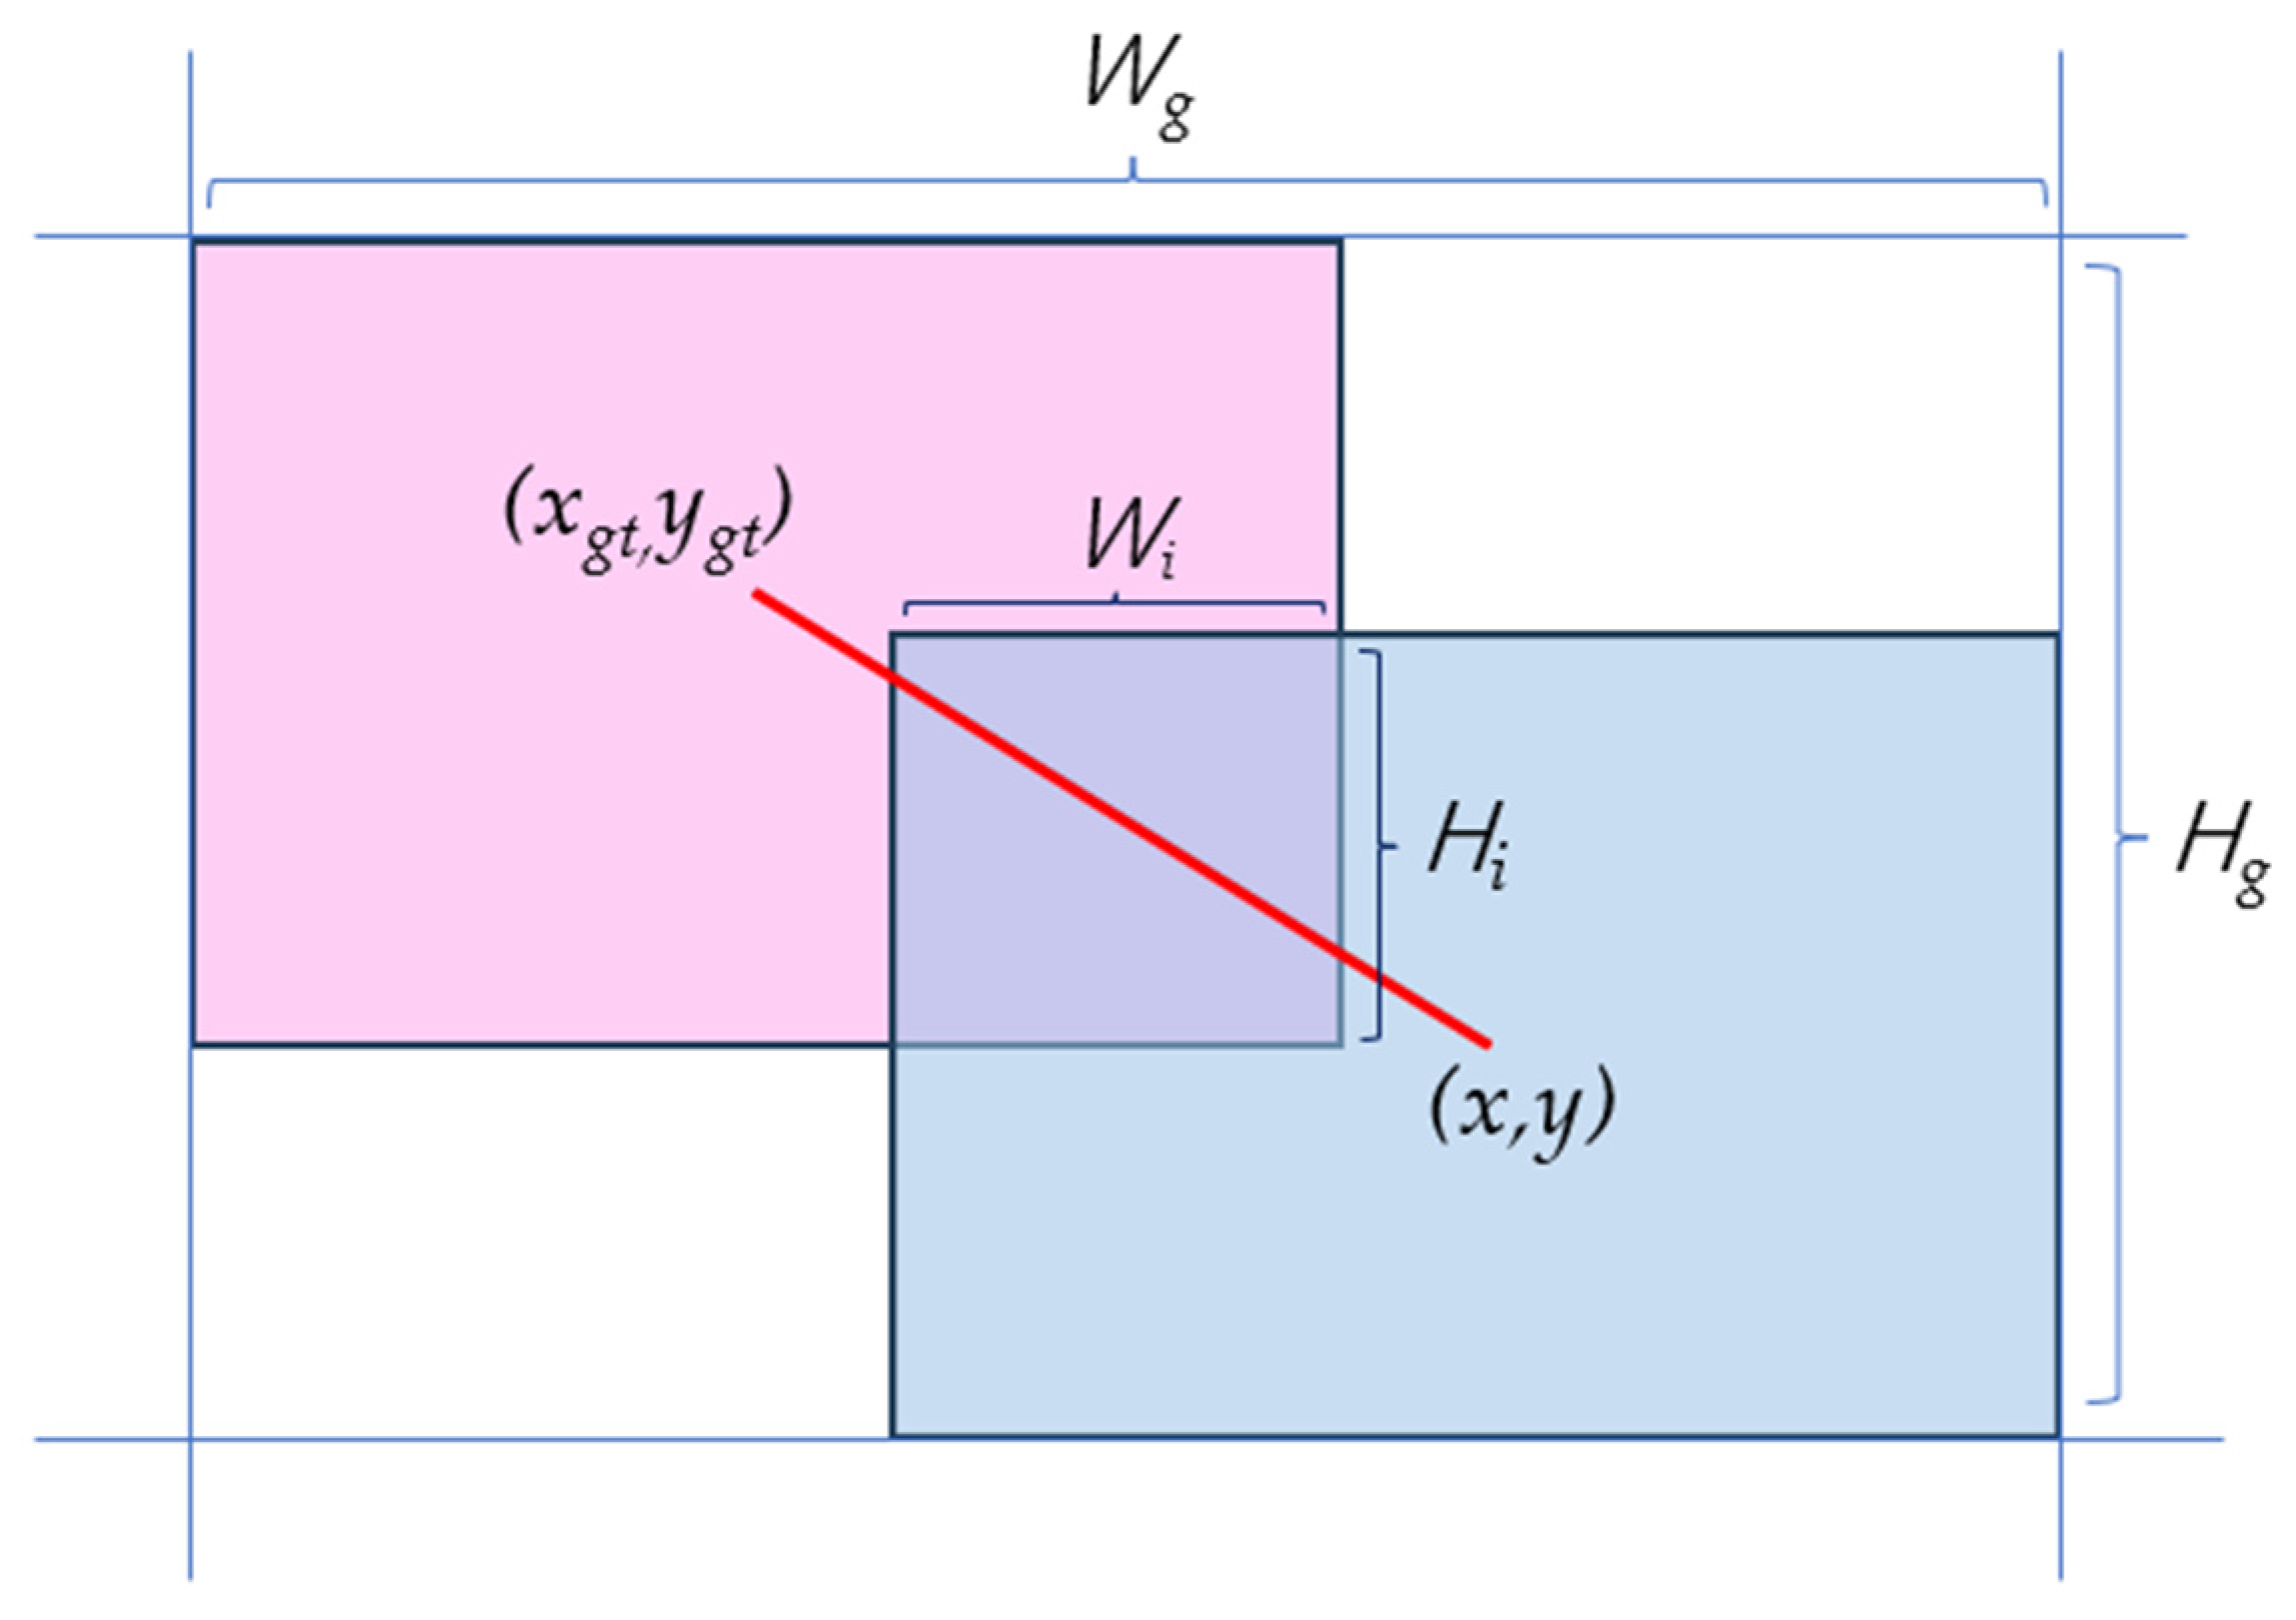
2.2.4. Wise-IoU Loss Function
3. Experimentation and Analysis
3.1. Experimental Environment
3.2. Experimental Results and Analysis
3.2.1. Ablation Experiment
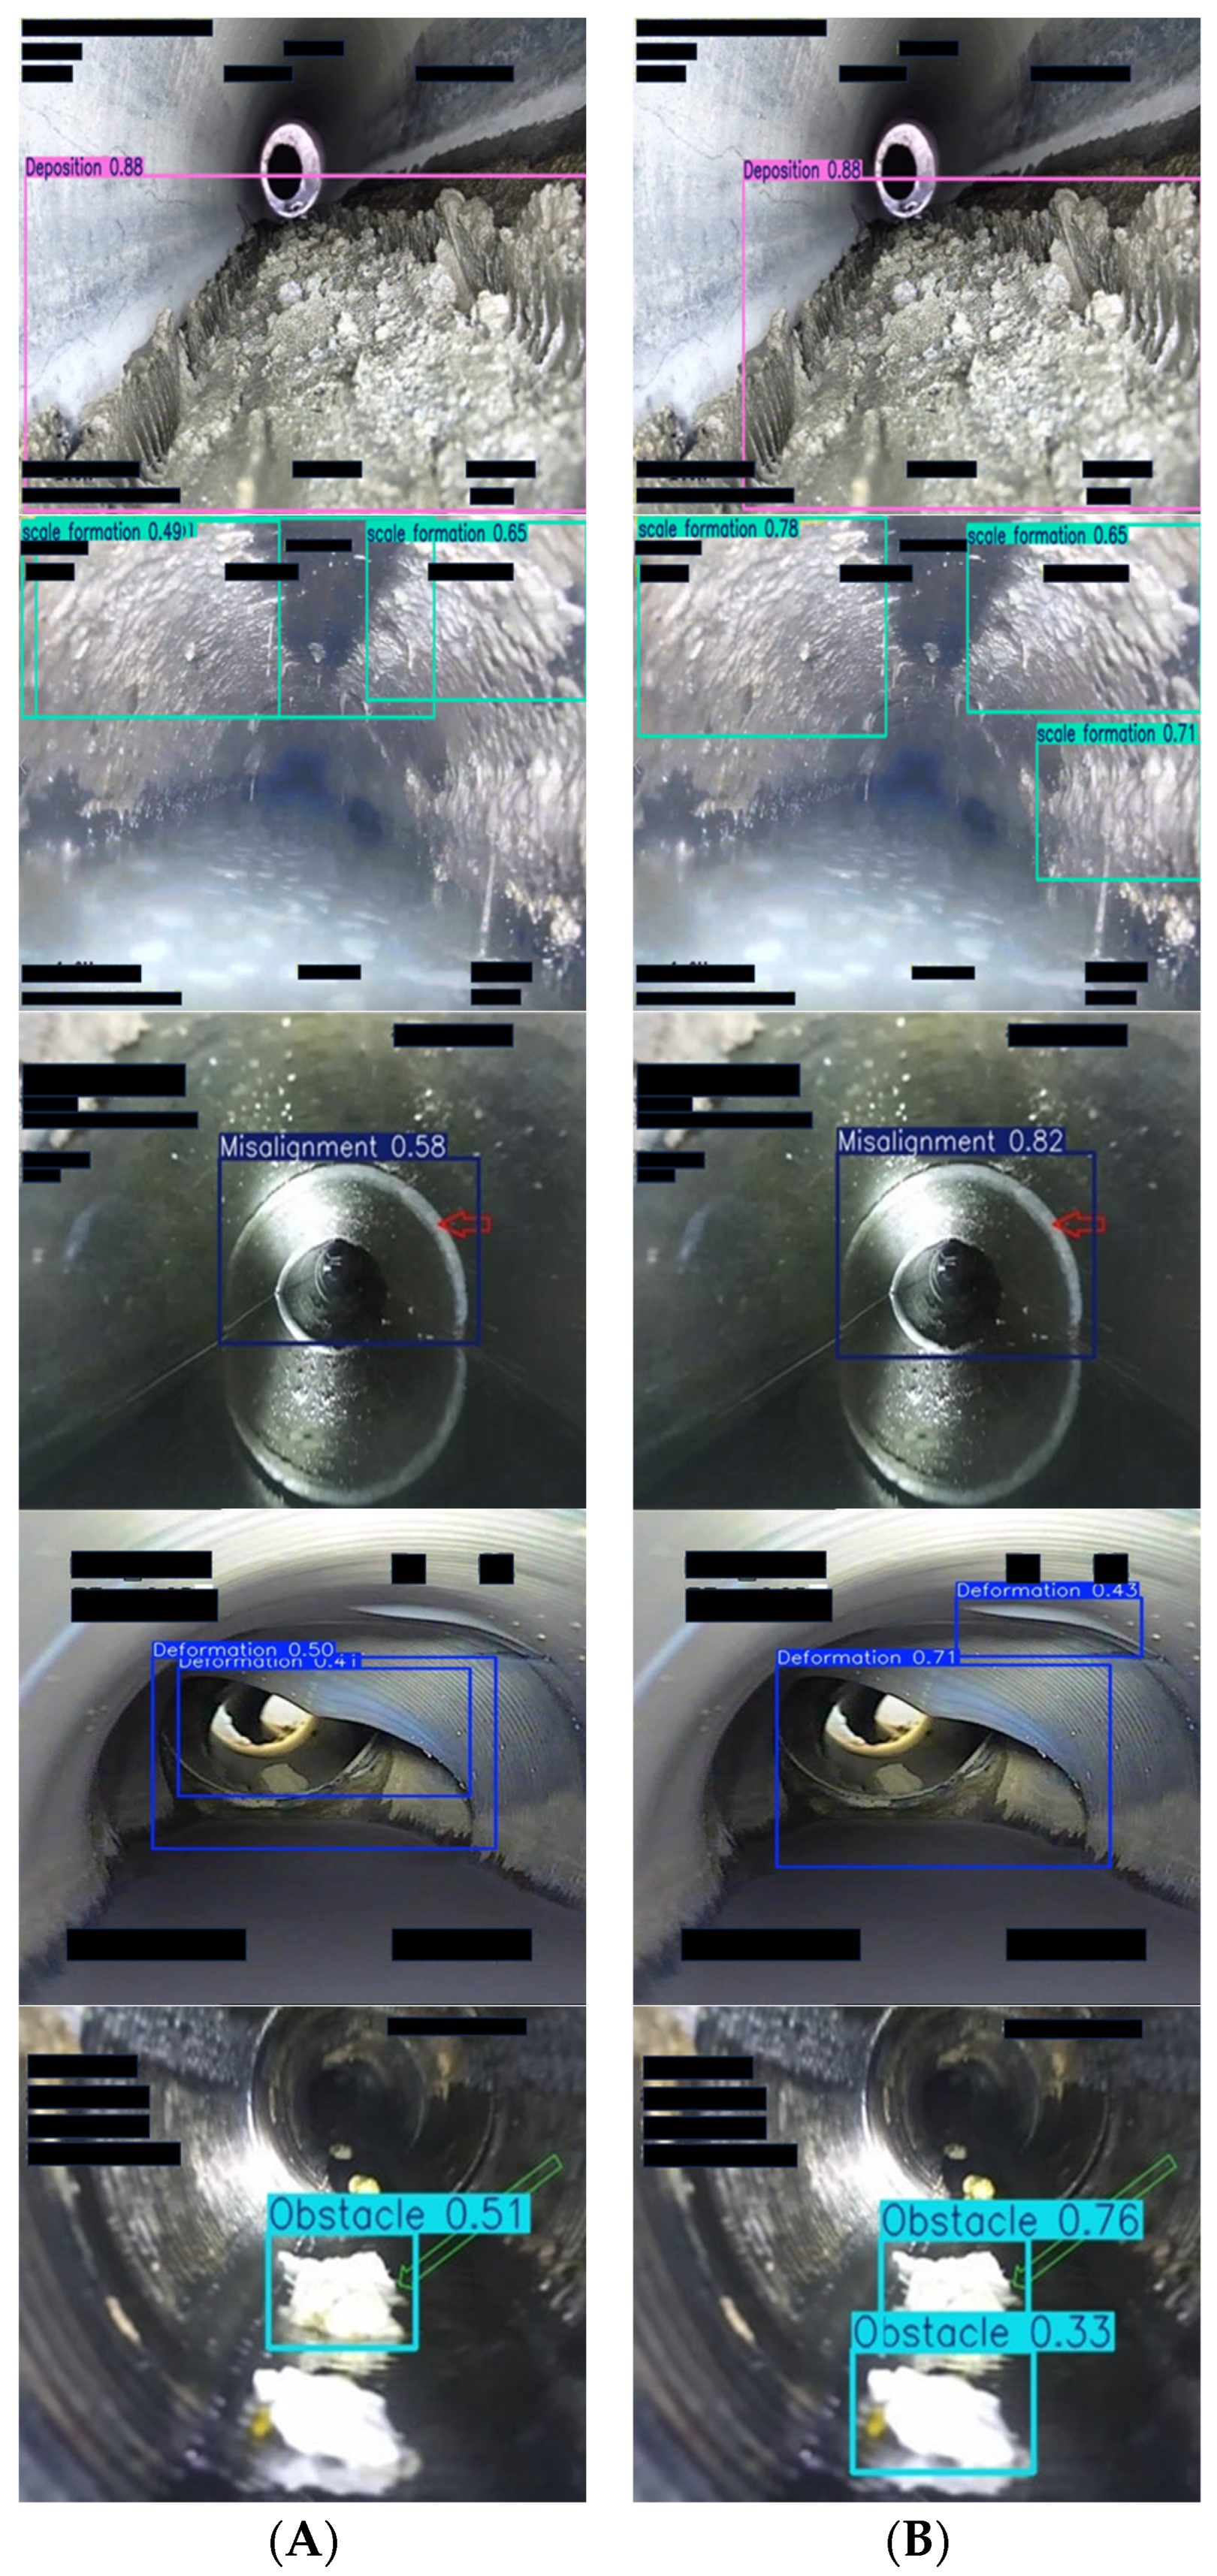
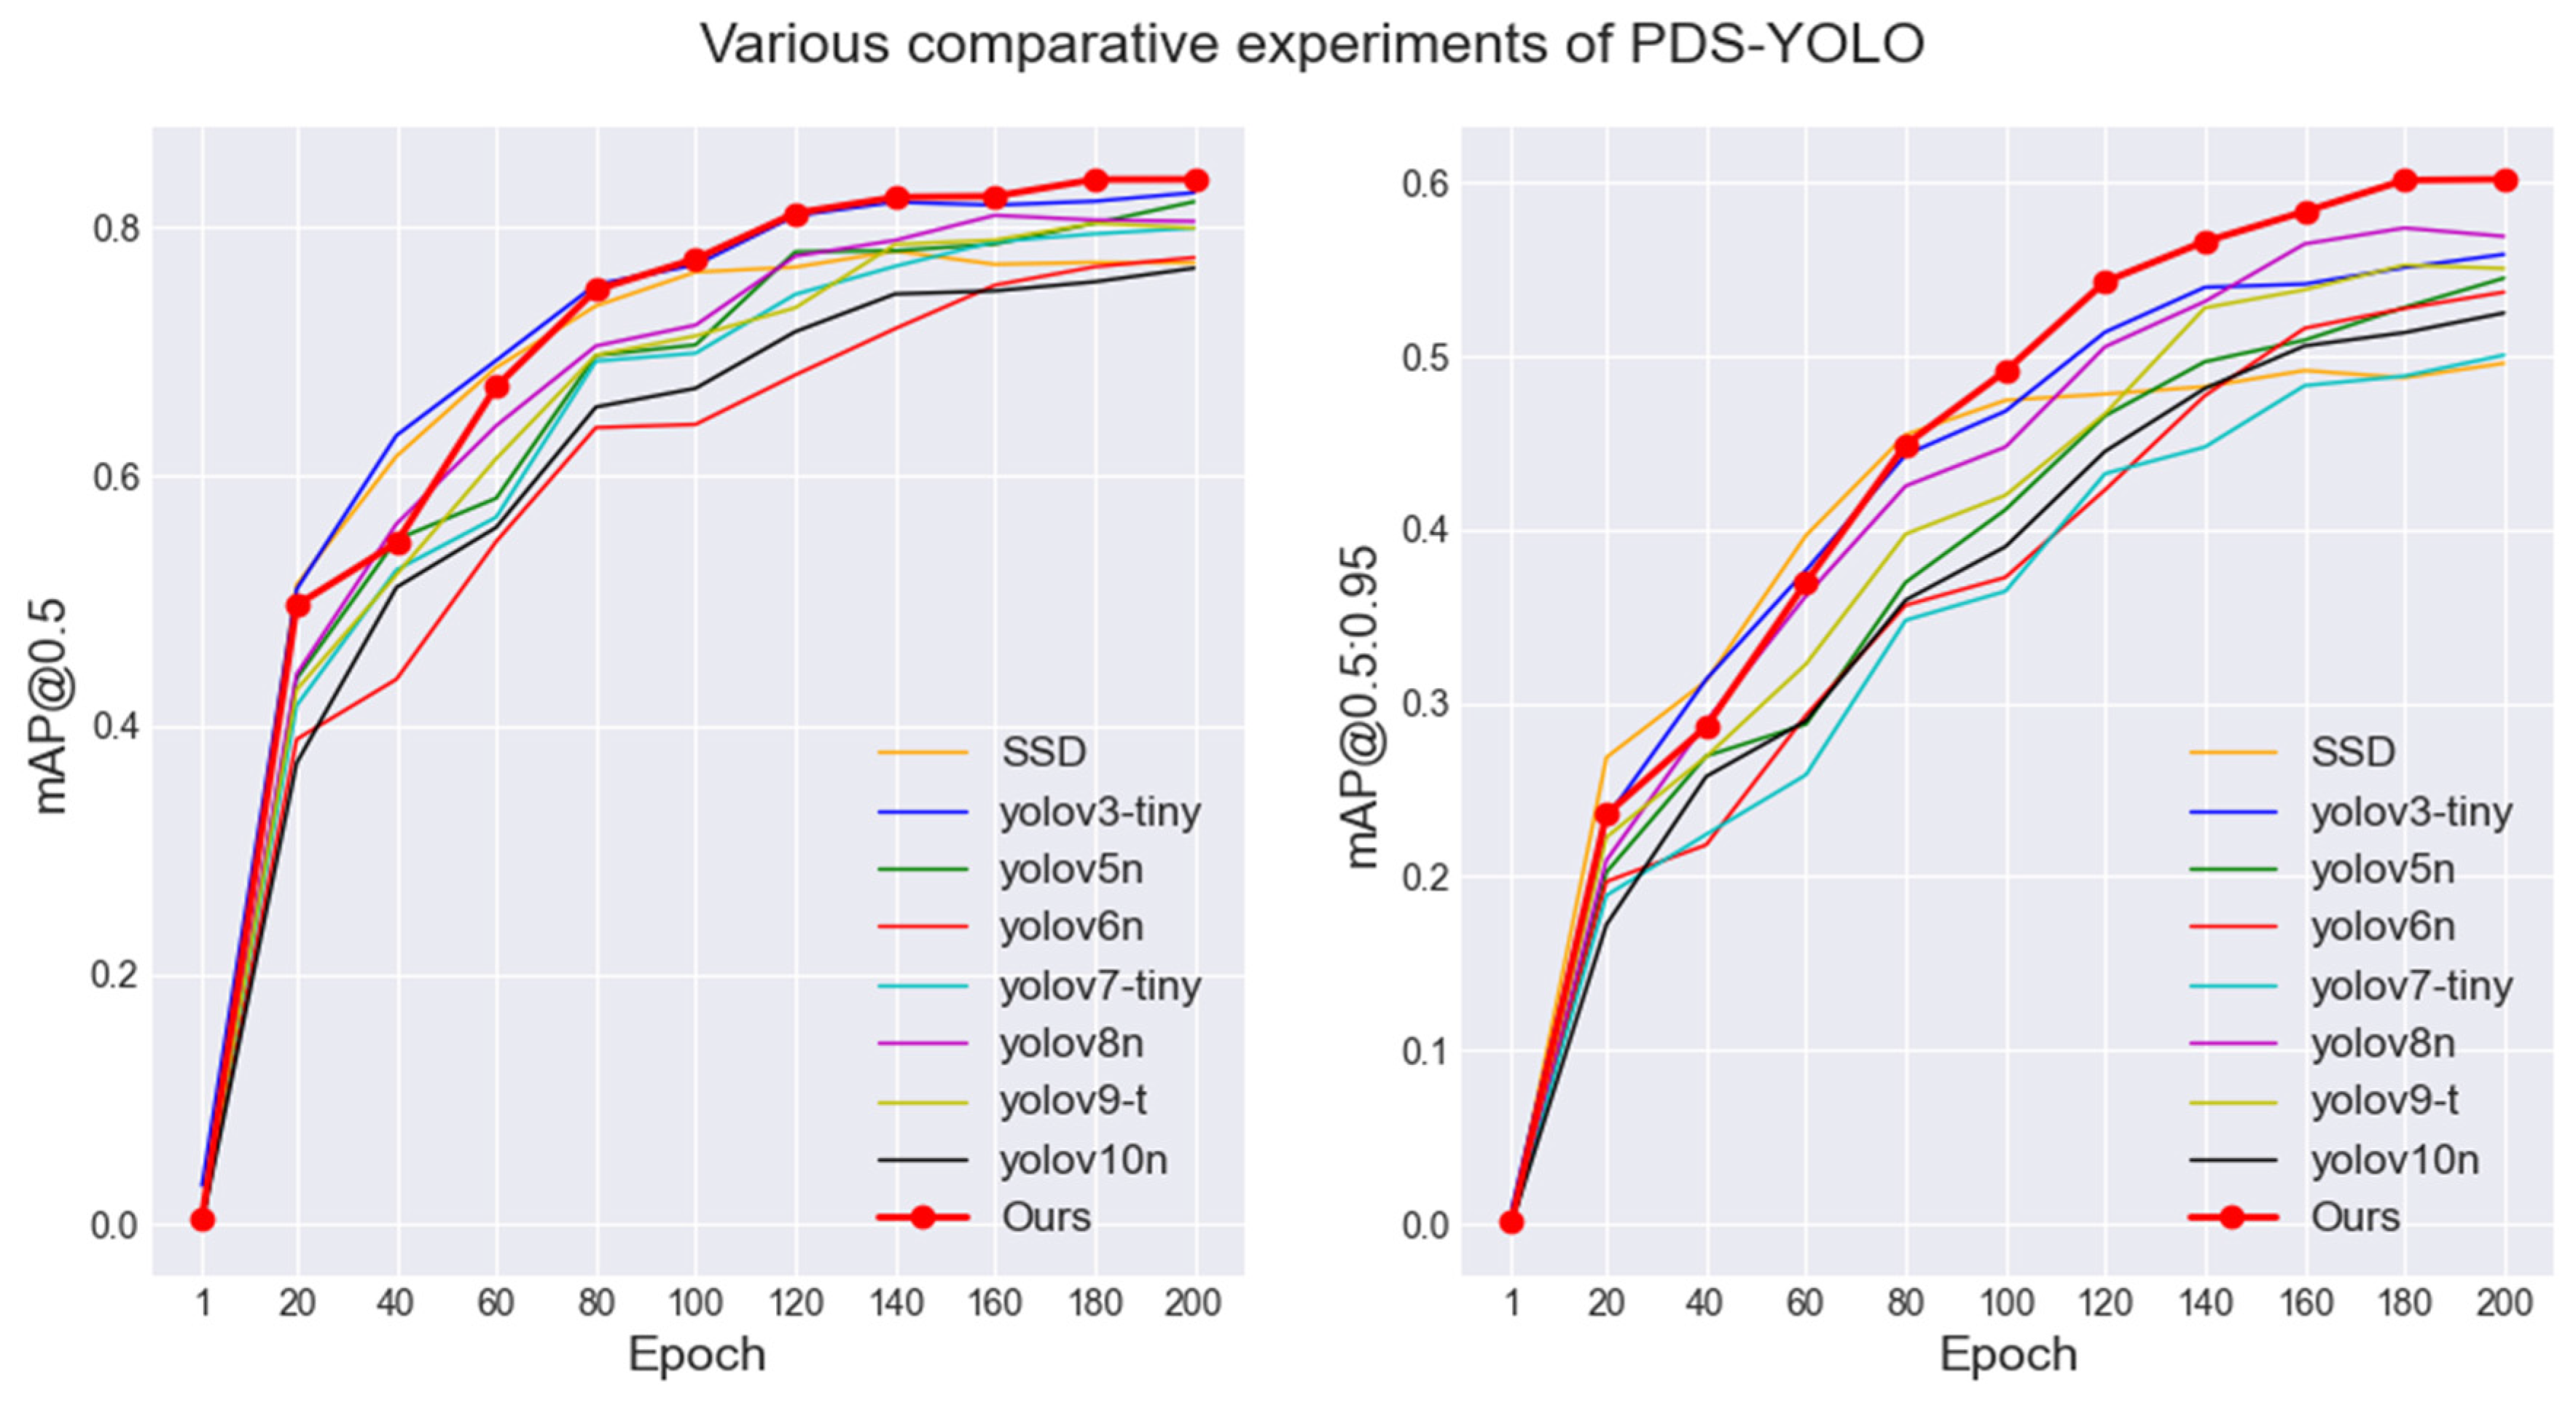
3.2.2. Comparison Experiments with Mainstream Benchmark Models
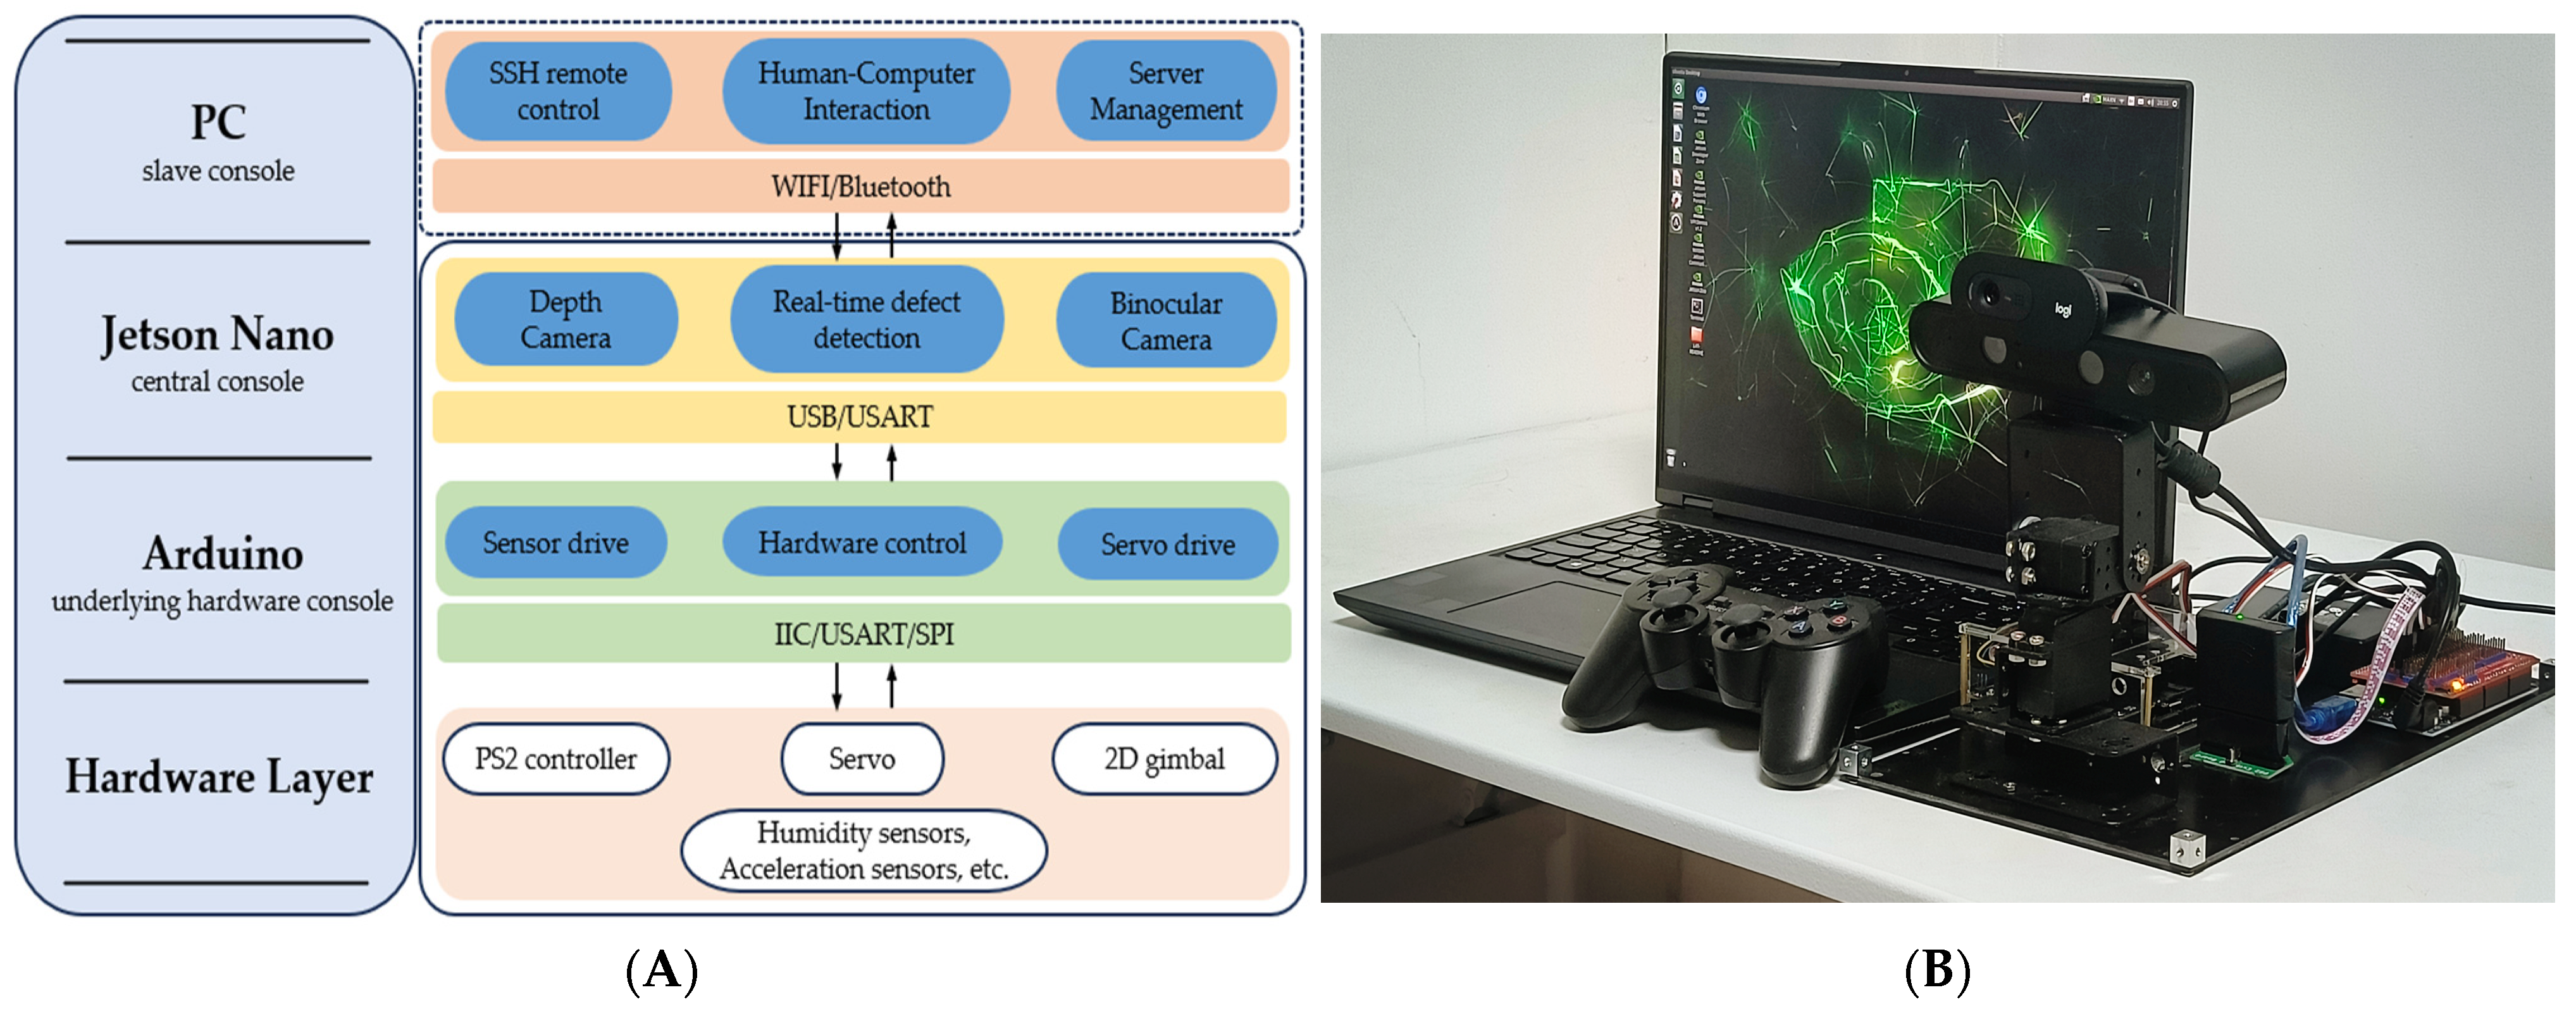
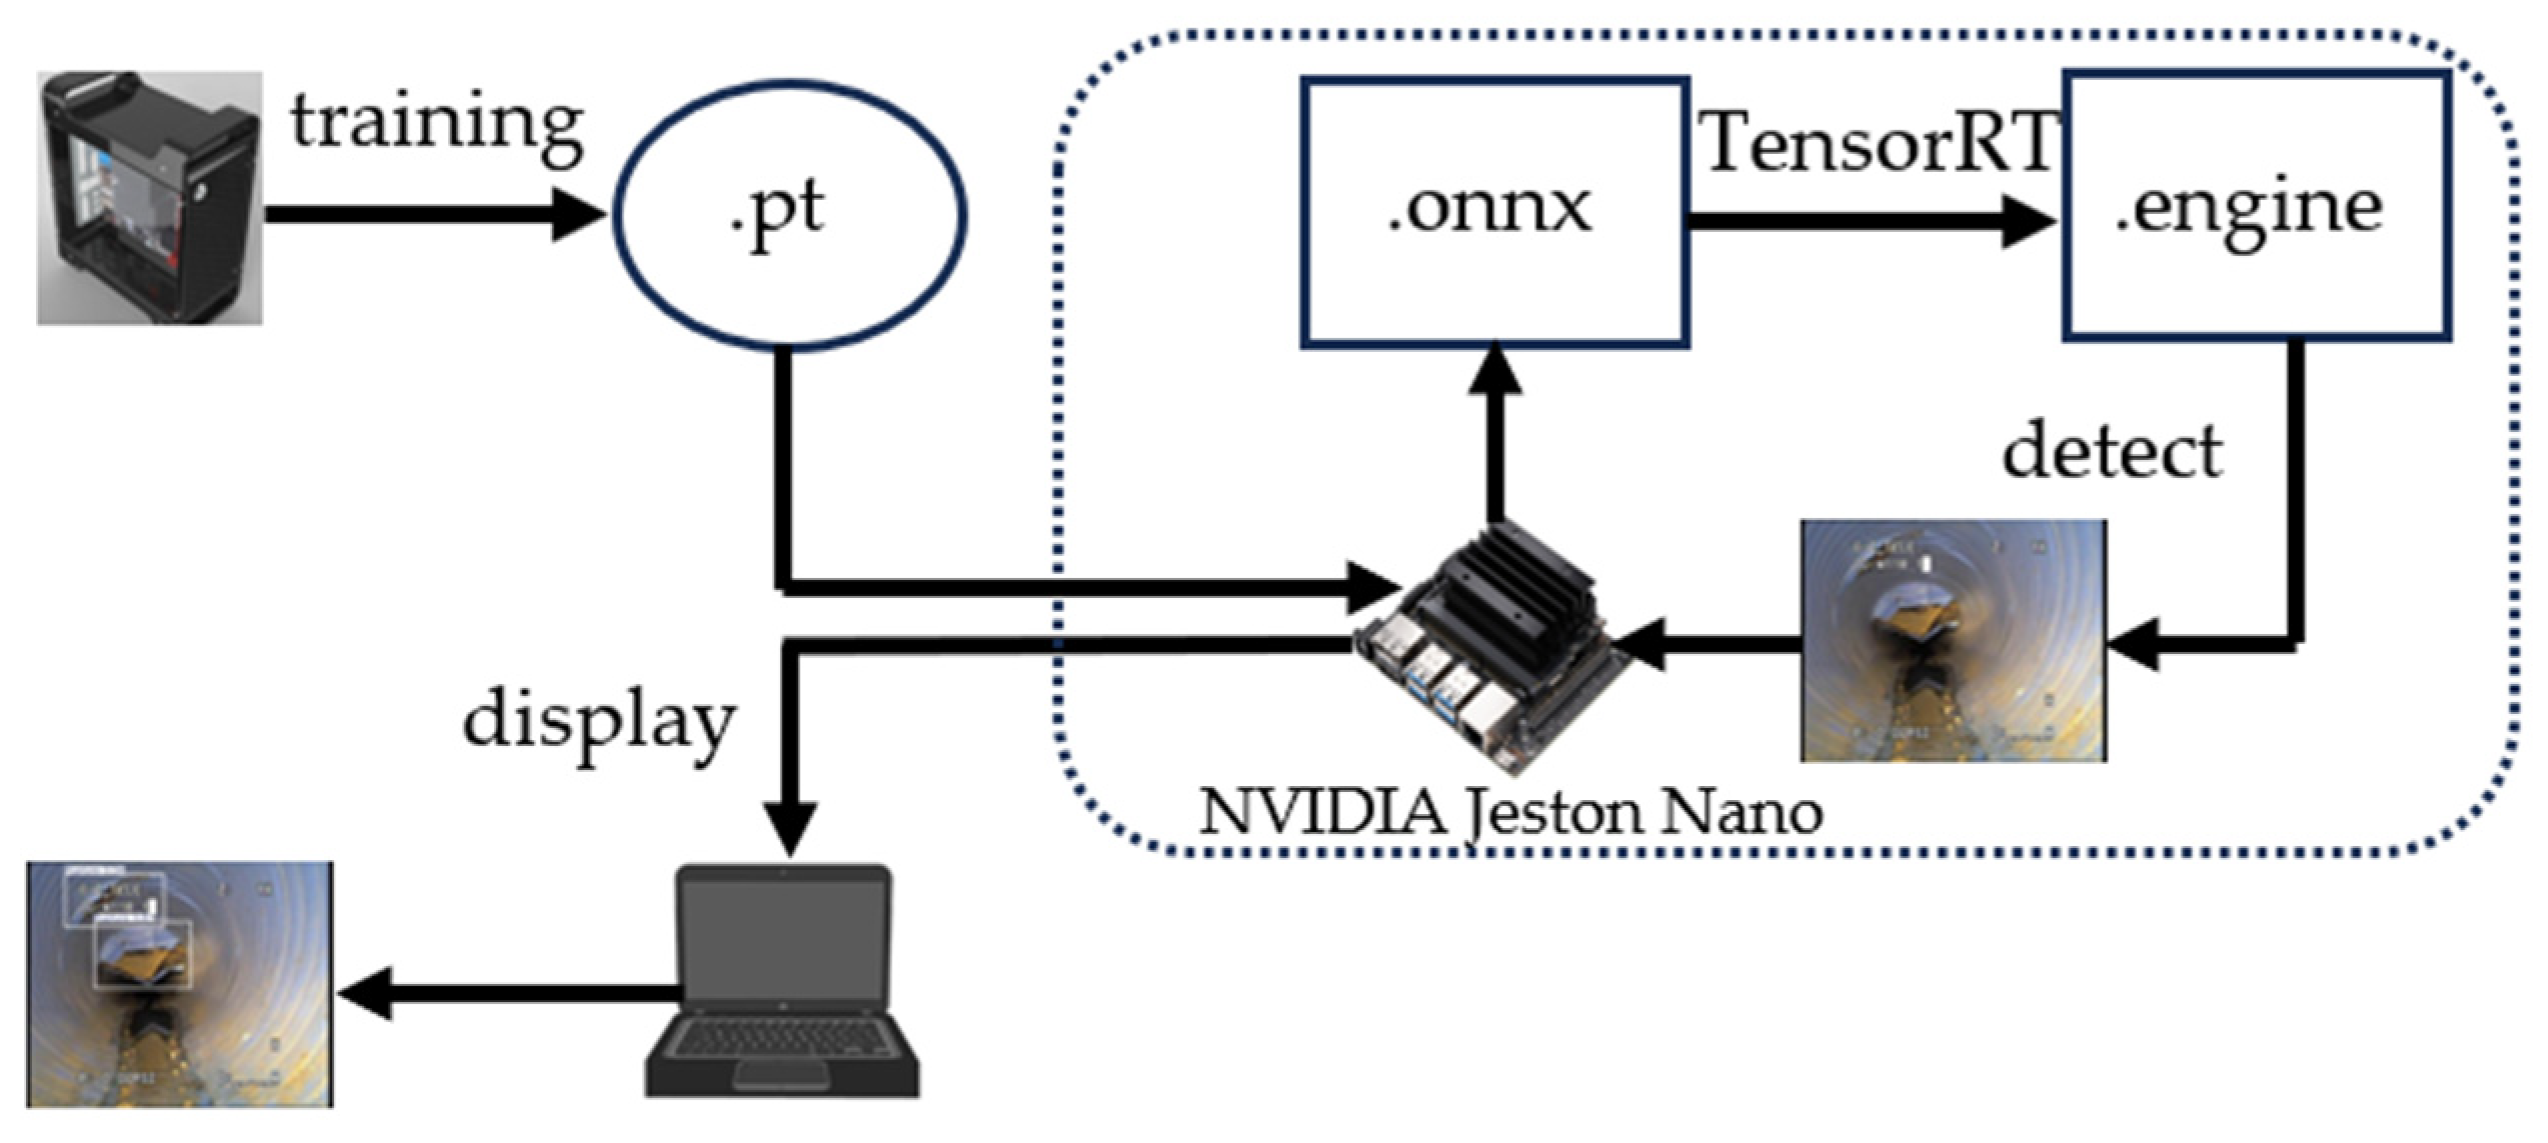
4. PDS-YOLO Model Deployment
5. Conclusions
Author Contributions
Funding
Data Availability Statement
Conflicts of Interest
References
- Hassan, S.I.; Dang, L.M.; Mehmood, I.; Im, S.; Choi, C.; Kang, J.; Park, Y.S.; Moon, H. Underground sewer pipe condition assessment based on convolutional neural networks. Autom. Constr. 2019, 106, 12. [Google Scholar] [CrossRef]
- Rayhana, R.; Jiao, Y.T.; Zaji, A.; Liu, Z. Automated Vision Systems for Condition Assessment of Sewer and Water Pipelines. IEEE Trans. Autom. Sci. Eng. 2021, 18, 1861–1878. [Google Scholar] [CrossRef]
- Ali, H.; Choi, J.H. Risk Prediction of Sinkhole Occurrence for Different Subsurface Soil Profiles due to Leakage from Underground Sewer and Water Pipelines. Sustainability 2020, 12, 310. [Google Scholar] [CrossRef]
- Hawari, A.; Alamin, M.; Alkadour, F.; Elmasry, M.; Zayed, T. Automated defect detection tool for closed circuit television (cctv) inspected sewer pipelines. Autom. Constr. 2018, 89, 99–109. [Google Scholar] [CrossRef]
- Moradi, S.; Zayed, T.; Nasiri, F.; Golkhoo, F. Automated Anomaly Detection and Localization in Sewer Inspection Videos Using Proportional Data Modeling and Deep Learning-Based Text Recognition. J. Infrastruct. Syst. 2020, 26, 12. [Google Scholar] [CrossRef]
- Alejo, D.; Caballero, F.; Merino, L. A Robust Localization System for Inspection Robots in Sewer Networks. Sensors 2019, 19, 4946. [Google Scholar] [CrossRef] [PubMed]
- Guo, C.; Li, C.; Guo, J.; Loy, C.C.; Hou, J.; Kwong, S.; Cong, R. Zero-reference deep curve estimation for low-light image enhancement. In Proceedings of the IEEE/CVF Conference on Computer Vision and Pattern Recognition, Seattle, WA, USA, 14–19 June 2020; pp. 1780–1789. [Google Scholar]
- Halfawy, M.R.; Hengmeechai, J. Automated defect detection in sewer closed circuit television images using histograms of oriented gradients and support vector machine. Autom. Constr. 2014, 38, 1–13. [Google Scholar] [CrossRef]
- Kumar, S.S.; Abraham, D.M.; Jahanshahi, M.R.; Iseley, T.; Starr, J. Automated defect classification in sewer closed circuit television inspections using deep convolutional neural networks. Autom. Constr. 2018, 91, 273–283. [Google Scholar] [CrossRef]
- Farhadi, A.; Redmon, J. Yolov3: An incremental improvement. In Proceedings of the Computer Vision and Pattern Recognition, Salt Lake City, UT, USA, 18–22 June 2018; pp. 1–6. [Google Scholar]
- Wang, C.-Y.; Bochkovskiy, A.; Liao, H.-Y.M. YOLOv7: Trainable bag-of-freebies sets new state-of-the-art for real-time object detectors. In Proceedings of the IEEE/CVF Conference on Computer Vision and Pattern Recognition, Vancouver, BC, Canada, 17–24 June 2023; pp. 7464–7475. [Google Scholar]
- Bochkovskiy, A.; Wang, C.-Y.; Liao, H.-Y.M. Yolov4: Optimal speed and accuracy of object detection. arXiv 2020, arXiv:2004.10934. [Google Scholar]
- Nepal, U.; Eslamiat, H. Comparing YOLOv3, YOLOv4 and YOLOv5 for Autonomous Landing Spot Detection in Faulty UAVs. Sensors 2022, 22, 464. [Google Scholar] [CrossRef]
- Qiu, X.Y.; Chen, Y.J.; Cai, W.H.; Niu, M.Q.; Li, J.Y. LD-YOLOv10: A Lightweight Target Detection Algorithm for Drone Scenarios Based on YOLOv10. Electronics 2024, 13, 3269. [Google Scholar] [CrossRef]
- Liu, W.; Anguelov, D.; Erhan, D.; Szegedy, C.; Reed, S.; Fu, C.-Y.; Berg, A.C. Ssd: Single shot multibox detector. In Proceedings of the Computer Vision–ECCV 2016: 14th European Conference, Amsterdam, The Netherlands, 11–14 October 2016; Proceedings, Part I 14. Springer: Cham, Switzerland, 2016; pp. 21–37. [Google Scholar]
- Tong, Z.; Chen, Y.; Xu, Z.; Yu, R. Wise-IoU: Bounding box regression loss with dynamic focusing mechanism. arXiv 2023, arXiv:2301.10051. [Google Scholar]
- Xiong, C.; Zayed, T.; Abdelkader, E.M.J.C.; Materials, B. A novel YOLOv8-GAM-Wise-IoU model for automated detection of bridge surface cracks. Constr. Build. Mater. 2024, 414, 135025. [Google Scholar] [CrossRef]
- Wan, D.; Lu, R.; Shen, S.; Xu, T.; Lang, X.; Ren, Z.J. Mixed local channel attention for object detection. Eng. Appl. Artif. Intell. 2023, 123, 106442. [Google Scholar] [CrossRef]
- Liu, S.; Qi, L.; Qin, H.; Shi, J.; Jia, J. Path aggregation network for instance segmentation. In Proceedings of the IEEE Conference on Computer Vision and Pattern Recognition, Salt Lake City, UT, USA, 18–23 June 2018; pp. 8759–8768. [Google Scholar]
- Chen, J.; Kao, S.-H.; He, H.; Zhuo, W.; Wen, S.; Lee, C.-H.; Chan, S.-H.G. Run, don’t walk: Chasing higher FLOPS for faster neural networks. In Proceedings of the IEEE/CVF Conference on Computer Vision and Pattern Recognition, Vancouver, BC, Canada, 17–24 June 2023; pp. 12021–12031. [Google Scholar]
- Wang, P.; Chen, P.; Yuan, Y.; Liu, D.; Huang, Z.; Hou, X.; Cottrell, G. Understanding convolution for semantic segmentation. In Proceedings of the 2018 IEEE Winter Conference on Applications of Computer Vision (WACV), Lake Tahoe, NV, USA, 12–15 March 2018; pp. 1451–1460. [Google Scholar]
- Pipeline Defect Dataset [EB/OL]. 2024. Available online: https://www.kaggle.com/datasets/simplexitypipeline/pipeline-defect-dataset (accessed on 12 July 2024).


| Parameters | Configuration |
|---|---|
| CPU | AMD Ryzen 9700X |
| GPU | NVIDIA GeForce RTX 4070 Super |
| System | Windows11 |
| Framework | Pytorch 1.8.1 |
| IDE | VScode |
| Python version | 3.8.19 |
| Optimizer | SGD |
| Initial learning rate | 0.01 |
| Momentum | 0.937 |
| Weight decay | 0.0005 |
| Batch size | 32 |
| Epochs | 200 |
| Model | C2f-PCN | SPDSC | MLCA | Wise-IoU | P/% | R/% | GFLOPs | Parameters/M | mAP@50 (%) | mAP@50:95 (%) |
|---|---|---|---|---|---|---|---|---|---|---|
| Baseline | 80.7 | 75.9 | 8.1 | 3.01 | 80.2 | 57.5 | ||||
| 1 | ✔ | 84.1 | 73.5 | 7.1 | 2.60 | 81.2 | 58.3 | |||
| 2 | ✔ | 83.4 | 76.2 | 8.1 | 3.15 | 82.2 | 61.1 | |||
| 3 | ✔ | 85.7 | 76.2 | 8.1 | 3.01 | 82.2 | 57.9 | |||
| 4 | ✔ | 85.5 | 76.2 | 8.1 | 3.01 | 82.2 | 58.9 | |||
| 5 | ✔ | ✔ | 81.4 | 76.4 | 7.1 | 2.75 | 80.7 | 59.3 | ||
| 6 | ✔ | ✔ | ✔ | 83.7 | 79.1 | 7.1 | 2.75 | 82.1 | 59.6 | |
| 7 | ✔ | ✔ | ✔ | ✔ | 85.5 | 79.9 | 7.1 | 2.75 | 83.6 | 60.1 |
| Model | P/% | R/% | AP@50% | mAP@50 (%) | |||||
|---|---|---|---|---|---|---|---|---|---|
| Deformation | Obstacle | Rupture | Scaling | Misalignment | Deposition | ||||
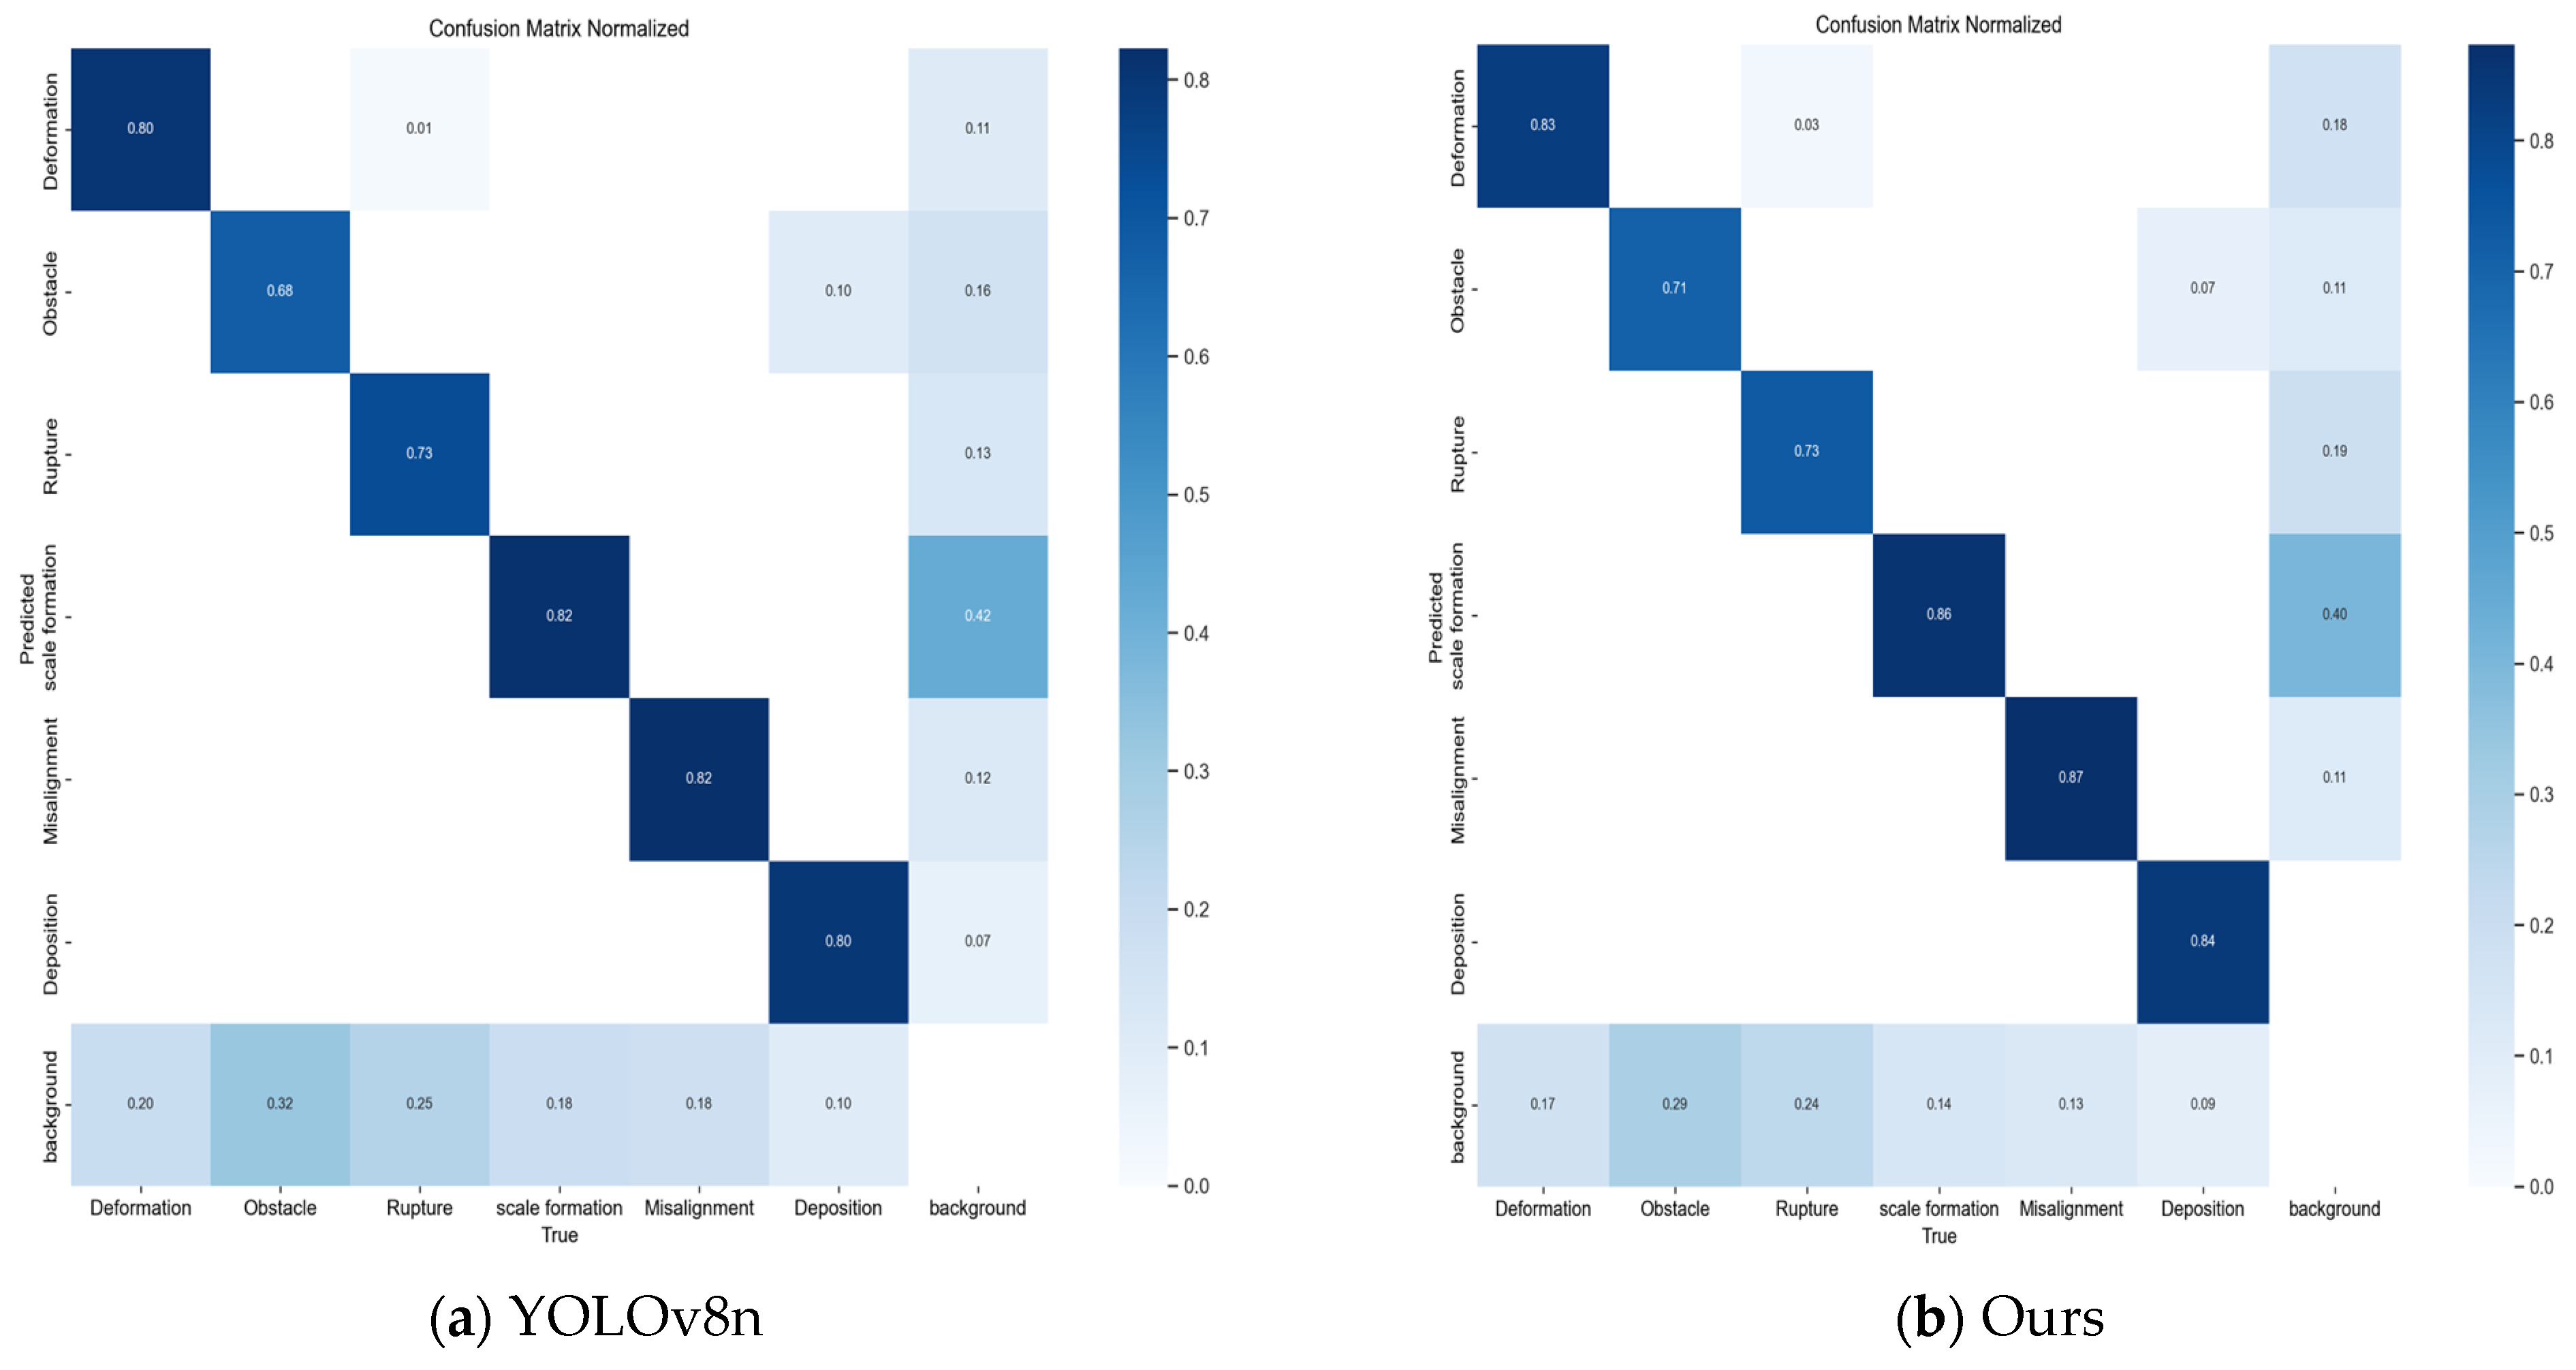
| YOLOv8n | 80.7 | 75.9 | 80.2 | 70.0 | 74.6 | 77.3 | 86.1 | 92.8 | 80.2 |
| Ours | 85.5 | 79.9 | 84.9 | 73.7 | 74.9 | 81.8 | 89.7 | 96.9 | 83.6 |
| Model | P/% | R/% | GFLOPs/G | Parameters/M | mAP@50 (%) | mAP@50:95 (%) | F1-Score (%) | F2-Score (%) |
|---|---|---|---|---|---|---|---|---|
| SSD | 83.9 | 71.6 | 62.7 | 26.2 | 77.1 | 49.8 | 77.2 | 73.8 |
| YOLOv3-tiny | 84.7 | 75.0 | 18.9 | 12.13 | 82.7 | 55.8 | 79.6 | 76.8 |
| YOLOv5n | 81.0 | 76.4 | 7.1 | 2.50 | 82.1 | 54.7 | 78.6 | 77.2 |
| YOLOv6n | 80.0 | 71.0 | 11.8 | 4.23 | 77.5 | 53.5 | 75.2 | 72.6 |
| YOLOv7-tiny | 82.6 | 72.5 | 13.2 | 6.03 | 79.9 | 50.0 | 77.2 | 74.3 |
| YOLOv8n | 80.7 | 75.9 | 8.1 | 3.01 | 80.2 | 57.5 | 78.2 | 76.8 |
| YOLOv9T | 82.4 | 73.9 | 7.6 | 2.00 | 80.4 | 56.1 | 77.9 | 75.4 |
| YOLOv10n | 81.1 | 70.5 | 6.5 | 2.27 | 76.9 | 52.6 | 75.4 | 72.3 |
| Ours | 85.5 | 79.9 | 7.1 | 2.75 | 83.6 | 60.1 | 82.6 | 80.9 |
| Model Format | Processing Platforms | FPS (bs = 1) | mAP (%) |
|---|---|---|---|
| PDS-YOLO.pt | NVIDIA 4070 Super | 190.3 | 83.6 |
| YOLOv8n.pt | NVIDIA Jeston Nano | 4.8 | 80.2 |
| PDS-YOLO.pt | NVIDIA Jeston Nano | 5.4 | 83.6 |
| PDS-YOLO.onnx | NVIDIA Jeston Nano | 1.5 | 83.6 |
| YOLOv8n.engine | NVIDIA Jeston Nano | 16.8 | 80.2 |
| PDS-YOLO.engine | NVIDIA Jeston Nano | 19.3 | 83.6 |
Disclaimer/Publisher’s Note: The statements, opinions and data contained in all publications are solely those of the individual author(s) and contributor(s) and not of MDPI and/or the editor(s). MDPI and/or the editor(s) disclaim responsibility for any injury to people or property resulting from any ideas, methods, instructions or products referred to in the content. |
© 2025 by the authors. Licensee MDPI, Basel, Switzerland. This article is an open access article distributed under the terms and conditions of the Creative Commons Attribution (CC BY) license (https://creativecommons.org/licenses/by/4.0/).
Share and Cite
Zhang, K.; Qin, L.; Zhu, L. PDS-YOLO: A Real-Time Detection Algorithm for Pipeline Defect Detection. Electronics 2025, 14, 208. https://doi.org/10.3390/electronics14010208
Zhang K, Qin L, Zhu L. PDS-YOLO: A Real-Time Detection Algorithm for Pipeline Defect Detection. Electronics. 2025; 14(1):208. https://doi.org/10.3390/electronics14010208
Chicago/Turabian StyleZhang, Ke, Longxiao Qin, and Liming Zhu. 2025. "PDS-YOLO: A Real-Time Detection Algorithm for Pipeline Defect Detection" Electronics 14, no. 1: 208. https://doi.org/10.3390/electronics14010208
APA StyleZhang, K., Qin, L., & Zhu, L. (2025). PDS-YOLO: A Real-Time Detection Algorithm for Pipeline Defect Detection. Electronics, 14(1), 208. https://doi.org/10.3390/electronics14010208