1. Introduction
Spatial perception involves understanding the layout of spaces and the objects within them. This skill relies heavily on accurate distance perception. However, when talking about distance perception, two types of distances can be defined. The first one is called egocentric distance. This type is the distance between an object and an observer. In contrast to this previous definition, exocentric distance is the distance between external objects or points from an observer’s perspective. Accurate perception of distances holds significant importance in everyday activities such as spatial awareness, navigation, and various tasks, ranging from driving to sports. Therefore, estimating distances accurately is crucial for decision-making, while it also enables individuals to navigate obstacles and interact effectively with their real and virtual environments [
1,
2,
3].
As mentioned, within the world of virtual reality (VR), the precise estimation of distances is crucial for creating immersive and realistic experiences. As users navigate virtual environments (VEs), their cognitive ability to estimate both egocentric and exocentric distances significantly influences their interactions and decision-making. Within VR gaming environments [
4,
5], for instance, players must rely on their perceptual skills to understand the distances between objects, obstacles, and enemies. Precise distance estimation allows users to strategize effectively, plan their movements, and immerse themselves fully in the virtual world. Failure to accurately perceive distances can lead to a diminished gameplay experience. Similarly, the ability to estimate distances accurately is crucial in VR-based training simulations [
6,
7,
8,
9]. Users must navigate through simulated environments, perform tasks, and interact with virtual objects or scenarios. Moreover, in educational VR applications [
10,
11,
12], where learners explore VEs to enhance their understanding of complex concepts or historical events, accurate estimation of distances enhances the educational experience. Students can engage with virtual artifacts, explore virtual landscapes, and interact with certain spatial representations.
Nevertheless, a challenge can arise in accurately estimating the distances within VEs, as users typically tend to underestimate these distances [
13,
14,
15]. For example, it is highlighted in [
16] that absolute egocentric distance is generally underestimated in VEs compared to in the real world, but this underestimation can be attenuated by various factors. In doing so, perception can be made more similar to the real world. Therefore, this underestimation phenomenon is influenced by various factors, including the design choices of the VEs, technological aspects, the distances themselves, and individual user characteristics. The visual composition of VEs, comprising textures, graphics, and avatars, can affect distance perception [
17,
18,
19,
20,
21,
22,
23,
24,
25]. Therefore, the realism of VEs is also an important aspect. For example, it was investigated in [
26] whether the misjudgment of distances in head-mounted displays could be due to a lack of realism using a real-world scene rendering system. The evaluation is made by two models: a video-based model and a photo-based model. The judgment performance regarding distances was compared between real and virtual worlds. It was found that when the model was rendered as static and photo-based, the underestimation of distances was less compared to with live video feed rendering. It was reported that the real head-mounted display model averaged 80.2% of the actual distance, the real photo-based model averaged 81.4%, and the real-world estimations averaged 92.4%.
Technological factors such as the display devices (i.e., immersion level) and binocular disparity also impact distance estimation [
27,
28,
29,
30]. Kelly concluded that the perceived distance in VR can be improved by considering the technical characteristics of head-mounted displays [
31]. By increasing their field of view, head-mounted displays can positively impact distance perception in VR. Head-mounted displays with a higher resolution are also associated with more accurate distance perception, and the weight of the head-mounted displays can negatively affect distance perception. Studies in the literature also indicate that distances up to approximately 1 m are usually overestimated, but accurate estimates can occur up to 55 cm [
32,
33,
34,
35].
Additionally, gender, age, and even eye height have been identified as significant factors affecting distance estimation [
36,
37,
38,
39,
40]. According to [
41], gender has an effect in both real and virtual environments, mediated by Mental Rotation ability. This suggests that spatial and perceptual processing in artificial 3D-modeled spaces may not be similar to cognitive spatial processes in real environments. Similarly, in a previous study, we investigated the effects of human characteristics such as gender, height, dominant arm, gaming hours per week, previous VR experience, wearing glasses, and field of study. The results revealed that the latter two factors did not significantly influence the distance estimates or estimation time [
42]. Given the importance of humans in VR-based systems, their characteristics play a vital role in the interaction process [
43]. Cognitive abilities are particularly crucial when navigating virtual spaces [
44] and can even be enhanced through VR experiences [
45]. Understanding these human factors is pivotal to enhancing VR experiences, especially when considering technological advancements [
46,
47]. Developers and designers of VEs or electronic devices (such as display devices) must account for the diverse range of users and their cognitive skills to create accessible experiences.
In this study, we aim to investigate the influence of human factors on the exocentric distance estimation process. While previous research has explored the effects of age, gender, and eye height on egocentric distance estimation [
36,
37,
38,
39,
40,
41], the impact of these factors on exocentric distances remains unclear. To address this gap in the literature, we examined the effects of human characteristics combined with two immersion levels on exocentric distance estimation and how long it takes at various distances within a VE that we specifically developed for this purpose. The mentioned VE can be used with two varieties of display device: a desktop display and the Gear VR head-mounted display. This fact is also important since we also wanted to measure the effects of the display devices themselves. For the study, the following two research questions (RQs) were formed:
RQ1: Do human characteristics and immersion levels affect the probabilities of accurate exocentric distance estimates?
RQ2: Do human characteristics and immersion levels affect the exocentric distance estimation times?
Therefore, the paper is structured as follows.
Section 2 presents the materials and methods. Here, readers can find detailed descriptions of the used VE and the methodologies employed for the data collection and analysis. Following detailing the materials and methods,
Section 3 and
Section 4 present and discuss the results, respectively. Finally, conclusions are made in
Section 5. Here, the goals of the study are revisited, and the main contributions and implications of the research are summarized.
2. Materials and Methods
In this section, details of the study’s methodology, data collection, and analysis are provided.
Section 2.1 shows an overview of the VE used in the research.
Section 2.2 presents the data collection process used in the study. This section details the methodologies, procedures, and tools utilized to gather data within the mentioned VE. Lastly,
Section 2.3 shows the methods regarding the analysis of the collected data.
2.1. Presenting the Virtual Environment
The VE previously mentioned was created using the Unity game development engine. The used version of Unity was 2018.4.36f1. Two various implementations of the VE were developed to cater to different user experiences and platforms. Firstly, a non-immersive version was created for a desktop display, namely an LG 20M37A (LG Corporation, Seoul, Republic of Korea) monitor measuring 19.5 inches. Naturally, this version provides users with a visual representation of the VE on their computer screens. In contrast, an immersive version of the VE was created for the Samsung Gear VR (Samsung Electronics, Suwon, Republic of Korea), which is a head-mounted display device. The Gear VR version runs on the Android operating system, whereas the desktop version (PC version) runs on Windows. The smartphone used with the Gear VR was a Samsung Galaxy Edge 6+ (Samsung Electronics, Suwon, Republic of Korea). While both versions of the VE were nearly identical in terms of their visual aesthetics and content, small differences could be found regarding user interaction. In the PC version, users could control the virtual camera in the VE using a keyboard and mouse. Conversely, the Gear VR version offered more immersive interaction through head rotation and tapping gestures on the touchpad located on the right side of the head-mounted display. This allowed users to interact with the VE using more natural movements, while it also enhanced the sense of immersion and presence within the virtual space.
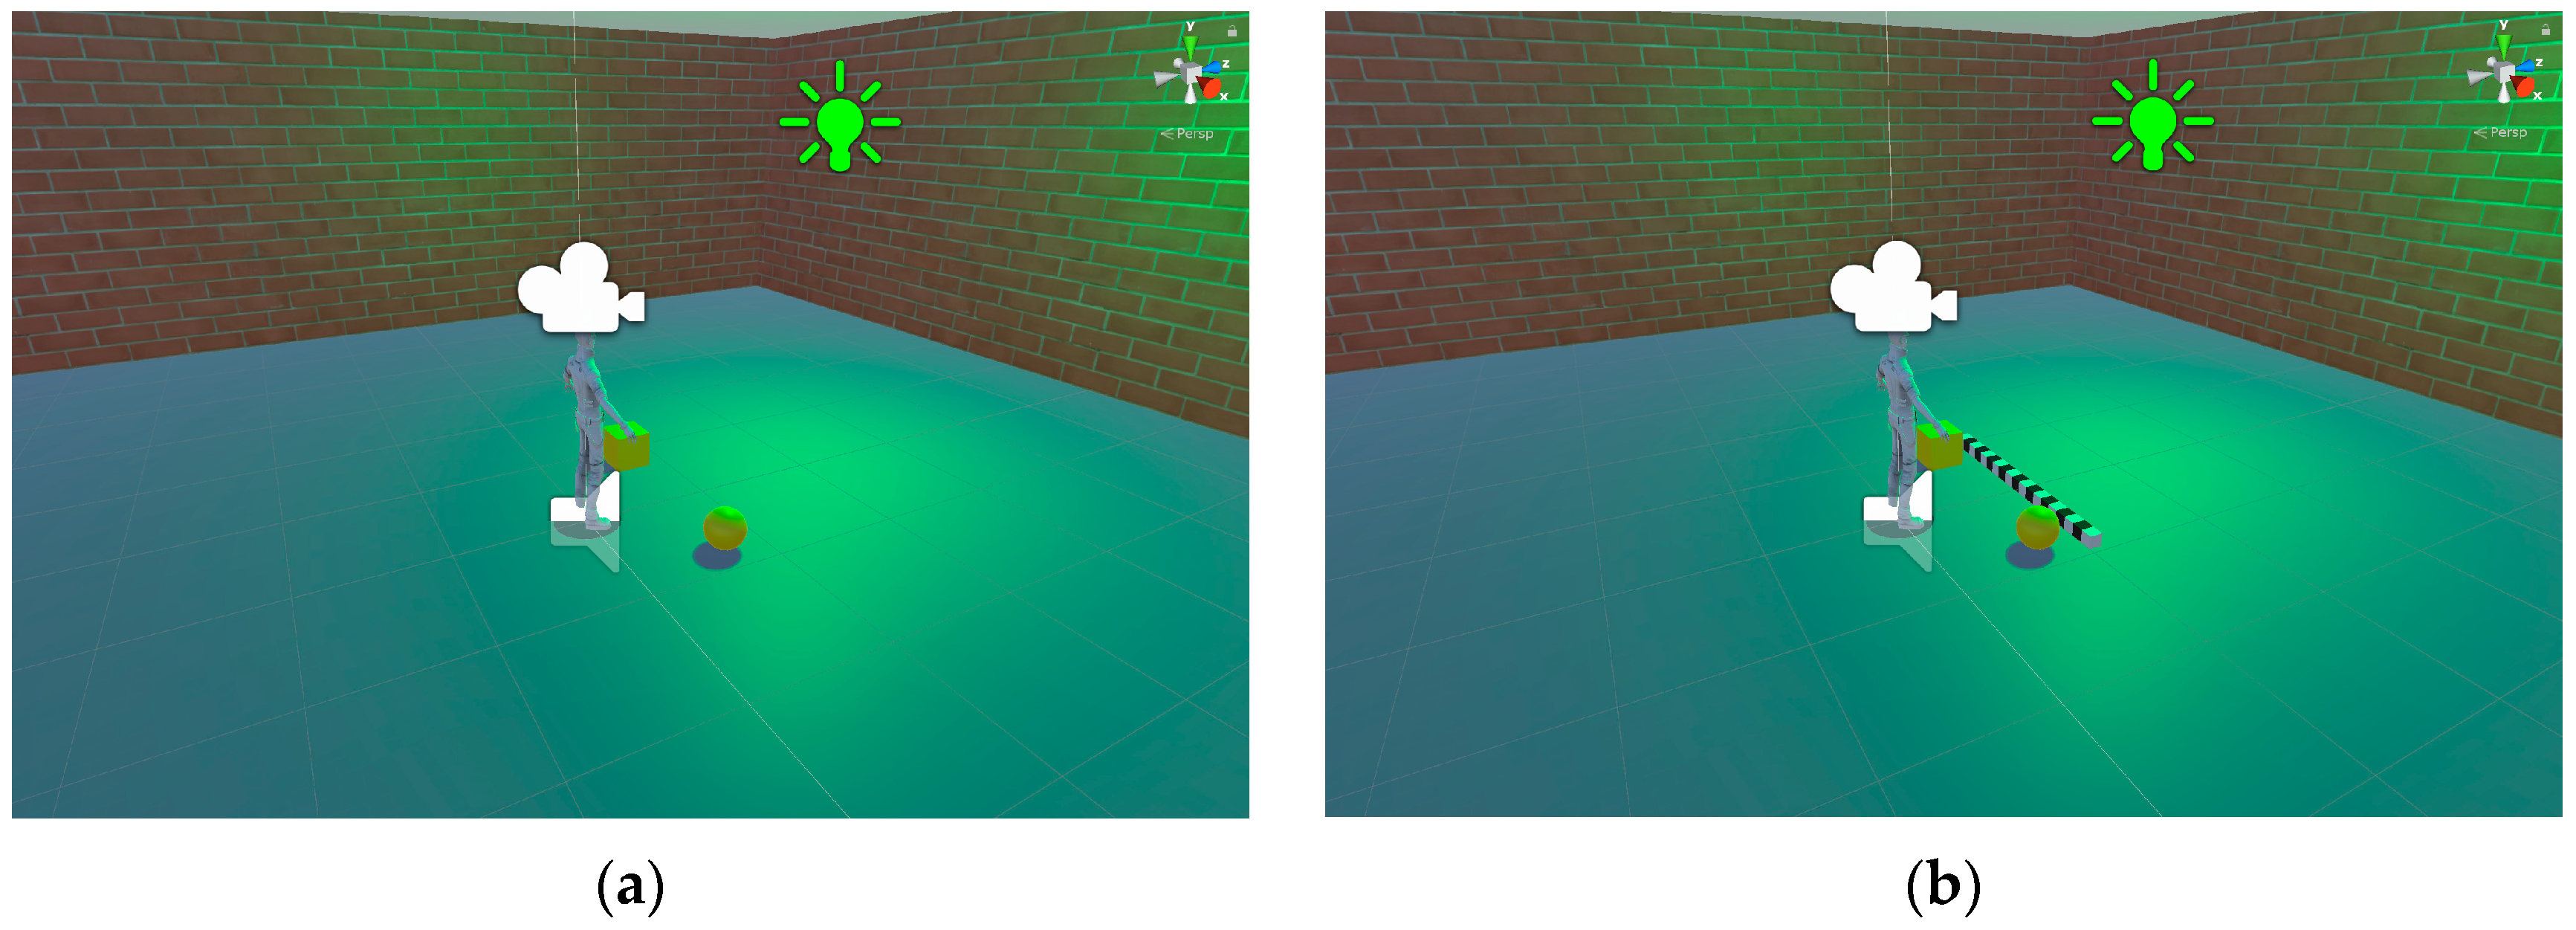
Upon launching the application, participants were placed into the main menu, where they were required to input some personal information that did not reveal their identity. After completing this step, they had to press the start button. Consequently, they were placed in the middle of the virtual space. Notably, the virtual camera within the environment was positioned at the participants’ actual entered height. This further enhanced the realism of their experience in the virtual world. It ensured that the participants’ perspectives within the virtual space closely mirrored their real-world physical attributes, which could result in an easier transition between the virtual and real worlds. In the VE, each wall was 6 m away from the position of the participants; therefore, the room was 12 m wide on each side. Visual representations of the room can be found in
Figure 1.
In
Figure 1, a virtual avatar of a participant can be observed. In front of it, two or three objects are observable on the ground. The exocentric distances between the first two objects (the closest ones to the participant) had to be estimated. Each of these two objects could take the form of a cylinder, a cube, or a sphere, and their types were randomized in every round. Furthermore, the exocentric distances between these objects were also randomized in every round to introduce variability and unpredictability into the experimental conditions. These distances spanned a range of 60 to 150 cm, with intervals of 10 cm between each distance increment. We chose these distances because according to multiple studies, distances up to approximately 1 m are usually overestimated, but accurate estimates can occur up to 55 cm [
32,
33,
34,
35]. While they were egocentric distances in most cases, for comparability reasons, we decided to use a similar methodology for exocentric distances. Naturally, we also wanted to assess a few more distances as well above 1 m.
The farthest object on the ground is a scale that only appears in the second part of the measurements. This means that each exocentric distance had to be estimated twice by the participant: each should be estimated first without the scale on the ground and then each with it but not in the same order. This resulted in a total of 20 rounds for the entire measurement process. The scale comprised 19 cubes. Each cube had a size of .
2.2. Collection of the Data
The data collection process was conducted during the fall of 2022. It took place at two universities, namely the University of Pannonia and the University of Debrecen. At the former university, the Gear VR version was used, whereas at the latter, the desktop display version was used. Those who used the Gear VR version did not use the desktop display version and vice versa. Only one student at a time used the Gear VR head-mounted display, while one group of a maximum of 20 students at a time used the desktop display at a computer laboratory. Overall, the exocentric distance estimation skills of 227 university students were measured using this method. During the measurement process, 72 IT students used the Gear VR (), while the skills of 157 participants were measured with the desktop display (). Among them, the number of civil engineering students was 81 (). Furthermore, 27 were mechanical engineering students (), and 49 were vehicle engineering students (). All the participants voluntarily took part in the measurements and provided verbal consent before the process started. No names were collected, only some non-identifying data were gathered: age; gender; dominant hand; height; whether they wore glasses; field of study; hours of video game play per week; and whether they had any previous VR experience. As mentioned, the participants had to enter these into the corresponding fields in the main menu of the application.
Before commencing the measurements, the participants underwent a briefing session to familiarize themselves with the experimental procedure and the VE. During this briefing, they received detailed instructions on navigation within the virtual space and the process of estimating distances. Furthermore, they were provided with essential information regarding the dimensions of the virtual room and the scale within the environment. This information gave the participants a reference for distance estimation. In the PC version, the distances had to be entered using the keyboard without clicking on the input box. By pressing the numbers on the keyboard, they were written into the input box automatically. In the Gear VR version, the estimates had to be said verbally. Meanwhile, a researcher recorded this information in the same physical room. Subsequently, in each version, the participants had to look up at the ceiling and press Enter on the keyboard or the touchpad on the Gear VR to proceed to the next round. This is the point at which they finalized their estimates and the next round started. Also, the measurement of the estimation times started at this point as well. As was mentioned previously, the measurement process consisted of 20 rounds. The initial 10 rounds were conducted without the presence of the scale inside the VE. Subsequently, the scale appeared on the ground for the remaining 10 rounds. This introduced a contextual cue to aid the participants in their distance estimations. When the participants had completed all 20 rounds, the measurement process concluded for them.
The data for the measurements were recorded into a comma-separated values (CSV) file after completing each round. Each line in the mentioned file represented a round and contained all the relevant factors that were present during the measurement. This would mean that the human characteristics, actual and estimated distances, estimation times, display devices, and so on were logged. Since there were 20 rounds, each participant had 20 lines of data.
2.3. Analysis of Data
After the data collection process was completed, the aforementioned CSV file was imported into the statistical program package R for analysis. The used version was 4.3.2. Prior to the investigative phase, the dataset underwent preprocessing steps. Groups were created based on the height of the participants and their video game playtime per week. For participant height, 11 distinct groups were created, and each spanned a five-centimeter interval that ranged from 150 cm to 204 cm. Similarly, video game playtime per week was empirically categorized into six groups: 0 h; 1–2 h; 3–4 h; 5–10 h; 11–19 h; and 20 or more hours. Similarly, accurate estimates were determined. An estimate was deemed accurate if it fell within ±10% of the actual distance. This binary classification resulted in 1274 accurate estimates and 3306 inaccurate ones.
With the dataset organized and preprocessed, an alpha value of 0.05 was chosen for the analyses. First, the analysis process began with one-by-one examinations of the effects at the mentioned distances. Factors that did not exhibit significant effects on the probability of accurately estimating distances were subsequently excluded from further analyses. The investigation then continued in pairs. Each factor was paired with the investigated display devices. Subsequently, the analysis continued in triplets and concluded in quartets.
For the analyses, three various methods were used in this study. Firstly, logistic regression analysis was used to examine the effects of factors on the probability of accurate exocentric distance estimates. Secondly, when assessing the effects on the estimation times, the linear regression analysis method was used. In the case of both types of regression analysis methods, R automatically chose the basis (intercept) variables. Thirdly, Spearman’s rank correlation method was used to determine the correlation between the estimation time and accurate exocentric distance estimates. These are presented in the following subsubsections.
2.3.1. Logistic Regression
This method is used for modeling the relationship between a binary dependent variable and one or more independent variables. It is specifically designed for binary outcomes, where the dependent variable takes on one of two possible values: usually 0 or 1. The logistic regression model transforms the linear combination of independent variables into a probability between 0 and 1 by using the logistic function (which is a sigmoid function). Logistic regression can be used with a single independent variable or multiple independent variables. As this study focuses on the latter, the logistic regression equation with multiple independent variables can be expressed as in Equation (1):
where:
represents the probability of the dependent variable being 1 given the values of the independent variables ;
are the coefficients or parameters associated with each independent variable;
are the independent variables;
is the base of the natural logarithm.
The logistic regression analysis method estimates the parameters of a logistic model. The latter models the log-odds of a possible event. This can allow us to interpret the variables’ effects and their strengths based on the estimated coefficients. Their sign also reveals the direction of the effects. Moreover, the log-odds can be converted into an odds ratio, which can further be converted into a percentage using Equations (2) and (3).
where the odds ratio and log-odds are denoted by
and
, respectively. Naturally, the greater the log-odds, the greater the odds ratio is, and vice versa. This method was used for each examined exocentric distance separately.
2.3.2. Linear Regression
As stated previously, when assessing the effects on the estimation times, the linear regression analysis method was used. Linear regression provides insights into the relationships between the variables and enables predictions based on the observed data. It models the relationship between a dependent variable and one or more independent variables. It also assumes a linear relationship between the predictors and the response variable. It can be used with a single independent variable or multiple independent variables. As this study focuses on the latter, the linear regression equation with multiple independent variables can be expressed as shown in Equation (4):
where:
is the dependent variable;
are the independent variables;
are their respective coefficients;
and represents the error term for unexplained variability.
2.3.3. Spearman’s Rank Correlation
As was mentioned earlier, Spearman’s rank correlation method was used to determine the correlation between the estimation time and accurate exocentric distance estimates. This correlation method is a non-parametric measure of correlation that assesses the strength and direction of the association between two variables. It is also robust to outliers in the data. Each observation in the data is ranked independently for each variable. These ranks are then used to compute the correlation coefficient, denoted as
. The range of this coefficient is between −1 and 1. Naturally, 1 indicates a perfect positive monotonic relationship, whereas −1 indicates a perfect negative monotonic relationship. Additionally, 0 suggests no relationship between the variables. Spearman’s rank correlation coefficient can be calculated using Equation (5):
where:
3. Results
The results are presented in the following two subsections. The analyses of exocentric distance estimation accuracy are shown in
Section 3.1, whereas those of the exocentric distance estimation times are detailed in
Section 3.2. Consequently,
Appendix A contains the descriptive statistics of the results. They can be found in
Table A1,
Table A2,
Table A3,
Table A4,
Table A5,
Table A6,
Table A7 and
Table A8 as well as
Figure A1,
Figure A2,
Figure A3,
Figure A4,
Figure A5,
Figure A6,
Figure A7 and
Figure A8.
The results of the analyses are presented in the form of 95% confidence intervals (Cis). Due to readability, only significant effects are presented in the following figures, and the basis variables are also removed from them. In the case of logistic regression, the 95% Cis indicate the range of values within which we are 95% confident the true log-odds ratio lies. Similarly, in the case of linear regression, these intervals indicate the range of values within which we are 95% confident that the true population parameters lie. To conserve space, the following abbreviations are observable in the subsequent figures:
3.1. Analysis of the Exocentric Distance Estimation Accuracy
As was mentioned earlier, analyses of the exocentric distance estimation accuracy were conducted. The results of the investigation are presented in this subsection. First, the analysis was undertaken for each factor, then on pairs of factors, and lastly, on triplets of factors. No quartets or quintets (or more) were generated since only three different factors had significant influences on the exocentric distance estimation process.
3.1.1. One-by-One Investigation
The first investigation consisted of each factor, and it was carried out on a one-by-one basis. The results of the analysis are presented in
Figure 2 in the form of 95% Cis. It can be observed that 10 significant effects were yielded.
According to the results presented in
Figure 2, two factors increased the probabilities of accurate estimates. The first one was male gender. On average, males were more likely to accurately estimate distances than females at 60 cm and 70 cm, by 80.35% and 90.65%, respectively. Similarly, compared to those who did not play video games at all, the “GH3-4, 110 cm”, “GH3-4, 120 cm”, and “GH11-19, 140 cm” groups had significant increases in their average likelihood of accurate estimates, of 83.49%, 92.00%, and 70.27%, respectively. On the contrary, however, the Gear VR users were significantly less likely to accurately estimate the distances. Compared to the desktop display, there were significant decreases in likelihood of between 11.86 and 17.08% on average.
3.1.2. Investigation in Pairs
The following step was to investigate the pairs. As was mentioned, only those factors were paired which had significant effects when the one-by-one analyses were conducted. The results of the investigation can be observed in
Figure 3, showing 10 significant effects.
As can be seen in
Figure 3, when the Gear VR was paired with another factor, it resulted in some significant underestimates. Compared to the females who used the desktop display, there were significant decreases in the average likelihood of estimating correctly of between 4.12 and 28.32% in the case of the first four groups in
Figure 3. Then, it can be observed that when being male and video game playtime were paired, these participants were more likely to estimate accurately. This pair of factors was always compared to the pair of being female and zero video game playtime per week. The significant increases in the likelihood were between 38.23% and 439.24% on average. Lastly, it can also be observed that the use of the desktop display and playing 5–10 h of video games per week significantly increased the average likelihood of estimating the exocentric distances accurately at 150 cm, by 83.38%. This latter was compared to the pair of not playing video games and using the desktop display.
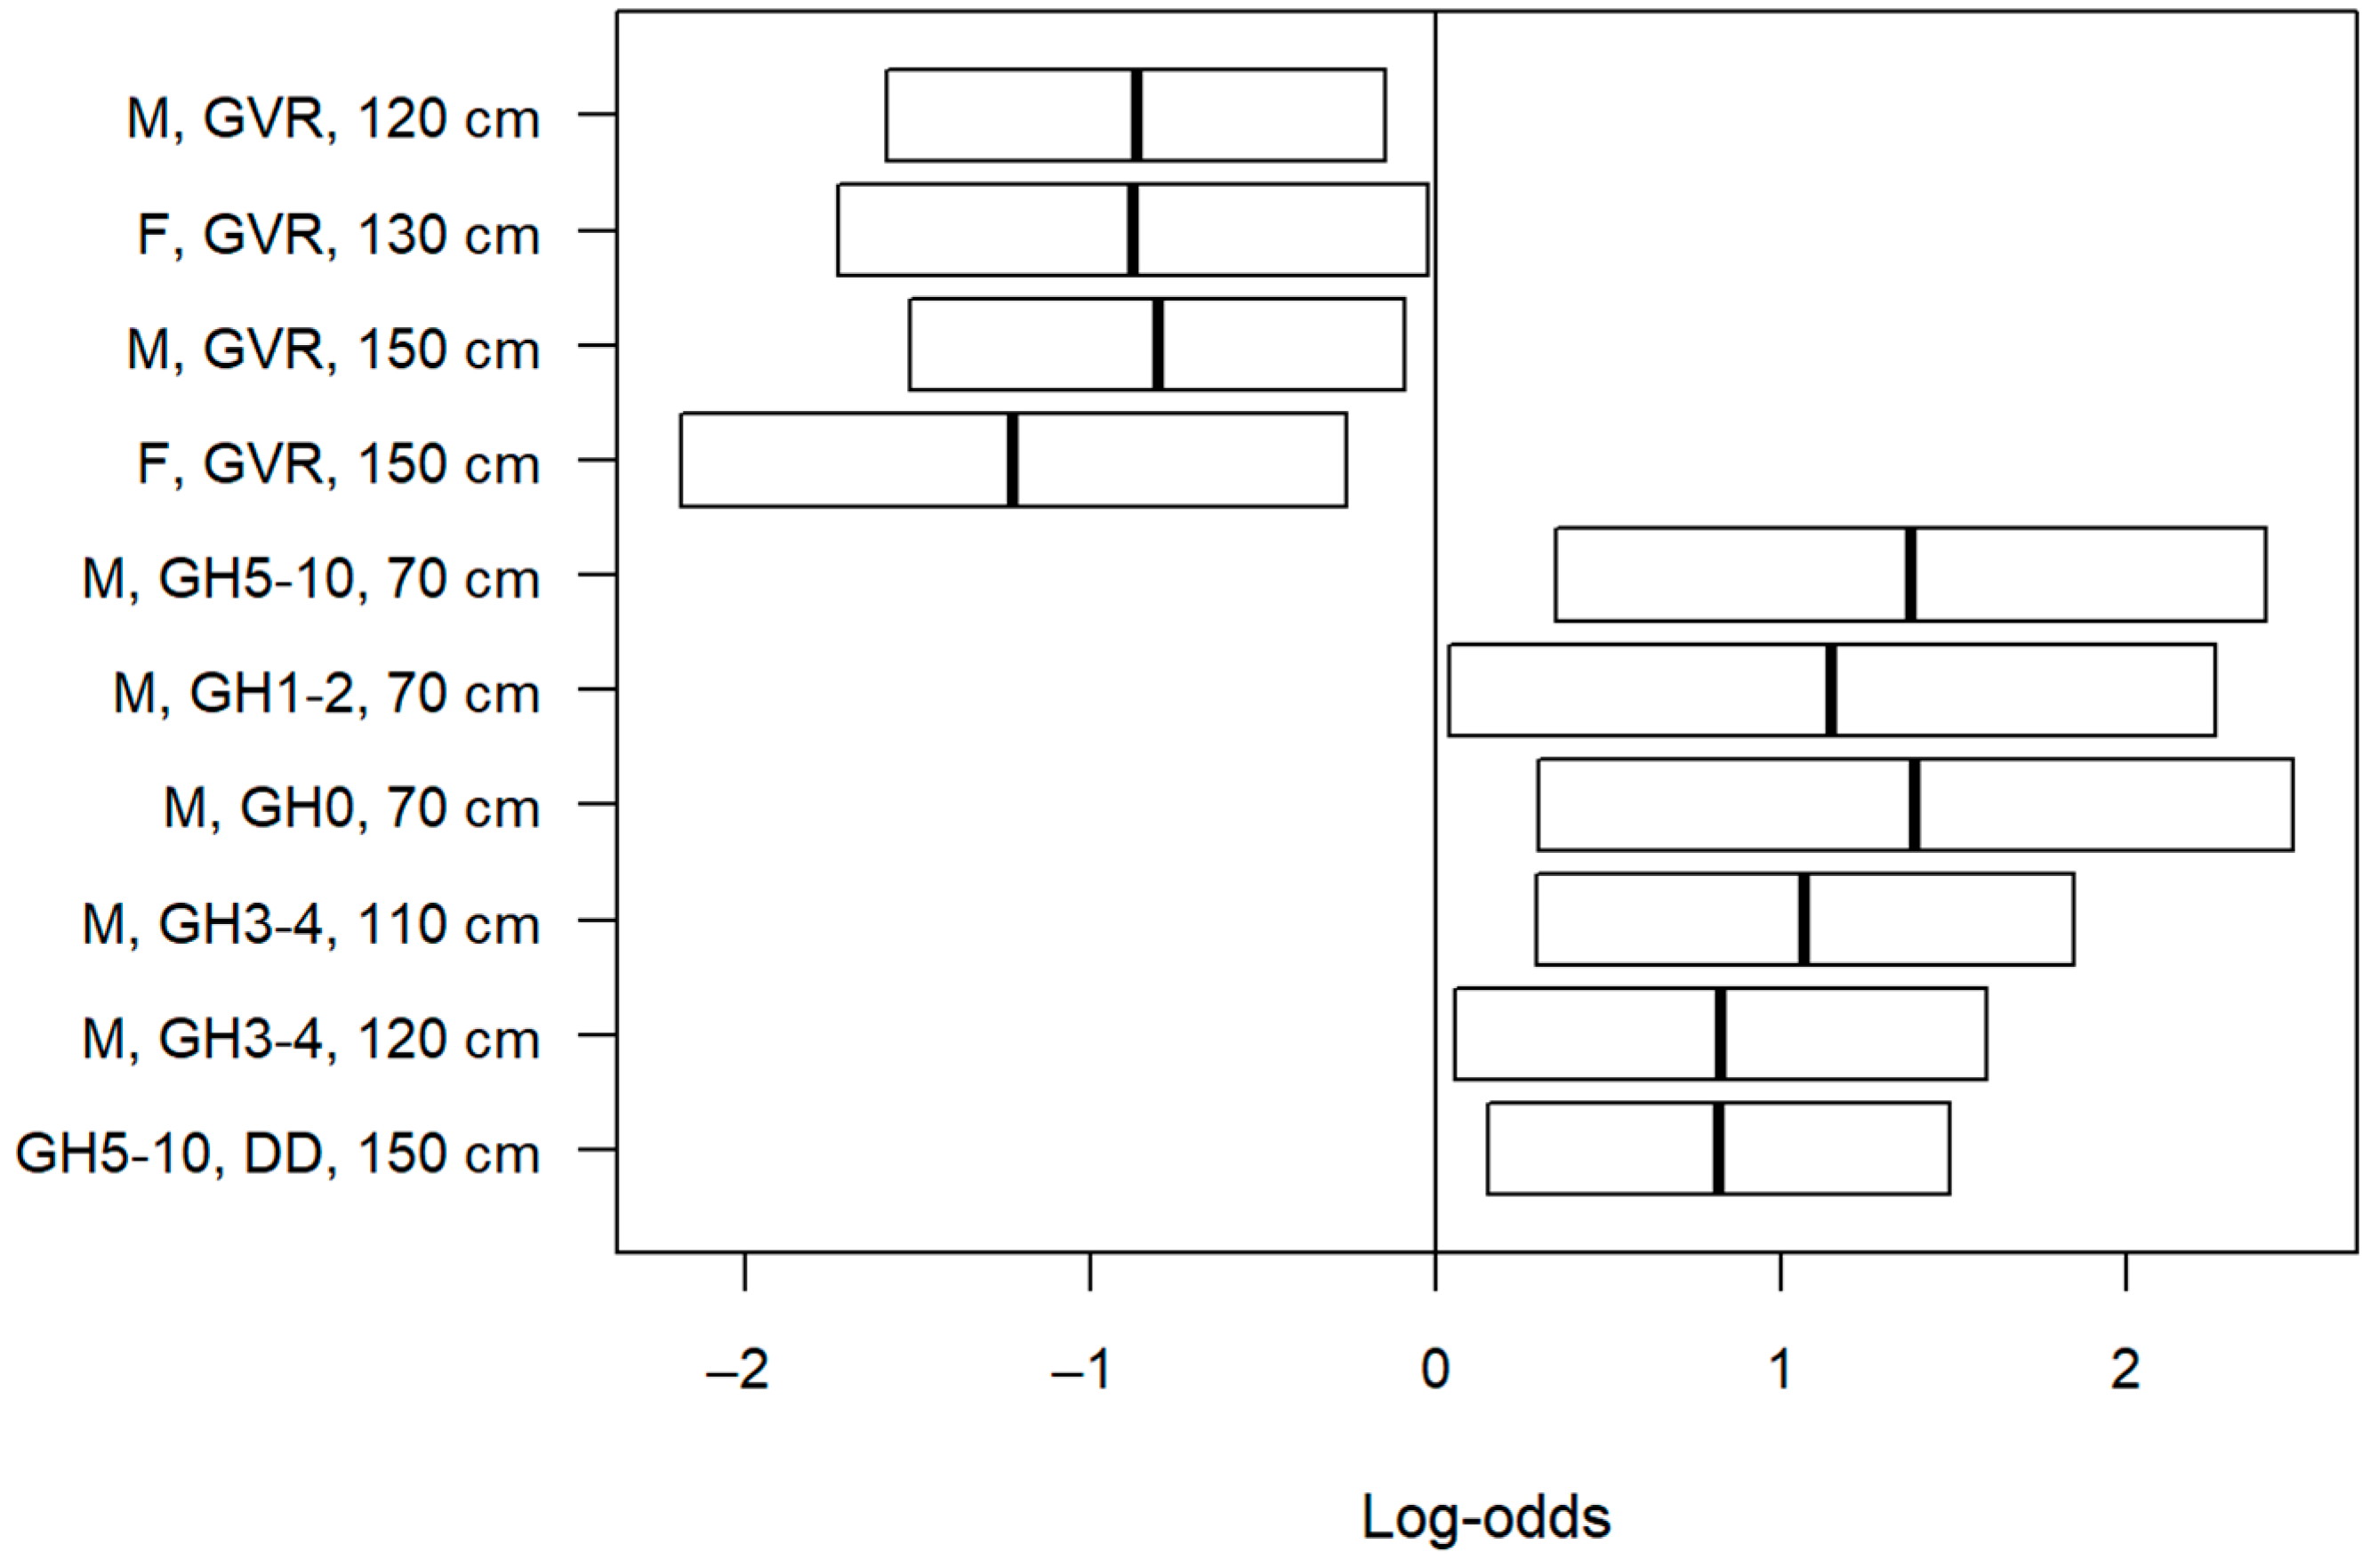
3.1.3. Investigation in Triplets
Lastly, the effects of triplets were investigated on accurate exocentric distance estimates. The results of the investigation are presented in
Figure 4.
As is observable in
Figure 4, there were five significant effects. Out of these five, two triplets were more likely to estimate the exocentric distances accurately. This effect happened at 70 cm. Males who played 5–10 h of video games per week and used the desktop display were more likely to estimate accurately, by 1055.45% on average. Interestingly, the Gear VR also had such an effect when paired with being male and zero video game playtime. The average increase in likelihood was 44.77%. In the case of the remaining three triplets, the participants were less likely to estimate accurately by between 2.37 and 27.60% on average. All of these groups were compared to the basis triplet of females who did not play video games and used the desktop display.
3.2. Analysis of the Exocentric Distance Estimation Time
After the analyses of the accuracy of exocentric distance estimates were completed, the investigation regarding the estimation times commenced. Before investigating the factors themselves, the correlation between accuracy and estimation times was assessed. First, correlation analysis was conducted on the whole dataset. While the results were significant, no correlation could be observed between the two examined variables, . Afterward, the correlation between the two was examined for the PC version. Although the results were similarly significant, no correlation could be found either, . Lastly, the correlation was assessed for the Gear VR version. Here, no significant correlation could be found between the two examined variables, .
Similarly to the previous section, the effects on the estimation time are presented in this one. Here, however, significant effects could be observed up to quartets of factors. Therefore, the results of the analyses are presented in the following four subsubsections, starting with the one-by-one analyses and ending with the examination of the quartets.
3.2.1. One-by-One Investigation
Starting with the one-by-one investigation, the effects of each factor were analyzed on the exocentric distance estimation time. The results of the investigation can be observed in
Figure 5. According to the results, 14 significant effects could be found in the dataset.
The results in
Figure 5 show that by using the Gear VR, the exocentric distance estimation times became significantly faster, except for at 60 cm. In that case, the estimation times were significantly slower. Naturally, the Gear VR was compared to the desktop display. Regarding the other factors, right-handed users were significantly slower at 60 cm, while they were significantly faster at 100 cm. Height and video game playtime per week also caused a significant increase in the estimation times at 60 cm and 100 cm, respectively.
3.2.2. Investigation in Pairs
After the one-by-one analyses were completed, the investigation of pairs started. The results of the examination are presented in
Figure 6. According to the results, 76 significant effects occurred in the dataset.
As can be seen in
Figure 6, most of the pairs of factors significantly decreased the exocentric distance estimation times. With the exception of the display device, no pattern was found regarding which pair increased them or not. In the case of the display device, however, the effect of the Gear VR was so strong that it significantly decreased the estimation times in almost all combinations. The only exception was when it was paired with right-handed users and the exocentric distance was 60 cm.
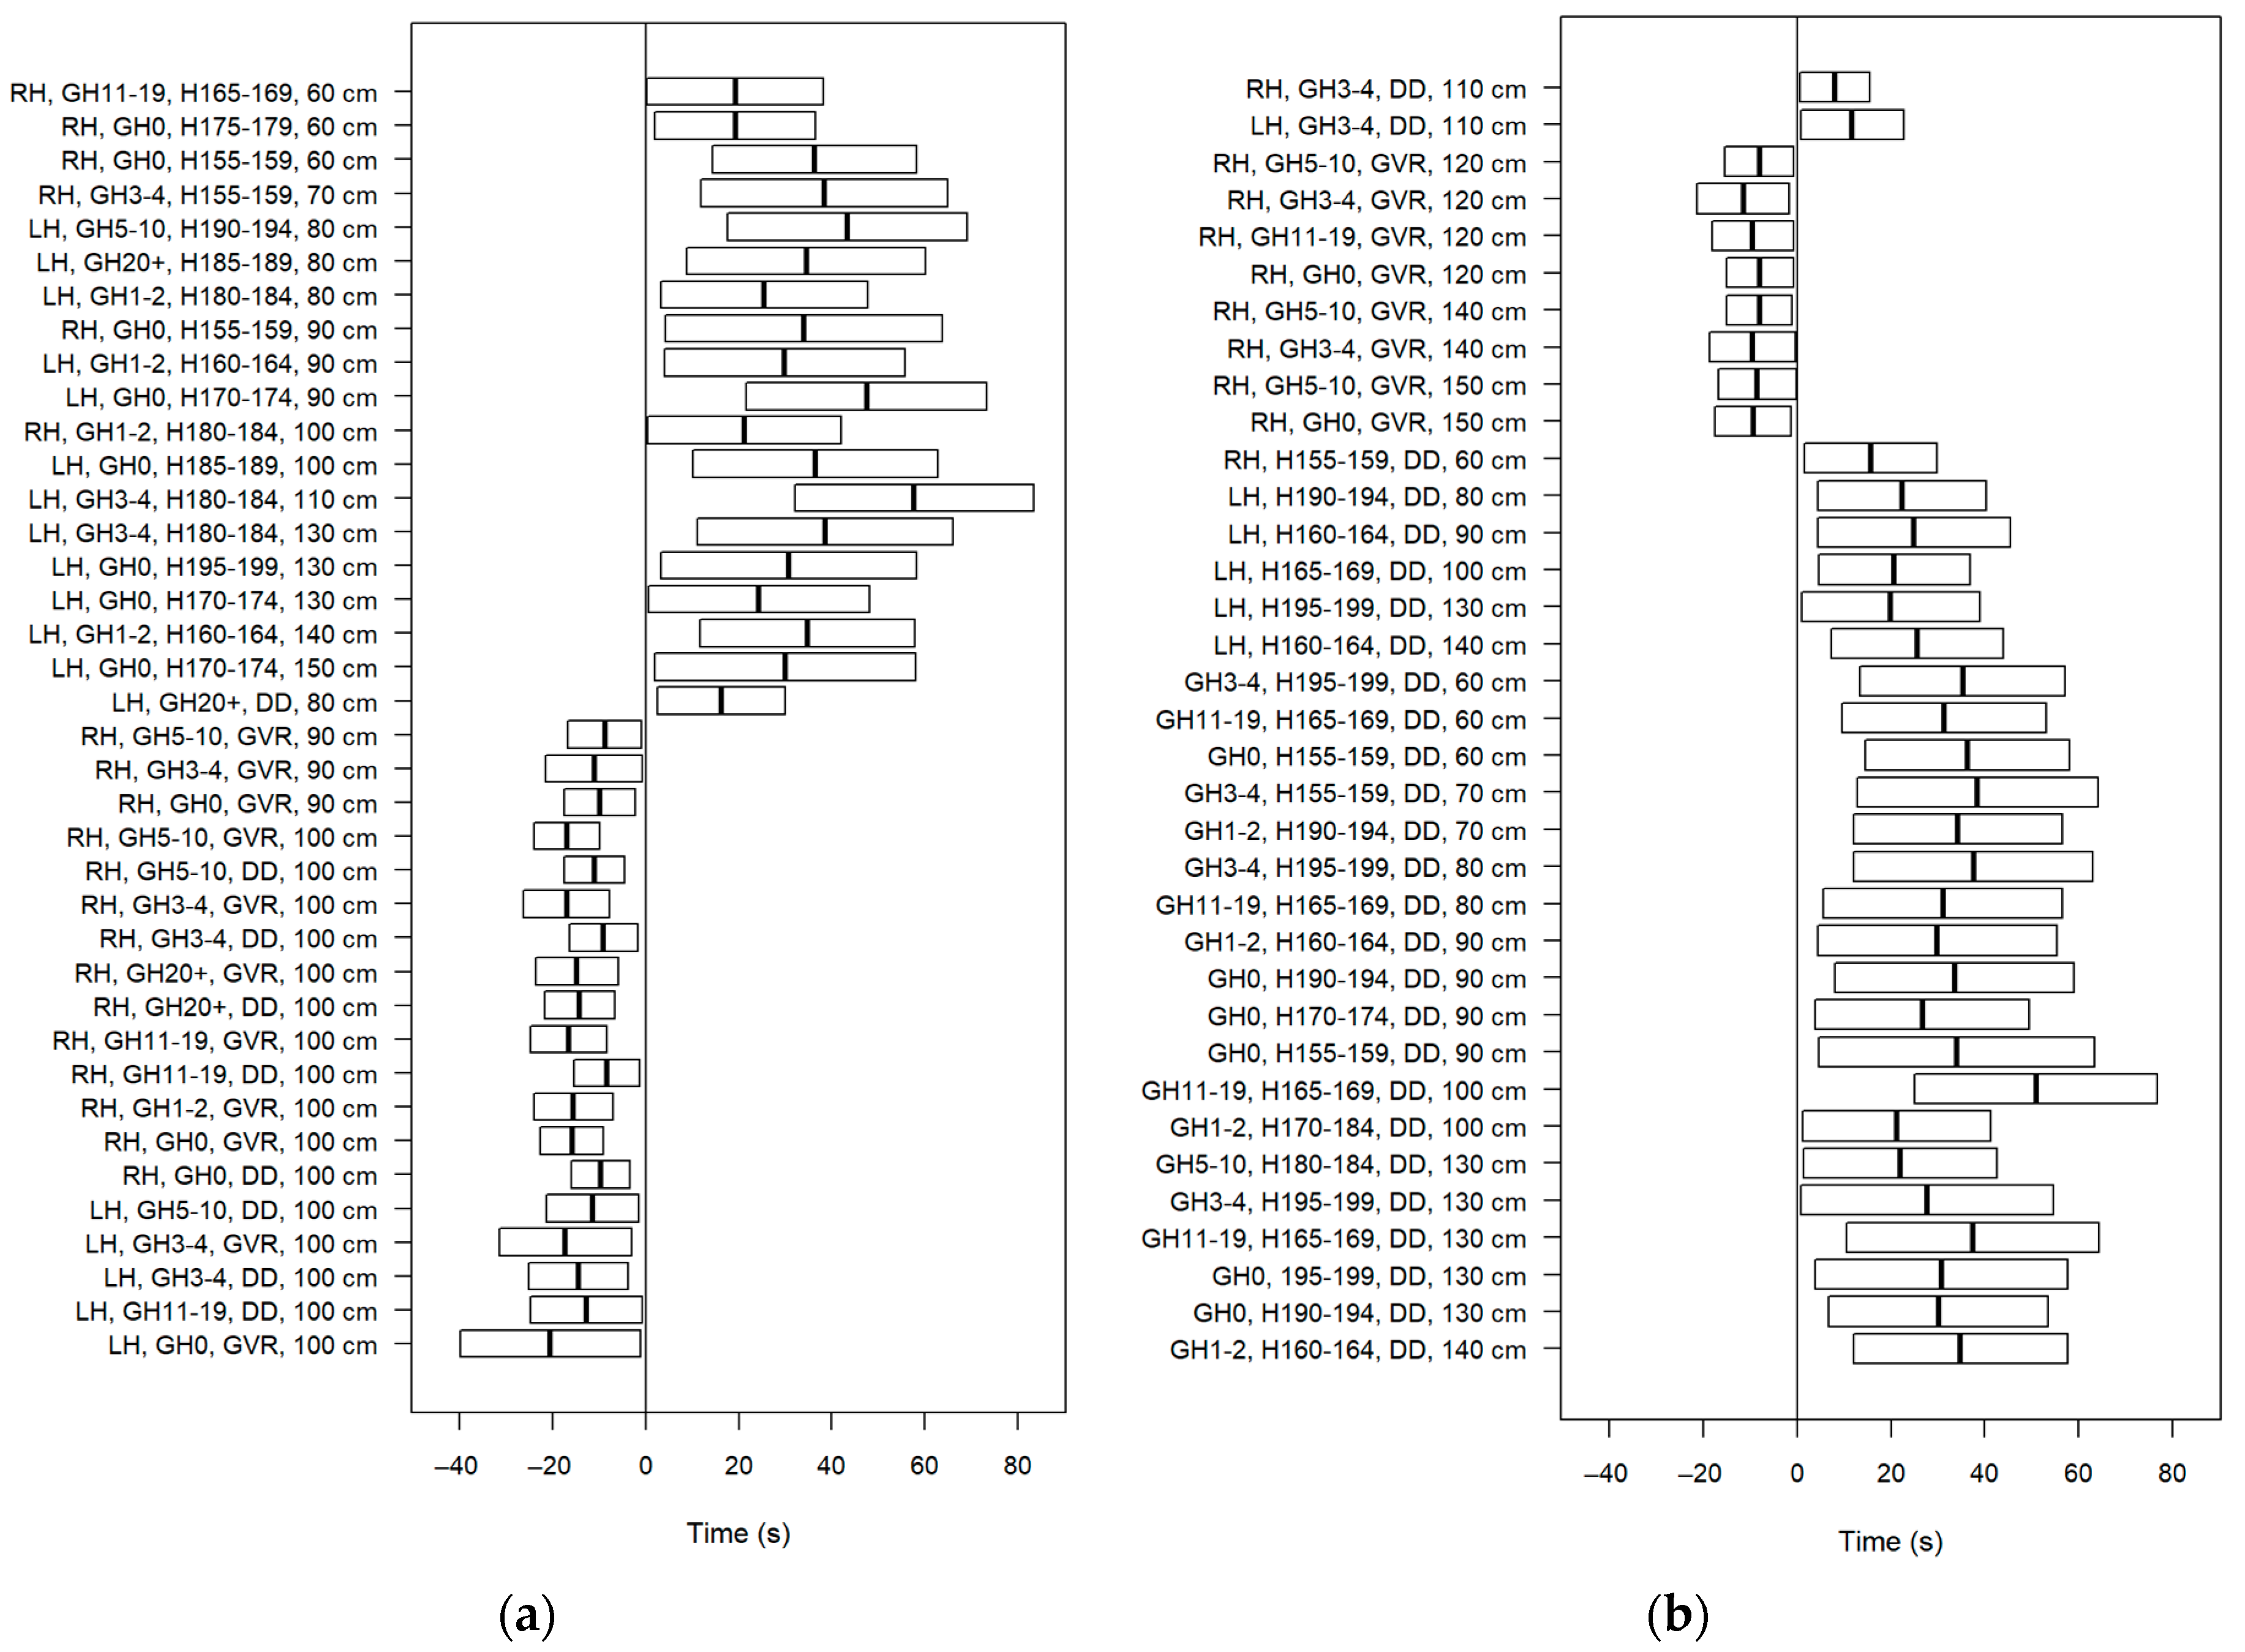
3.2.3. Investigation in Triplets
The investigation continued with the triplet of factors. The results of the investigation are presented in
Figure 7. In this case, 73 significant effects could be observed.
Similarly, no pattern was found among the significant triplets when combinations of dominant hand, video game playtime per week, and height were assessed. However, it can be observed that these triplets did not contain the display devices. Therefore, without the display devices, these factors mostly presented significant increases in the exocentric estimation times. However, when the display devices were included, the following observations could be made: in each significant case, the use of the Gear VR significantly decreased the estimation times, whereas the desktop display significantly increased them in most cases.
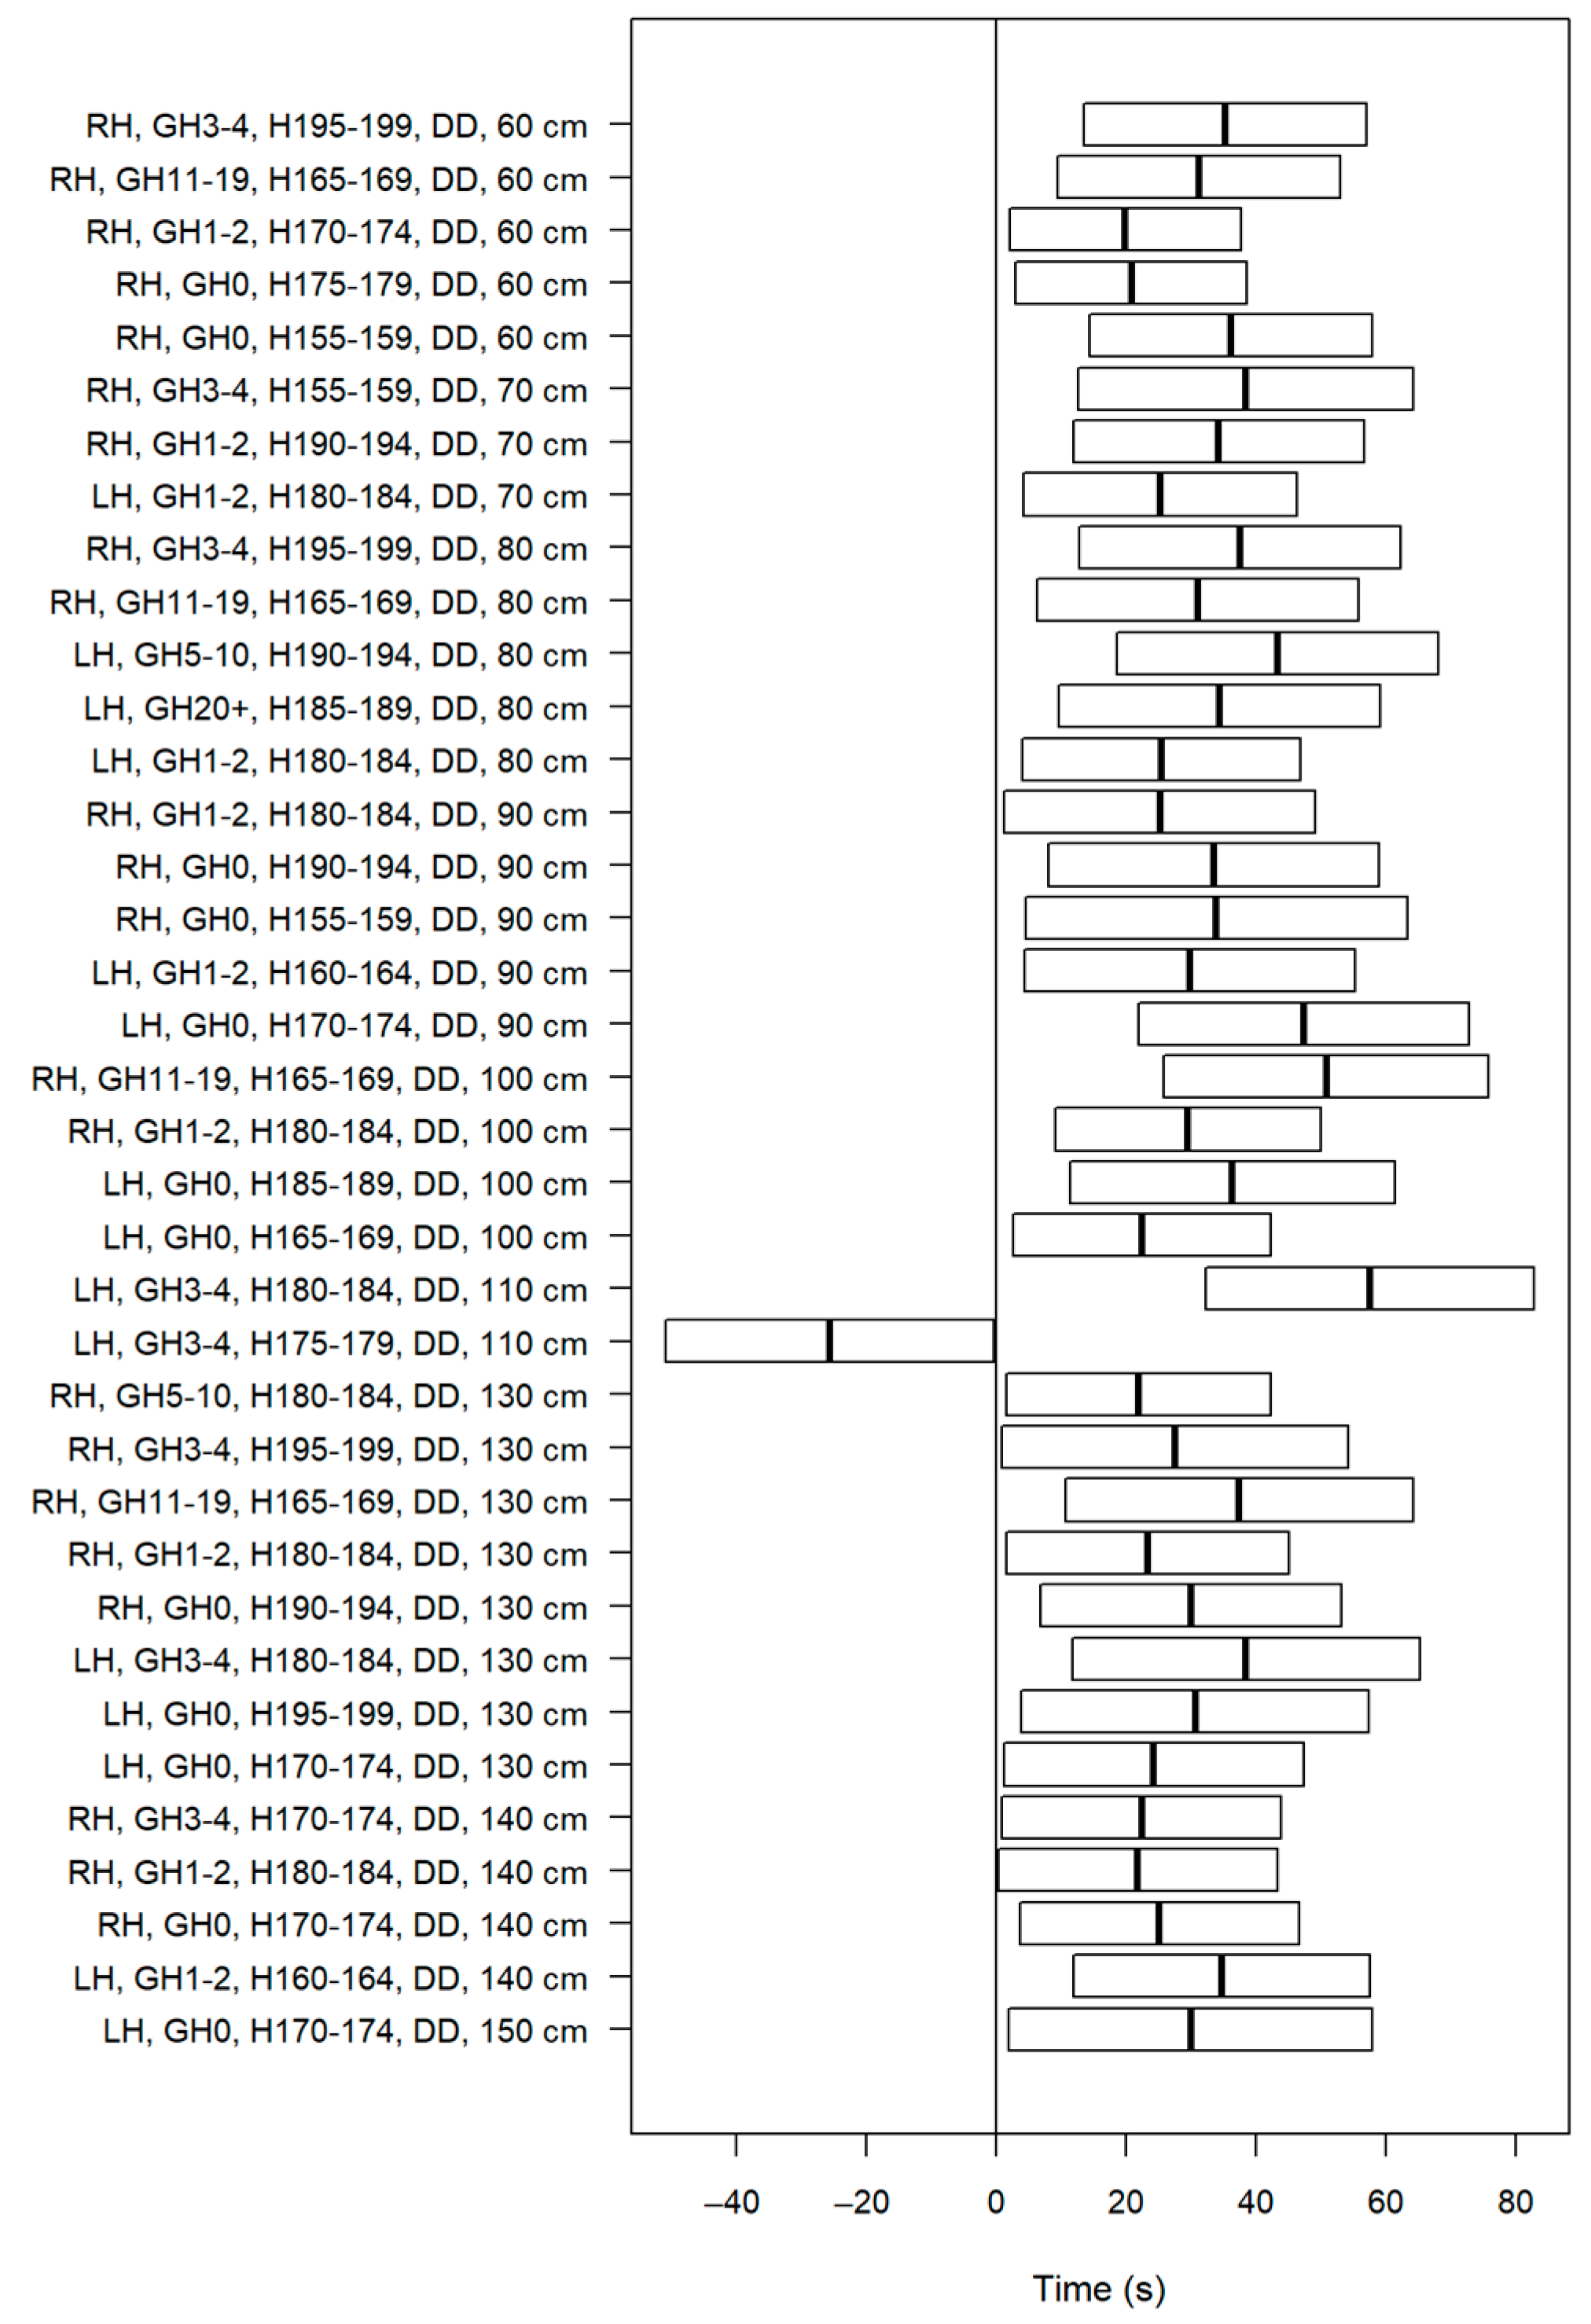
3.2.4. Investigation in Quartets
The last step of the analysis was to conclude it with the examination of quartets of factors. As before, all possible combinations were assessed. The results of the investigation can be found in
Figure 8. Here, 37 significant effects could be observed.
When all the factors were assessed, the basis quartet was the combination of left-handed participants who played zero hours per week, whose height was between 150–154 cm, and who used the desktop display. The results show that in almost all cases, the use of the desktop display significantly increased the exocentric distance estimation times, except for one combination. Here, the significant decreases related to the Gear VR factor disappeared.
4. Discussion
According to the findings, the two research questions were answered. Both human characteristics and immersion levels have significant effects on exocentric distance estimates and estimation time. Regarding the literature, most studies have examined the egocentric distance estimation process. In them, however, gender and display devices had some significant effects. Our results show that the effects were different in the case of exocentric distances. Regarding the probability of accurate estimates, gender, video game playtime per week, and display devices had significant effects. However, regarding the estimation times, dominant hand, video game playtime per week, height, and display devices had significant effects. Therefore, different factors can have significant effects on accuracy and time.
One notable finding is the interaction between the human characteristics and the type of display device used. The users of the Gear VR head-mounted display estimated the exocentric distances differently compared to those who used the desktop display: the Gear VR users were less likely to accurately estimate distances but were faster in their estimations compared to the desktop display users. This suggests that the choice of display device can impact the perception of exocentric distances in VEs. This fact has implications for the design and implementation of VR systems.
Understanding exocentric distance estimation in VEs is crucial since VR technologies are becoming integrated into various aspects of daily life, from entertainment and education to healthcare and training simulations. By ensuring that users can accurately perceive distances, immersive VR experiences could be created in the future. Therefore, these findings are important for VR developers and designers since they can help them to optimize the user experience. By understanding the factors, developers can customize VEs for users with different characteristics and preferences. This could enhance user satisfaction and the usability of the VEs.
Naturally, this study had several limitations that could be addressed in future research. The first was the limited sample size. Increasing the number of participants with certain characteristics could be helpful, such as left-handed individuals, since there were five of them who used the Gear VR. Consequently, the accuracy of the results could be increased as well.
The second limitation was due to the technological constraints. The use of the Gear VR head-mounted display limited the study since it only allows head rotational movement. Future research could involve porting the VR experience and interaction to PCs and using newer head-mounted displays to provide more comprehensive and accurate results.
The investigated distances were the third limitation. The study focused on exocentric distances between 60 cm and 150 cm at 10 cm intervals. To gain a better understanding, it would be beneficial to investigate both smaller and larger distances. Given the observed likelihood with the Gear VR at smaller distances, it would be particularly interesting to explore this possible phenomenon at even smaller distances.
Future research directions could include exploring the effects of the compositional elements in the VE, such as textures, lighting, and object size. In addition to examining the effects of compositional elements, conducting analyses based on the availability of a scale within the virtual room presents another possible avenue of future investigation. By comparing the distance estimation performance in scenarios with and without a scale, it could be possible to assess the extent to which the presence of a scale influences the estimation accuracy and estimation time. By addressing these limitations and exploring these mentioned future research directions, the results could be expanded upon.
5. Conclusions
During this study, we assessed certain effects on the exocentric distance estimation process. For this goal, a VE was developed to assess the effects of the immersion level and human characteristics on the mentioned process. Regarding the immersion level, the measurements were taken using either the Gear VR head-mounted display or a desktop display. A total of 72 students used the former, while 157 used the latter. The logged human characteristics were the following: age; gender; dominant hand; height; whether the participants wore glasses; their field of study; how many hours of video game they played per week; and whether they had any previous VR experience. To understand the effects of these factors, logistic regression and linear regression analysis methods were used.
The results indicate that when human factors are combined with display devices at various immersion levels, significant effects can be observed. This occurred when the probabilities of accurate exocentric distance estimates as well as the estimation times were investigated. For the former, gender, video game playtime per week, height, and the display devices had significant effects, whereas for the latter, dominant hand, video game playtime per week, height, and the display devices had an influence. Patterns could only be found in the case of the display device. The users of the Gear VR were less likely to estimate the exocentric distances accurately, while they were significantly faster than those using the desktop display.
In summary, the combination of human factors and immersion level has significant effects on exocentric distance estimation. As both are integral components of VR systems, they have the potential to interact with each other. These findings could provide valuable insights for developers in the design and implementation of new VEs. Consequently, by understanding the effects of human factors and the immersion level, developers can refine the design and implementation of VEs to create more accessible, engaging, and immersive experiences for users. Whether in gaming, education, or training simulations, optimizing the distance estimation accuracy contributes to the overall effectiveness and usability of VR systems.
Author Contributions
Conceptualization, T.G.; methodology, T.G., J.S. and E.P.; software, T.G.; validation, T.G., J.S. and E.P.; formal analysis, T.G.; investigation, T.G.; resources, T.G. and E.P.; data curation, T.G., J.S. and E.P.; writing—original draft preparation, T.G., J.S. and E.P.; writing—review and editing, T.G.; visualization, T.G.; supervision, T.G.; project administration, T.G. All authors have read and agreed to the published version of the manuscript.
Funding
This research received no external funding.
Institutional Review Board Statement
All the subjects gave their informed consent to be included before they participated in the study. Ethics approval was not required for this type of study. The study was granted exemption by the Institutional Review Board (or Ethics Committee) of the University of Pannonia.
Informed Consent Statement
Informed consent was obtained from all the subjects involved in the study.
Data Availability Statement
The data presented in this study are available on request from the corresponding author.
Acknowledgments
This research was supported by the ÚNKP-23-4 New National Excellence Programme of the Ministry for Culture and Innovation’s National Research, Development and Innovation Fund. This work was implemented as part of the TKP2021-NVA-10 project, with support provided by the National Research, Development and Innovation Fund of the Ministry of Culture and Innovation of Hungary, financed under the 2021 Thematic Excellence Programme funding scheme.
Conflicts of Interest
The authors declare no conflicts of interest.
Abbreviations
| Abbreviations used in the study (in alphabetical order): |
| CI | confidence interval |
| CSV | comma-separated values |
| DD | desktop display |
| F | female |
| GHn-m | hours |
| GVR | Gear VR |
| Hx-y | cm |
| IT | information technology |
| LH | left-handed |
| M | male |
| RH | right-handed |
| RQ | research question |
| VE | virtual environment |
| VR | virtual reality |
| Notations used in the study (in alphabetical order): |
| log-odds |
| mean value of age |
| odds ratio |
| standard deviation of age |
Appendix A
Table A1.
The average rates and standard deviations of accurate distance estimates, grouped by gender.
Table A1.
The average rates and standard deviations of accurate distance estimates, grouped by gender.
| Factor | 60 cm | 70 cm | 80 cm | 90 cm | 100 cm | 110 cm | 120 cm | 130 cm | 140 cm | 150 cm |
|---|
| Male | M = 0.16
SD = 0.37 | M = 0.18
SD = 0.39 | M = 0.19
SD = 0.39 | M = 0.14
SD = 0.35 | M = 0.36
SD = 0.48 | M = 0.41
SD = 0.49 | M = 0.37
SD = 0.48 | M = 0.32
SD = 0.47 | M = 0.37
SD = 0.48 | M = 0.36
SD = 0.48 |
| Female | M = 0.08
SD = 0.28 | M = 0.08
SD = 0.28 | M = 0.13
SD = 0.34 | M = 0.07
SD = 0.26 | M = 0.30
SD = 0.46 | M = 0.33
SD = 0.47 | M = 0.37
SD = 0.48 | M = 0.34
SD = 0.47 | M = 0.30
SD = 0.46 | M = 0.27
SD = 0.45 |
Table A2.
The average rates and standard deviations of accurate distance estimates, grouped by dominant hand.
Table A2.
The average rates and standard deviations of accurate distance estimates, grouped by dominant hand.
| Factor | 60 cm | 70 cm | 80 cm | 90 cm | 100 cm | 110 cm | 120 cm | 130 cm | 140 cm | 150 cm |
|---|
| Left-handed | M = 0.16
SD = 0.37 | M = 0.12
SD = 0.33 | M = 0.20
SD = 0.40 | M = 0.13
SD = 0.34 | M = 0.37
SD = 0.48 | M = 0.38
SD = 0.49 | M = 0.42
SD = 0.49 | M = 0.40
SD = 0.49 | M = 0.32
SD = 0.47 | M = 0.41
SD = 0.49 |
| Right-handed | M = 0.14
SD = 0.35 | M = 0.17
SD = 0.38 | M = 0.17
SD = 0.38 | M = 0.12
SD = 0.33 | M = 0.34
SD = 0.47 | M = 0.39
SD = 0.49 | M = 0.36
SD = 0.48 | M = 0.31
SD = 0.46 | M = 0.36
SD = 0.48 | M = 0.33
SD = 0.47 |
Table A3.
The average rates and standard deviations of accurate distance estimates, grouped by whether one wore glasses.
Table A3.
The average rates and standard deviations of accurate distance estimates, grouped by whether one wore glasses.
| Factor | 60 cm | 70 cm | 80 cm | 90 cm | 100 cm | 110 cm | 120 cm | 130 cm | 140 cm | 150 cm |
|---|
| Glasses | M = 0.14
SD = 0.35 | M = 0.16
SD = 0.35 | M = 0.15
SD = 0.36 | M = 0.15
SD = 0.35 | M = 0.34
SD = 0.47 | M = 0.40
SD = 0.49 | M = 0.40
SD = 0.49 | M = 0.33
SD = 0.47 | M = 0.36
SD = 0.48 | M = 0.34
SD = 0.47 |
| No glasses | M = 0.15
SD = 0.36 | M = 0.16
SD = 0.37 | M = 0.19
SD = 0.39 | M = 0.11
SD = 0.32 | M = 0.35
SD = 0.47 | M = 0.38
SD = 0.48 | M = 0.35
SD = 0.47 | M = 0.33
SD = 0.47 | M = 0.35
SD = 0.47 | M = 0.34
SD = 0.47 |
Table A4.
The average rates and standard deviations of accurate distance estimates, grouped by whether one had previous VR experience.
Table A4.
The average rates and standard deviations of accurate distance estimates, grouped by whether one had previous VR experience.
| Factor | 60 cm | 70 cm | 80 cm | 90 cm | 100 cm | 110 cm | 120 cm | 130 cm | 140 cm | 150 cm |
|---|
| Previous VR experience | M = 0.13
SD = 0.34 | M = 0.15
SD = 0.35 | M = 0.13
SD = 0.34 | M = 0.14
SD = 0.35 | M = 0.34
SD = 0.47 | M = 0.35
SD = 0.47 | M = 0.37
SD = 0.48 | M = 0.32
SD = 0.46 | M = 0.34
SD = 0.47 | M = 0.29
SD = 0.45 |
| No previous VR experience | M = 0.15
SD = 0.36 | M = 0.17
SD = 0.38 | M = 0.20
SD = 0.40 | M = 0.12
SD = 0.32 | M = 0.35
SD = 0.47 | M = 0.42
SD = 0.49 | M = 0.37
SD = 0.48 | M = 0.33
SD = 0.47 | M = 0.36
SD = 0.48 | M = 0.37
SD = 0.48 |
Table A5.
The average rates and standard deviations of accurate distance estimates, grouped by what the participants studied.
Table A5.
The average rates and standard deviations of accurate distance estimates, grouped by what the participants studied.
| Factor | 60 cm | 70 cm | 80 cm | 90 cm | 100 cm | 110 cm | 120 cm | 130 cm | 140 cm | 150 cm |
|---|
| Civil engineering | M = 0.19
SD = 0.39 | M = 0.16
SD = 0.36 | M = 0.19
SD = 0.39 | M = 0.16
SD = 0.36 | M = 0.35
SD = 0.47 | M = 0.41
SD = 0.49 | M = 0.42
SD = 0.49 | M = 0.32
SD = 0.46 | M = 0.46
SD = 0.50 | M = 0.40
SD = 0.49 |
| Mechanical engineering | M = 0.16
SD = 0.37 | M = 0.16
SD = 0.37 | M = 0.20
SD = 0.40 | M = 0.22
SD = 0.41 | M = 0.44
SD = 0.50 | M = 0.50
SD = 0.50 | M = 0.35
SD = 0.48 | M = 0.35
SD = 0.48 | M = 0.29
SD = 0.46 | M = 0.44
SD = 0.50 |
| Vehicle engineering | M = 0.18
SD = 0.38 | M = 0.19
SD = 0.39 | M = 0.21
SD = 0.41 | M = 0.11
SD = 0.31 | M = 0.38
SD = 0.48 | M = 0.38
SD = 0.48 | M = 0.46
SD = 0.50 | M = 0.42
SD = 0.49 | M = 0.42
SD = 0.49 | M = 0.41
SD = 0.49 |
| IT | M = 0.06
SD = 0.25 | M = 0.15
SD = 0.36 | M = 0.13
SD = 0.33 | M = 0.07
SD = 0.26 | M = 0.28
SD = 0.45 | M = 0.34
SD = 0.47 | M = 0.25
SD = 0.43 | M = 0.27
SD = 0.44 | M = 0.22
SD = 0.41 | M = 0.19
SD = 0.39 |
Table A6.
The average rates and standard deviations of accurate distance estimates, grouped by height of the participants (cm).
Table A6.
The average rates and standard deviations of accurate distance estimates, grouped by height of the participants (cm).
| Factor | 60 cm | 70 cm | 80 cm | 90 cm | 100 cm | 110 cm | 120 cm | 130 cm | 140 cm | 150 cm |
|---|
| 150–154 | M = 0.33
SD = 0.51 | M = 0.16
SD = 0.40 | M = 0.33
SD = 0.51 | M = 0.00
SD = 0.00 | M = 0.33
SD = 0.51 | M = 0.33
SD = 0.51 | M = 0.33
SD = 0.51 | M = 0.50
SD = 0.54 | M = 0.50
SD = 0.54 | M = 0.33
SD = 0.51 |
| 155–159 | M = 0.00
SD = 0.00 | M = 0.00
SD = 0.00 | M = 0.10
SD = 0.31 | M = 0.00
SD = 0.00 | M = 0.10
SD = 0.31 | M = 0.30
SD = 0.48 | M = 0.20
SD = 0.42 | M = 0.60
SD = 0.51 | M = 0.20
SD = 0.42 | M = 0.20
SD = 0.42 |
| 160–164 | M = 0.15
SD = 0.36 | M = 0.15
SD = 0.36 | M = 0.07
SD = 0.27 | M = 0.11
SD = 0.32 | M = 0.42
SD = 0.50 | M = 0.50
SD = 0.50 | M = 0.26
SD = 0.45 | M = 0.26
SD = 0.45 | M = 0.30
SD = 0.47 | M = 0.23
SD = 0.42 |
| 165–169 | M = 0.08
SD = 0.28 | M = 0.08
SD = 0.28 | M = 0.10
SD = 0.30 | M = 0.13
SD = 0.34 | M = 0.31
SD = 0.46 | M = 0.29
SD = 0.45 | M = 0.41
SD = 0.49 | M = 0.25
SD = 0.44 | M = 0.27
SD = 0.45 | M = 0.34
SD = 0.47 |
| 170–174 | M = 0.06
SD = 0.24 | M = 0.06
SD = 0.24 | M = 0.21
SD = 0.41 | M = 0.06
SD = 0.24 | M = 0.34
SD = 0.48 | M = 0.34
SD = 0.48 | M = 0.32
SD = 0.47 | M = 0.30
SD = 0.46 | M = 0.30
SD = 0.46 | M = 0.21
SD = 0.41 |
| 175–179 | M = 0.19
SD = 0.39 | M = 0.22
SD = 0.41 | M = 0.19
SD = 0.39 | M = 0.13
SD = 0.34 | M = 0.38
SD = 0.48 | M = 0.43
SD = 0.49 | M = 0.36
SD = 0.48 | M = 0.31
SD = 0.46 | M = 0.38
SD = 0.48 | M = 0.37
SD = 0.48 |
| 180–184 | M = 0.10
SD = 0.31 | M = 0.17
SD = 0.38 | M = 0.16
SD = 0.37 | M = 0.15
SD = 0.36 | M = 0.28
SD = 0.45 | M = 0.41
SD = 0.49 | M = 0.33
SD = 0.47 | M = 0.35
SD = 0.48 | M = 0.36
SD = 0.48 | M = 0.35
SD = 0.48 |
| 185–189 | M = 0.22
SD = 0.41 | M = 0.12
SD = 0.33 | M = 0.23
SD = 0.42 | M = 0.16
SD = 0.37 | M = 0.41
SD = 0.49 | M = 0.43
SD = 0.49 | M = 0.47
SD = 0.50 | M = 0.33
SD = 0.47 | M = 0.43
SD = 0.49 | M = 0.37
SD = 0.48 |
| 190–194 | M = 0.20
SD = 0.41 | M = 0.39
SD = 0.49 | M = 0.21
SD = 0.41 | M = 0.07
SD = 0.26 | M = 0.32
SD = 0.47 | M = 0.44
SD = 0.50 | M = 0.35
SD = 0.48 | M = 0.42
SD = 0.50 | M = 0.35
SD = 0.48 | M = 0.57
SD = 0.50 |
| 195–199 | M = 0.12
SD = 0.34 | M = 0.18
SD = 0.40 | M = 0.06
SD = 0.25 | M = 0.06
SD = 0.25 | M = 0.31
SD = 0.47 | M = 0.25
SD = 0.44 | M = 0.43
SD = 0.51 | M = 0.25
SD = 0.44 | M = 0.37
SD = 0.50 | M = 0.25
SD = 0.44 |
| 200–204 | M = 0.25
SD = 0.50 | M = 0.50
SD = 0.57 | M = 0.50
SD = 0.57 | M = 0.75
SD = 0.50 | M = 0.50
SD = 0.57 | M = 0.25
SD = 0.50 | M = 0.25
SD = 0.50 | M = 0.50
SD = 0.57 | M = 0.25
SD = 0.50 | M = 0.25
SD = 0.50 |
Table A7.
The average rates and standard deviations of accurate distance estimates, grouped by the number of hours per week the participants played video games.
Table A7.
The average rates and standard deviations of accurate distance estimates, grouped by the number of hours per week the participants played video games.
| Factor | 60 cm | 70 cm | 80 cm | 90 cm | 100 cm | 110 cm | 120 cm | 130 cm | 140 cm | 150 cm |
|---|
| 0 | M = 0.15
SD = 0.36 | M = 0.15
SD = 0.35 | M = 0.18
SD = 0.38 | M = 0.09
SD = 0.29 | M = 0.35
SD = 0.48 | M = 0.35
SD = 0.48 | M = 0.30
SD = 0.46 | M = 0.32
SD = 0.47 | M = 0.29
SD = 0.45 | M = 0.29
SD = 0.45 |
| 1–2 | M = 0.12
SD = 0.33 | M = 0.16
SD = 0.37 | M = 0.12
SD = 0.33 | M = 0.12
SD = 0.33 | M = 0.41
SD = 0.49 | M = 0.41
SD = 0.49 | M = 0.39
SD = 0.49 | M = 0.39
SD = 0.49 | M = 0.38
SD = 0.48 | M = 0.35
SD = 0.48 |
| 3–4 | M = 0.05
SD = 0.23 | M = 0.21
SD = 0.41 | M = 0.19
SD = 0.39 | M = 0.19
SD = 0.39 | M = 0.28
SD = 0.45 | M = 0.55
SD = 0.50 | M = 0.51
SD = 0.50 | M = 0.38
SD = 0.49 | M = 0.36
SD = 0.48 | M = 0.34
SD = 0.48 |
| 5–10 | M = 0.15
SD = 0.36 | M = 0.22
SD = 0.41 | M = 0.22
SD = 0.41 | M = 0.16
SD = 0.36 | M = 0.36
SD = 0.48 | M = 0.44
SD = 0.49 | M = 0.37
SD = 0.48 | M = 0.34
SD = 0.47 | M = 0.37
SD = 0.48 | M = 0.41
SD = 0.49 |
| 11–19 | M = 0.20
SD = 0.40 | M = 0.10
SD = 0.30 | M = 0.20
SD = 0.40 | M = 0.13
SD = 0.34 | M = 0.30
SD = 0.46 | M = 0.31
SD = 0.46 | M = 0.38
SD = 0.49 | M = 0.26
SD = 0.44 | M = 0.44
SD = 0.50 | M = 0.33
SD = 0.47 |
| 20+ | M = 0.21
SD = 0.41 | M = 0.11
SD = 0.32 | M = 0.11
SD = 0.32 | M = 0.09
SD = 0.29 | M = 0.33
SD = 0.47 | M = 0.28
SD = 0.45 | M = 0.35
SD = 0.48 | M = 0.23
SD = 0.43 | M = 0.35
SD = 0.48 | M = 0.33
SD = 0.47 |
Table A8.
The average rates and standard deviations of accurate distance estimates, grouped by used display devices.
Table A8.
The average rates and standard deviations of accurate distance estimates, grouped by used display devices.
| Factor | 60 cm | 70 cm | 80 cm | 90 cm | 100 cm | 110 cm | 120 cm | 130 cm | 140 cm | 150 cm |
|---|
| Desktop display | M = 0.18
SD = 0.39 | M = 0.17
SD = 0.37 | M = 0.20
SD = 0.40 | M = 0.15
SD = 0.36 | M = 0.37
SD = 0.48 | M = 0.42
SD = 0.49 | M = 0.42
SD = 0.49 | M = 0.35
SD = 0.48 | M = 0.42
SD = 0.49 | M = 0.41
SD = 0.49 |
| Gear VR | M = 0.06
SD = 0.25 | M = 0.15
SD = 0.36 | M = 0.13
SD = 0.33 | M = 0.07
SD = 0.26 | M = 0.28
SD = 0.45 | M = 0.34
SD = 0.47 | M = 0.25
SD = 0.43 | M = 0.27
SD = 0.44 | M = 0.22
SD = 0.41 | M = 0.19
SD = 0.39 |
Figure A1.
Descriptive statistics of exocentric distance estimation times, grouped by gender.
Figure A1.
Descriptive statistics of exocentric distance estimation times, grouped by gender.
Figure A2.
Descriptive statistics of exocentric distance estimation times, grouped by dominant hand.
Figure A2.
Descriptive statistics of exocentric distance estimation times, grouped by dominant hand.
Figure A3.
Descriptive statistics of exocentric distance estimation times, grouped by whether one wore glasses.
Figure A3.
Descriptive statistics of exocentric distance estimation times, grouped by whether one wore glasses.
Figure A4.
Descriptive statistics of exocentric distance estimation times, grouped by whether one had previous VR experience.
Figure A4.
Descriptive statistics of exocentric distance estimation times, grouped by whether one had previous VR experience.
Figure A5.
Descriptive statistics of exocentric distance estimation times, grouped by what the participants studied.
Figure A5.
Descriptive statistics of exocentric distance estimation times, grouped by what the participants studied.
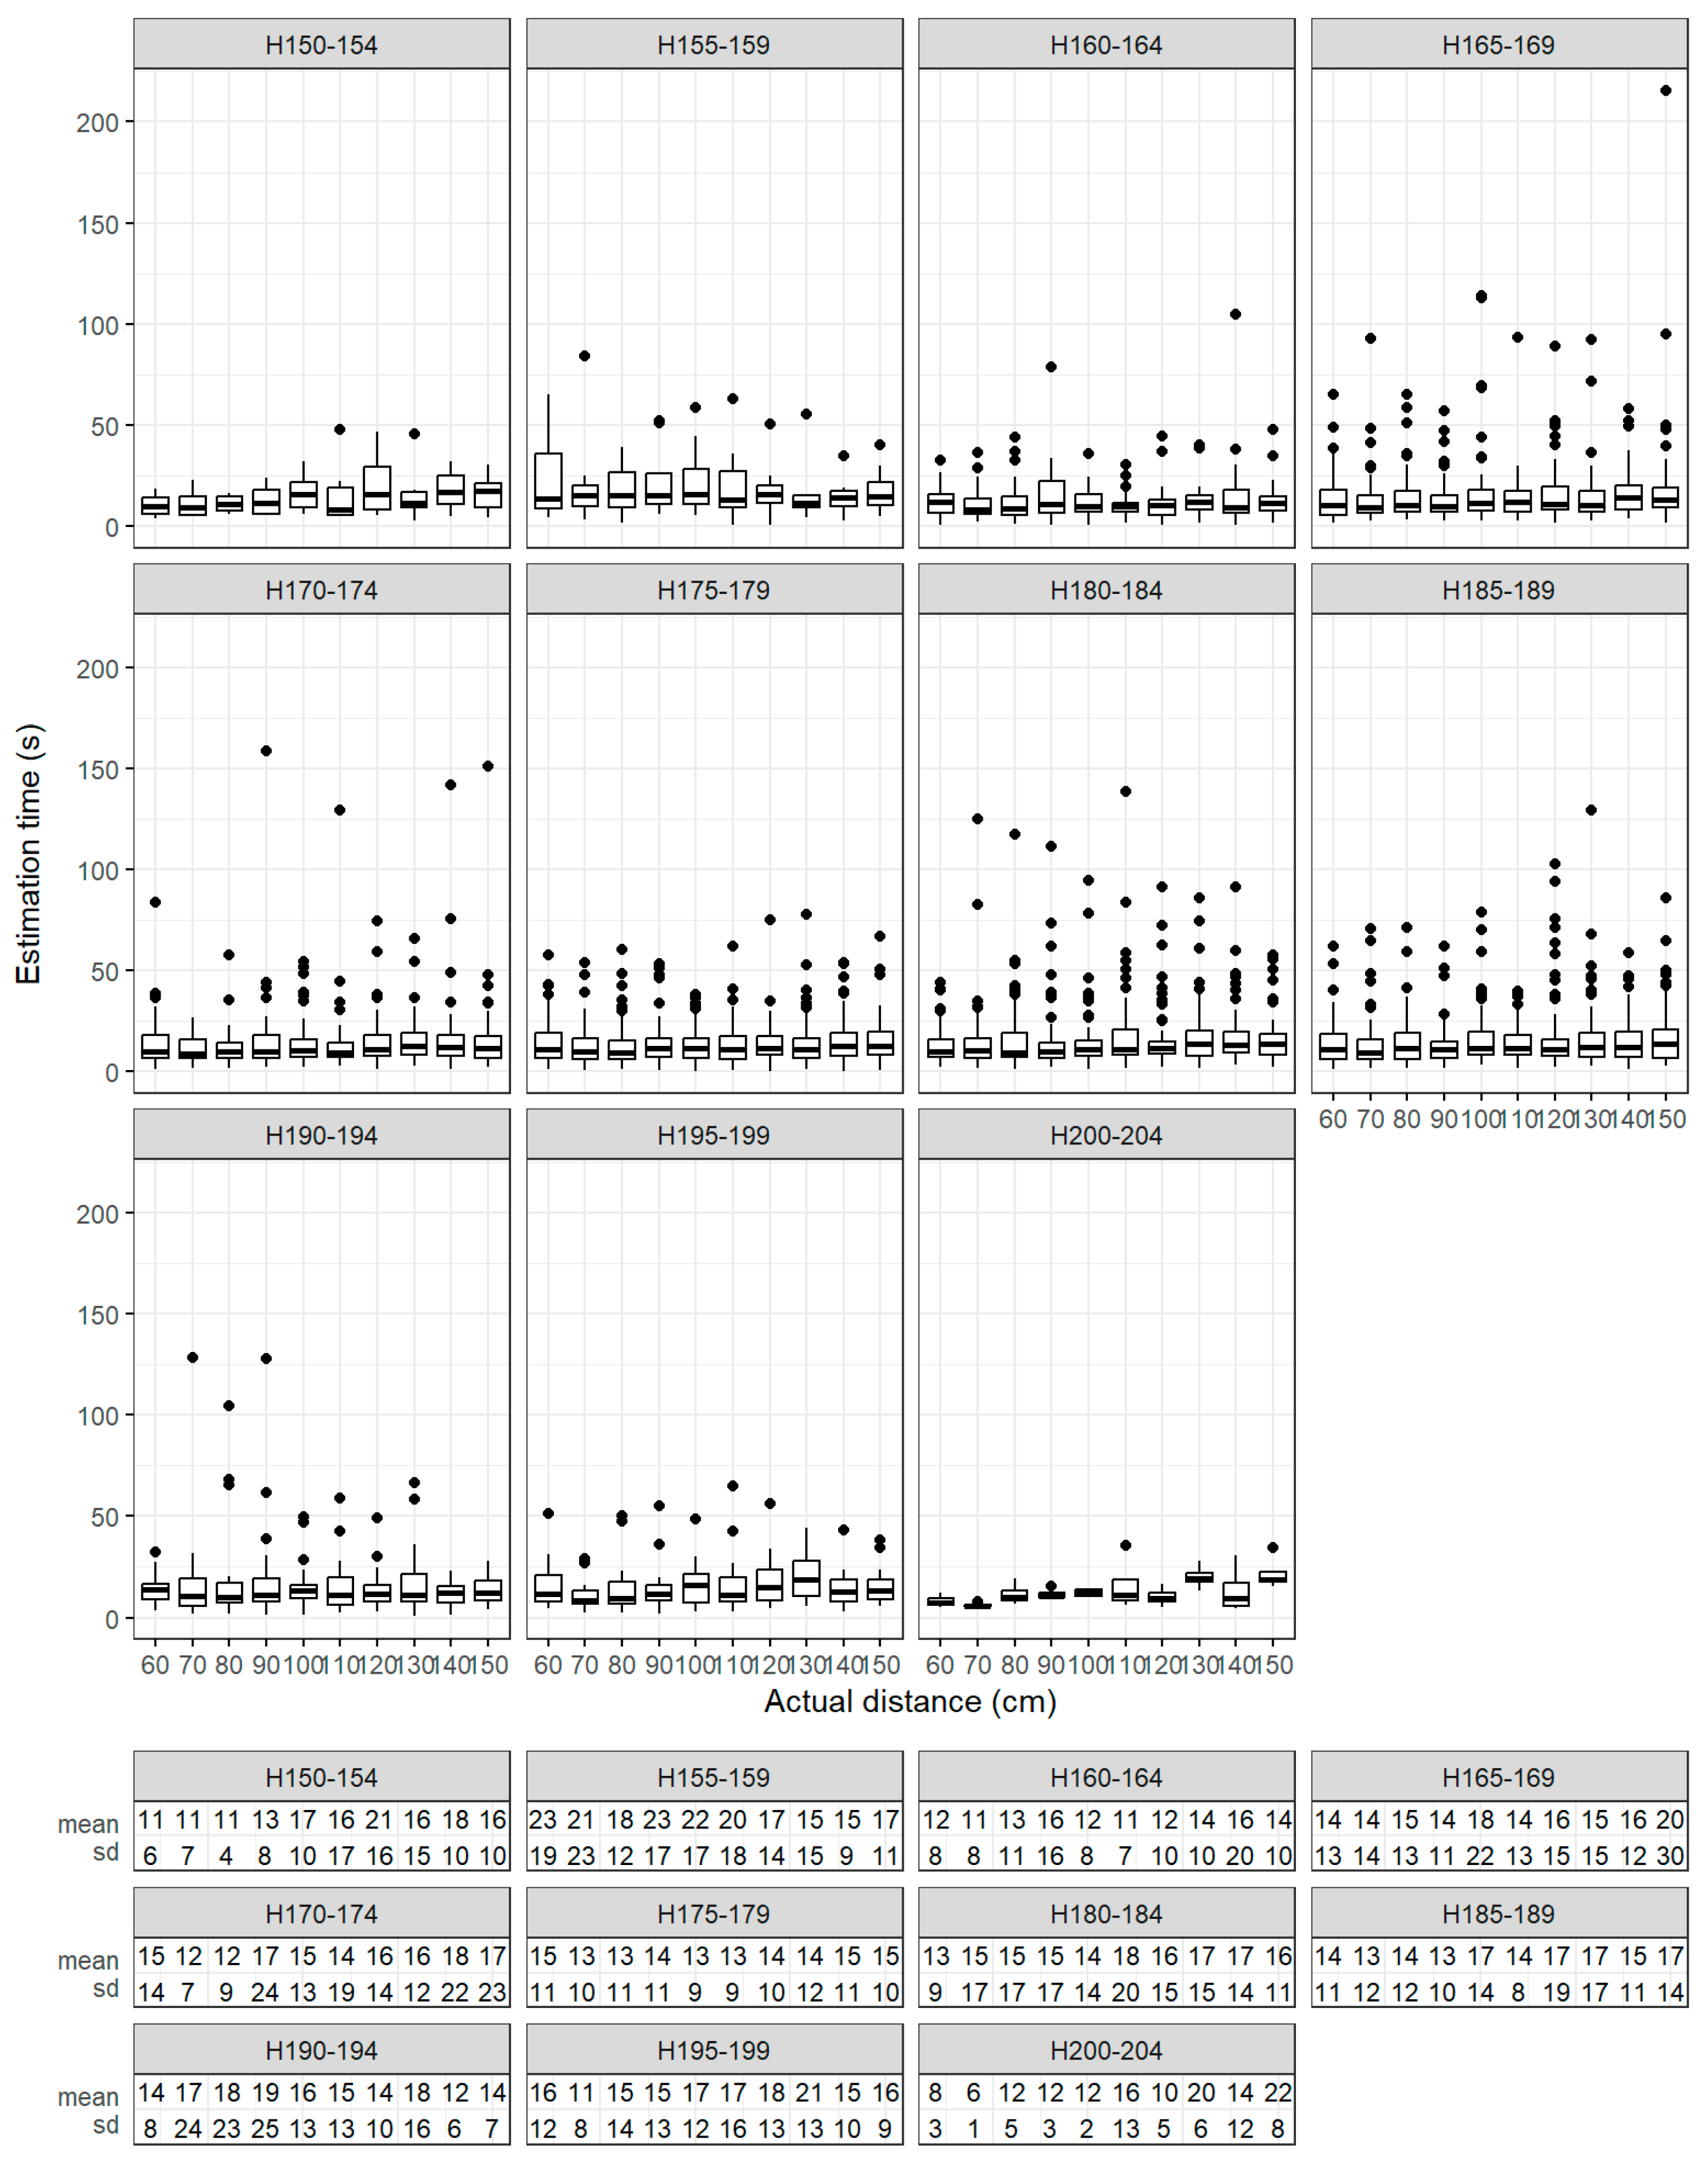
Figure A6.
Descriptive statistics of exocentric distance estimation times, grouped by height of the participants (cm).
Figure A6.
Descriptive statistics of exocentric distance estimation times, grouped by height of the participants (cm).
Figure A7.
Descriptive statistics of exocentric distance estimation times, grouped by the number of hours per week the participants played video games.
Figure A7.
Descriptive statistics of exocentric distance estimation times, grouped by the number of hours per week the participants played video games.
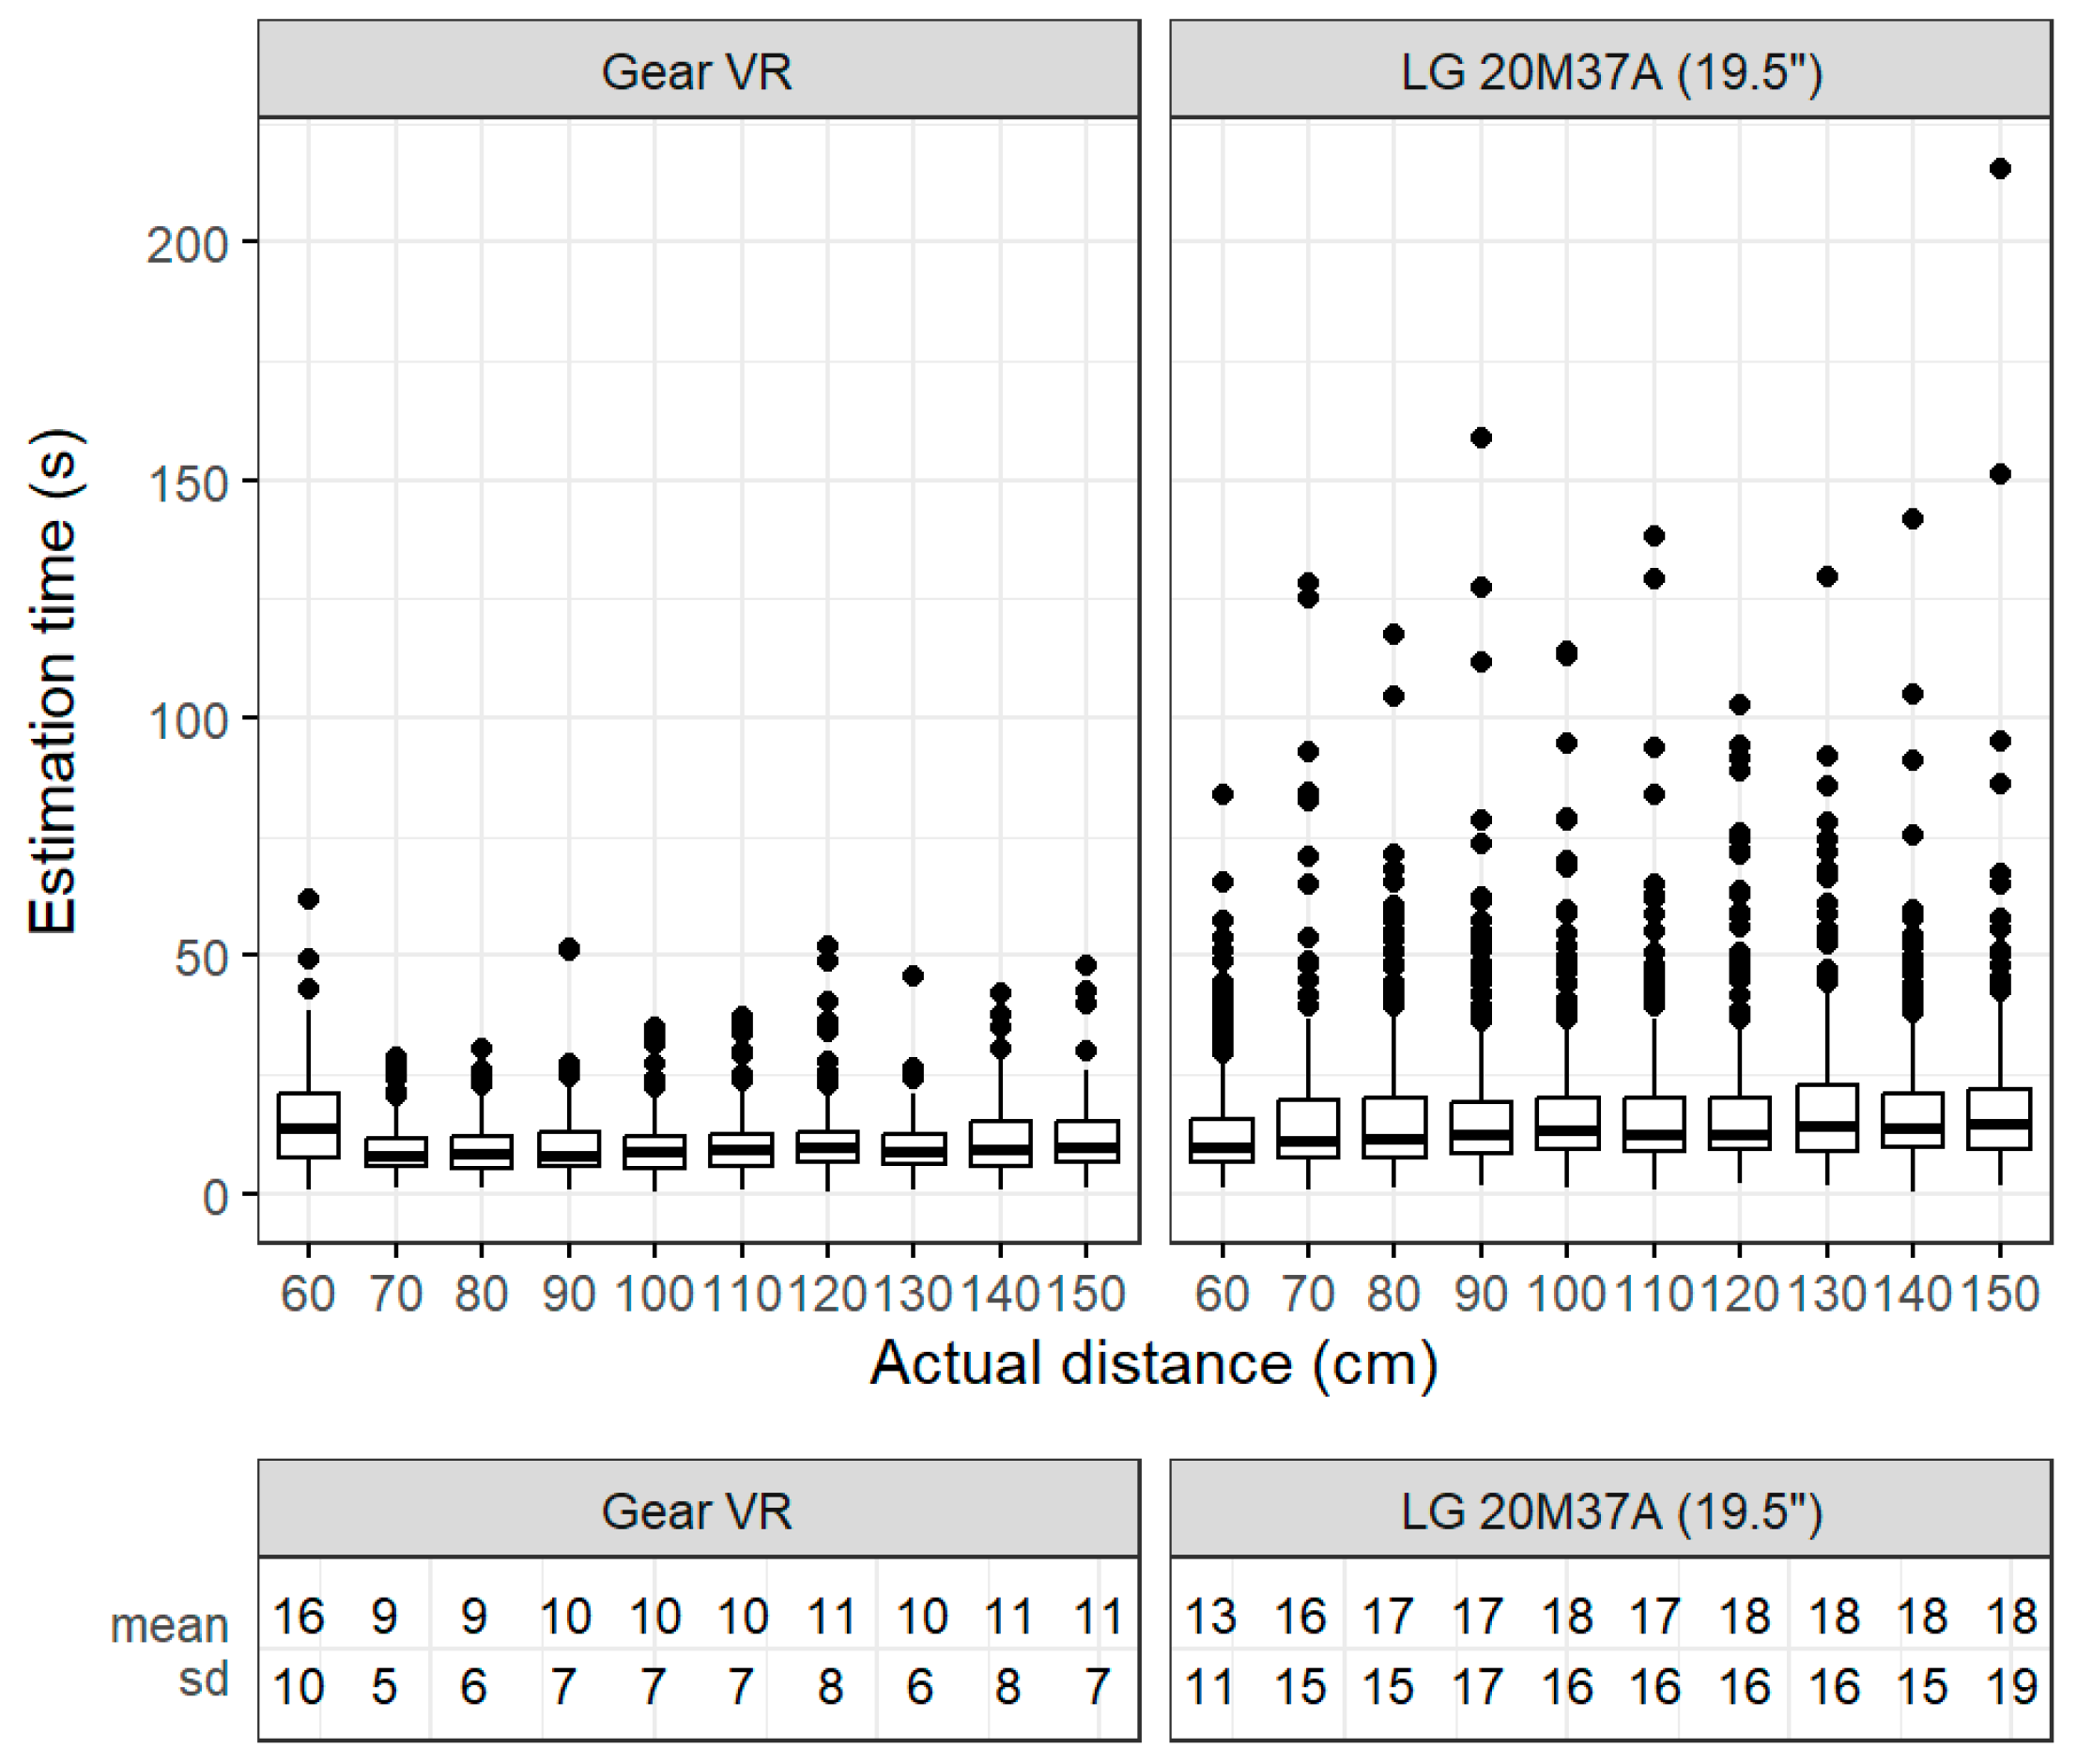
Figure A8.
Descriptive statistics of exocentric distance estimation times, grouped by used display devices.
Figure A8.
Descriptive statistics of exocentric distance estimation times, grouped by used display devices.
References
- Miller, C.L.; Bertoline, G.R. Spatial Visualization Research and Theories: Their Importance in the Development of an Engineering and Technical Design Graphics Curriculum Model. Eng. Des. Graph. J. 1991, 55, 5–14. [Google Scholar]
- Loftin, R.B.; Scerbo, M.W.; McKenzie, F.D.; Catanzaro, J.M. Training in Peacekeeping Operations Using Virtual Environments. IEEE Comput. Graph. Appl. 2004, 24, 18–21. [Google Scholar] [CrossRef] [PubMed]
- Cao, C.G.L.; Zhou, M.; Jones, D.B.; Schwaitzberg, S.D. Can Surgeons Think and Operate with Haptics at the Same Time? J. Gastrointest. Surg. 2007, 11, 1564–1569. [Google Scholar] [CrossRef] [PubMed]
- Zyda, M. From Visual Simulation to Virtual Reality to Games. Computer 2005, 38, 25–32. [Google Scholar] [CrossRef]
- Bates, J. Virtual Reality, Art, and Entertainment. Presence 1992, 1, 133–138. [Google Scholar] [CrossRef]
- Dugdale, J.; Pavard, B.; Pallamin, N.; El Jed, M.; Maugan, C.L. Emergency Fire Incident Training in a Virtual World. In Proceedings of the ISCRAM, Brussels, Belgium, 3–4 May 2004; Volume 167, pp. 167–172. [Google Scholar]
- Lele, A. Virtual Reality and Its Military Utility. J. Ambient. Intell. Humaniz. Comput. 2013, 4, 17–26. [Google Scholar] [CrossRef]
- Ahlberg, G.; Enochsson, L.; Gallagher, A.G.; Hedman, L.; Hogman, C.; McClusky, D.A., 3rd; Ramel, S.; Smith, C.D.; Arvidsson, D. Proficiency-Based Virtual Reality Training Significantly Reduces the Error Rate for Residents during Their First 10 Laparoscopic Cholecystectomies. Am. J. Surg. 2007, 193, 797–804. [Google Scholar] [CrossRef]
- Seymour, N.E.; Gallagher, A.G.; Roman, S.A.; O’Brien, M.K.; Bansal, V.K.; Andersen, D.K.; Satava, R.M. Virtual Reality Training Improves Operating Room Performance: Results of a Randomized, Double-Blinded Study. Ann. Surg. 2002, 236, 458–463. [Google Scholar] [CrossRef] [PubMed]
- Falah, J.; Khan, S.; Alfalah, T.; Alfalah, S.F.M.; Chan, W.; Harrison, D.K.; Charissis, V. Virtual Reality Medical Training System for Anatomy Education. In Proceedings of the 2014 Science and Information Conference, London, UK, 27–29 August 2014; IEEE: New York, NY, USA, 2014. [Google Scholar]
- Psotka, J. Immersive Training Systems: Virtual Reality and Education and Training. Instr. Sci. 1995, 23, 405–431. [Google Scholar] [CrossRef]
- Freina, L.; Ott, M. A Literature Review on Immersive Virtual Reality in Education: State of the Art and Perspectives. Int. Sci. Conf. Elearning Softw. Educ. 2015, 1, 10–18. [Google Scholar]
- Kenyon, R.V.; Phenany, M.; Sandin, D.; Defanti, T. Accommodation and Size-Constancy of Virtual Objects. Ann. Biomed. Eng. 2008, 36, 342–348. [Google Scholar] [CrossRef] [PubMed]
- Willemsen, P.; Gooch, A.A. Perceived Egocentric Distances in Real, Image-Based, and Traditional Virtual Environments. In Proceedings of the IEEE Virtual Reality, Orlando, FL, USA, 24–28 March 2002; IEEE Computer Society: New York, NY, USA, 2003. [Google Scholar] [CrossRef]
- Jamiy, F.E.; Marsh, R. Distance Estimation in Virtual Reality and Augmented Reality: A Survey. In Proceedings of the 2019 IEEE International Conference on Electro Information Technology (EIT), Brookings, SD, USA, 20–22 May 2019; IEEE: Piscataway, NJ, USA, 2019; pp. 63–68. [Google Scholar] [CrossRef]
- Creem-Regehr, S.H.; Stefanucci, J.K.; Bodenheimer, B. Perceiving Distance in Virtual Reality: Theoretical Insights from Contemporary Technologies. Philos. Trans. R. Soc. Lond. B Biol. Sci. 2023, 378, 20210456. [Google Scholar] [CrossRef] [PubMed]
- Mohler, B.J.; Creem-Regehr, S.H.; Thompson, W.B.; Bülthoff, H.H. The Effect of Viewing a Self-Avatar on Distance Judgments in an HMD-Based Virtual Environment. Presence 2010, 19, 230–242. [Google Scholar] [CrossRef]
- Tai, N.-C. Daylighting and Its Impact on Depth Perception in a Daylit Space. J. Light Vis. Environ. 2012, 36, 16–22. [Google Scholar] [CrossRef][Green Version]
- Sinai, M.J.; Ooi, T.L.; He, Z.J. Terrain Influences the Accurate Judgement of Distance. Nature 1998, 395, 497–500. [Google Scholar] [CrossRef] [PubMed]
- Kunz, B.R.; Wouters, L.; Smith, D.; Thompson, W.B.; Creem-Regehr, S.H. Revisiting the Effect of Quality of Graphics on Distance Judgments in Virtual Environments: A Comparison of Verbal Reports and Blind Walking. Atten. Percept. Psychophys. 2009, 71, 1284–1293. [Google Scholar] [CrossRef] [PubMed]
- Lappin, J.S.; Shelton, A.L.; Rieser, J.J. Environmental Context Influences Visually Perceived Distance. Percept. Psychophys. 2006, 68, 571–581. [Google Scholar] [CrossRef] [PubMed]
- Thomas, G.; Goldberg, J.H.; Cannon, D.J.; Hillis, S.L. Surface Textures Improve the Robustness of Stereoscopic Depth Cues. Hum. Factors 2002, 44, 157–170. [Google Scholar] [CrossRef]
- Murgia, A.; Sharkey, P.M. Estimation of Distances in Virtual Environments Using Size Constancy. Int. J. Virtual Real. 2009, 8, 67–74. [Google Scholar] [CrossRef]
- Naceri, A.; Chellali, R.; Hoinville, T. Depth perception within peripersonal space using head-mounted display. Presence 2011, 20, 254–272. [Google Scholar] [CrossRef]
- Maruhn, P.; Schneider, S.; Bengler, K. Measuring Egocentric Distance Perception in Virtual Reality: Influence of Methodologies, Locomotion and Translation Gains. PLoS ONE 2019, 14, e0224651. [Google Scholar] [CrossRef] [PubMed]
- El Jamiy, F.; Ramaseri Chandra, A.N.; Marsh, R. Distance Accuracy of Real Environments in Virtual Reality Head-Mounted Displays. In Proceedings of the 2020 IEEE International Conference on Electro Information Technology (EIT), Chicago, IL, USA, 31 July 2020–1 August 2020; IEEE: Piscataway, NJ, USA, 2020; pp. 281–287. [Google Scholar] [CrossRef]
- Renner, R.S.; Velichkovsky, B.M.; Helmert, J.R. The Perception of Egocentric Distances in Virtual Environments—A Review. ACM Comput. Surv. 2013, 46, 1–40. [Google Scholar] [CrossRef]
- Cutting, J.E.; Vishton, P.M. Perceiving Layout and Knowing Distances. In Perception of Space and Motion; Elsevier: Amsterdam, The Netherlands, 1995; pp. 69–117. ISBN 9780122405303. [Google Scholar] [CrossRef]
- Luo, X.; Kenyon, R.V.; Kamper, D.G.; Sandin, D.J.; DeFanti, T.A. On the Determinants of Size-Constancy in a Virtual Environment. Int. J. Virtual Real. 2009, 8, 43–51. [Google Scholar] [CrossRef]
- Guzsvinecz, T.; Perge, E.; Szűcs, J. Examining the Results of Virtual Reality-Based Egocentric Distance Estimation Tests Based on Immersion Level. Sensors 2023, 23, 3138. [Google Scholar] [CrossRef] [PubMed]
- Kelly, J.W. Distance Perception in Virtual Reality: A Meta-Analysis of the Effect of Head-Mounted Display Characteristics. IEEE Trans. Vis. Comput. Graph. 2023, 29, 4978–4989. [Google Scholar] [CrossRef] [PubMed]
- Viguier, A.; Clément, G.; Trotter, Y. Distance Perception within near Visual Space. Perception 2001, 30, 115–124. [Google Scholar] [CrossRef] [PubMed]
- Armbrüster, C.; Wolter, M.; Kuhlen, T.; Spijkers, W.; Fimm, B. Depth Perception in Virtual Reality: Distance Estimations in Peri- and Extrapersonal Space. Cyberpsychol. Behav. 2008, 11, 9–15. [Google Scholar] [CrossRef] [PubMed]
- Bingham, G.P.; Zaal, F.; Robin, D.; Shull, J.A. Distortions in Definite Distance and Shape Perception as Measured by Reaching without and with Haptic Feedback. J. Exp. Psychol. Hum. Percept. Perform. 2000, 26, 1436–1460. [Google Scholar] [CrossRef]
- Rolland, J.P.; Gibson, W.; Ariely, D. Towards Quantifying Depth and Size Perception in Virtual Environments. Presence 1995, 4, 24–49. [Google Scholar] [CrossRef]
- Bian, Z.; Andersen, G.J. Aging and the Perception of Egocentric Distance. Psychol. Aging 2013, 28, 813–825. [Google Scholar] [CrossRef]
- Plumert, J.M.; Kearney, J.K.; Cremer, J.F.; Recker, K. Distance Perception in Real and Virtual Environments. ACM Trans. Appl. Percept. 2005, 2, 216–233. [Google Scholar] [CrossRef]
- Coelho, H.; Melo, M.; Branco, F.; Vasconcelos-Raposo, J.; Bessa, M. The Impact of Gender, Avatar and Height in Distance Perception in Virtual Environments. In Advances in Intelligent Systems and Computing; Springer International Publishing: Cham, Switzerland, 2019; pp. 696–705. ISBN 9783030161835. [Google Scholar] [CrossRef]
- Foreman, N.; Sandamas, G.; Newson, D. Distance Underestimation in Virtual Space Is Sensitive to Gender but Not Activity-Passivity or Mode of Interaction. Cyberpsychol. Behav. 2004, 7, 451–457. [Google Scholar] [CrossRef]
- Feldstein, I.T.; Kölsch, F.M.; Konrad, R. Egocentric Distance Perception: A Comparative Study Investigating Differences between Real and Virtual Environments. Perception 2020, 49, 940–967. [Google Scholar] [CrossRef] [PubMed]
- Saracini, C.; Olivetti Belardinelli, M.; Hoepfner, A.; Basso, D. Differences in Distance Estimations in Real and Virtual 3D Environments. In Proceedings of the 2nd International and Interdisciplinary Conference on Image and Imagination, Alghero, Italy, 4–5 July 2019; Springer International Publishing: Cham, Switzerland, 2020; pp. 881–896, ISBN 9783030410179. [Google Scholar]
- Guzsvinecz, T.; Perge, E.; Szűcs, J. Analyzing Accurate Egocentric Distance Estimates of University Students in Virtual Environments with a Desktop Display and Gear VR Display. Electronics 2023, 12, 2253. [Google Scholar] [CrossRef]
- Burdea, G.C.; Coiffet, P. Virtual Reality Technology, 2nd ed.; John Wiley & Sons: Nashville, TN, USA, 2003; ISBN 9780471360896. [Google Scholar]
- Horváth, I.; Csapó, Á.B.; Berki, B.; Sudár, A.; Baranyi, P. Definition, Background and Research Perspectives Behind ‘Cognitive Aspects of Virtual Reality’ (cVR). Infocommun. J. Spec. Issue Internet Digit. Cogn. Realities 2023, 9–14. [Google Scholar] [CrossRef]
- Kövecses-Gősi, V. Cooperative Learning in VR Environment. Acta Polytech. Hung. 2018, 15, 205–224. [Google Scholar] [CrossRef]
- Drettakis, G.; Roussou, M.; Reche, A.; Tsingos, N. Design and Evaluation of a Real-World Virtual Environment for Architecture and Urban Planning. Presence 2007, 16, 318–332. [Google Scholar] [CrossRef]
- Baranyi, P.; Csapo, A.; Sallai, G. Cognitive Infocommunications (CogInfoCom); Springer: Berlin/Heidelberg, Germany, 2015. [Google Scholar]
| Disclaimer/Publisher’s Note: The statements, opinions and data contained in all publications are solely those of the individual author(s) and contributor(s) and not of MDPI and/or the editor(s). MDPI and/or the editor(s) disclaim responsibility for any injury to people or property resulting from any ideas, methods, instructions or products referred to in the content. |
© 2024 by the authors. Licensee MDPI, Basel, Switzerland. This article is an open access article distributed under the terms and conditions of the Creative Commons Attribution (CC BY) license (https://creativecommons.org/licenses/by/4.0/).


