Abstract
This research proposes a lightweight and applicable dataset with a precise elevation ground truth and extrinsic calibration toward the LiDAR (Light Detection and Ranging) SLAM (Simultaneous Localization and Mapping) task in the field of autonomous driving. Our dataset focuses on more cost-effective platforms with limited computational power and low-resolution three-dimensional LiDAR sensors (16-beam LiDAR), and fills the gaps in the existing literature. Our data include abundant scenarios that include degenerated environments, dynamic objects, and large slope terrain to facilitate the investigation of the performance of the SLAM system. We provided the ground truth pose from RTK-GPS and carefully rectified its elevation errors, and designed an extra method to evaluate the vertical drift. The module for calibrating the LiDAR and IMU was also enhanced to ensure the precision of point cloud data. The reliability and applicability of the dataset are fully tested through a series of experiments using several state-of-the-art LiDAR SLAM methods.
1. Introduction
Simultaneous Localization and Mapping (SLAM) is one of the most important research topics in the field of autonomous driving. It can be categorized into visual-based SLAM [1,2,3] and LiDAR-based SLAM [4,5,6] depending on the sensors employed. The advantages of LiDAR SLAM over visual SLAM are its high accuracy and minimal sensitivity to lighting conditions, making it popular for autonomous driving scenarios. The deployment cost of an LiDAR SLAM experimental platform is relatively high due to the expenses associated with sensors and mobile vehicles. Thus, a common way for LiDAR SLAM researchers to conduct their research is through open-source LiDAR datasets. A valid and practical dataset usually plays an important role in a LiDAR SLAM study. However, most existing datasets [7,8] aim to comprehensively cover various tasks involved in autonomous driving, such as object detection, tracking, and semantic segmentation, etc. The absence of a specialized LiDAR SLAM dataset poses several challenges when conducting research. These challenges can be summarized as follows:
- High resolution vs. low resolution: To cope with tasks such as object detection and semantic segmentation, most datasets employ LiDARs with high resolution (e.g., Velodyne HDL-64E) as their primary sensors. However, high-resolution LiDAR sensors are often prohibitively expensive, making the widespread use of low-cost, low-resolution LiDAR sensors more common in autonomous robotics applications. From the viewpoint of an efficiency-sensitive SLAM algorithm, the use of high-resolution LiDARs significantly increases computational burden. Actually, we also noticed that the impact of the decreased resolution of the point cloud on the accuracy of LiDAR SLAM is relatively limited. Most of the state-of-the-art LiDAR SLAM methods require a downsampling of the point cloud in the point cloud preprocessing step. Therefore, for scenarios that demand high efficiency or experimental platforms with limited onboard computing power, LiDARs with lower resolution are preferred. However, currently, such practical datasets obtained from low-resolution LiDAR sensors are relatively scarce.
- Elevation error of the GPS ground truth pose: The ground truth of vehicle pose and trajectory play an essential role in the evaluation of a LiDAR SLAM. In outdoor environments, the vast majority of datasets for autonomous driving scenarios use RTK-based GPS measurements as the source of the ground truth. However, a frequently overlooked fact is that due to the principles of GPS and factors such as obstruction and satellite geometry, the altitude, or elevation error, in GPS positioning is more severe compared to the horizontal error. Thus, using the GPS altitude directly as the elevation value of the ground truth can be insufficient. Currently, investigations into this issue are limited and corresponding compensation strategies are required.
- The errors brought by the calibration process: Because the LiDAR sensor continuously samples range data from the environment, the compensation for motion distortion in point cloud data is essential in datasets as the platform is moving. This process is usually accomplished with the assistance of an Inertial Measurement Unit (IMU). Thus, for most LiDAR SLAM datasets, the calibration for extrinsic transformation between LiDAR and an IMU is considered a prerequisite. In some widely used datasets [7,9], traditional calibration methods are employed for the joint calibration. However, these methods tend to introduce errors that cannot be overlooked, as they fail to consider signal synchronization between different types of sensors. These errors might result in long-term drift and inaccurate map construction results for SLAM systems, weakening the applicability of the dataset.
In this research, an applicable and lightweight LiDAR SLAM dataset for autonomous driving scenarios is proposed to address the above-mentioned issues. The point cloud of the dataset was obtained using a Velodyne VLP-16 LiDAR, which has a moderate point cloud density and resolution. The data were collected from the Xiaoheshan Campus of Zhejiang University of Science and Technology (ZUST), encompassing diverse scenarios that include degenerated environments, dynamic objects, and large slope terrain, demonstrating high practicability. Based on the ground truth from RTK-based GPS measurements, a series of methods are proposed to mitigate the impact of the elevation error. Firstly, we ensure the start and end points of the trajectory are precisely located at the same position through accurate measurements. Then, the difference in height between the start and end positions can be used to quantitatively evaluate the vertical drift of a SLAM method without relying on GPS measurements. Secondly, a linear interpolation method is employed to mitigate the elevation errors contained in the GPS data that are induced by the occlusion of buildings or trees. In this way, we accurately restore the true elevation information and enhance the accuracy of the ground truth. To address the errors caused by the calibration of LiDAR and the IMU, we employ a novel approach based on upsampling and pre-integration. The calibration errors are mitigated and the robustness of joint calibration is enhanced.
The main contributions of our research are summarized as follows:
- A lightweight LiDAR SLAM dataset designed for autonomous driving scenarios is presented, utilizing a low-resolution LiDAR as its primary sensor. This dataset enriches the existing field of LiDAR SLAM datasets by offering additional options, particularly those working with low-computing-power platforms or exploring the performance of SLAM methods using low-resolution point clouds.
- A series of methods are proposed to mitigate the elevation errors in the GPS-based ground truth data. Compared to other datasets, our dataset can provide a more reliable and accurate benchmark, particularly in terms of the elevation.
- The module for the joint calibration of LiDAR and the IMU is enhanced. This improvement effectively enhances the correction of LiDAR motion distortion, thereby significantly reducing the errors introduced by the dataset itself in the study of SLAM algorithms.
- The dataset’s utility and usability are fully verified through a series of experiments using three state-of-the-art LiDAR SLAM methods. These experimental results also provide valuable insight into the performance of each method under diverse scenarios when utilizing low-resolution point clouds.
The rest of this paper is organized as follows. After giving a review of related works in Section 2, a detailed introduction of our dataset is presented in Section 3. In Section 4, the experimental settings and the evaluation results are introduced. Finally, a conclusion of the paper is made in Section 5.
2. Related Works
The most relevant work to this research is the dataset that contains 3D LiDAR measurements in outdoor environments toward autonomous driving. The KITTI dataset proposed by Geiger et al. [7] is a representative work in this field. This dataset provides a high-quality dataset for evaluating SLAM algorithms and various tasks related to autonomous driving. However, it suffers from inaccurate ground truth values and incorrect joint calibration results. The Oxford RobotCar Dataset [8] offers high-resolution LiDAR data and focuses on autonomous driving in urban environments. This dataset serves as a resource for research on urban navigation and semantic segmentation tasks, emphasizing the important role of LiDAR in autonomous driving in urban environments. The nuScenes dataset [10], generated by six cameras, five radars, and one LiDAR, offers a comprehensive and diverse collection of data for autonomous driving systems. This dataset provides useful data for conducting research in the domains of multisensor fusion, object detection, path planning, and decision making. A2D2 [9], as a multimodal sensor dataset, provides a resource for autonomous driving research, and also uses a high-resolution LiDAR as its main sensor. The Paris-Lille-3D dataset [11] is generated based on Mobile Laser Scanning (MLS), which is oriented to the urban environment. In this dataset, the objects are sufficiently segmented so that the task of segmentation can be learned with high precision. The Zenseact Open Dataset (ZOD) [12] is proposed for various types of autonomous driving tasks. Its LiDAR data are acquired using a high-resolution Velodyne VLS-128 LiDAR as the main sensor, accompanied by two low-resolution Velodyne VLP-16 LiDARs serving as auxiliary sensors.
There are few datasets specifically designed for 3D LiDAR SLAM. Ford Campus [13], comprising of two sub-datasets, has been developed for SLAM research. The content of the dataset is generated by cameras, LiDAR, and an IMU. An inertial navigation system with extreme high precision, Applanix POS-LV, is selected as the source of the ground truth in this study. Jinyong Jeong et al. provided a challenging dataset [14] that focuses on extremely complex urban environments where GPS signals are unreliable. The dataset provides baseline-generated SLAM algorithms with meter-level accuracy. The point cloud information of the Málaga urban dataset [15] is generated by five 2D laser scanners (3 Hokuyo UTM-30LX and 2 SICK LMS-200). The total length of the trajectory of the onboard system is 36.8 km, which provides an extremely challenging case for the study of LiDAR SLAM. Knights et al. proposed the Wild-places dataset [16] for SLAM tasks toward the field environment.
Other datasets that contain LiDAR measurements either focus on other tasks, e.g., object detection and semantic segmentation [17], or are based on simulations. The InLiDa dataset [18] focuses on indoor environments, and uses 3D LiDAR to detect and segment indoor pedestrians and track them. SemanticKITTI [19] is a dataset created for semantic segmentation tasks in the autonomous driving field. The dataset maps the point cloud into semantic information, which presents the details of the objects in a complex point cloud with more detail. The introduction of semantic information provides the basis for higher level perception and decision making. KITTI-CARLA [20] is a dataset obtained using the CARLA v0.9.10 simulator based on a vehicle with sensors identical to the KITTI dataset. It provides error-free truth data compared to other datasets collected in the real world, which is a major advantage of this dataset. However, whether it is the LiDAR measurements or image data provided, there still exists a significant disparity between these simulated data and the real-world measurements. Thus, they cannot be considered as complete substitutes for real-world datasets. The RACECAR dataset [21], proposed by Kulkarni et al., is proposed for the investigation of high-speed autonomous racing. The onboard system in this dataset is equipped with three high-resolution solid-state LiDAR sensors. SimoSet [22], which is based on hybrid solid state LiDAR, is a dataset designed for 3D object detection from vehicles’ first-person perspective. Its scheme of building a data acquisition platform has referential importance for developing LiDAR SLAM experiment platforms.
The main LiDAR sensors used in the dataset introduced in this section are summarized in Table 1. As can be seen from the table, high-resolution LiDAR has been chosen for almost all the datasets, except for the Wild-places dataset [9] and the dataset presented in this paper. Although using the same type of low-resolution LiDAR as our dataset, the Wild-places dataset is oriented to SLAM tasks in the field environment, while our dataset is oriented to SLAM tasks in the urban road environment, resulting in significant differences between the two. For a more intuitive illustration of the difference between high-resolution LiDAR and low-resolution LiDAR, we compare two frames of typical point cloud data collected by the two kinds of LiDAR in Figure 1. The comparison is conducted in three aspects, namely, the time cost required for point cloud preprocessing, the number of points contained per frame, and the storage consumption. Here, the point cloud preprocessing only includes several basic processing methods, including converting range measurements into 3D coordinates, downsampling, and ground segmentation. As shown in the figure, the utilization of low-resolution LiDAR can significantly reduce the computational consumption as well as storage consumption.

Table 1.
Types and resolutions of LiDAR sensors used in different datasets.
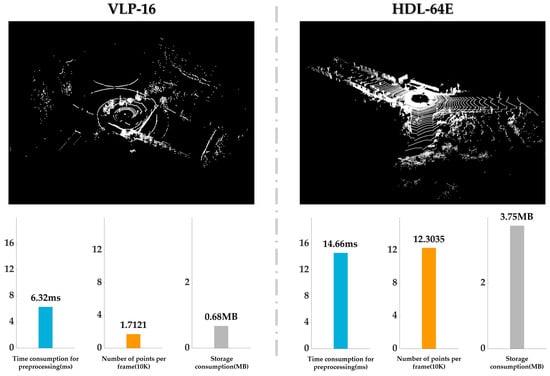
Figure 1.
Comparison between a typical frame of point cloud obtained using low-resolution LiDAR and one obtained using high-resolution LiDAR. The type of the high-resolution LiDAR and low-resolution are Velodyne HDL-64 and Velodyne VLP-16, respectively. The point cloud data are from our dataset and the KITTI dataset [7]. The time consumption for preprocessing, the numbers of points per frame, and the storage consumption for each of the two frames of the point cloud are shown in the bar chart in the lower part of the figure.
3. Components and Details of the Dataset
In this section, the dataset is introduced from six aspects: the sensors of the experimental platform, system components, the production of the ground truth data, multisensor calibration, experimental scenarios, and the structure of the dataset files.
3.1. Sensors
The sensors included in our experimental platform are listed as follows, and are illustrated in Figure 2.
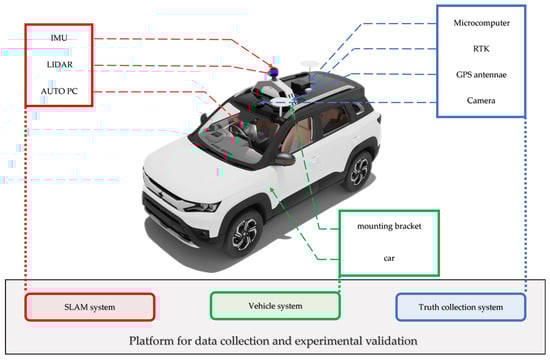
Figure 2.
Data collection systems.
- Velodyne VLP-16 3D LiDAR: 10 Hz, 16 beams, 0.1 degree angular resolution, 2 cm distance accuracy, collecting ∼57,000 points/second, effective range of 100 m, horizontal Field of View (FoV) 360°, vertical FoV 30°.
- Xsens MTi-630 IMU: 1 kHz, 9 axes, 0.2° roll and pitch angle accuracy, 1.5° yaw angle accuracy, 8°/h Gyro bias stability.
- FDI DETA100 RTK-GPS systems: 200 Hz, 0.05° roll and pitch angle accuracy, 1° yaw angle accuracy, 0.03 m/s speed accuracy.
- GoPro HERO 11 camera: 27.13 Megapixels, 5.3 K 60 fps/4 K 120 fps/2.7 K 240 fps supported, 16:9 wide angle screen.
It is important to note that we did not split the camera data into single frames of image data. This is because our dataset is still focused on the study of the LiDAR SLAM method, and the visual data are only used as a reference for qualitative evaluation.
3.2. System Setup
The data collection system of this research consists of three parts: the vehicle platform, ground truth system, and LiDAR SLAM module. The specific contents are as follows, and are demonstrated in Figure 2:
- Vehicle platform: A WULING Mini EV car is used as the mobile vehicle to carry various types of sensors and onboard computing devices. A customized mounting bracket is installed on the roof to connect and fix various sensors. The copilot position is fitted with a mounting bracket for the onboard computer, which is used for the main computational tasks of the SLAM module.
- Ground truth system: The ground truth system is responsible for collecting the precise position and pose value of the vehicle platform during experiments, and is utilized to quantitatively analyze and evaluate the pose estimation results output by the SLAM system. In terms of hardware, an RTK-supported INS-GNSS module with dual antennas is used. A microcomputer is installed on the roof to run the software of the RTK positioning module.
- SLAM module: The SLAM module is responsible for running the SLAM method in real time so that the validity of the dataset can be verified in real time as the data are collected. The hardware of the module is composed of LiDAR, an IMU, and a high-performance PC. The IMU is fixed at the bottom of the LiDAR bracket; the onboard PC is placed in the copilot seat. The proposed method [24] is used to jointly calibrate the LiDAR and IMU. The software of the module is implemented based on C++ language under the Robot Operating System (ROS) in Ubuntu 20.04.
3.3. Solution to the Errors Contained in the Height Value of the Ground Truth
During the process of collecting data, we found that when the vehicle revisited the same location, the ground truth module outputted different elevation values, which are supposed to be the same. This proves that there are significant errors in the elevation values obtained by RTK-based GPS. Based on this observation, we designed a method that can quantitatively evaluate the vertical drifts of a SLAM method without utilizing the elevation value of GPS measurements. Specifically, we strictly specified the start and end points of the data-collecting route to the same location. In this way, an error-free SLAM method should obtain the same elevation value at the end point as the initial state when using our dataset. In other words, the vertical drift of a SLAM method can be quantitatively assessed by comparing the difference in height between the start and end points. In practice, we physically marked the area where the start position of the vehicle was located using tape and barricades, as shown in Figure 3. When returning to the starting position, the vehicle utilizes these markers to come to a stop as close as possible to its starting position. Figure 3 shows that the vehicle stopped in almost the same position as the starting position in both experiments. By employing this approach, we ensured that the actual difference in height between the vehicles at the start point and the end point was less than 1 mm in both experiments.
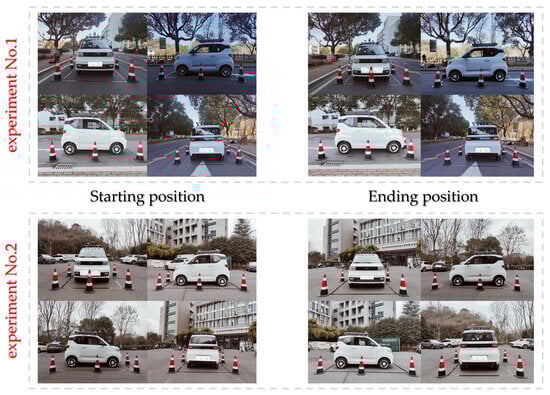
Figure 3.
Strictly delineated areas where the start position of the vehicle is located. The markers are composed of black tapes and barricades.
Figure 4b shows that the height estimations outputted by GPS at that area fluctuated by approximately 0.5 m due to tree and building obstructions, which is obviously inconsistent with the real-world situation (Figure 4a). This indicates that there were obvious errors in the height estimations provided by GPS at that time. Similar situations occurred several times during the data collection process. Taking the limitations of the length into consideration, not all of them are presented in this article. To address this problem, a linear interpolation method is proposed (1) for rectifying inaccurate height values. Here, , , , represent the timestamps and height values corresponding to the two known positions, respectively. The interpolation result is shown in Figure 4c. By employing this method, the height information can be more accurately restored.
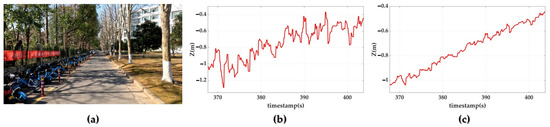
Figure 4.
Adjusted incorrect altitude information from GPS. (a) Picture of the real-word environments where large altitude error occurs. (b) Incorrect altitude measurements obtained by GPS. (c) Rectified altitude information.
3.4. Sensor Calibration and Motion Distortion Compensation
The exact mounting locations of the LiDAR, IMU, and RTK devices on the vehicle platform are shown in Figure 5. Denoting the body coordinate system of each of the three sensors IMU, LiDAR, and RTK as IMU, LiDAR, and RTK, the relative transformation between any two of the body coordinate systems is denoted as . Here, the superscript “•” and subscript “∗” refer to one of the three coordinate systems {IMU}, {LiDAR}, and {RTK}. For example, represents the relative transformation from the {LiDAR} to the {IMU} coordinate system. The method introduced in [24] is adopted in this research to identify the transformations between each coordinate system. All the calibration results are summarized in Table 2.
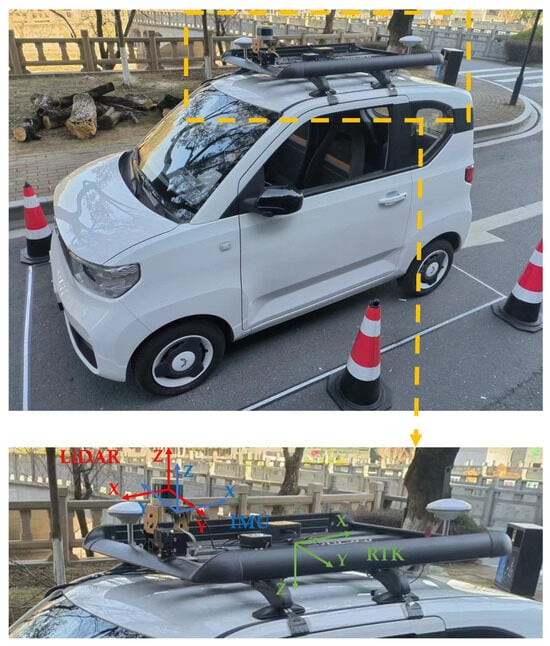
Figure 5.
The configuration and spatial arrangement of LiDAR, IMU, and RTK devices. Their body coordinate systems are marked in red, blue, and green, respectively.
Table 2.
Relative transformation of sensors.
Based on the calibration results, the IMU data are used to rectify the motion distortion of the raw LiDAR measurements. Specifically, the IMU data are firstly transformed to the LiDAR coordinate systems using and represented in quaternion form. The IMU data are then interpolated using the Slerp function (2) according to the timestamp of each scan-line in the point cloud. Here, the subscript t denotes the timestamp of a particular scan-line, while and denote the initial and final poses during the scanning process of a given frame point cloud, respectively. Finally, the pose obtained using (2) is used to compensate the motion distortion of the point cloud. An example result of motion distortion compensation is shown in Figure 6.
Figure 6.
The results of motion distortion compensation. The original and rectified point clouds are visualized in white and red, respectively.
3.5. Overview of Experimental Scenarios
The ZUST Campus dataset consists of two sub-datasets, which are named as Experiment No. 1 and Experiment No. 2, respectively. Both of them were collected at Xiaoheshan Campus, ZUST. The data collection routes were carefully designed to encompass a wide range of challenging situations for the LiDAR SLAM method toward autonomous driving. Figure 7 demonstrates the data collection routes represented by GPS measurements overlaid on satellite images. The lengths of the two routes in Experiment No. 1 and Experiment No. 2 are 1.78 km and 1.85 km, respectively. The challenging scenarios presented in the ZUST Campus dataset, such as dynamic scenarios, degradation scenarios, steep slopes, and loop closure detection scenarios, are demonstrated in Figure 8. Through the ZUST campus dataset, the performance of a LiDAR SLAM method in a variety of challenging scenarios as well as its generalization ability can be effectively examined.
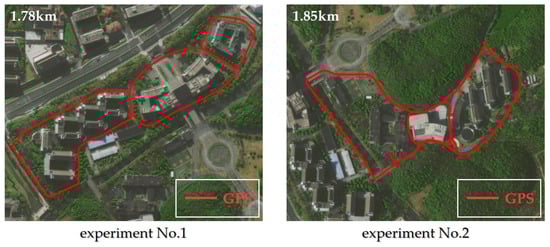
Figure 7.
The data collection routes overlaid on satellite images.
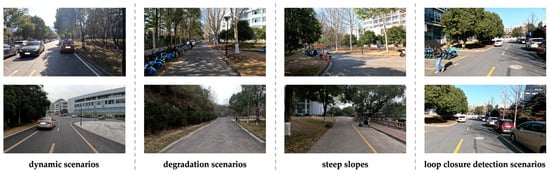
Figure 8.
Pictures of the representative scenarios in the ZUST Campus dataset.
3.6. Description of the Data Files
All the sensor measurements in the two experiments and the LiDAR SLAM results are stored in two directories, Experiment No. 1 and Experiment No. 2, respectively. Both directories contain the same subdirectories, as shown in Figure 9. The specific contents of these subdirectories are summarized as follows:
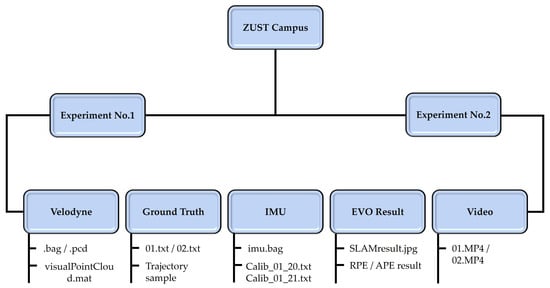
Figure 9.
The structure of the provided files.
- Velodyne: The point cloud data obtained from Velodyne VLP-16 are stored in two formats, the BAG file and the PCD file. When running point cloud data using ROS, the reader can use the BAG files. For visualizing point clouds using the MATLAB code provided, the PCD files are recommended.
- Ground Truth: According to the storage format used in [25], the ground truth data are stored in the TXT files in TUM format. We provide the trajectory sample file to facilitate readers to view the length of the ground truth and the position in the satellite map.
- IMU: The IMU measurements are stored in the BAG files. The calibration results are stored in the TXT file in the following format .
- EVO Result: For the evaluation results of the three LiDAR SLAM algorithms, the JPG files display the outputted mapping results and the trajectories of SLAM methods. The ATE/RPE (Absolute Trajectory Error/Relative Pose Error) result files hold the evaluation results of the LiDAR SLAM method.
- Video: The process of collecting data is recorded in an MP4 format video file.
4. Experiments
In order to verify the utility and the usability of the ZUST Campus dataset developed in this research, we comprehensively tested the dataset using three state-of-the-art LiDAR SLAM methods. These three methods are LOAM [4], LeGO-LOAM [5], and GP-SLAM+ [6]. The first two methods are representative research works in the branch of LiDAR odometry. The third approach is one of our previous works and is a novel approach in the field of LiDAR SLAM, exhibiting outstanding performance. The source code of GP-SLAM+ can be referenced from an upgraded version called SLAMesh [26]. Extensive previous works have been conducted on these three methods using high-resolution LiDAR datasets [7,23], while comparatively limited investigation has been carried out on these three methods based on low-resolution LiDAR datasets. The experimental results presented in this study not only validate the practicality of our dataset but also provide a comprehensive analysis of the performance of the three methods for low-resolution point clouds, thereby offering valuable insights to complement existing research. The evaluation experiments were run on a 16-core Intel i7-13700KF CPU @3.4 GHz PC. Parameters for each method have been optimized, respectively, to achieve the best results.
The mapping results of the three methods are qualitatively presented in Figure 10. By comparing the satellite map in Figure 7, it can be found that all three methods have obtained consistent mapping results. These results fully demonstrate the utility of the proposed dataset. Note that the maps constructed by the three methods differ in the density of the point clouds. The point cloud map produced by GP-SLAM+ appears to be sparser than the other two. The reason for this is that the GP-SLAM+ employs a different map construction approach. While LOAM and LeGO-LOAM utilize the raw point cloud obtained after voxel filtering as the mapping results, the GP-SLAM+ method adopts a reconstruction of the point cloud using a Gaussian process and makes the constructed map lightweight. Although relatively sparse, the maps constructed by GP-SLAM+ are dense enough to cope with common tasks in autonomous driving such as path planning and object recognition.
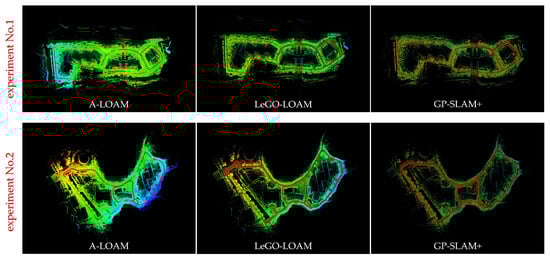
Figure 10.
The experimental results of the three LiDAR SLAM methods. The colored dots represent the point cloud maps; the red line represent the estimated trajectories; the colors represent the height of the points.
In Figure 11, we compare the estimated trajectories of each method from a Bird’s Eye View (BEV) using the ground truth data as reference. From this figure, GP-SLAM+ and LeGO-LOAM achieved more accurate results compared to LOAM. For quantitative evaluation, we use both the ATE and RPE [25] to calculate the errors between the position and pose estimations and the ground truth for each method. We denote the estimated 6DoF state vector and the ground truth state vector as and , respectively, and the ATE and RPE are calculated as (3) and (4), respectively. Here, S is the rigid translation matrix for the trajectory alignment and m is the number of the poses.
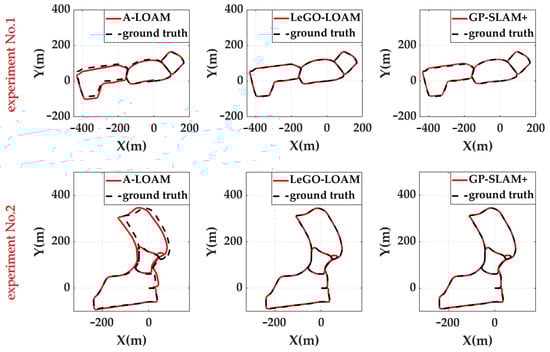
Figure 11.
Estimated trajectories of each method compared to the ground truth. Red lines indicate the estimated trajectories output by SLAM methods. Black line indicates the ground truth of trajectory.
The calculated ATEs and RPEs are listed in Table 3. The results presented in Table 3 show that the translation and rotation outputs of LeGO-LOAM are more consistent with the ground truth when using ATE as the criterion. This is due to the fact that LeGO-LOAM is the only one of the three methods that includes a loop closure procedure. When a loop is detected, LeGO-LOAM optimizes the calculated poses globally. This makes the poses output by LeGO-LOAM more consistent with the way ATE is evaluated. Meanwhile, the GP-SLAM+ method exhibits some promising results. Being a frontend-only method, GP-SLAM+ achieves comparable results in most cases and even surpasses LeGO-LOAM in Experiment No. 2 under the RPE criterion. Although the evaluation results of LOAM are slightly worse compared to those of the other two benchmark methods, it still has a significant advantage over most of the LiDAR SLAM methods that were not included in this research.
Table 3.
Quantitative evaluation results of each method based on the ZUST Campus dataset. We present the ATE and RPE accuracy of each algorithm in terms of the whole (full), translation (trans part), and rotation (rot part). The left and right sides of “/” represent the positioning accuracy of each algorithm in Experiment No. 1 and No. 2, respectively. The data with the highest accuracy are highlighted in red.
As previously mentioned, the ground truth data obtained by RTK-based GPS contain errors with respect to elevation. To accurately assess the precision of the LiDAR SLAM method, we designed a method that quantifies vertical drift by comparing the difference in height (Z) between the start and end points of the trajectories. The evaluation results obtained this way are shown in Figure 12. The Z measurements of LOAM, LeGO-LOAM, and GP-SLAM+ in Experiment No. 1 are 5.2832 m, 0.0761 m, and 0.0220 m, respectively, whereas in Experiment No. 2 they are 12.2070 m, 0.0158 m, and 0.0264 m. Similar to the results obtained using ATE and RPE, GP-SLAM+ achieved comparable results to LeGO-LOAM when relying solely on the frontend. In contrast, LOAM performed the worst out of the three methods. The local map presented in Figure 12 provides qualitative support for these results, demonstrating the validity of the proposed evaluation method. This method can serve as a useful supplement to the ground truth data and is a unique advantage of our dataset over other datasets.
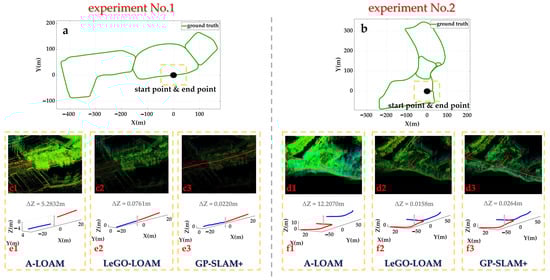
Figure 12.
The evaluation results obtained using the evaluation method proposed in this paper, which calculates vertical drift based on the difference in height between the starting and ending points. The positions of the starting/end point relative to the whole trajectory in both experiments are shown in (a,b), where green lines indicate the trajectories. The local mapping results of the three methods in the vicinity of the start/end point highlighted by the yellow boxes are illustrated by (c1–c3) and (d1–d3) for the two experiments, respectively. The local estimated trajectories of the three methods near the start/end point are demonstrated by (e1–e3) and (f1–f3) for the two experiments, respectively. The departure and return sections are represented by solid red and blue lines, respectively. The differences in height are depicted using gray lines with corresponding values.
5. Conclusions
In this paper, an applicable LiDAR dataset is proposed to address the problems and shortcomings of existing works related to the datasets oriented toward the LiDAR SLAM tasks in the field of autonomous driving. Compared to other datasets based on high-resolution LiDAR sensors, ours is obtained by LiDAR with low resolution, which makes our dataset lightweight and more suitable for platforms with low computing power. To address errors in GPS-based ground truth data related to elevation values, we propose a series of customized methods. Compared to other datasets, our dataset can provide more reliable and accurate ground truth data. The joint calibration of LiDAR and the IMU is also improved, which dramatically enhances the precision of the point cloud. The utility and usability of the dataset are thoroughly tested through a series of experiments using three state-of-the-art LiDAR SLAM methods. The dataset presented in this paper constitutes a valuable supplement to the existing research works on datasets toward the study of 3D LiDAR SLAM. In future work, we aim to produce a LiDAR SLAM dataset using cost-effective solid-state LiDARs.
Author Contributions
Conceptualization, B.L. and Y.H.; methodology, B.L. and Y.H.; software, Y.H., B.L. and J.R.; validation, Y.H. and B.L.; formal analysis, Y.H. and B.L.; investigation, Y.H. and B.L.; resources, B.H.; data curation, Y.H. and B.L.; writing—original draft preparation, Y.H., B.L. and J.R.; visualization, Y.H. and B.L.; supervision, A.Y.; project administration B.L. and B.H.; funding acquisition, B.L. and B.H. All authors have read and agreed to the published version of the manuscript.
Funding
This research was funded by the Research Project of Zhejiang Provincial Department of Education, China (Y202249488), and the “Pioneer” and “Leading Goose” R&D Program of Zhejiang, China (2022C04012).
Data Availability Statement
The dataset can be found at https://github.com/GPumaLi/ZUST-Campus (accessed on 2 March 2024).
Conflicts of Interest
The authors declare no conflicts of interest.
References
- Mur-Artal, R.; Montiel, J.; Tardos, J. ORB-SLAM: A versatile and accurate monocular SLAM system. IEEE Trans. Robot. 2015, 31, 1147–1163. [Google Scholar] [CrossRef]
- Mur-Artal, R.; Tardós, J.D. ORB-SLAM2: An Open-Source SLAM System for Monocular, Stereo, and RGB-D Cameras. IEEE Trans. Robot. 2017, 33, 1255–1262. [Google Scholar] [CrossRef]
- Cvisic, I.; Markovic, I.; Petrovic, I. SOFT2: Stereo Visual Odometry for Road Vehicles Based on a Point-to-Epipolar-Line Metric. IEEE Trans. Robot. 2023, 39, 273–288. [Google Scholar] [CrossRef]
- Ji, Z.; Singh, S. LOAM: Lidar Odometry and Mapping in Real-Time. In Proceedings of the Robotics: Science and Systems Conference (RSS), Berkeley, CA, USA, 12–14 July 2014. [Google Scholar]
- Shan, T.; Englot, B. LeGO-LOAM: Lightweight and Ground-Optimized Lidar Odometry and Mapping on Variable Terrain. In Proceedings of the 2018 IEEE/RSJ International Conference on Intelligent Robots and Systems (IROS), Madrid, Spain, 1–5 October 2018; pp. 4758–4765. [Google Scholar]
- Ruan, J.; Li, B.; Wang, Y.; Fang, Z. GP-SLAM+: Real-time 3D lidar SLAM based on improved regionalized Gaussian process map reconstruction. In Proceedings of the IEEE/RSJ International Conference on Intelligent Robots and Systems, IROS 2020, Las Vegas, NV, USA, 24 October–24 January 2020; pp. 5171–5178. [Google Scholar]
- Geiger, A.; Lenz, P.; Stiller, C.; Urtasun, R. Vision meets robotics: The KITTI dataset. Int. J. Robot. Res. 2013, 32, 1231–1237. [Google Scholar] [CrossRef]
- Maddern, W.; Pascoe, G.; Linegar, C.; Newman, P. 1 Year, 1000 km: The Oxford RobotCar Dataset. Int. J. Robot. Res. 2017, 36, 3–15. [Google Scholar] [CrossRef]
- Geyer, J.; Kassahun, Y.; Mahmudi, M.; Ricou, X.; Durgesh, R.; Chung, A.S.; Hauswald, L.; Pham, V.H.; Mühlegg, M.; Dorn, S.; et al. A2d2: Audi autonomous driving dataset. arXiv 2020, arXiv:2004.06320. [Google Scholar]
- Caesar, H.; Bankiti, V.; Lang, A.H.; Vora, S.; Liong, V.E.; Xu, Q.; Krishnan, A.; Pan, Y.; Baldan, G.; Beijbom, O. nuScenes: A multimodal dataset for autonomous driving. arXiv 2019, arXiv:1903.11027. [Google Scholar]
- Roynard, X.; Deschaud, J.E.; Goulette, F. Paris-Lille-3D: A large and high-quality ground-truth urban point cloud dataset for automatic segmentation and classification. Int. J. Robot. Res. 2018, 37, 545–557. [Google Scholar] [CrossRef]
- Alibeigi, M.; Ljungbergh, W.; Tonderski, A.; Hess, G.; Lilja, A.; Lindström, C.; Motorniuk, D.; Fu, J.; Widahl, J.; Petersson, C. Zenseact open dataset: A large-scale and diverse multimodal dataset for autonomous driving. In Proceedings of the IEEE/CVF International Conference on Computer Vision (ICCV), Paris, France, 1–6 October 2023; pp. 20178–20188. [Google Scholar]
- Pandey, G.; McBride, J.R.; Eustice, R.M. Ford campus vision and lidar data set. Int. J. Robot. Res. 2011, 30, 1543–1552. [Google Scholar] [CrossRef]
- Jeong, J.; Cho, Y.; Shin, Y.S.; Roh, H.; Kim, A. Complex Urban LiDAR Data Set. In Proceedings of the 2018 IEEE International Conference on Robotics and Automation (ICRA), Brisbane, QLD, Australia, 21–25 May 2018. [Google Scholar]
- Blanco-Claraco, J.L.; Moreno-Dueñas, F.Á.; González-Jiménez, J. The Málaga urban dataset: High-rate stereo and LiDAR in a realistic urban scenario. Int. J. Robot. Res. 2014, 33, 207–214. [Google Scholar] [CrossRef]
- Knights, J.; Vidanapathirana, K.; Ramezani, M.; Sridharan, S.; Fookes, C.; Moghadam, P. Wild-places: A large-scale dataset for lidar place recognition in unstructured natural environments. In Proceedings of the 2023 IEEE International Conference on Robotics and Automation (ICRA), London, UK, 29 May–2 June 2023; pp. 11322–11328. [Google Scholar]
- Alqobali, R.; Alshmrani, M.; Alnasser, R.; Rashidi, A.; Alhmiedat, T.; Alia, O.M. A Survey on Robot Semantic Navigation Systems for Indoor Environments. Appl. Sci. 2024, 14, 89. [Google Scholar] [CrossRef]
- Romero-González, C.; Villena, Á.; González-Medina, D.; Martínez-Gómez, J.; Rodríguez-Ruiz, L.; García-Varea, I. Inlida: A 3d lidar dataset for people detection and tracking in indoor environments. In Proceedings of the 12th International Joint Conference on Computer Vision, Imaging and Computer Graphics Theory and Applications (VISIGRAPP), Porto, Portugal, 27 February–1 March 2017; pp. 484–491. [Google Scholar]
- Behley, J.; Garbade, M.; Milioto, A.; Quenzel, J.; Behnke, S.; Stachniss, C.; Gall, J. SemanticKITTI: A Dataset for Semantic Scene Understanding of LiDAR Sequences. In Proceedings of the 2019 IEEE/CVF International Conference on Computer Vision (ICCV), Seoul, Republic of Korea, 27 October–2 November 2019; pp. 9297–9307. [Google Scholar]
- Deschaud, J.E. KITTI-CARLA: A KITTI-like dataset generated by CARLA Simulator. arXiv 2021, arXiv:2109.00892. [Google Scholar]
- Kulkarni, A.; Chrosniak, J.; Ducote, E.; Sauerbeck, F.; Saba, A.; Chirimar, U.; Link, J.; Behl, M.; Cellina, M. RACECAR—The Dataset for High-Speed Autonomous Racing. In Proceedings of the 2023 IEEE/RSJ International Conference on Intelligent Robots and Systems (IROS), Detroit, MI, USA, 1–5 October 2023; pp. 11458–11463. [Google Scholar]
- Sun, X.; Jin, L.; He, Y.; Wang, H.; Huo, Z.; Shi, Y. SimoSet: A 3D Object Detection Dataset Collected from Vehicle Hybrid Solid-State LiDAR. Electronics 2023, 12, 2424. [Google Scholar] [CrossRef]
- Pham, Q.H.; Sevestre, P.; Pahwa, R.S.; Zhan, H.J.; Pang, C.H.; Chen, Y.D.; Mustafa, A.; Chandrasekhar, V.; Lin, J. A*3D Dataset: Towards Autonomous Driving in Challenging Environments. In Proceedings of the IEEE International Conference on Robotics and Automation, Paris, France, 31 May–15 June 2020; pp. 2267–2273. [Google Scholar]
- Le Gentil, C.; Vidal-Calleja, T.; Huang, S. 3D LiDAR-IMU calibration based on upsampled preintegrated measurements for motion distortion correction. In Proceedings of the 2018 IEEE International Conference on Robotics and Automation (ICRA), Brisbane, QLD, Australia, 21–25 May 2018; pp. 2149–2155. [Google Scholar]
- Sturm, J.; Engelhard, N.; Endres, F.; Burgard, W.; Cremers, D. A benchmark for the evaluation of RGB-D SLAM systems. In Proceedings of the 2012 IEEE/RSJ International Conference on Intelligent Robots and Systems, Algarve, Portugal, 7–12 October 2012; pp. 573–580. [Google Scholar]
- Ruan, J.; Li, B.; Wang, Y.; Sun, Y. SLAMesh: Real-time LiDAR Simultaneous Localization and Meshing. In Proceedings of the International Conference on Robotics and Automation (ICRA), London, UK, 29 May–2 June 2023; pp. 3546–3552. [Google Scholar]
Disclaimer/Publisher’s Note: The statements, opinions and data contained in all publications are solely those of the individual author(s) and contributor(s) and not of MDPI and/or the editor(s). MDPI and/or the editor(s) disclaim responsibility for any injury to people or property resulting from any ideas, methods, instructions or products referred to in the content. |
© 2024 by the authors. Licensee MDPI, Basel, Switzerland. This article is an open access article distributed under the terms and conditions of the Creative Commons Attribution (CC BY) license (https://creativecommons.org/licenses/by/4.0/).