Article

Impact Analysis of High-Altitude Electromagnetic Pulse Coupling Effects on Power Grid Protection Relays

1
EECS Department, University of Tennessee at Knoxville, Knoxville, TN 37996, USA
2
Oak Ridge National Laboratory, Oak Ridge, TN 37830, USA
*
Authors to whom correspondence should be addressed.
Electronics 2024, 13(7), 1336; https://doi.org/10.3390/electronics13071336
Submission received: 9 February 2024 / Revised: 27 March 2024 / Accepted: 29 March 2024 / Published: 2 April 2024
(This article belongs to the Section Circuit and Signal Processing)

Abstract

:
Protection relays are important equipment used for protection, control, and metering functions in the power grid. These relays are used to protect critical and difficult-to-replace equipment, like generators, transformers, and capacitor banks. Once the protection devices are disturbed or damaged, a high risk of power generation interruption occurs. Therefore, it is important and necessary to study the relay’s immunity to electromagnetic pulse (EMP) events. As a preliminary step toward empirical experimentation on actual equipment, this manuscript outlines an economical and efficient methodology for evaluating the impact of an EMP. An impedance measurement strategy was employed to model the equipment, setting the stage for subsequent immunity analyses. These analyses included the pulse current injection (PCI) method, which utilized an injecting probe to introduce the transient, and frequency domain electromagnetic (FEKO) simulation, which integrated electromagnetic coupling effects into the transient simulation. The impedance measurement and simulation results in this paper provide a reliable basis for gauging equipment performance in the face of HEMP threats. The results obtained using the PCI and FEKO simulations demonstrated the performance of different port responses under a high-altitude EMP, indicating the requirement for some protection to ensure the reliable operation of relays.

1. Introduction

In response to the heightened interest of the U.S. government [1] and commercial interest in safeguarding energy infrastructure against electromagnetic threats, the impact of an electromagnetic pulse (EMP) on power systems has garnered substantial attention [2]. An EMP is essentially an electromagnetic shock wave [3] that generates a potent electromagnetic field capable of inducing transient voltages in the thousands of volts on exposed conductors, including wires and conductive tracks on printed circuit boards.
Although EMPs pose no direct lethal threat to humans, they can inflict irreversible damage on a broad spectrum of electrical and electronic equipment. The extent of this damage is comparable with that caused by nearby lightning strikes, often necessitating complete equipment replacement or significant repairs. Regardless of its origin, whether natural or maliciously induced, EMPs are categorized as high-impact, low-probability events within power grids [4]. Consequently, developing effective modeling and mitigation strategies is imperative to enhance grid resilience, and thus, has attracted significant national and global interest [5,6,7].
The generic waveform of a high-altitude electromagnetic pulse (HEMP) signal encompasses three distinct phases—E1 (early time), E2, and E3—as illustrated in Figure 1. EMP signals include both a nuclear electromagnetic pulse (NEMP), which is generated from meso-atmospheric nuclear detonations, and a lightning electromagnetic pulse (LEMP) generated from lightning. Various electromagnetic (EM) environments possess spectral content over different frequency ranges. The early-time component of HEMP, i.e., E1, rises within ten nanoseconds and exhibits the highest radiation levels and poses the most severe transient impact, warranting considerable concern. E1 exhibits a wide-band spectral content. The subsequent phases, i.e., E2 and E3, are similar to lightning EMP and geomagnetic disturbances, respectively, and their duration can range from microseconds to minutes for E2 and E3, respectively.
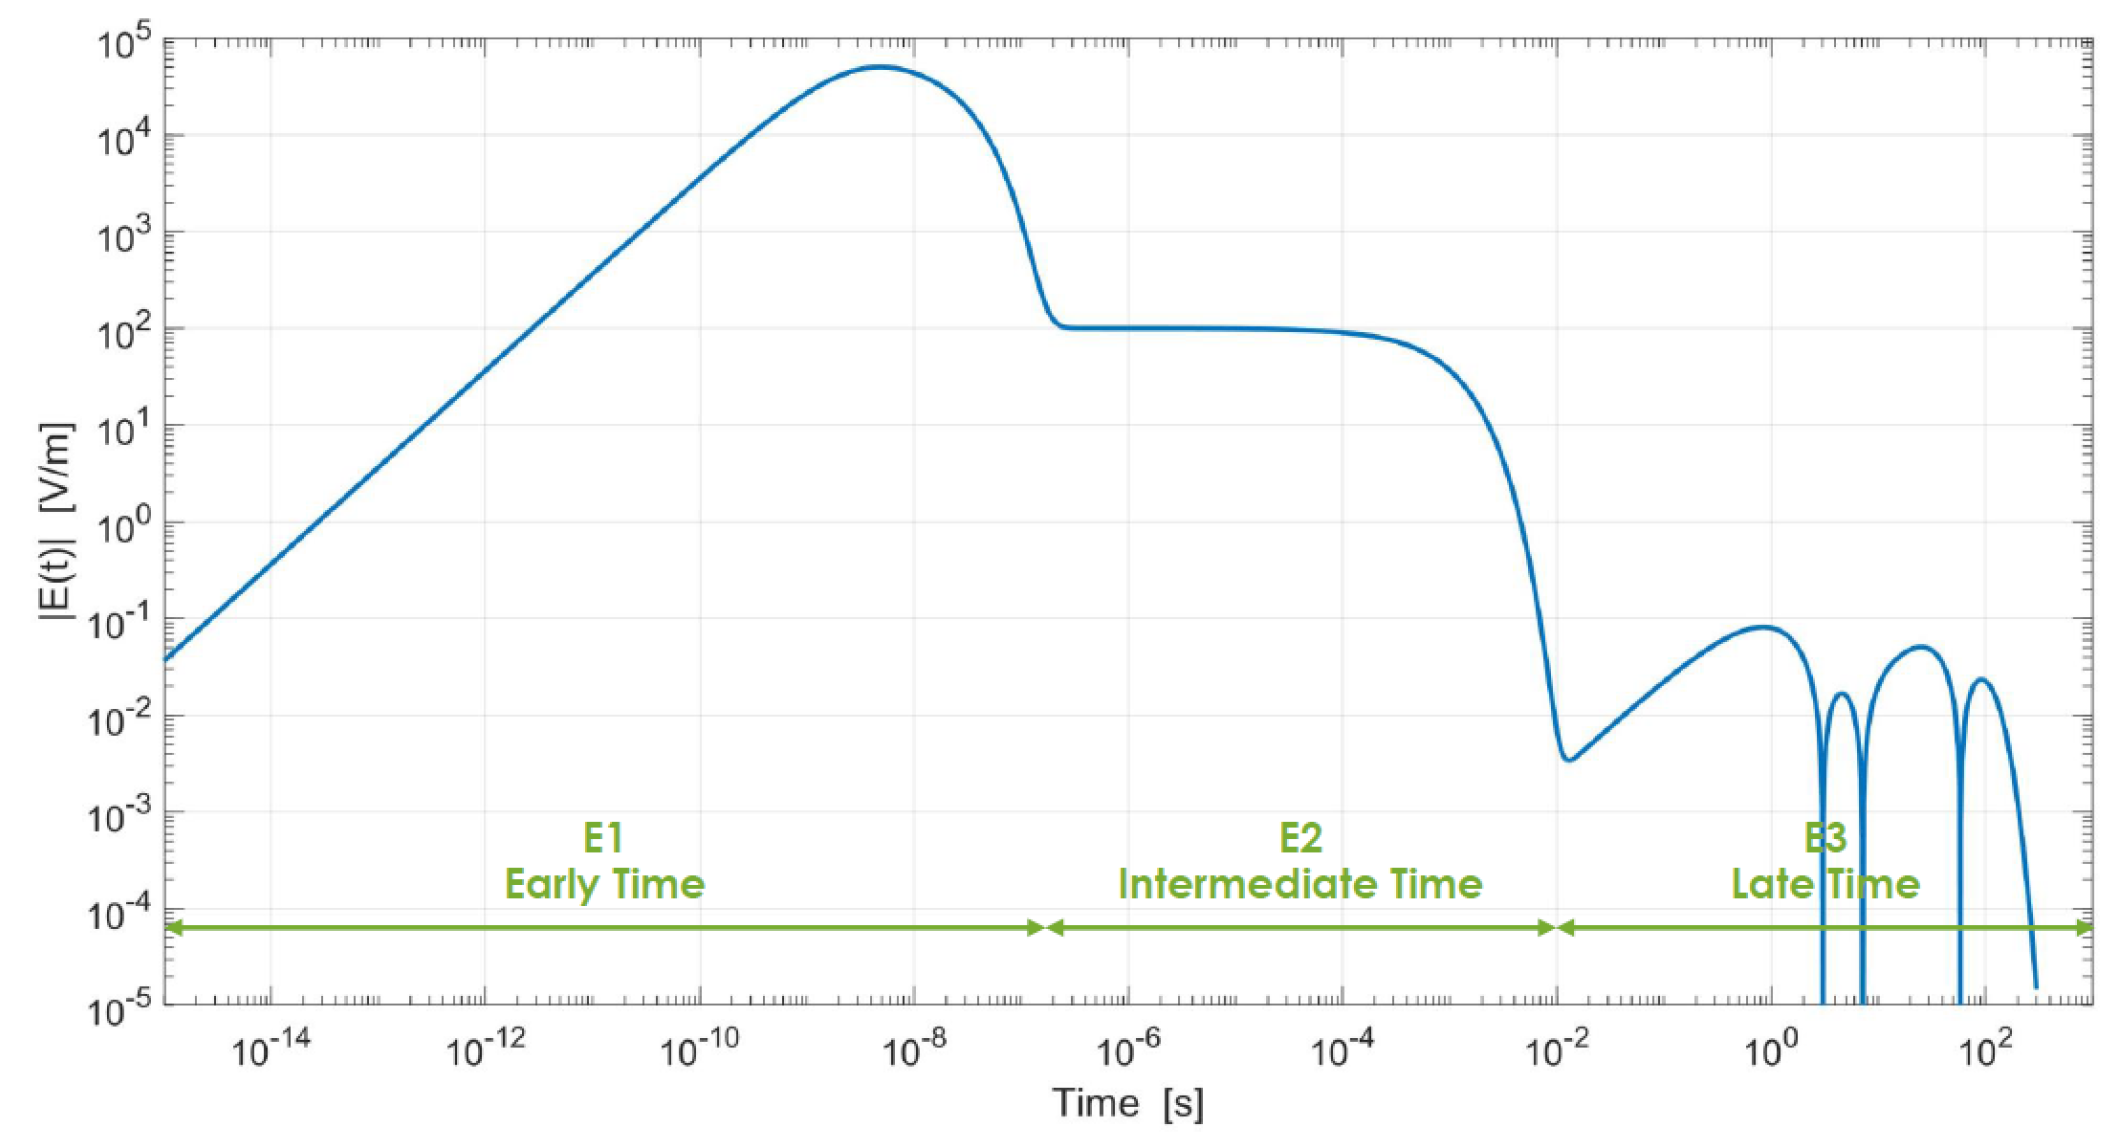
  • The component of primary interest for this work was the early-time (E1) element. A high-altitude electromagnetic pulse event is capable of inflicting catastrophic damage on electrical infrastructure across an expansive area [9]. In scenarios involving high-altitude nuclear explosions, terrestrial electrical power systems are particularly susceptible to HEMP effects. The most notable direct encounter with an E1 HEMP occurred during a high-altitude nuclear test by the USA in 1962, which was conducted 400 km above the mid-Pacific Ocean. The repercussions of this test were felt over 1445 km away in Hawaii, with more than 300 reports of equipment damage, affecting streetlights, burglar alarms, and a microwave link [10]. This incident underscored the substantial threat posed by EMPs to power system infrastructure.
  • The E2 phase of a HEMP exhibits many similarities to lightning, particularly regarding its timing [11]. E2 couples to electrical equipment via airborne mechanisms, more akin to the E1 pulse than to lightning. Nonetheless, the effects of an E2 HEMP closely resemble those of lightning strikes [12]. Despite this, E2 is generally not viewed as a significant threat, primarily due to its relatively low amplitude of approximately 0.1 kV/m. Various devices, such as lightning surge arresters, are effective in protecting against both lightning and E2 pulses. However, the predominant concern is that an E2 pulse often follows the more destructive E1 pulse. If lightning surge arresters or other protective measures are compromised by an E1 pulse, the subsequent E2 can cause significant damage to components.
  • Similarly, the E3 HEMP phase and geomagnetic disturbances share characteristics that render them comparable in terms of their impacts and the damages they cause [13,14]. These disturbances couple efficiently with long transmission lines, potentially generating ground-induced currents in the range of hundreds to thousands of amperes. For instance, in 1989, a geomagnetic storm damaged a Hydro Quebec transformer and capacitor, leading to a shutdown of 21 gigawatts of power supply within one minute [15]. This event plunged the entire province of Quebec, Canada, into darkness for over nine hours. E3-induced currents are low frequency, and thus, may saturate magnetic equipment, such as transformers.
While a building’s physical structure offers some degree of protection against external radiative electromagnetic attacks, the effectiveness of this shielding varies significantly with the construction material, frequency, and the specific location within the facility. Even a HEMP signal, when coupled into a facility, may retain enough energy to inflict considerable disruption or damage, despite any attenuating effect of the structure [16,17].
Moreover, the interaction between HEMP and the transmission line networks of these systems warrants thorough investigation [18]. Equipment connected to long cables or wires is especially vulnerable, as these conductors can function like antennas, both capturing and propagating electromagnetic energy to all interconnected components.
Protection relays are widely installed in substations and are utilized for power grid protection [19]. It was proposed that the E1 component of an HEMP is likely to disrupt and potentially damage protective relays, not uniformly, but in statistically significant numbers [1]. Without adequate protection, the resultant damage or degradation from E1 exposure could precipitate not only immediate harm to these critical devices but also subsequent damage to high-value assets through transient currents during system collapse, which is further compounded by the effects of E2 and E3 components, despite their relatively small magnitudes. Consequently, this study focused on a series of protection relays, with the aim to understand their responses to electromagnetic threats.
As a foundational step and a precursor to empirical experimentation on the actual equipment, this study delineated an economic and efficient methodology for analyzing the impact of an HEMP, particularly its E1 component with high magnitude, upon the ports of protection devices. The analysis framework was segmented into three distinct phases: a device modeling process, an immunity analysis leveraging the pulse current injection (PCI) method, and a comprehensive evaluation that utilized frequency domain electromagnetic simulation (FEKO). These methodological steps were designed to offer a granular understanding of the electromagnetic coupling effects and their implications on protection equipment. The insights gleaned from this analysis aimed to aid in the identification of system vulnerabilities, paving the way for the formulation of efficacious mitigation strategies to bolster the resilience of protection devices against HEMP-induced adversities.
The initial phase of the device modeling was marked by the impedance measurement process, which was a crucial step that formed the basis for precise electromagnetic analysis. This analysis was facilitated by a variety of instruments, including meters, impedance analyzers (IAs), and vector network analyzers (VNAs). Given the varied strengths and directions of EMPs within electric or magnetic fields, the impedance measurement incorporated a broad frequency range, spanning from low hertz levels to high gigahertz levels. Conversely, while [9] highlighted that a significant portion of an HEMP’s energy content is situated below 100 MHz, a study by [20] affirmed that the measurement accuracy of these instruments is reliably sufficient within this 100 MHz range. This characteristic underscores the importance of a comprehensive frequency range in impedance measurement, ensuring that analyses accurately reflect the predominant energy content and its implications under HEMP conditions.
In the subsequent phase, impedance measurements garnered from various instruments were meticulously integrated into an impedance model. This model delineated the port characteristics of the device, setting the stage for the following simulation tests. Specifically articulated through impedance–frequency curve data and Touchstone files, this model enabled the precise representation of the device under test in simulations that involved pulsed current injection or electromagnetic field simulation.Such a detailed modeling approach was pivotal in ensuring the accuracy of the simulations.
To delve into the EMP analysis, the first efficient method was the PCI method [21]. The PCI test involved using an injecting probe to introduce an electromagnetic (EM) threat-retable transient onto the cables of the device under test (DUT) and then observing the DUT’s resilience to this type of stress waveform. By using both common mode and single wire-to-ground noise injection, the PCI enabled more precise screening and detection of key ports than radiated tests, which submerge the system entirely in the electromagnetic field [22]. A PCI circuit network was established based on IEC 61000-4-25 [23] to generate a sine wave and a double-exponential wave to subsequently be applied to the port. Finally, by utilizing the measured impedance as the load for the PCI generator, the PCI simulation computed the transient voltage and current responses due to the EMP across various ports.
The second simulation method was conducted to analyze the relay’s transient response when exposed to an intense EMP. This method utilized a frequency domain electromagnetic simulation in Altair FEKO software. Electric and magnetic field values were numerically calculated via the method of moments computation scheme, and thus, surge currents induced on a conducting line from plane wave EM radiation could be determined. By incorporating the relay devices as frequency-dependent loads in the simulation model, an accurate frequency domain response could be simulated. Subsequently, via convolution of the frequency domain results and a time dependent signal, the transient response of the relay was captured. This simulation method accounted for the effects from the EM cable coupling, and thus, this was an alternative means of emulating in-service, connected relay devices. Work performed by the Oak Ridge National Laboratory [24] investigated HEMP coupling to devices inside a power generation facility by employing a similar simulation methodology.
The remainder of this paper is organized as follows: Section 2 introduces all the equipment, including the protection relays and impedance measurement instruments. Section 3 demonstrates the processes of impedance measurement, de-embedding, and data integration. Thereafter, Section 4 discusses simulating the HEMP impact on protection relays by two methods. Interesting results for both simulations and the impedance measurements are demonstrated in Section 5. Finally, the conclusions are drawn in Section 6.

2. Equipment Illustration

2.1. Protection Relays

A historical parallel is evident between the evolution of fault locating and phasor measurements in digital relays [25]. In the 1980s, the deployment of stand-alone fault locators was constrained due to their high cost, leading to their use primarily on critical and problematic lines. However, the integration of fault-locating capabilities into distance relays marked a significant change, rapidly gaining acceptance. Within a decade, the absence of such features in distance relays became unthinkable.
In parallel, since the year 2000, stand-alone synchronized phasor-measuring devices, specifically phasor measurement units (PMUs) [26,27], have been introduced into fault detection. These PMUs [28], which are known for their high accuracy in synchronized phasor measurements, provide comprehensive information that is essential for system fault diagnosis, including detection, classification, and localization. Following this trend, protection relays now incorporate synchronized phasor measurement capabilities [25].
With the integration of multiple modules and functions, modern protection relays have evolved into complex protection systems, catering to either lines or equipment protection [29]. The key components of these systems are summarized as follows [30]:
  • Current transformer (CT) and voltage transformer (VT): these components reduce the current or voltage of a device to a measurable level.
  • Protection relay: receives measurement signals from the secondary sides of CTs and VTs to determine whether the protected line or equipment is under stress.
  • Circuit breaker: operates based on the commands from the protection relay, opening when a fault is detected and closing after the fault is cleared.
  • Communication module: facilitates the transmission of information and measurements from one relay to another receiving relay or substation.
In line with this, the IEEE C37.90 standard [31] defines a relay as follows: “A relay is an electric device designed to respond to input conditions in a prescribed manner and, after specified conditions are met, to cause contact operation or similar abrupt change in associated electric control circuits”. These relays play a pivotal role in identifying faults by measuring electrical variations in a power system under both normal and intolerable conditions [32].

2.1.1. Description of Protection Relays

The protection relays examined in this study were part of the Multilin Universal Relay (UR) from General Electric, including the D60 Line Distance Protection System (D60), the T60 Transformer Protection System (T60), and the C70 Capacitor Bank Protection and Control System (C70). These relays are typically installed in substations connected to transmission lines, which may induce energy from a HEMP event.
The D60 is a high-end, cost-effective distance protection relay designed for the protection of transmission lines and cables [33]. It is a microprocessor-based relay that is suitable for three-pole and single-pole tripping applications without series compensation, with series compensation, and near-series compensation.
The T60 is an advanced three-phase transformer relay tailored for the protection of medium and large power transformers [34]. It features automatic or user-defined magnitude reference winding selections for CT ratio matching and provides automatic phase shift compensation for various transformer winding connections.
The C70 offers both bank and system protection schemes for shunt capacitor bank protection [35]. Its current- and voltage-based protection functions are engineered to deliver sensitive protection for a wide range of capacitor bank configurations, including grounded, ungrounded, single, and parallel banks, as well as those with taps.

2.1.2. Determination of Measurement Ports

Protection relays, including the D60, T60, and C70 models, were found to be versatile in safeguarding a range of critical components within power systems. Since they are specifically designed for the protection of transmission lines, cables, capacitor banks, and lines featuring series compensation, these relays offer adaptability for both single-pole or three-pole tripping applications, as well as dual-breaker setups.
To ensure accurate measurements, these relays utilize an IEEE 1588 clock for time synchronization, obviating the need for external time sources connected to the process bus network [36]. The synchronized measurements derived from CT and VT endow the relays with enhanced situational awareness, thus guaranteeing reliable backup protection for both lines and equipment. Consequently, EMP coupling occurring at the CT and VT ports may impact the measurement accuracy. In this research, particular emphasis was placed on strategic ports for analysis, including the 48 VDC power port, the VT phase-to-ground port, the VT phase-to-phase port, and the CT phase-to-ground ports. These ports were critically important as they directly interacted with the power supply, protective equipment, or interconnected lines.

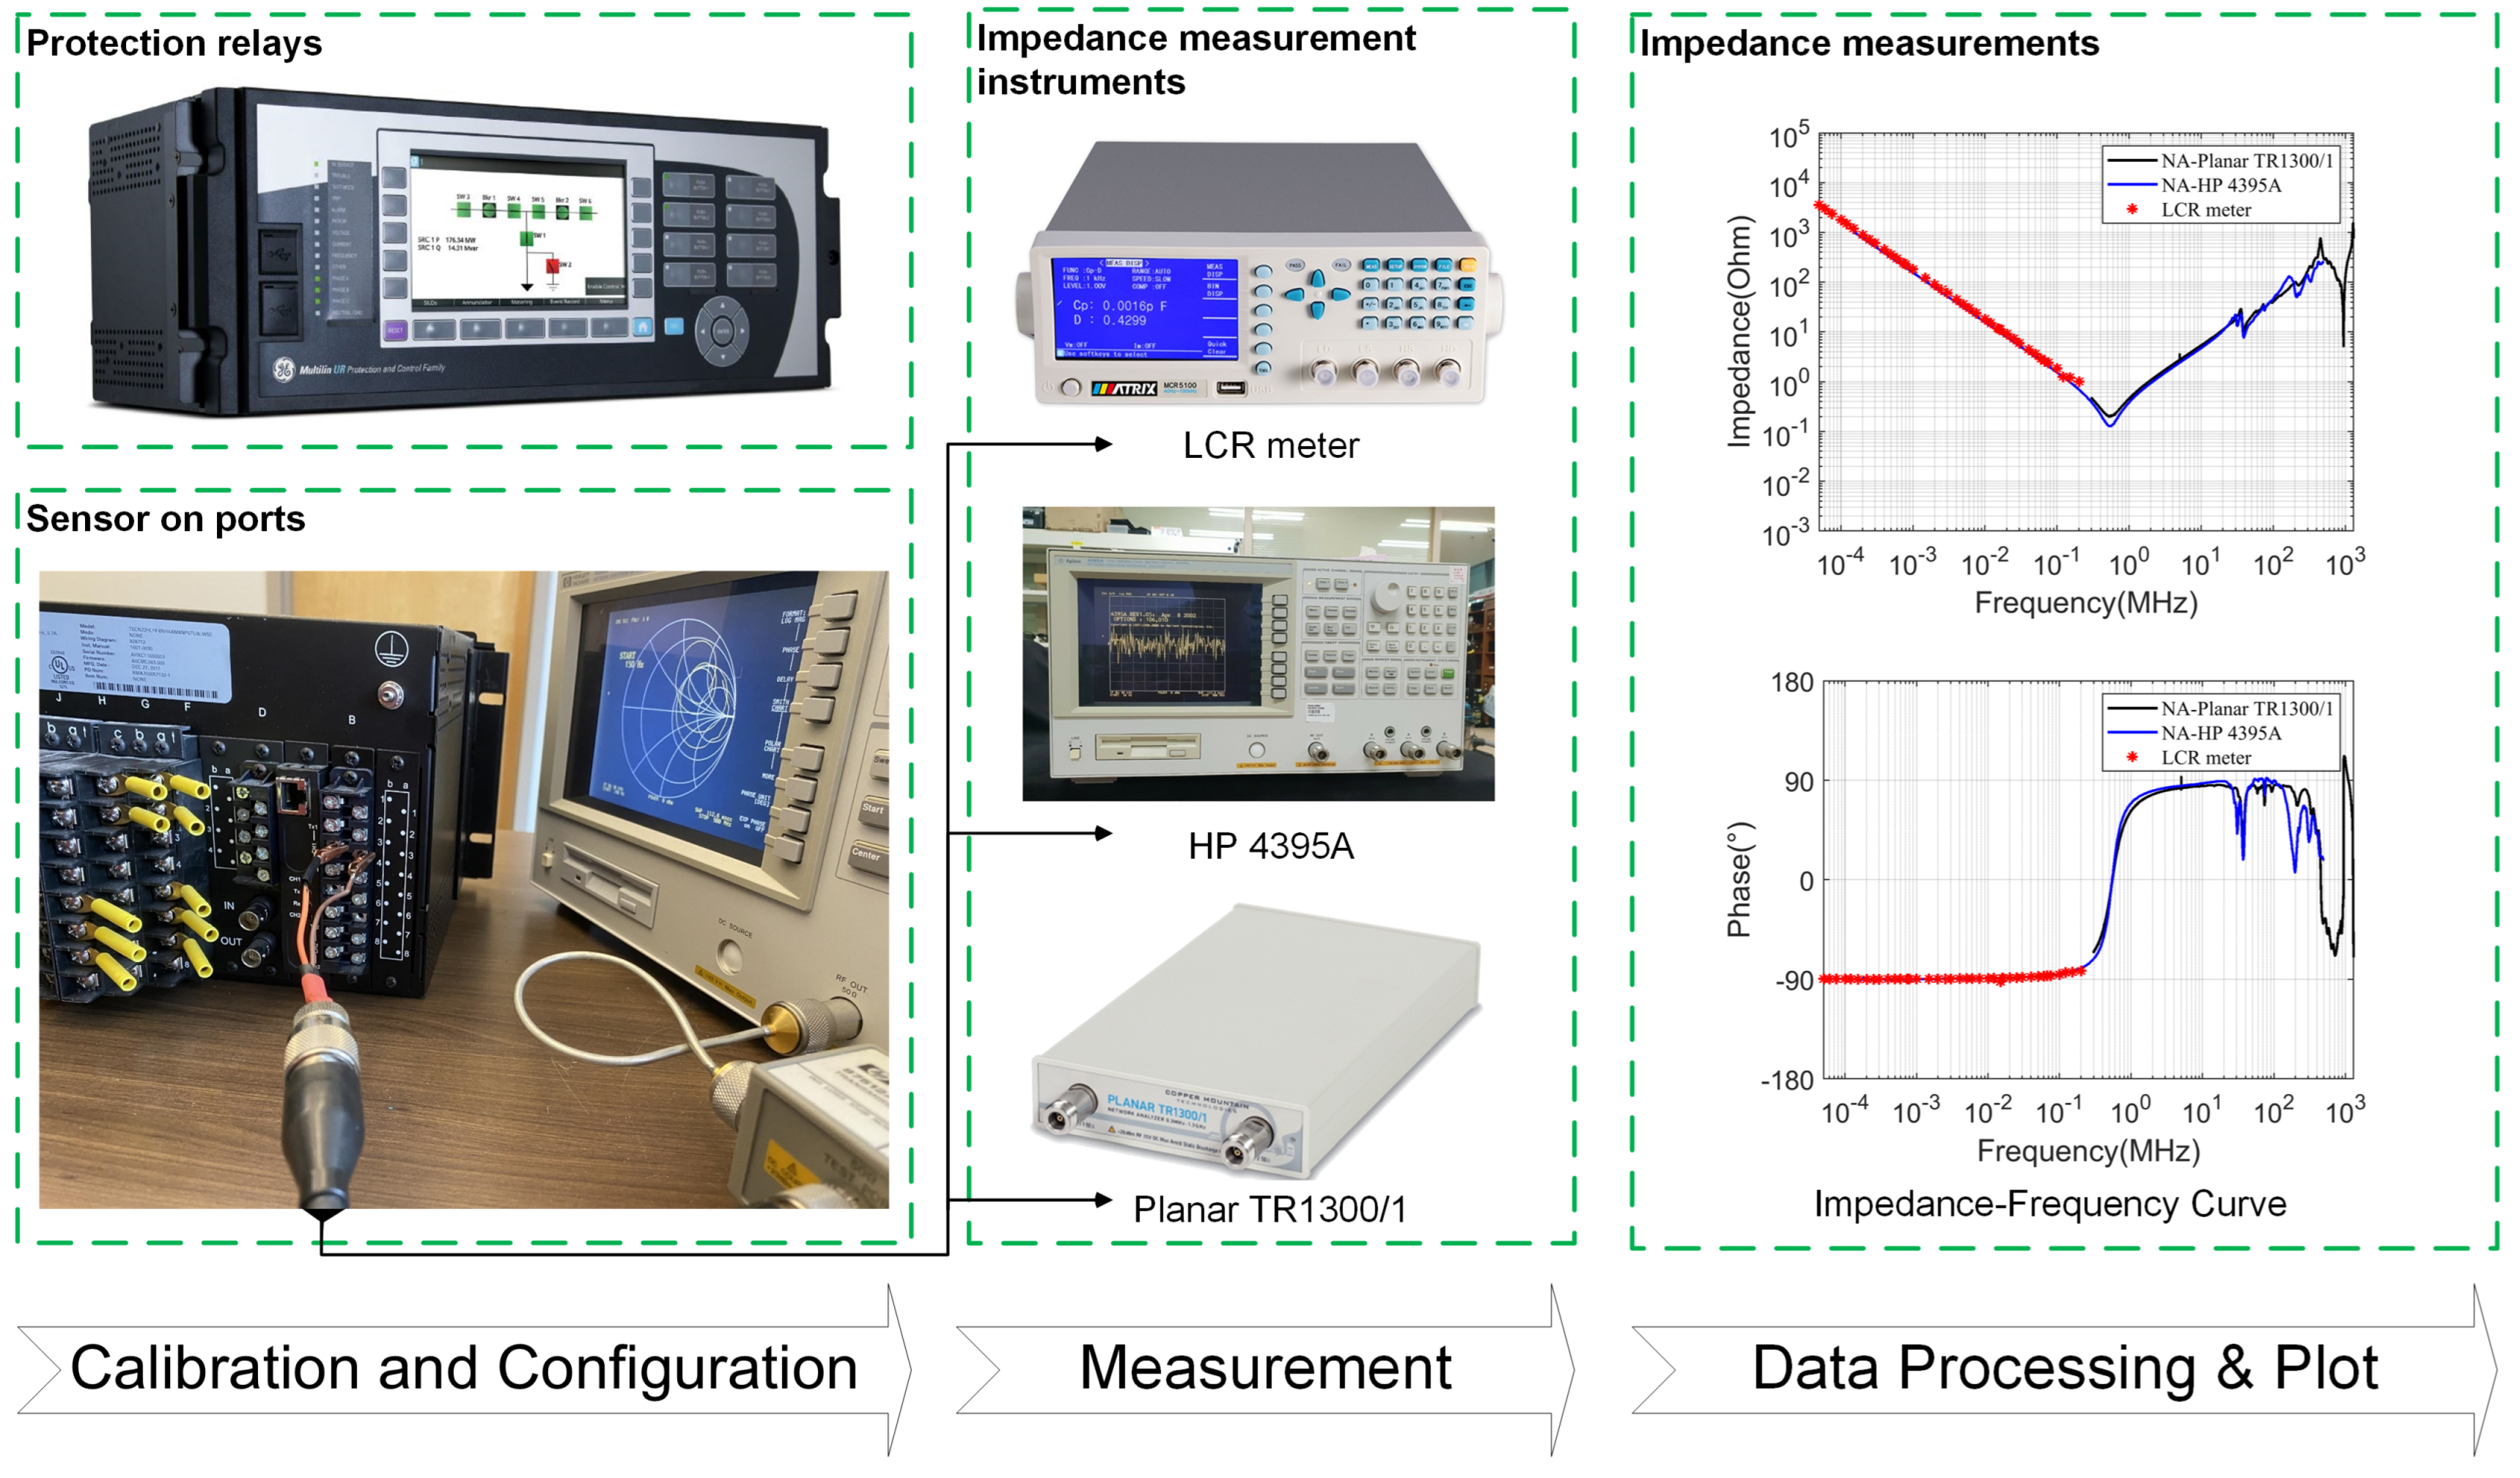
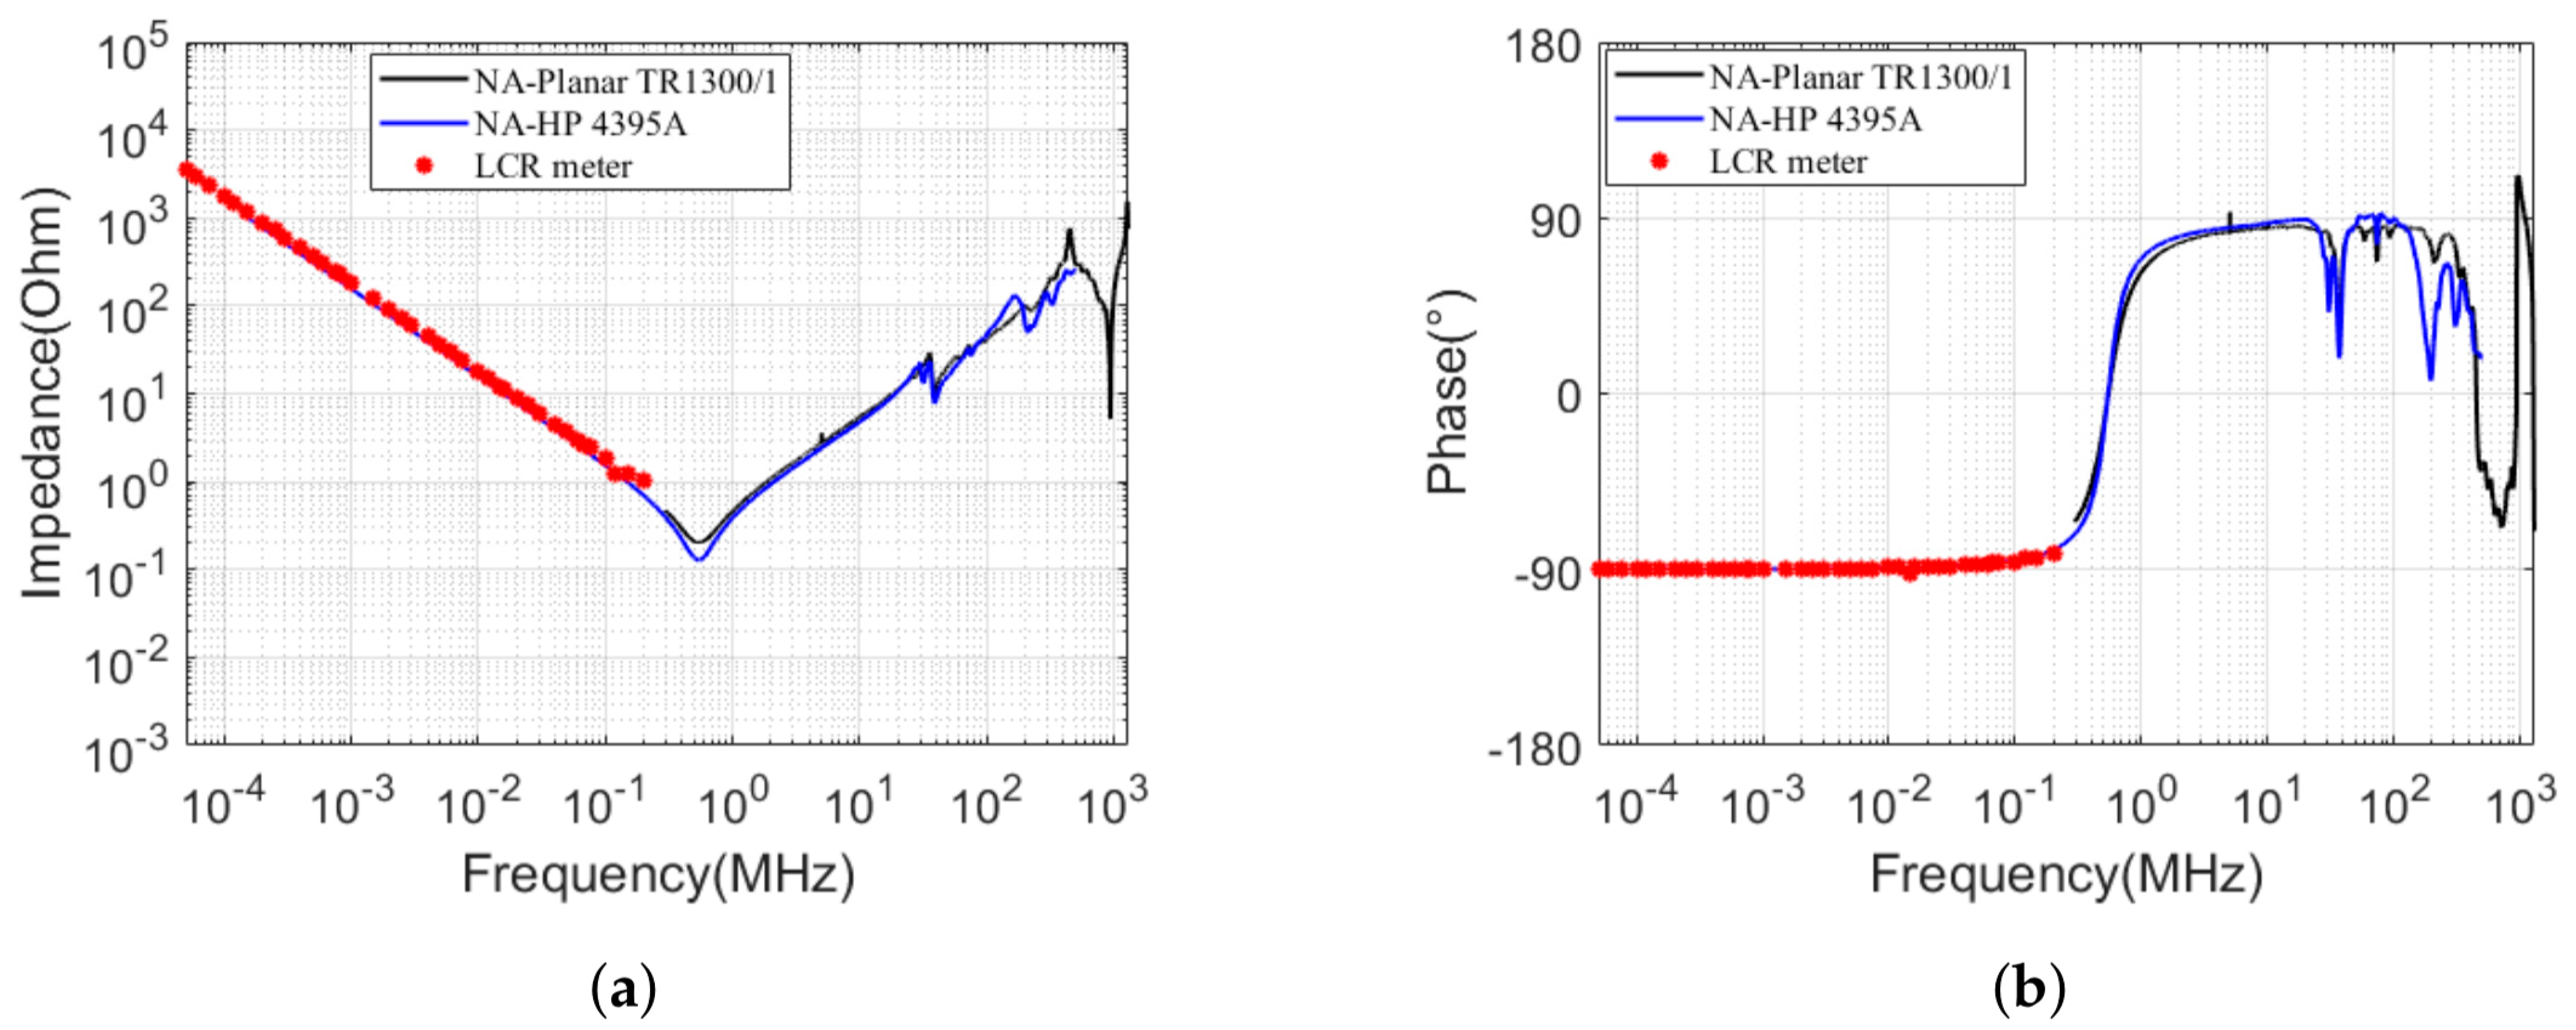
2.2. Impedance Measurement Instruments

In this section, three different instruments were utilized in combination to derive the actual impedance values based on their respective frequency ranges. Features of these three instruments are presented in Table 1. An impedance analyzer and an LCR meter were utilized directly to measure the impedance, providing output values across various frequencies [37]. Conversely, a VNA was employed to assess the network parameters of electrical networks, focusing on s-parameters due to the feasibility of reflection and propagation measurements at higher frequencies [38].
Based on the measured reflection coefficient S 11 , the impedance can be calculated using the equation below [39]:
z e f f = ( 1 + S 11 ) 2 S 21 2 ( 1 S 11 ) 2 S 21 2
where S 21 is the forward voltage gain.
The impedance measurement instruments are shown in Figure 2. For the LCR meter, measurements yielded discrete data points, with a total of 41 frequency points obtainable ranging from 40 Hz to 200 kHz. The impedance analyzer and vector network analyzer (VNA) provided a greater number of measurement points, totaling 805 and 16,001 points, respectively. This indicates a higher resolution for these instruments compared with the LCR meter. The LCR meter had a lower measurement range than the VNA and was mainly employed to supplement the impedance measurements in the low-frequency domain. To ensure the consistency of the results, the output voltage for all three instruments was set to a relatively low value of 0.1 V, corresponding to an output power of −7 dBm.

3. Impedance Measurement and De-Embedding Process

3.1. Calibration, Configuration, and Measurement

Initially, all three measurement instruments underwent a one-hour warm-up to ensure their accuracy. Hence, calibration was then performed, encompassing open-circuit, short-circuit, and 50 Ω-based load procedures. For measurements, a fixture-based sensor, as illustrated in the “sensor on port” setup of Figure 2, was employed. The measurement process was then sequentially conducted on each instrument. This involved connecting two pins of the fixture to corresponding ports on the relay and the sensor’s other end to the instrument.

3.2. De-Embedding Process for the Sensor

Obviously, the impedance measurement results include contributions from both the port and the fixture-based sensor. As a result, the de-embedding process becomes essential to eliminate the influence of the fixture [40]. The most commonly employed method for this purpose is the open–short and short–open de-embedding approach [41]. Although this technique is particularly effective at low frequencies, the wires connecting the ground and signal have inherent resistance and inductance in their short configuration, which can lead to biases at high frequencies. Thus, a de-embedding method was proposed to counteract the effects of fixtures, employing the non-uniform wire propagation model [42].
The equivalent circuit for the fixture, which was modeled as a seven-stage cascade of the wire propagation model, is shown in Figure 3. The key parameters of the fixture, namely, resistance, inductance, and capacitance, were determined using the open and short methods based on the impedance measurements taken. It is generally observed that a smaller distance between two wires results in lower inductance and higher capacitance.
A detailed modeling and simulation considering wire distances between fixtures d f [1 cm, 9 cm] are presented in [42]. The subsequent step involved estimating the detailed capacitance and inductance values for each stage of the wire propagation model, which could be formulated as
C i = π ϵ ln d f 2 r , L i = μ 0 4 π + μ 0 π ln d f r r
where μ 0 denotes the vacuum permeability, r is the wire radius of the fixture, ϵ is the relative permittivity, and i = 1 , 2 , , 7 .

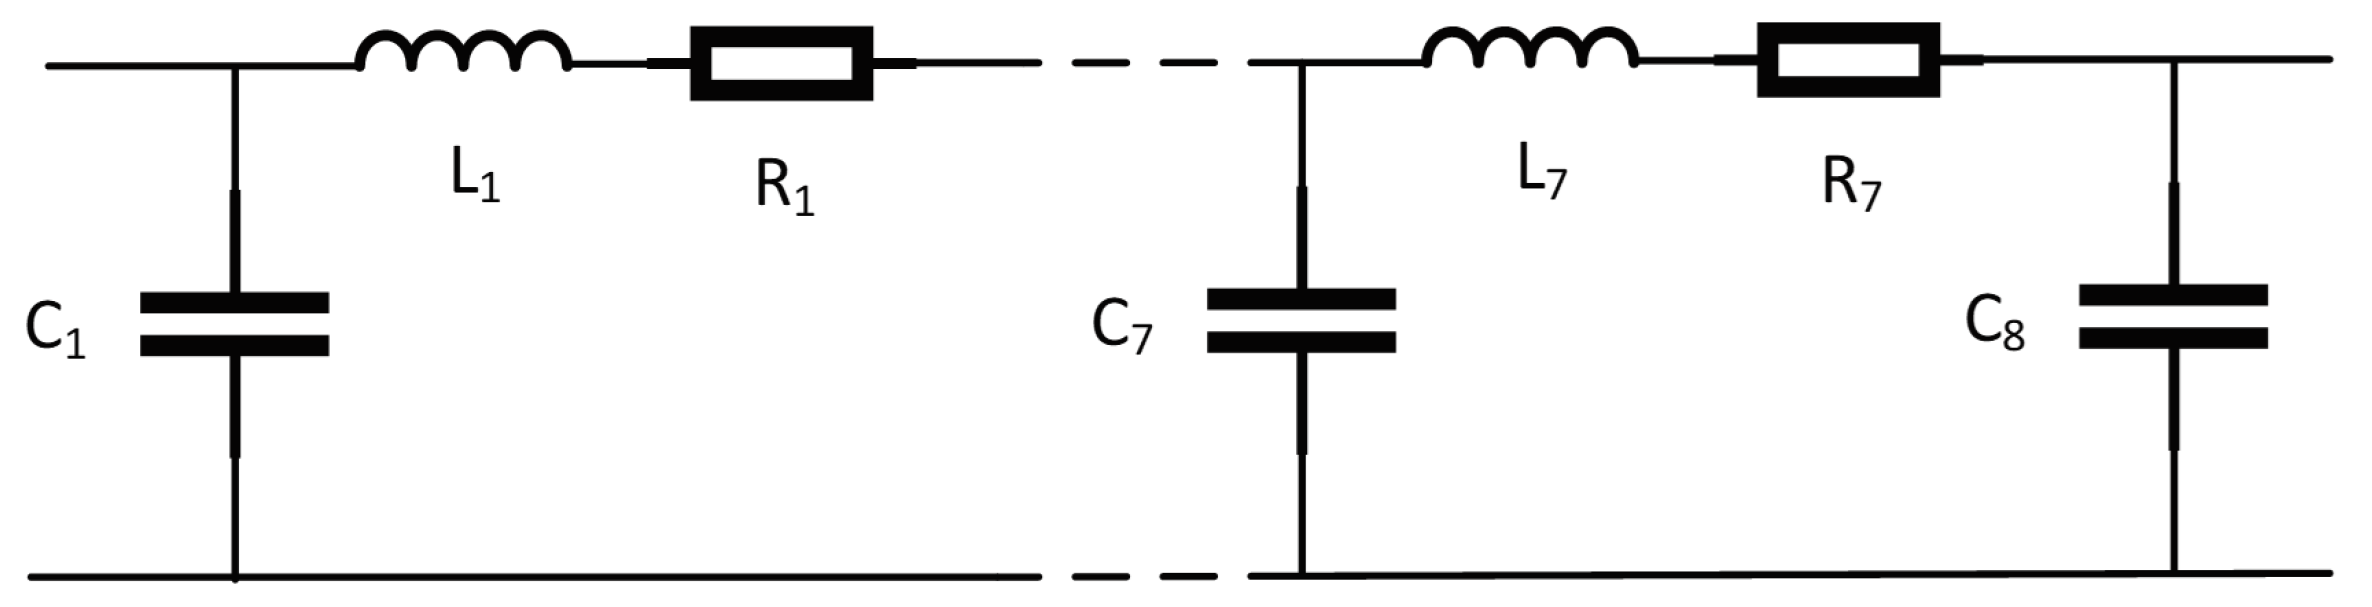
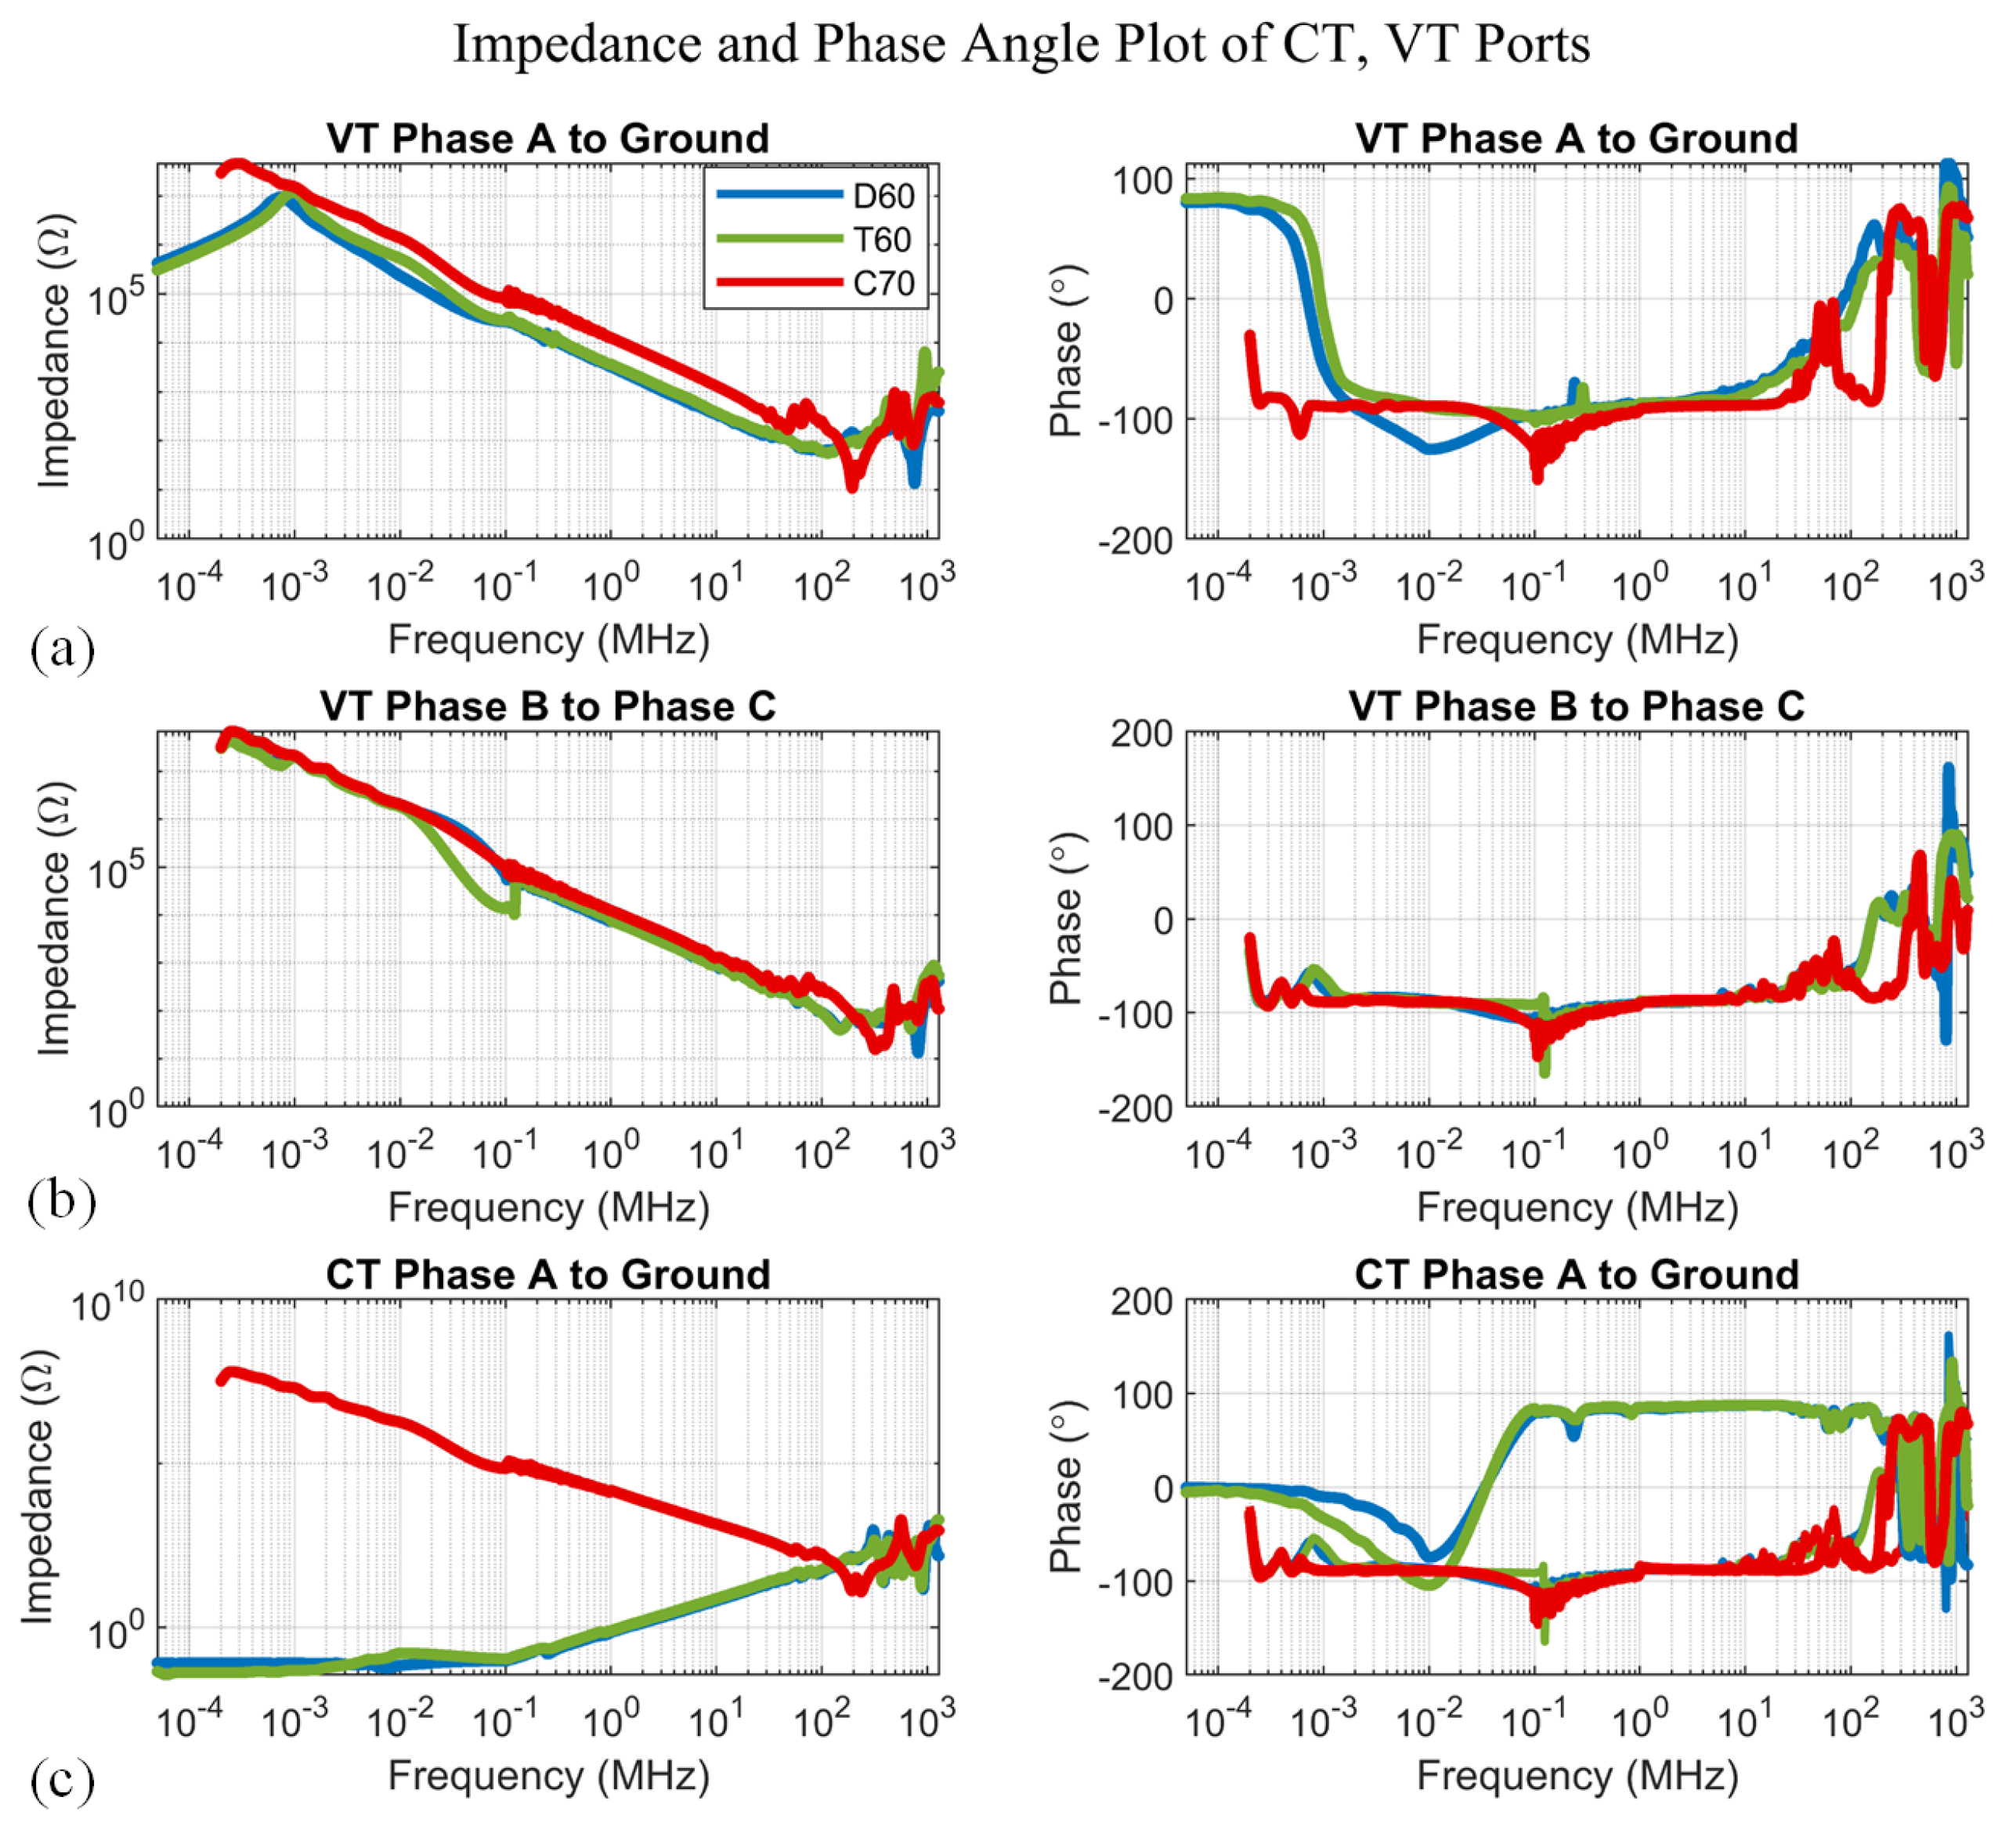
3.3. Measurement Results and Modeling of Equipment

Once the de-embedding process was completed, the measured impedance values were obtained. The impedance results from each instrument, detailing both the impedance magnitude and phase angle, are presented in Figure 4a and Figure 4b, respectively.
Given that the measurement results consisted of three distinct sets, further processing for integration was necessary. This integration was achieved through curve fitting, thereby combining the results into a comprehensive impedance profile. The integrated profiles are illustrated in Figure 4c,d.
Each impedance profile represented a pair of ports on the protection relay. The impedance model of the equipment was constructed from multiple profiles, encompassing measurements from the 48 VDC power port, the VT phase-to-ground port, the VT phase-to-phase port, and the CT phase-to-ground ports. This comprehensive impedance model was utilized in subsequent PCI and FEKO simulations to evaluate the equipment’s vulnerability under HEMP conditions.

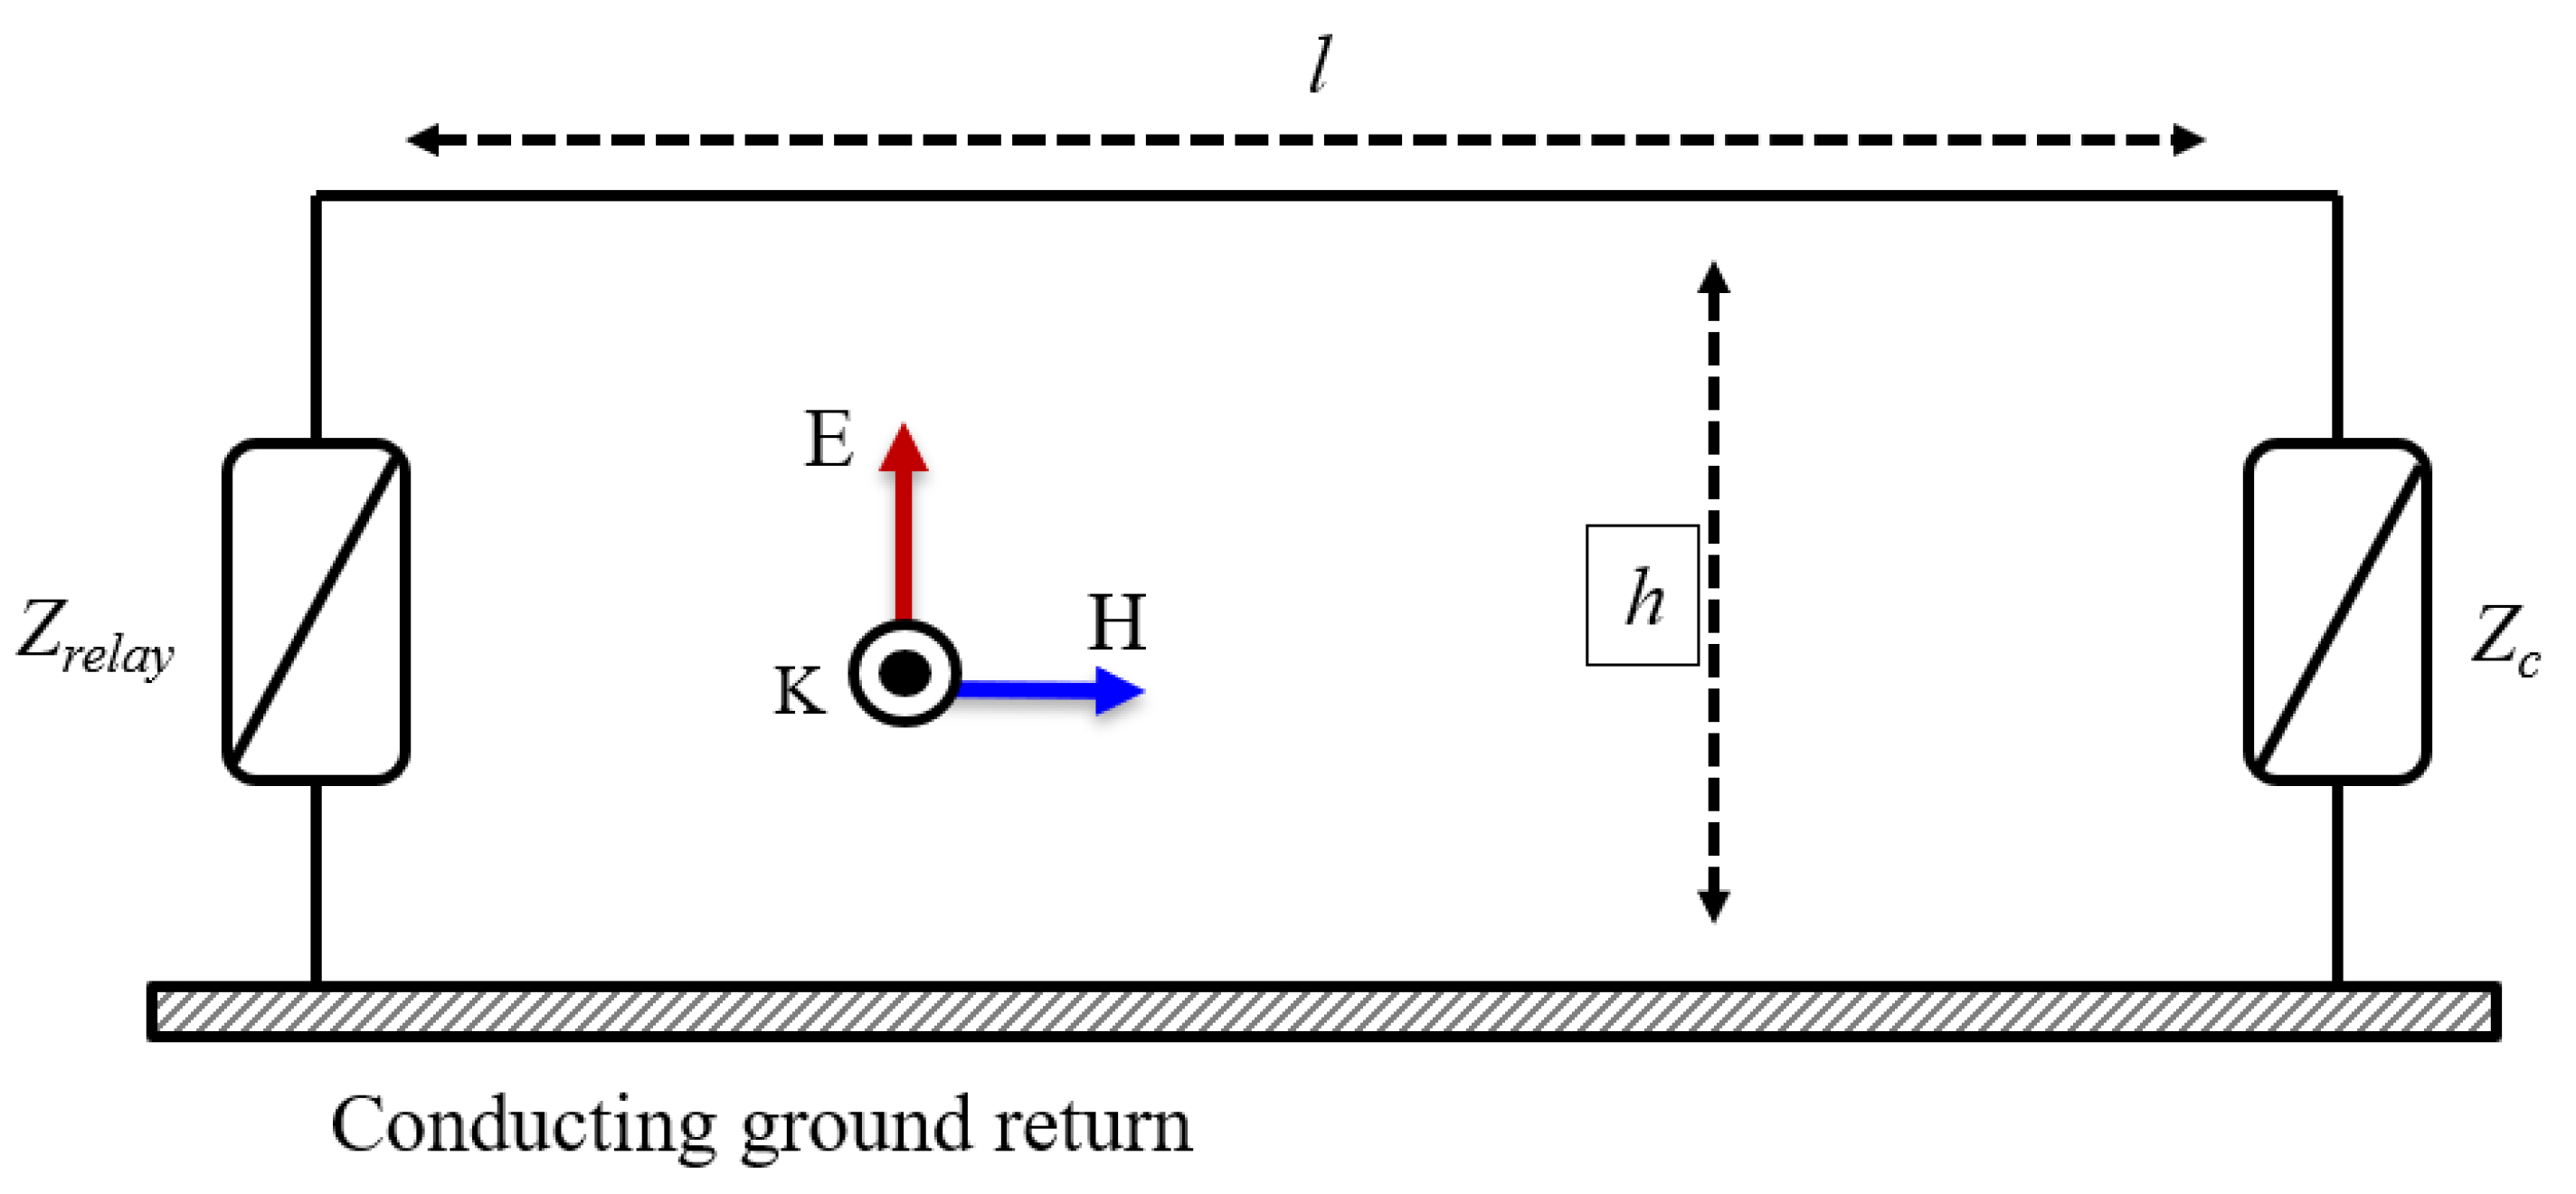
4. Simulation Methodology

4.1. Pulse Current Injection Method

Radiative tests are commonly employed to assess equipment immunity to an HEMP. However, executing these tests poses challenges due to the need for a substantial power impulse source and a controlled electromagnetic environment. An alternative and effective method is the PCI test, which is widely used in conducted immunity testing.
In exploring the transmission relay response to an HEMP, a coupling mechanism was proposed using a circuit network. Notably, in [42], the probe was modeled as a transformer with accurate current distributions. The PCI method stands out for its simplicity and controllability, making it suitable for simulating E1 (early-time) HEMP coupling.
In adherence to the IEC 61000-4-25 standard [23], there were twelve immunity test levels, ranging from 100 V to 160 kV in voltage and 1 A to 3200 A in current. For this study, two types of immunity tests were selected based on the ratings of the transmission relays. Damped sinusoids (EC5 test level) were used for the lower EC1–EC6 levels, while a double-exponential waveform (EC8 test level) was employed for the six higher levels [43]. Table 2 and Table 3 present the waveform parameter requirements for damped sinusoids and double-exponential waveforms, respectively, according to IEC 61000-4-4 [44] and IEC 61000-4-18 [45].
The simplified circuit diagram of the PCI generator for EC5 and EC8 test levels is depicted in the dashed box in Figure 5. To maintain a consistent output impedance close to 50 Ω across the frequency range, a resistor network (R1, R2, and R3) was utilized. Connecting the generator’s output to the relay-measured port impedance (Zdut) was a one-meter-long 50 Ω coaxial wire.
For the EC5 level, the oscillation frequencies of 3 MHz, 10 MHz, and 30 MHz were available. Displayed in Figure 6a, the 10 MHz waveform showed an open-circuit voltage and short-circuit current when the main capacitor was charged to 7.2 kV. The open voltage measured around 2000 V, and the short current was 40 A. The traditional definitions of short circuit and open circuit states that the load is set to 0.1 Ω and 1 kΩ, respectively. Similarly, Figure 6b presents waveforms for the short current and open voltage when the main capacitor was charged to 19.2 kV. The open voltage was less than 8 kV, and the short current was 160 A.

4.2. FEKO Plane Wave Simulation

As stated previously, Altair FEKO version 2022.3.2 is the EM analysis software tool utilized in this paper to simulate an EMP surge that couples onto a conducting line and relay device in the frequency domain. In the simulation, the excitation was modeled as vertically polarized plane wave radiation with an incidence of 15 degrees from the ground plane. A wide bandwidth of 1.3 GHz was considered for the analysis. A single wire above the conducting ground transmission line was modeled. Both the ground plane and wire were assumed to be perfect electric conductors (PECs). Figure 7 visualizes the transmission line model and plane wave radiation excitation source. With the plane wave radiation, the electric and magnetic fields propagate in the K direction and are perpendicular to each other. As illustrated in the Figure 7, the different colors serve as distinction between the electric (E) and magnetic (H) fields. The length l and height h were 10 m and 3 m, respectively. The radius of the line a was 5 mm. The Z r e l a y was the frequency-dependent impedance of the various relay ports represented as a Touchstone file.
Z c is a purely real matched load representing the characteristic impedance of the transmission line. The characteristic impedance of such a line was defined by Vance in Equation (3) below [46]:
Z c = 60 l o g 2 h a
To analyze the transient response of the relay device, the simulated frequency domain results were convoluted with a time-dependent function that represented the HEMP E1 pulse. E1 was utilized over E2 and E3 pulses because it embodies the most severe hazards for digital equipment, such as protection relays. E2 can be mitigated with lightning surge arrester equipment, and E3 is more of a concern for reactive power consumption and saturation of magnetic components as a result of quasi-DC currents coupled to long lines. E1 consists of high-intensity field strengths over a wide frequency range, thus posing significant conducted and radiated threats, especially to equipment containing electronics [47]. The E1 pulse can be modeled as a fast-rising double-exponential signal. According to the IEC-61000-2-9 standard [48], the E1 waveform as a function of time is defined as follows in Equation (4):
E 1 ( t ) = E 0 k ( e a t e b t )
where E 0 is 50 kV/m, k equals 1.3, and a and b are equal to 4 × 10 7 s 1 and 6 × 10 8 s 1 . This waveform serves as a benchmark recommendation for studies assessing the susceptibility and resilience of electrical infrastructure equipment against HEMP.

5. Study Results

This section explains the impedance measurement results and the voltage and current transient responses of selected ports under HEMP coupling using the PCI method and FEKO simulations.

5.1. Impedance Results

This research concentrated on key measurement points, including the 48 VDC output power port, the phase A-to-ground ports of the CT and VT modules, and the phase B-to-phase C port impedance. As elaborated in Section 3.3, initial raw impedance values were acquired from the three measurement devices. These raw results were then refined using interpolation and curve-fitting methods.
Considering the presence of nonlinear components within the power port, impedance measurements were conducted under both powered-off and powered-on operational conditions, as illustrated in Figure 8. The simulation results are discussed in Appendix A. During the measurements, the control power port of the relay equipment was powered by an 80–300 V signal, and the 48 VDC power port was activated to more accurately reflect its operational impedance. Given that the power port designs of the three relays were identical, Figure 8a adequately demonstrates the impedance results. Disparities in impedance outcomes were observed, especially within the lower frequency spectrum. From 10 Hz to 1 MHz, there was a significant reduction in impedance amplitude—by several orders of magnitude—while the phase angle gradually shifted from −90° to +90°. Conversely, for the frequency range of 5 MHz to 100 MHz, the impedance results of the powered-on condition were similar to the powered-off condition.
While the transformer port without a nonlinear component showed consistency under different power conditions, as shown in Figure 8b, the transformer utilized for different relays exhibited unique characteristics.Figure 9 displays the results for the VT phase A-to-ground, VT phase B-to-phase C, and CT phase A-to-ground impedance measurements. In Figure 9a,b, the VT results for all three relays exhibited a consistent decrease in impedance from 100 MΩ to several 100 Ω as the frequency increased. The phase angle maintained around 100 degrees for both ports, trending toward an increase to 100 degrees with rising frequency, starting from 100 MHz.
In contrast, Figure 9c reveals distinct behavior in the CT phase A to ground, particularly in the response of the C70 relay compared with the D60 and T60 relays. While the impedance and phase angle trends of C70 aligned with the VT phase-to-ground results, D60 and T60 exhibited an inverse trend, showing very low impedance in the beginning and a gradual increase in impedance with the incremental frequency. The reason for this behavior in D60 and T60 was the activation of the automatic shorting mechanism in the current transformer ports.
In D60 and T60, the CT/VT modules were customizable to include a standard ground current input aligned with the phase current input. Each AC current input was equipped with both an isolating transformer and an automatic shorting mechanism. This mechanism was designed to short the input when the module was removed from the chassis, offering a controlled testing environment for the current transformer’s response.

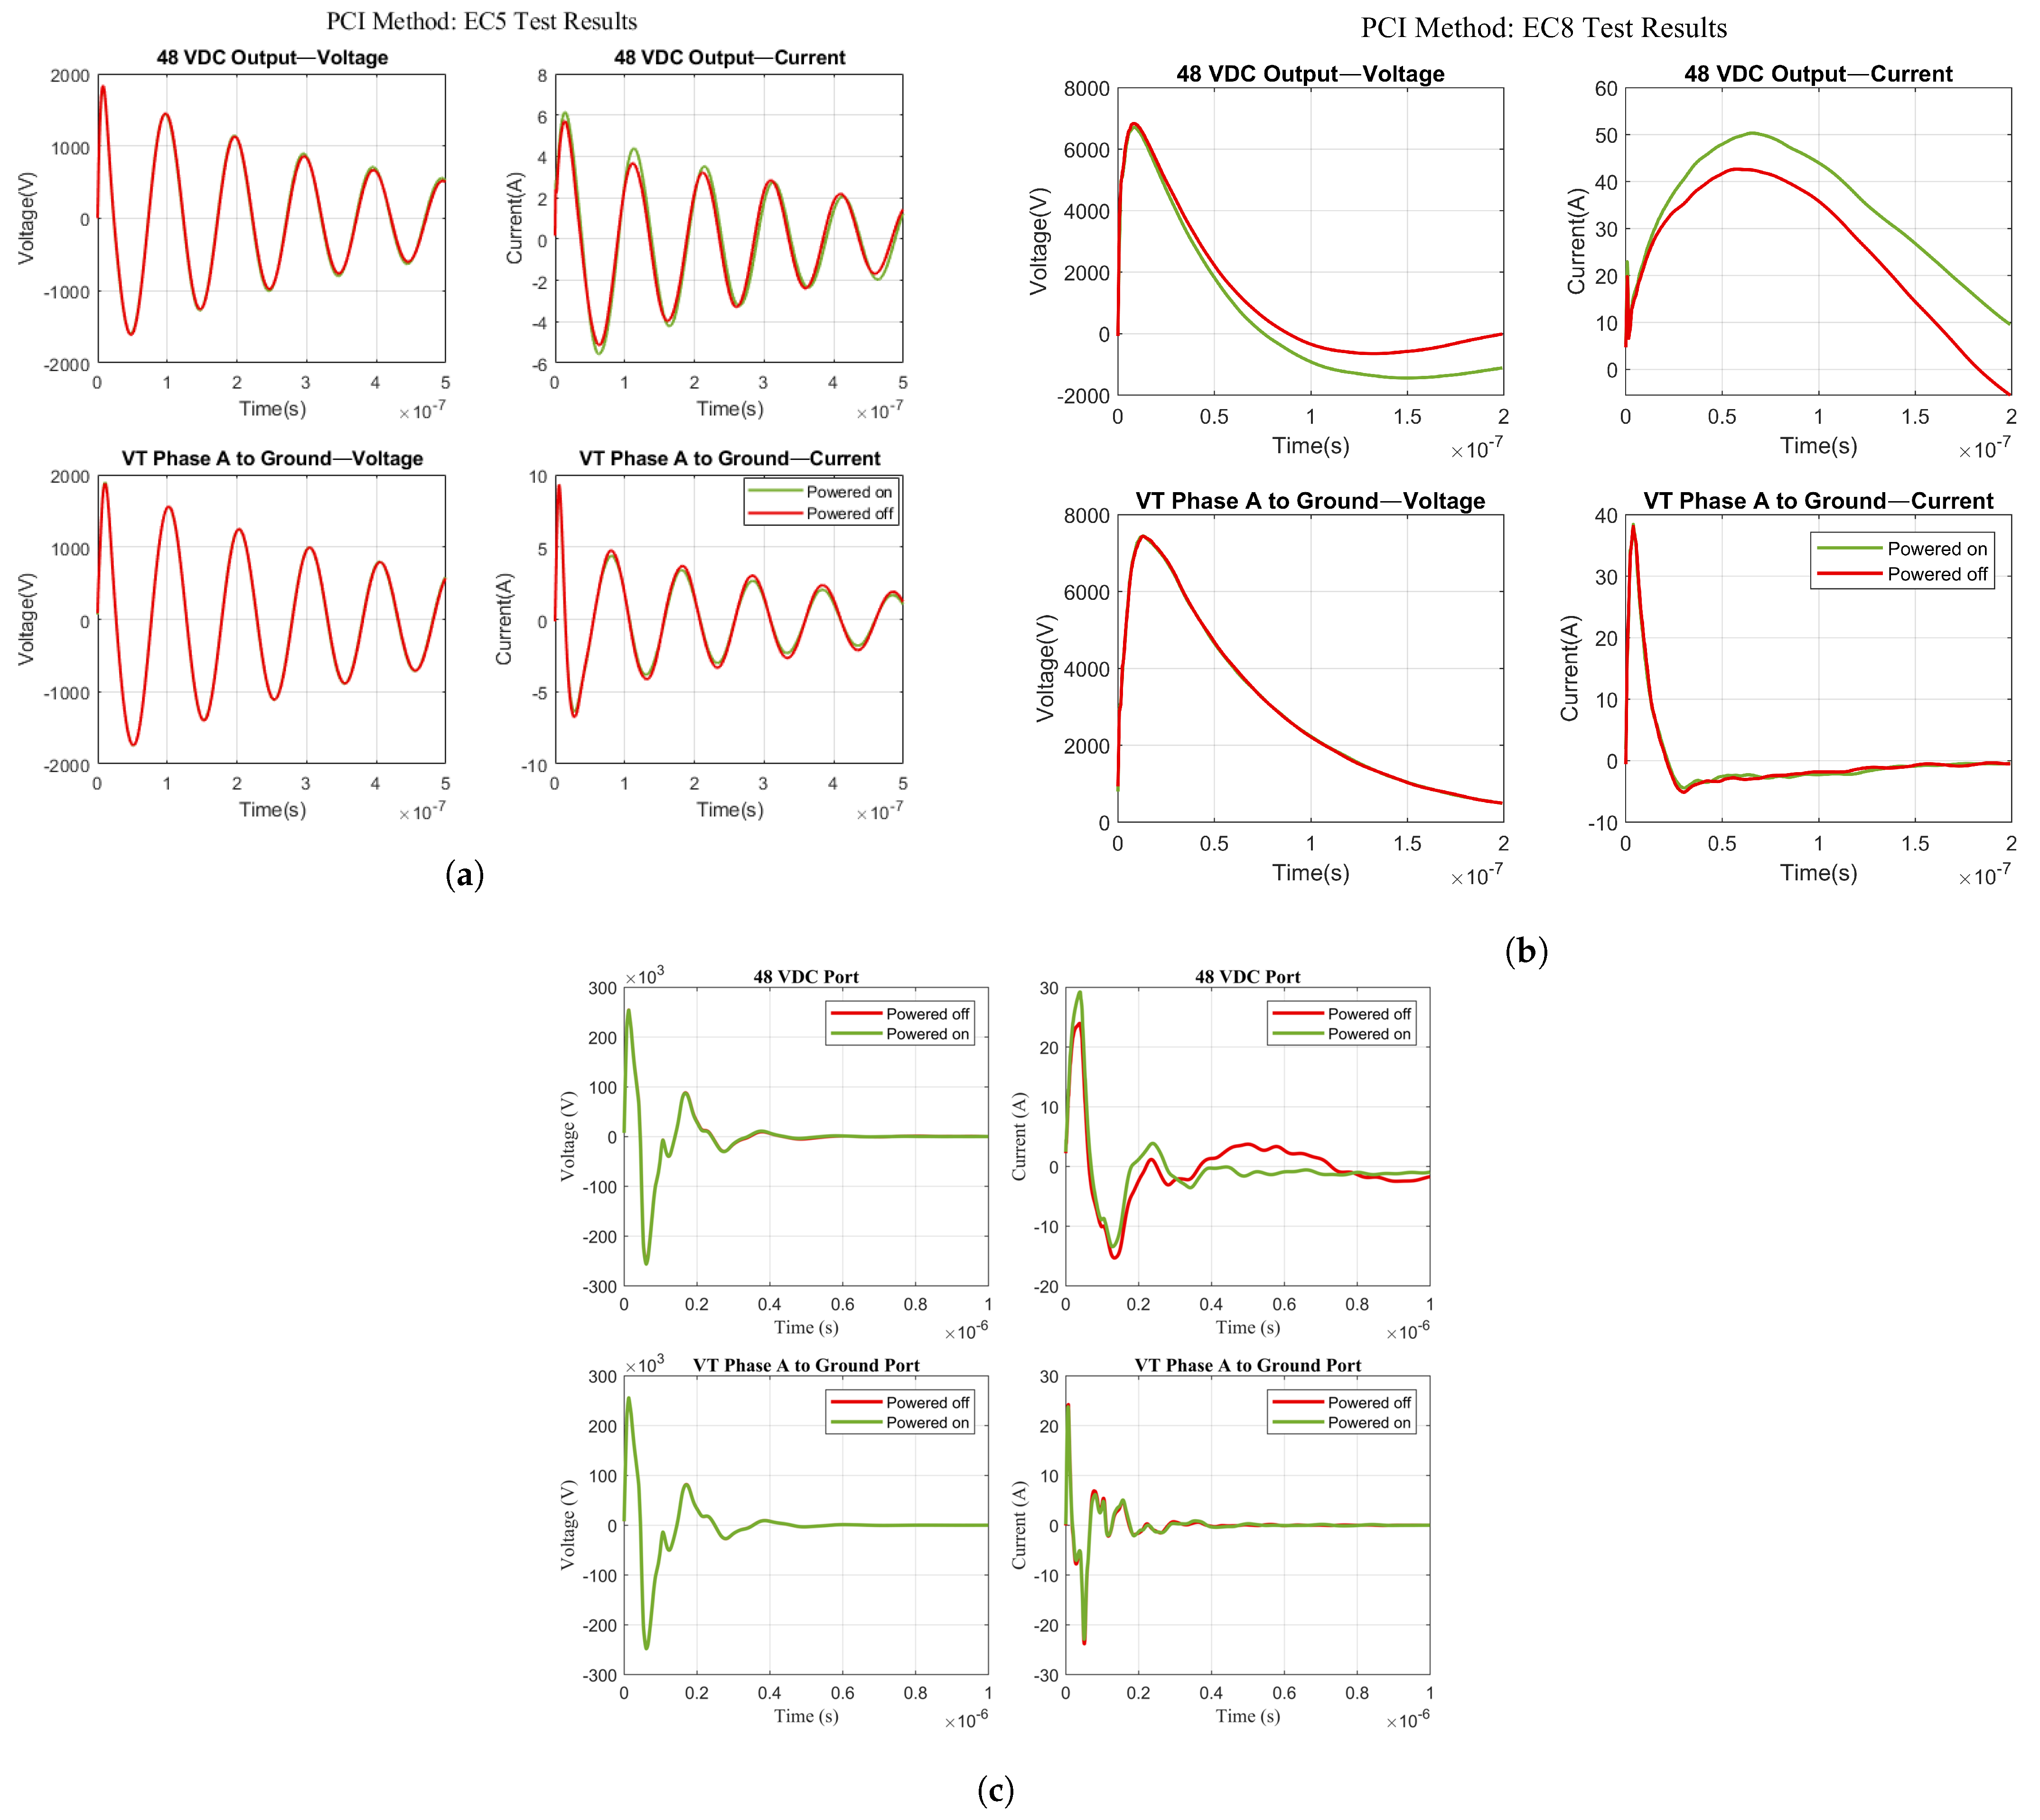
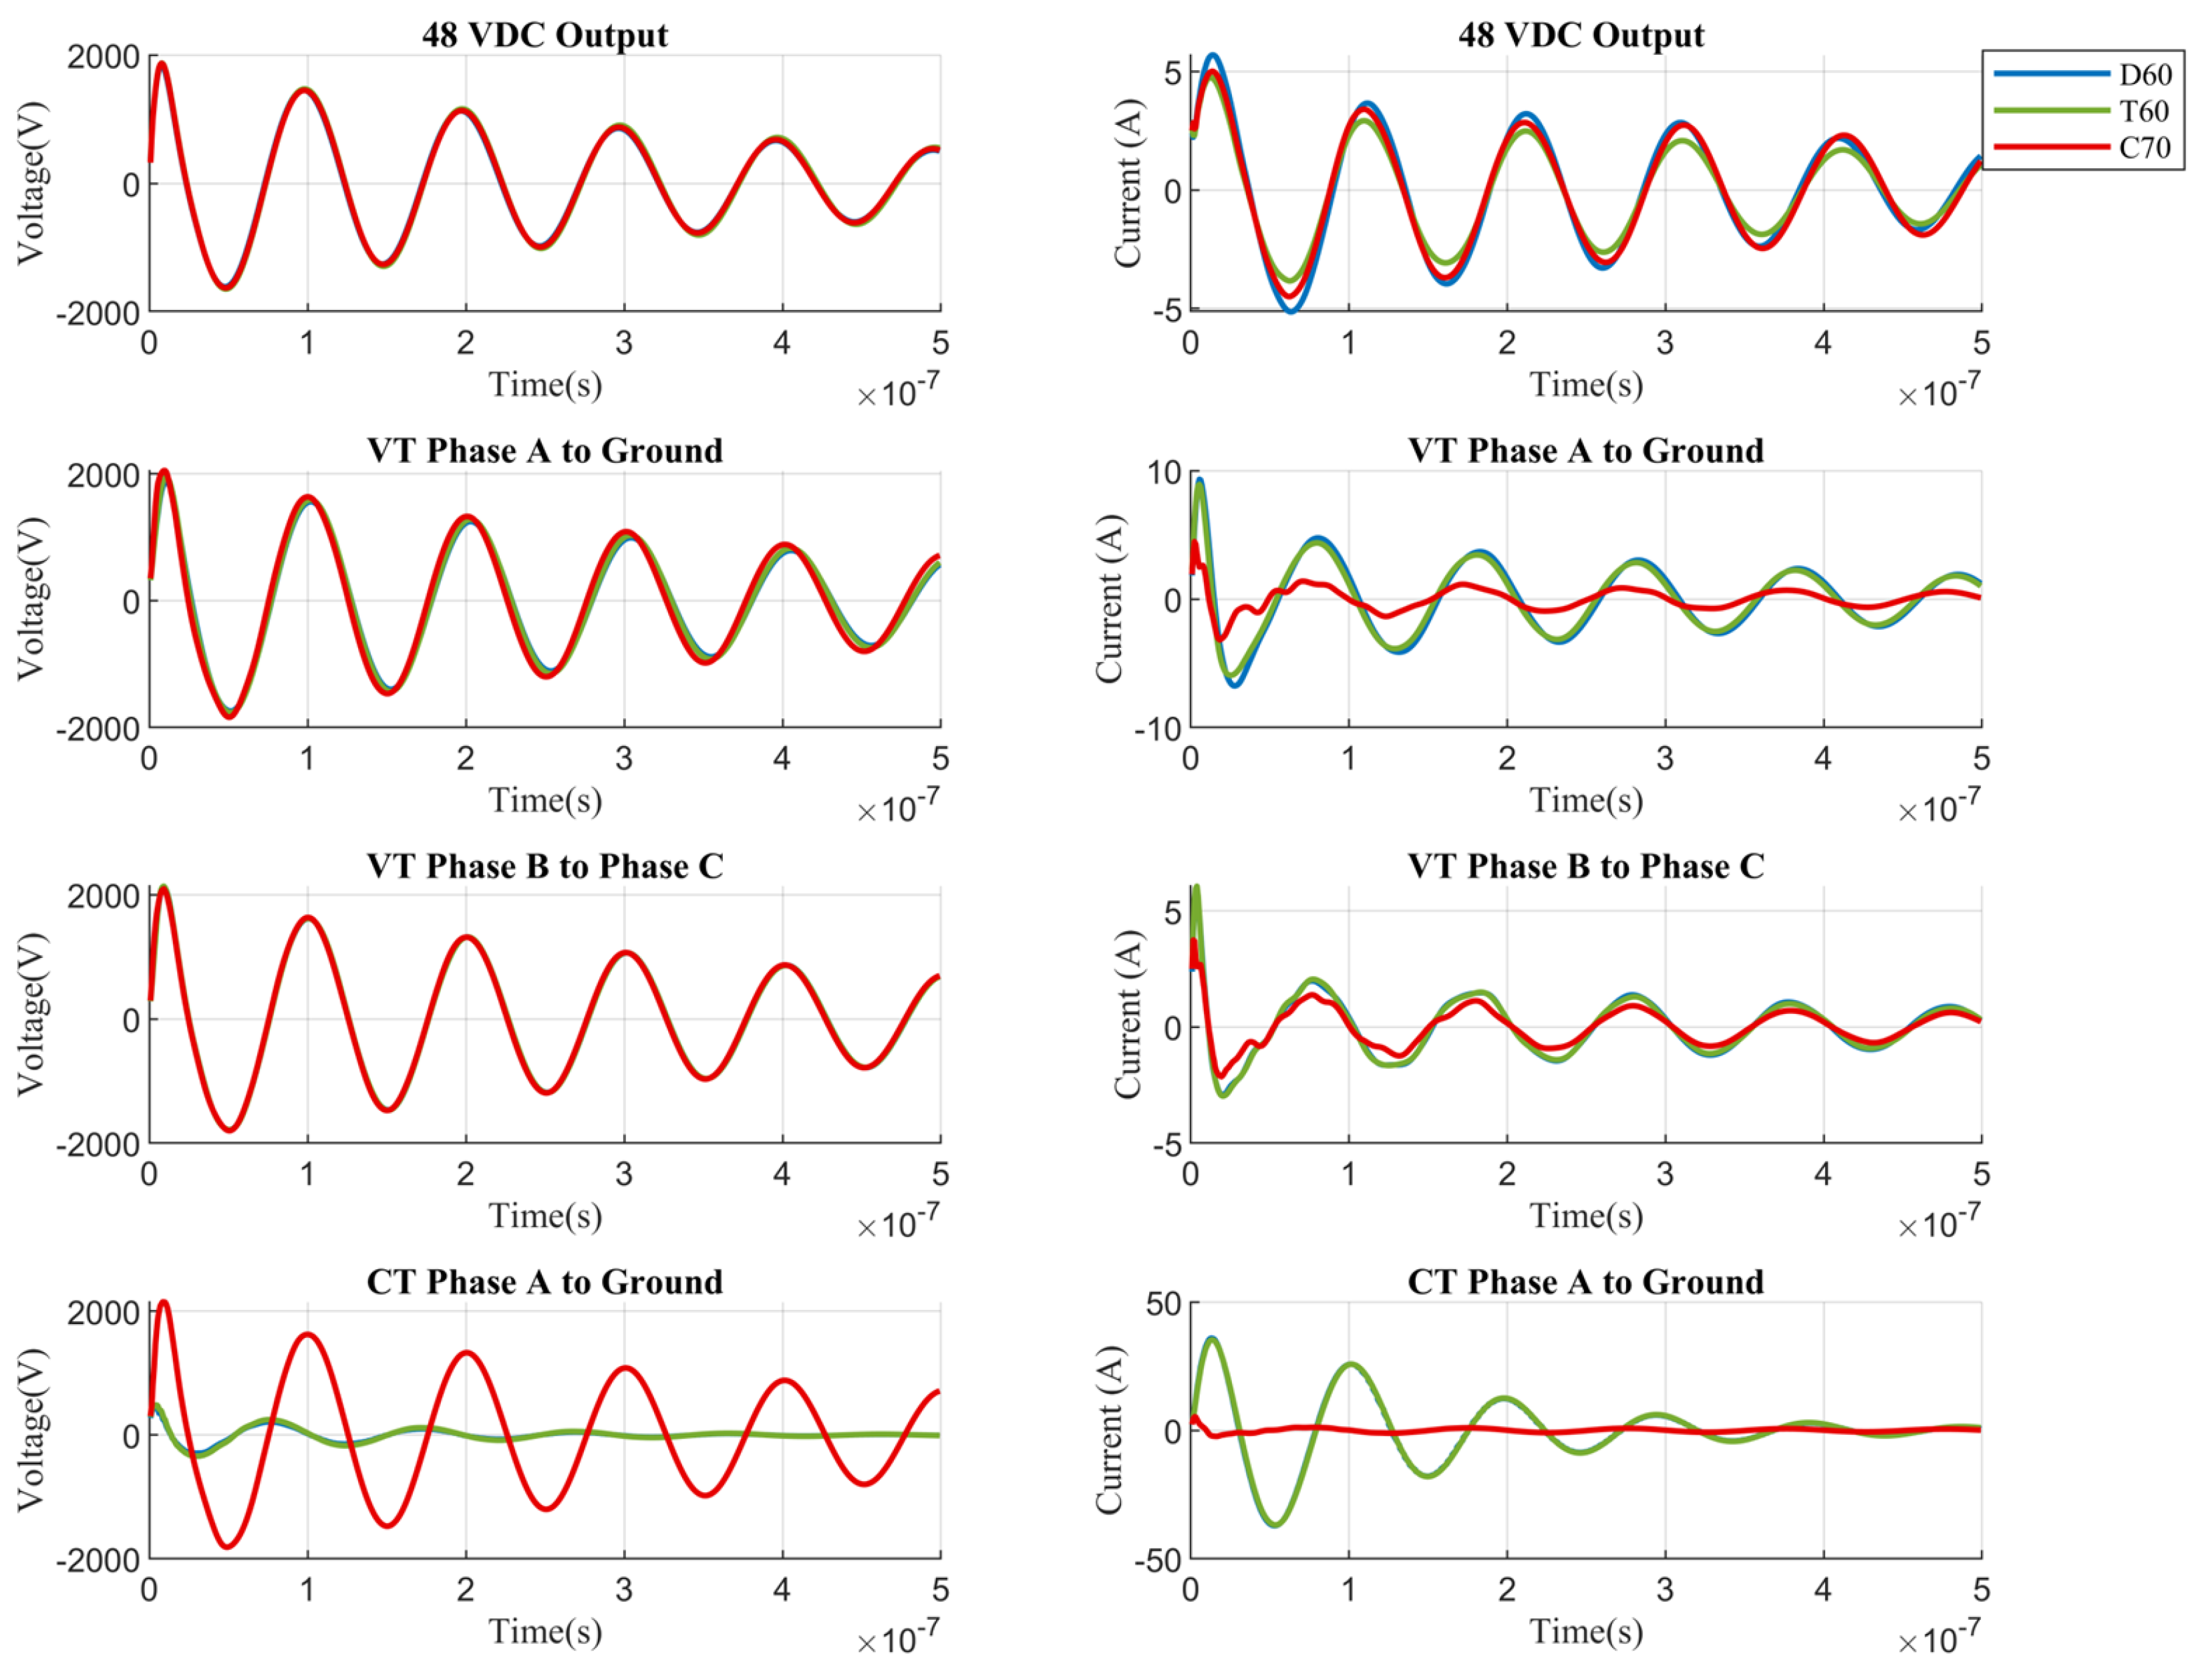
5.2. PCI Method Results

The calculations of the current and voltage responses for the EC5 and EC8 immunity levels were based on the measured port impedance and the circuit of pulse current injection testing. The results for all four measured ports are presented in Figure 10 and Figure 11.
In Figure 10, the voltage and current responses for the EC5 immunity test across all four ports for the three relays are depicted. The peak voltage values for the four ports closely mirrored the generator’s open voltage of 2 kV for the EC5 level. The current responses for the 48 VDC port and the VT phase-to-ground and phase-to-phase ports fell within the range of 5 to 10 A. For the F60 and T60 relays, the CT phase A-to-ground port exhibited a low voltage of around 500 V and a current of 40 A. In contrast, the C70 relay showed a voltage of 2 kV and a current response of 5 A.
Moving to Figure 11, it illustrates the voltage and current responses for the EC8 immunity test across all four ports for the three relays. Three ports, including the 48 VDC output port and two VT ports, exhibit a gradual decay in voltage over time. The current response of the 48VDC output port slowly decreases, while both VT ports current dies out after 20 ns. The CT phase A to ground port of the C70 relay behaves similarly to the VT phase A to ground port.

5.3. FEKO Simulation Results

The transient response of the relay devices after an E1 event is depicted in Figure 12 below. The transient died out well before 1 μs for all ports, except the 48 VDC output port. The simulation was carried out to 2 μs, while the results are displayed out to 1 μs, as no late-time behavior was observed. The voltage reached above 200 kV for all ports. The CT port developed currents exceeding 400 A, while the rest of the ports developed currents below 30 A. For most ports, each device exhibited a similar response. However, the C70 relay CT port developed a very different transient when compared with the other devices. This could have possibly been due to the absence of the automatic shorting module within the C70 itself. Additionally, the C70 device exhibited a less intense current transient through both VT ports while maintaining a similar trend with the other devices. Simulation convergence was observed when the frequency increment was at or smaller than approximately 250 kHz. Therefore, 6471 frequency analysis points were used, resulting in a frequency spacing increment of 200 kHz.

5.4. Evaluation

As a foundational step and precursor to empirical experimentation on actual equipment, the impedance measurements and simulation results presented in this paper serve as a robust indicator for evaluating equipment performance under HEMP threats.
First, impedance measurements of the 48 VDC ports demonstrated consistent alignment in both the impedance and phase data across the three protection relays, indicating uniform port designs. Under normal operating conditions, both of the 48 VDC outputs could directly power the contact inputs. This connection circuit typically carried a current of 1∼3 mA and was rated to withstand voltages up to 300 VDC [34]. However, when exposed to the HEMP, the maximum voltage results from both the PCI and electromagnetic simulations exhibited significantly elevated magnitudes, with values exceeding 2 kV and 200 kV in Figure 11 and Figure 12 for the 48 VDC power port, respectively. This discrepancy will lead to high-impedance protection and operational disturbances.
Second, the impedance measurement results for the CT port displayed different results between the C70 relay, and the D60 and T60 as a pair. The D60 relay manual specifies the inclusion of an automatic shorting mechanism within the CT module, which engages upon disconnection from the unit [33]. Additionally, certain CT/VT modules feature a standard ground current input, which is identical to the phase current input. These design characteristics explain the observed lower impedance magnitude measurements for the D60 and T60 devices compared with the C70 across most of the frequency spectrum.
Finally, the transformer performance under the HEMP threats necessitated thorough evaluation. Although the ratios of CT and VT could be adjusted from 1 to 24,000, the voltage and current at the rated secondary were limited to a specific range, namely, from 25.0 to 240.0 V and 1.0 to 5.0 A, respectively. The EMP-induced voltage and current magnitudes at the secondary may surpass these thresholds given a low transformer ratio, risking damage to the analog inputs. Moreover, the system’s failure protection mechanisms were expected to activate upon detecting a step change within the range of 0.005 to 30.000 per unit (p.u.). In the absence of mitigation measures, Figure 12 illustrates that such high transient disturbances could trigger the failure protection, leading to unintended tripping.
It is worth noting the time scale of the transient results from the EM coupling simulation. The high-magnitude transient behavior died out in all ports before one microsecond, and before 500 ns in most ports. The first reason that dictated such behavior was related to the definition of the E1 pulse. E1 rose within 10 ns and died out within 120 ns. The second influential factor was the transmission line length. The length was modeled as 10 m in consideration of the computational resources. Longer lines will couple lower frequencies and exhibit more resonances. Shorter lines will constitute a shorter signal propagation time, thus contributing to a quicker transient decay. Despite the short transient period, damage and possible device failure was expected to transpire [9].

6. Conclusions

To study the capability of power system protection relay equipment during HEMP threats, this paper proposes an economical and efficient methodology. Following a procedure to measure device port impedance and analyze voltage and current surges across such an impedance, the procedure was demonstrated to be reliable and repeatable for several devices. In this study, two levels of transient immunity tests were conducted using the PCI method (lower in magnitude) and FEKO simulations (higher in magnitude and included EM cable coupling). Peak transient values for current and voltage surges were obtained, as well as the general transient behavior for a multitude of ports on the relay devices. The results also indicate how long the transient endured with respect to time. The EC5 pulsed current injection test yielded voltage surges upward of 2 kV and current surges up to 40 A. The EC5 transient endured longer than 500 ns for most of the tested ports with little damping. As for the EC8 test, the voltages reached 7 kV and the currents reached 150 A. The pulse died out without oscillation after approximately 200 ns. Under excitation from the full-magnitude E1 immunity test, the relay ports developed voltages upward of 200 kV and currents beyond 400 A. Any transients typically died out after 500 ns. The methodology outlined and the results obtained from this work enable future researchers to more adequately test and predict the response of power system protection devices against EMP. Future researchers may apply this approach as an effective and affordable means of testing threatened equipment prior to conducting experimental pulse injections.
Although the immunity tests performed in this research provide insight into the relay devices’ responses against an EMP, the results do not delineate the damage threshold of the devices. Further evaluation and possibly destructive experiments may be required to determine the actual damage threshold. Such experiments would require the production and injection of high-power fast transients into the ports of the devices. Experimental results may vary depending on the pulse-generating equipment; coupling mechanism; and, of course, the device under test. A significant advantage of the methodology proposed in this work is its ability to offer a preliminary verification toward empirical experimentation on actual equipment, particularly concerning the amplitude and pulse intensity. The nature of experimental destructive testing necessitates numerous devices, as equipment may sustain permanent damage after each port test, rendering it unsuitable for further evaluation. Consequently, this simulation-based methodology emerges as the most economical and efficient strategy to comprehensively assess a wide array of devices and ports.

Author Contributions

Conceptualization, L.Z. and W.Q.; methodology, L.Z.; software, N.L.T. and D.M.; validation, Y.W., N.L.T. and D.M.; formal analysis, N.L.T. and D.M.; investigation, Y.W.; resources, L.Z., D.L. and B.W.M.; data curation, N.L.T.; writing—original draft preparation, Y.W.; writing—review and editing, Y.W., N.L.T., D.M. and L.C.M.; visualization, Y.W., N.L.T. and D.M.; supervision, Y.L.; project administration, Y.L.; funding acquisition, Y.L. All authors read and agreed to the published version of the manuscript.

Funding

This research is supported in part by the DOE Grid Modernization Lab Call (GMLC): Project Vulnerability of Power Generation Critical Systems Against Electromagnetic Threats under Agreement #36129, and in part by the CURENT Industry Partnership Program.

Data Availability Statement

No available data.

Acknowledgments

We would like to extend our sincere gratitude to EnerNex Knoxville for their generous contribution to our research. The donation of GE Multilin Universal Relays was instrumental in advancing our work on HEMP coupling effects on power grid protection equipment. We deeply appreciate Enernex’s support in fostering innovative research and development.

Conflicts of Interest

The authors declare no conflicts of interest.

Appendix A

Multiple simulations were conducted that incorporated the impedance measurements from the energized equipment and unenergized equipment.
Regarding the PCI method, Figure A1a,b show the EC5 and EC8 immunity test results for the energized 48 VDC and VT phase A-to-ground ports. As shown in Figure A1a, very small changes in current were observed for the 48 VDC port, while the voltage response remained same as when the unit was powered off. For the EC8 test level, the voltage was slightly decreased and the current through the 48 VDC port was increased by 20 A. The voltage and current responses of the VT phase A-to-ground port remained similar to the results when the unit was turned off.
Figure A1. Comparative analysis for ports under powered-off and powered-on conditions: (a) PCI EC5 test, (b) PCI EC8 test, and (c) FEKO simulation.
Electronics 13 01336 g0a1
Concerning the FEKO method, despite the influence of nonlinear components on the port impedance, no marked difference was noted in the transient behavior of the ports, particularly in terms of the induced voltage. The EMP-induced voltage remained largely unaffected by the new impedance values, though slight variations in the current behavior were noted for the 48 VDC port. The voltage transformer port exhibited virtually no change, underscoring the minimal variation noted in impedance measurements. Figure A1c provides a visual comparison of these observations.

References

  1. Foster, J.S.; Gjelde, E.; Graham, W.R.; Hermann, R.J.; Kluepfel, H.M.; Lawson, R.L.; Soper, G.K.; Wood, L.L.; Woodard, J.B. Report of the Commission to Assess the Threat to the United States from Electromagnetic Pulse (EMP) Attack, Critical National Infrastructures; U.S. Government Printing Office: Washington, DC, USA, 2008. [Google Scholar]
  2. Li, P.; Wu, Q. Dynamic Numerical Analysis of Interactions between High-Altitude Electromagnetic Pulse and Power Grid. IEEE Trans. Electromagn. Compat. 2023, 65, 1801–1810. [Google Scholar] [CrossRef]
  3. Kopp, C. The Electromagnetic Bomb: A Weapon of Electrical Mass Destruction; Monash University: Clayton, VIC, Australia, 1996. [Google Scholar]
  4. Wang, D.; Li, Y.; Dehghanian, P.; Wang, S. Power Grid Resilience to Electromagnetic Pulse (EMP) Disturbances: A Literature Review. In Proceedings of the 2019 North American Power Symposium (NAPS), Wichita, KS, USA, 13–15 October 2019; pp. 1–6. [Google Scholar] [CrossRef]
  5. Pukkalla, S.K.; Subbarao, B. Study on Modeling & Simulation Analysis of Electromagnetic Pulse (EMP) Coupling to Cables. In Proceedings of the 2018 15th International Conference on ElectroMagnetic Interference & Compatibility (INCEMIC), Bengaluru, India, 13–16 November 2018; pp. 1–4. [Google Scholar]
  6. Foster, R.A.; Frickey, S.J. Strategies, Protections and Mitigations for Electric Grid from Electromagnetic Pulse Effects; Technical Report; Idaho National Lab. (INL): Idaho Falls, ID, USA, 2016. [Google Scholar]
  7. Qiu, W.; Zhang, L.; Yin, H.; Markel, L.C.; Liao, D.; McConnell, B.W.; Liu, Y. Modeling, testing, and mitigation of electromagnetic pulse on PV systems. Sol. Energy 2023, 264, 112010. [Google Scholar] [CrossRef]
  8. Liao, D.; Liu, Y.; Markel, L.C.; McConnell, B.W.; Mignardot, D.P.; Poole, B.R.; Wang, L. Estimation of High-Altitude Electromagnetic Pulse Coupling onto Power Generation Facility Equipment. In Proceedings of the 2023 IEEE International Symposium on Antennas and Propagation and USNC-URSI Radio Science Meeting (USNC-URSI), Portland, OR, USA, 23–28 July 2023; pp. 265–266. [Google Scholar]
  9. Savage, E.; Gilbert, J.; Radasky, W. The Early-Time (E1) High-Altitude Electromagnetic Pulse (HEMP) and Its Impact on the US Power Grid; Report Meta; Metatech Corporation: Goleta, CA, USA, 2010. [Google Scholar]
  10. Vittitoe, C.N. Did high-altitude EMP cause the Hawaiian streetlight incident. In System Design and Assessment Notes; Sandia National Lab.: Albuquerque, NM, USA, 1989. [Google Scholar]
  11. Rowland, H.; Fernsler, R.; Huba, J.; Bernhardt, P. Lightning driven EMP in the upper atmosphere. Geophys. Res. Lett. 1995, 22, 361–364. [Google Scholar] [CrossRef]
  12. Rashid, R.; Gilani, S.A.A. Electromagnetic Pulse (EMP): A Study of General Trends, Simulation Analysis of E1 HEMP Coupling and Protection Strategies. In Proceedings of the 2021 International Conference on Cyber Warfare and Security (ICCWS), Islamabad, Pakistan, 23–24 November 2021; pp. 106–111. [Google Scholar] [CrossRef]
  13. Adhikari, S.; Mueller, D.; Walling, R.; O’Laughlin, A.J. A comprehensive study of geomagnetic disturbance (GMD) system impact. In Proceedings of the 2017 IEEE Power & Energy Society General Meeting, Chicago, IL, USA, 16–20 July 2017; pp. 1–5. [Google Scholar] [CrossRef]
  14. Mate, A.; Barnes, A.K.; Bent, R.W.; Cotilla-Sanchez, E. Analyzing and Mitigating the Impacts of GMD and EMP Events on the Electrical Grid with PowerModelsGMD.jl. arXiv 2021, arXiv:2101.05042. [Google Scholar]
  15. Kappernman, J.; Albertson, V. Bracing for the geomagnetic storms. IEEE Spectr. 1990, 27, 27–33. [Google Scholar] [CrossRef]
  16. Liao, D.; Li, Z.; Liu, Y.; Markel, L.; Mcconnell, B.; Poole, B.R.; Wang, L. Estimation of High-Altitude Electromagnetic Pulse Signal Leakage into Power Generation Facilities: Simulations and Measurements; Technical Report; Oak Ridge National Lab. (ORNL): Oak Ridge, TN, USA, 2022. [Google Scholar]
  17. Mignardot, D.; Liao, D.; Markel, L.; Liu, Y. Electromagnetic Penetration of Structures with Applications in Vulnerability Assessment; Technical Report; Oak Ridge National Laboratory (ORNL): Oak Ridge, TN, USA, 2023. [Google Scholar]
  18. Xie, H.; Du, T.; Zhang, M.; Li, Y.; Qiao, H.; Yang, J.; Shi, Y.; Wang, J. Theoretical and Experimental Study of Effective Coupling Length for Transmission Lines Illuminated by HEMP. IEEE Trans. Electromagn. Compat. 2015, 57, 1529–1538. [Google Scholar] [CrossRef]
  19. Ferreira, V.; Zanghi, R.; Fortes, M.; Sotelo, G.; Silva, R.d.B.M.; Souza, J.; Guimarães, C.; Gomes, S., Jr. A survey on intelligent system application to fault diagnosis in electric power system transmission lines. Electr. Power Syst. Res. 2016, 136, 135–153. [Google Scholar] [CrossRef]
  20. Horibe, M. Performance comparisons between impedance analyzers and vector network analyzers for impedance measurement below 100 MHz frequency. In Proceedings of the 2017 89th ARFTG Microwave Measurement Conference (ARFTG), Honolulu, HI, USA, 9 June 2017; pp. 1–4. [Google Scholar]
  21. Bridges, J.; Wells, W.; Peach, L.; Emberson, W.; Townsend, L.; IIT Research Institute. EMP preferred test procedures. Revision. NASA STI/Recon Tech. Rep. N 1977, 77, 31383. [Google Scholar]
  22. Cui, Z.; Grassi, F.; Pignari, S.A.; Wei, B. Pulsed current injection setup and procedure to reproduce intense transient electromagnetic disturbances. IEEE Trans. Electromagn. Compat. 2018, 60, 2065–2068. [Google Scholar] [CrossRef]
  23. IEC:61000-4-25; Electromagnetic Compatibility (EMC)—Part 4-25: Testing and Measurement Techniques—HEMP Immunity Test Methods for Equipment and Systems. International Electrotechnical Commission: Geneva, Switzerland, 2021.
  24. Liao, D.; Liu, Y.; Markel, L.; Mcconnell, B.; Mignardot, D.; Poole, B.R.; Wang, L. A Systematic Approach for Estimating High-Altitude Electromagnetic Pulse Coupling onto Power Generation Facility Equipment; Technical Report; Oak Ridge National Laboratory (ORNL): Oak Ridge, TN, USA, 2023. [Google Scholar]
  25. Benmouyal, G.; Schweitzer, E.; Guzman, A. Synchronized phasor measurement in protective relays for protection, control, and analysis of electric power systems. In Proceedings of the 57th Annual Conference for Protective Relay Engineers, College Station, TX, USA, 1 April 2004; pp. 419–450. [Google Scholar] [CrossRef]
  26. Jiang, J.A.; Lin, Y.H.; Yang, J.Z.; Too, T.M.; Liu, C.W. An adaptive PMU based fault detection/location technique for transmission lines. II. PMU implementation and performance evaluation. IEEE Trans. Power Deliv. 2000, 15, 1136–1146. [Google Scholar] [CrossRef]
  27. Lin, Y.H.; Liu, C.W.; Chen, C.S. A new PMU-based fault detection/location technique for transmission lines with consideration of arcing fault discrimination-part I: Theory and algorithms. IEEE Trans. Power Deliv. 2004, 19, 1587–1593. [Google Scholar] [CrossRef]
  28. Wu, Y.; Yin, H.; Qiu, W.; Liu, Y.; Gao, S. Optimal PMU design based on sampling model and sensitivity analysis. Int. J. Electr. Power Energy Syst. 2023, 148, 109004. [Google Scholar] [CrossRef]
  29. Hewitson, L.; Brown, M.; Balakrishnan, R. Practical Power System Protection; Elsevier: Burlington, MA, USA, 2004. [Google Scholar]
  30. Leelaruji, R.; Vanfretti, L. Power System Protective Relaying: Basic Concepts, Industrial-Grade Devices, and Communication Mechanisms; KTH Royal Institute of Technology: Stockholm, Sweden, 2011. [Google Scholar]
  31. IEEE:C37.90-2005; IEEE Standard for Relays and Relay Systems Associated with Electric Power Apparatus. Technical Report; IEEE Standard: New York, NY, USA, 2006. [CrossRef]
  32. Blackburn, J.L.; Domin, T.J. Protective Relaying: Principles and Applications; CRC Press: Boca Raton, FL, USA, 2006. [Google Scholar]
  33. General Electric D60 Line Distance Protection System. 2023. Available online: https://www.gegridsolutions.com/products/brochures/Multilin-D60-brochure-EN-12592N-LTR-202302.pdf (accessed on 16 November 2023).
  34. General Electric T60 Transformer Protection System. 2023. Available online: https://www.gegridsolutions.com/products/brochures/Multilin-T60-brochure-EN-12650P-LTR-202303.pdf (accessed on 16 November 2023).
  35. General Electric C70 Capacitor Bank Protection and Control System. 2023. Available online: https://www.gegridsolutions.com/products/brochures/Multilin-C70-brochure-EN-12755M-LTR-202303.pdf (accessed on 16 November 2023).
  36. Chin, W.L.; Chen, S.G. IEEE 1588 clock synchronization using dual slave clocks in a slave. IEEE Commun. Lett. 2009, 13, 456–458. [Google Scholar] [CrossRef]
  37. Malarić, R.; Mostarac, P.; Petrović, G.; Havelka, J. Method for nonlinear fitting and impedance analysis with lcr meter. In Proceedings of the 2016 MIXDES-23rd International Conference Mixed Design of Integrated Circuits and Systems, Łódź, Poland, 23–25 June 2016; pp. 410–414. [Google Scholar]
  38. Palmer, K.D.; van Rooyen, M.W. Simple broadband measurements of balanced loads using a network analyzer. IEEE Trans. Instrum. Meas. 2006, 55, 266–272. [Google Scholar] [CrossRef]
  39. Szabo, Z.; Park, G.H.; Hedge, R.; Li, E.P. A unique extraction of metamaterial parameters based on Kramers–Kronig relationship. IEEE Trans. Microw. Theory Tech. 2010, 58, 2646–2653. [Google Scholar] [CrossRef]
  40. Mangan, A.M.; Voinigescu, S.P.; Yang, M.T.; Tazlauanu, M. De-embedding transmission line measurements for accurate modeling of IC designs. IEEE Trans. Electron Devices 2006, 53, 235–241. [Google Scholar] [CrossRef]
  41. Ito, H.; Masuy, K. A simple through-only de-embedding method for on-wafer S-parameter measurements up to 110 GHz. In Proceedings of the 2008 IEEE MTT-S International Microwave Symposium Digest, Atlanta, GA, USA, 15–20 June 2008; pp. 383–386. [Google Scholar]
  42. Zhang, L.; Qiu, W.; Yin, H.; Sun, K.; Markel, L.C.; Liao, D.; Li, Z.; McConnell, B.W.; Liu, Y. Immunity Study: Port Impedance Measurement of PMU and PCI testing under EMP. IEEE Trans. Ind. Appl. 2023, 59, 7250–7258. [Google Scholar] [CrossRef]
  43. IEC:61000-2-10; Electromagnetic Compatibility (EMC)—Part 2-10: Environment—Description of HEMP Environment—Conducted Disturbance. International Electrotechnical Commission: Geneva, Switzerland, 2021.
  44. IEC:61000-4-4; Electromagnetic Compatibility (EMC)—Part 4-4: Testing and Measurement Techniques—Electrical Fast Transient/Burst Immunity Test. International Electrotechnical Commission: Geneva, Switzerland, 2004.
  45. IEC:61000-4-18; Electromagnetic Compatibility (EMC)—Part 4-18: Testing and Measurement Techniques—Damped Oscillatory Wave Immunity Test. International Electrotechnical Commission: Geneva, Switzerland, 2019.
  46. Vance, E.F. Coupling to Shielded Cables; Wiley: Hoboken, NJ, USA, 1978. [Google Scholar]
  47. Horton, R.; Perry, C.; Leonardi, B.; Philips, B.; Snider, J.; Butterfield, J.; Bhatt, N.; Arritt, B. High-Altitude Electromagnetic Pulse and the Bulk Power System: Potential Impacts and Mitigation Strategies; Electric Power Research Institute: Palo Alto, CA, USA, 2019. [Google Scholar]
  48. IEC:61000-2-9; Electromagnetic Compatibility (EMC)—Part 2: Environment—Section 9: Description of HEMP Environment—Radiated Disturbance. Basic EMC Publication; International Electrotechnical Commission: Geneva, Switzerland, 1996.
Figure 1. EMP time domain representation [8].
Electronics 13 01336 g001
Figure 2. Framework of impedance measuring.
Electronics 13 01336 g002
Figure 3. Non-uniform wire propagation model for de-embedding based on the fixture.
Electronics 13 01336 g003
Figure 4. Examples of the impedances and phase angles across the frequency range. (a,b) depict measurement results after de-embedding, while (c,d) present integrated measurement results after data processing.
Electronics 13 01336 g004aElectronics 13 01336 g004b
Figure 5. The circuit diagram of PCI test: (a) EC5 level and (b) EC8 level.
Electronics 13 01336 g005
Figure 6. The open-circuit voltage and short-circuit current of PCI generator: (a) EC5 level and (b) EC8 level.
Electronics 13 01336 g006
Figure 7. Transmission line model and plane wave excitation source.
Electronics 13 01336 g007
Figure 8. Impedance and phase angle measurements for ports under powered-off and powered-on conditions: (a) power port and (b) transformer port.
Electronics 13 01336 g008
Figure 9. Impedance and phase angle measurements for VT and CT: (a) VT phase A to ground, (b) VT phase B to phase C, and (c) CT phase A to ground.
Electronics 13 01336 g009
Figure 10. PCI method EC5 immunity test results.
Electronics 13 01336 g010
Figure 11. EC8 immunity test results.
Electronics 13 01336 g011
Figure 12. Relay voltage and current transients resulting from HEMP E1 event.
Electronics 13 01336 g012
Table 1. Features of three impedance measuring instruments.
LCR MeterImp. AnalyzerVNA
NameMCR-5200HP 4395APlanar TR1300/1
Adapter-HP 87512AN1.1 Calibration Kit
Freq. range40 Hz–200 kHz10 Hz–500 MHz300 kHz–1.3 GHz
Imp. range0.1 mΩ–99.99 MΩ<40 kΩ-
Accuracy>0.1%3–10%0.5–3%
Table 2. Parameter requirements for damped sinusoids under EC5.
Rise TimeOscillation FrequencyDecaying
Open-circuit voltage5 ns ± 30%(3, 10, 30) MHz ± 10% P k 5 > 50 % P k 1 ;
P k 10 < 50 % P k 1
Short-circuit current3 MHz: <330 ns;
10 MHz: <100 ns;
30 MHz: <33 ns
( 3 , 10 , 30 ) MHz ± 30% P k 5 > 25 % P k 1 ;
P k 10 < 25 % P k 1
Table 3. Parameter requirements for double-exponential waveforms under EC8.
Load ResistanceRise TimePulse WidthPeak Voltage
50 Ω ( 5 ± 1.5 ) ns ( 50 ± 15 ) ns4 kV ± 10%
1000 Ω ( 5 ± 1.5 ) ns50 ns (−15 ns to +100 ns)7.6 kV ± 20%
Disclaimer/Publisher’s Note: The statements, opinions and data contained in all publications are solely those of the individual author(s) and contributor(s) and not of MDPI and/or the editor(s). MDPI and/or the editor(s) disclaim responsibility for any injury to people or property resulting from any ideas, methods, instructions or products referred to in the content.

