Article

A New Model of the Limited Availability Group with Priorities for Multi-Service Networks

by
Błażej Nowak
and
Piotr Zwierzykowski
*,†
Institute of Communication and Computer Networks, Faculty of Computing and Telecommunications, Poznan University of Technology, Ul. Polanka 3, 60-965 Poznań, Poland
*
Author to whom correspondence should be addressed.
These authors contributed equally to this work.
Electronics 2024, 13(7), 1174; https://doi.org/10.3390/electronics13071174
Submission received: 10 February 2024 / Revised: 15 March 2024 / Accepted: 20 March 2024 / Published: 22 March 2024

Abstract

:
In this article, a new analytical model is proposed for a limited-availability group serving a mixture of multiservice BPP (Binomial, Poisson, Pascal) traffic. The model assumes that the different traffic classes belonging to this traffic mixture have priorities that affect their ability to be served. The model includes for the first time the possibility of handling priority traffic through a limited availability group and assumes the possibility of handling priority BPP traffic. The proposed model has been subjected to a number of investigations in which a number of different BPP traffic classes and a number of different priority arrangements have been considered. In this article, the authors present exemplary results of the numerical experiments that illustrate the possible applications of this model to analyze links in a multiservice network. The presented computational results were also compared with the results of simulation experiments, which confirmed the satisfactory accuracy of the proposed model. This allows the model to be easily applied in practice for modeling, analysis, and dimensioning of modern multiservice networks, such as cellular or elastic optical networks.

1. Introduction

Present-day ICT networks provide a wide range of very diverse services. Among them we can find mission critical services such as the well-known emergency calls, but they also include online games, movies on demand offered by platforms such as Netflix, Disney+, or Amazon Prime, and, in the near future, much more [1]. Providing quality of service requires implementing network mechanisms to ensure that the availability of resources is aligned with the quality requirements of individual services. The variety of these requirements, from the level of technical parameters (QoS—Quality of Service) to the level of quality perceived from the perspective of the QoE (Quality of Experience) of the end user [2,3] cannot be ignored. An important level of quality of service assessment used in network design for traffic load capability is the level of calls or flows. To describe the quality of service at this level, GoS (Grade of Service) parameters are used [4,5,6,7,8,9,10,11]. Among the basic parameters that assess the quality of service (QoS parameters), we can mention the probability of resource blockage and traffic loss [12,13].
For many years, it has been accepted that the network function responsible for ensuring GoS parameters is the CAC (Call Admission Control) function [14,15,16,17,18,19]. The CAC function in its operation is based on traffic management mechanisms. Over the years a set of basic traffic management mechanisms that can be successfully modeled both analytically and by simulation have been distinguished in the process of network design and analysis (many analytical models which can be used for modeling of the traffic management mechanisms can be found in [12,13]). These mechanisms have been used for years to describe traffic phenomena occurring in networks and more broadly in multiservice systems. Examples of applications of such mechanisms include those used to shape traffic in multiservice cellular networks [20,21,22,23,24] and in elastic optical networks [8,9,25,26,27,28,29,30,31,32,33]. In both types of networks, the consequences of introducing a traffic management mechanism can be seen in both the way nodes and the links between them are modeled. In the process of network design, it is necessary to use analytical or simulation models, both of nodes and network links.
This article will present a new analytical model of a network link carrying a mixture of multiservice traffic with priorities. The model presented in this paper is original. In the authors’ known analysis of multiservice systems, the systems handling a mixture of multiservice BPP (Binomial, Poisson, Pascal) traffic with priorities have also not been analyzed so far. This mechanism, similar to the dynamic reservation mechanism or the threshold mechanism, allows differentiating the quality of service of individual services represented by different traffic classes. Nonetheless, it possesses distinctive features that set it apart from the mechanisms under consideration. Because of its inherent characteristics, prioritization can function as a preventative measure, activating when specific types of traffic or services occur in the network, demanding the highest possible quality of handling.
This article is divided into four sections. Section 2 outlines the proposed model of the limited availability group with a prioritization mechanism. In Section 3, illustrative numerical results are provided to showcase the accuracy and relevance of the proposed analytical model. Finally, the article concludes with a summary highlighting the capabilities of the proposed model, along with its potential applications and avenues for future research.

2. A New Analytical Model of the Link

The structure of the network consists of nodes and links. The most important element of a node from the perspective of modeling is the switching network, but it is not the subject of this article (a wide range of information on different switching networks structures and how to analyze them can be found in the works [34,35], among others). In the case of a link, the way it is modeled depends on the way in which the link’s resources are available. An illustration of this phenomenon can be found in the physical medium of optical fiber, which may have a single core carrying an optical signal or may have multiple cores [36,37]. A single core is available for any of the many optical signals that are at the input of the fiber, as long as its optical capacity and other system parameters allow it. A model of such a link can be a full-availability group (FAG). In the case of a multicore fiber, each signal belonging to the mixture of optical signals that are at the input of the fiber can be transmitted by only one core. Thus, it can be said that the resources of the other cores, although they are part of the link, are not available for a given signal. The model corresponding to such a multicore link is the limited-availability group (LAG) model.
In the remaining part of the section, we will present the LAG model. The use of the FAG model in a system with priorities has been presented in the following works [4,20,38]. The section will first present the basic model of a limited availability group (Section 2.1) and then the new model of a LAG handling priority traffic (Section 2.2).

2.1. Limited-Availability Group

The limited-availability group consists of k individual links referred to as component links (or subgroups), each with a capacity of f AUs. (AUs or Allocation Units are the units used to determine the capacity of resources and the amount of resources required to handle a given request/stream. Its value and how it is determined depends on the type of resource being modeled and the nature of the traffic to be handled. In the case of computer networks, bps or kbps is often taken as AU.) The concept of separation is a result of the call admission algorithm, which dictates that a call can only be accepted for service if there is at least one component link capable of handling the call. Consequently, the algorithm prevents the distribution of the AUs required for a particular call among multiple links.
Our assumption is that the LAG caters to a diverse combination of multiservice BPP (Binomial, Poisson, Pascal) traffic. The division of the BPP traffic into three types of traffic is based on the value of the peakedness factor, which, respectively, for Binominal traffic takes on a value of less than one, for Poisson traffic is equal to one, and for Pascal traffic is greater than one. An example of Binominal traffic is Engset traffic which is generated by a finite number of traffic sources. Therefore, in the further description in the subscripts we will, respectively, use the abbreviations “En” for the Bernoulli traffic, “Po” for the Poisson traffic and “Pa” for the Pascal traffic [39,40,41].
BPP traffic includes three sets: M En , which represents Engset traffic classes; M Po , which represents Poisson traffic classes; and M Pa , which represents Pascal traffic classes. The union of these sets M = M En M Po M Pa comprises all traffic classes with a count of M. Please take note that the combination of BPP traffic encompasses all “Markovian” dependencies relating to the variations in traffic intensity based on the occupancy state. For Poisson traffic of class i, the offered traffic A Po ( i , n ) at occupancy state n AUs is entirely independent of the occupancy state. Regarding Engset traffic A En ( j , n ) , the traffic intensity decreases as the occupancy state n increases. On the other hand, for Pascal traffic A Pa ( l , n ) , the traffic intensity increases in tandem with the increase in the occupancy state n.
Therefore, for Equations (1)–(3), we would write
j M En n [ 1 ; f ] A En ( j , n ) = α En ( j ) [ S En ( j ) y En ( j , n ) ] ,
i M Po n [ 1 ; f ] A Po ( i , n ) = A Po ( i ) ,
l M Pa n [ 1 ; f ] A Pa ( l , n ) = α Pa ( l ) [ S Pa ( l ) + y Pa ( l , n ) ] .
In this context, let S X ( c ) ( X En , Pa ) represent the count of traffic sources of class c for type X. The parameter α X ( c ) denotes the average traffic intensity of the traffic produced by a single available source of class c for type X. Additionally, the parameter y X ( c , n ) indicates the average number of calls of class c for type X that are serviced while the system is in the state of having n busy AUs.
Furthermore, form Equations (1) and (3), we write, respectively, y En ( j , n ) = A E n ( j , n ) = A E n ( j ) and y Pa ( l , n ) = A P a ( l , n ) = A P a ( l ) . That is,
n [ 1 ; f ] A En ( j , n ) = A En ( j ) = α En ( j ) [ S En ( j ) A En ( j ) ] ,
n [ 1 ; f ] A Pa ( l , n ) = A Pa ( l ) = α Pa ( l ) [ S Pa ( l ) + A Pa ( l ) ] ,
in such a way that finally we obtain
j M En A En ( j ) = S En ( j ) α En ( j ) 1 + α En ( j ) ,
l M Pa A Pa ( l ) = S Pa ( l ) α Pa ( l ) 1 α Pa ( l ) .
The average Poisson traffic of class i offered to the limited-availability group (Equation (2)) is independent of the occupancy state and can be computed as follows:
l M Po A Po ( i ) = λ i μ i ,
where λ i is the traffic intensity for class i, and μ i is the parameter of exponential distribution of service time for class i.
The occupancy distribution in the LAG with BPP, having a capacity of k f AUs, can be approximated using the following recursive dependence, as described in [42]:
P ( n ) k f = 1 n { M Po A Po t i σ i ( n t i ) P ( n t i ) k f +                                     + M En α En S En ( j ) y En ( j , n ) t j σ j ( n t j ) P ( n t j ) k f +                                                                         + M Pa α Pa S Pa ( l ) + y Pa ( l , n ) t l σ l ( n t l ) P ( n t l ) k f } ,
where P ( n ) k f represents the probability of having n AUs occupied in the limited-availability group with a capacity of k f AUs, and t i , t j , t l are the numbers of AUs required by a call of given class and type of traffic. The parameter σ c ( n ) in Equation (9) represents the conditional transition probability between states n and n + t c for calls of class c. For a system in the state of having n busy AUs, this parameter determines the probability of the distribution of free AUs in the limited-availability group in such a way that it becomes feasible to serve a new call of class c, as explained in reference [43]:
σ c ( n ) = F ( k f n , k , f , 0 ) F ( k f n , k , t c 1 , 0 ) F ( k f n , k , f , 0 ) .
The function F ( x , k , f , h ) calculates, in a combinatorial manner, the number of arrangements of x free AUs among the k component links, with each link having a capacity of f AUs. The assumption that accompanies this function is that in each component link, there are exactly h free AUs:
F ( x , k , f , h ) = z = 0 x k h f t z + 1 ( 1 ) z k z w k 1 ,
where w = x k ( h 1 ) 1 z ( f h + 1 ) .
The average number of calls of class c for type X serviced when there are n AUs occupied in the LAG is as follows:
y En ( j , n ) = α En ( j ) S En ( j ) y En ( j , n t j ) P ( n ) k f × σ j ( n t j ) P ( n t j ) k f . P ( n ) k f
y Po ( i , n ) = σ i ( n t i ) P ( n t i ) k f . P ( n ) k f
y Pa ( l , n ) = α Pa ( l ) S En ( l ) y Pa ( l , n t l ) P ( n ) k f × σ l ( n t l ) P ( n t l ) k f . P ( n ) k f
The blocking probability is the limited-availability group for class c and be expressed as follows:
E ( c ) = n = 0 k f t c P ( n ) k f 1 σ c ( n ) + n = k f t c + 1 k f P ( n ) k f .

2.2. Model of the LAG with Priorities

Consider a link that handles multiservice traffic with priorities. The essence of the priority mechanism lies in establishing the sequence for allocating resources. Introducing priorities into the system may restrict access to resources for lower-priority class calls, and in case of resource unavailability, it may force the termination of service for lower-priority class calls. The decision regarding priority assignment is made by the operator, who defines the importance of each service in their network. This means that in the network’s access part, the operator identifies the priority assigned to a particular service and applies the appropriate traffic control or packet scheduling mechanism. These actions result in reduced throughput for lower-priority connections or their complete displacement when incoming calls of higher priority cannot be served due to insufficient resources in the system [20,38,44,45].
In the discussed link model, we assume that the operator has assigned three priorities to different services (traffic classes). Each class has the potential to represent various types of traffic, including Engset, Poisson, or Pascal traffic classes. In the model, we assume that the first class has the highest priority, while the last class has the lowest priority. The following rules govern the priority mechanism in the model:
  • Handling calls from lower-priority classes does not affect the blocking probability of calls from higher-priority classes.
  • In the event of insufficient resources, the arrival of a new call with a higher priority leads to the termination of service for currently serviced calls with lower priorities.
Let us assume that our link is modeled using the limited-availability group presented in Section 2.1. Additionally, we will consider that this link offers a mixture of different types of traffic with priorities. In order to explain the principle of the traffic prioritization mechanism, let us consider a system that handles two classes of calls, the first of which has a higher priority. Thus, calls of class two (lower priority) do not affect the process of handling calls of class one (higher priority). Therefore, from the point of view of the first class, the entire capacity of the group can be used by it. This means that the total class one traffic served by this group will be the same as it would be if only this class were independently served by a group of the same capacity and structure. We will use this relationship to explain the logic of the model. For the purpose of analyzing such a system, three simpler systems are considered. The first two systems are supporting systems, meaning that certain results obtained from the analysis of these systems will serve as input parameters for the third system, i.e., the priority system. For the first system, we assume that the link serves only calls with higher priority. The second system is a non-priority system and serves two equally important classes of calls. Systems first and second can be modeled using a limited-availability group with multiservice BPP traffic (Equations (9)–(15)). The fully accessible link in the third system corresponds to the priority system and serves two classes of calls with priorities.
The results obtained from the analysis of the considered supporting systems are denoted with additional numeric subscripts indicating the number of serviced traffic classes. To describe the priority system, an additional index, “P,” has been introduced. In this notation, X 2 ( 1 ) represents the parameter X pertaining to the first class in the system serving two classes of calls, while X 2 ( 1 ) P indicates the value of parameter X specifically for the first class in the priority system serving two classes of calls with priorities. It is important to note that the number of required allocation units and the offered traffic intensity remain constant between the priority systems and the non-priority systems.
Based on the assumptions made, the first system is a full-availability group which serviced only the highest-priority class of calls. The blocking probability in this system can be written as follows:
E = E 1 ( 1 ) ,
According to the notation adopted above, E 1 ( 1 ) represents the blocking probability of first class call in the system serving one (the first) class of calls. This probability can be determined based on Equations (9)–(15), assuming that the link only serves the first class of calls. Once the blocking probability is determined, the total served traffic (first class) in the considered system can be calculated:
Y = Y 1 ( 1 ) = A 1 ( 1 ) t 1 ( 1 ) ( 1 E 1 ( 1 ) ) .
Let us now consider the case of a non-priority group that serves two classes of calls. Therefore, the total served traffic can be described by the following relationship:
Y = Y 2 ( 1 ) + Y 2 ( 2 ) = i = 1 2 A 2 ( i ) t 2 ( i ) ( 1 E 2 ( i ) ) .
In Equations (17) and (18), the parameter Y represents the total served traffic in the system. The blocking probability E 2 ( i ) is determined based on the model given by Equations (9)–(15).
In the third system, the group serves two classes of calls with priorities. According to the assumptions, in the priority system, the service of lower-priority calls (second class) does not impact the service of higher-priority calls (first class). This means that for the first class, the blocking probability and the served traffic in the third system will be the same as in the first system, which serves only one class of calls:
E 1 ( 2 ) P = E 1 ( 1 ) ,
and
Y 1 ( 2 ) P = Y 1 ( 1 ) .
The priority system operates under the assumption that, when there is a scarcity of available resources, calls with higher priority displace lower-priority calls by either compressing them or, if further compression is not feasible, terminating the service for lower-priority calls. Then, the higher-priority calls occupy the resources freed by those lower-priority calls. By assuming the conservation law of traffic [46] as the foundation for further considerations, it can be presumed that the total served traffic in the third priority system is the same as the traffic handled in the second non-priority system [38]. Therefore, it can be expressed as follows:
Y 2 ( 1 ) P + Y 2 ( 2 ) P = Y 2 ( 1 ) + Y 2 ( 2 ) .
In Equation (21), the total served traffic in the non-priority system ( Y 2 ( 1 ) + Y 2 ( 2 ) ) is known and determined by Equation (18):
Y 2 ( 1 ) P + Y 2 ( 2 ) P = i = 1 2 A 2 ( i ) t 2 ( i ) ( 1 E 2 ( i ) ) .
In Equation (22), the traffic of the first class Y 2 ( 1 ) P served in the priority system is determined by Equation (20). Therefore, the traffic of the second class in the priority system can be calculated based on Equations (20) and (22) as follows:
Y 2 ( 2 ) P = i = 1 2 A 2 ( i ) t 2 ( i ) ( 1 E 2 ( i ) ) Y 1 ( 1 ) .
Observe that the traffic Y 2 ( 2 ) P is determined by the difference between the total traffic served in the non-priority system (the second system) and the total traffic served in the single-service system with the highest priority (the first system). Considering the general relationship between traffic offered and traffic served, we obtain
Y 2 ( 2 ) P = A 2 ( 2 ) t 2 ( 2 ) ( 1 E 2 ( 2 ) P ) .
After substituting Equation (24) into Equation (23), it is possible to determine the blocking probability of class two submissions in the system with priority:
E 2 ( 2 ) P = A 2 ( 2 ) t 2 ( 2 ) i = 1 2 A 2 ( i ) t 2 ( i ) 1 E 2 ( i ) + Y 1 ( 1 ) A 2 ( 2 ) t 2 ( 2 ) .
The traffic characteristics offered in all systems are identical: A 1 ( 1 ) = A 2 ( 1 ) , t 1 ( 1 ) = t 2 ( 1 ) and A 2 ( 2 ) = A 2 ( 2 ) P , t 2 ( 2 ) = t 2 ( 2 ) P . Thus, after taking into account dependency Equation (18), Equation (25) can be finally transformed to the following form:
E 2 ( 2 ) P = A 2 ( 1 ) t 2 ( 1 ) E 2 ( 1 ) E 1 ( 1 ) + A 2 ( 2 ) t 2 ( 2 ) E 2 ( 2 ) A 2 ( 2 ) t 2 ( 2 ) .
Based on Equation (26), it can be concluded that the probability of blocking class two (lower priority) applications can be estimated from the probabilities of call blocking in systems one and two.
Let us now assume that the link serves M classes of traffic, each assigned different priorities for calls of class c (Poisson, Engset, or Pascal type). In such a scenario, the computation process can be divided into the following steps:
  • Introduction of data on the traffic offered: sets of classes of individual traffic types M En , M Po , M Pa with appropriate parameters: α X ( c ) , S X ( c ) , t X ( c ) ( X { En , Po , Pa } ) for Engset traffic ( c M En ), and Pascal traffic ( c M Pa ), and Poisson traffic A Po ( c ) , t Po ( c ) ( c M Po ).
  • Determination of initial blocking probability value in a system with c priorities c M E c ( c ) = 0 .
  • Determination of the initial number of traffic classes serviced in the system c = M .
  • Determination of the value of blocking probabilities in a non-priority system servicing c traffic classes
    1 i c E i ( c ) based on the Equations (9), (10) and (15).
  • Determination of the value of blocking probabilities in a non-priority system servicing c 1 traffic classes
    1 i c 1 E i ( c 1 ) based on the Equations (9), (10) and (15).
  • Calculation of the value of the blocking probability of class c in the system with priorities:
    E c ( c ) P = i = 1 c 1 A i ( c ) t i ( c ) E i ( c ) E i ( c 1 ) + A c ( c ) t c ( c ) E c ( c ) A c ( c ) t c ( c ) , where E c ( c ) P is the blocking probability of class c in a system carrying c traffic classes.
  • Decreasing the number of traffic classes: c = c 1 .
  • If c > 1 , then steps 5–7 are repeated. If c = 1 , the algorithm ends.

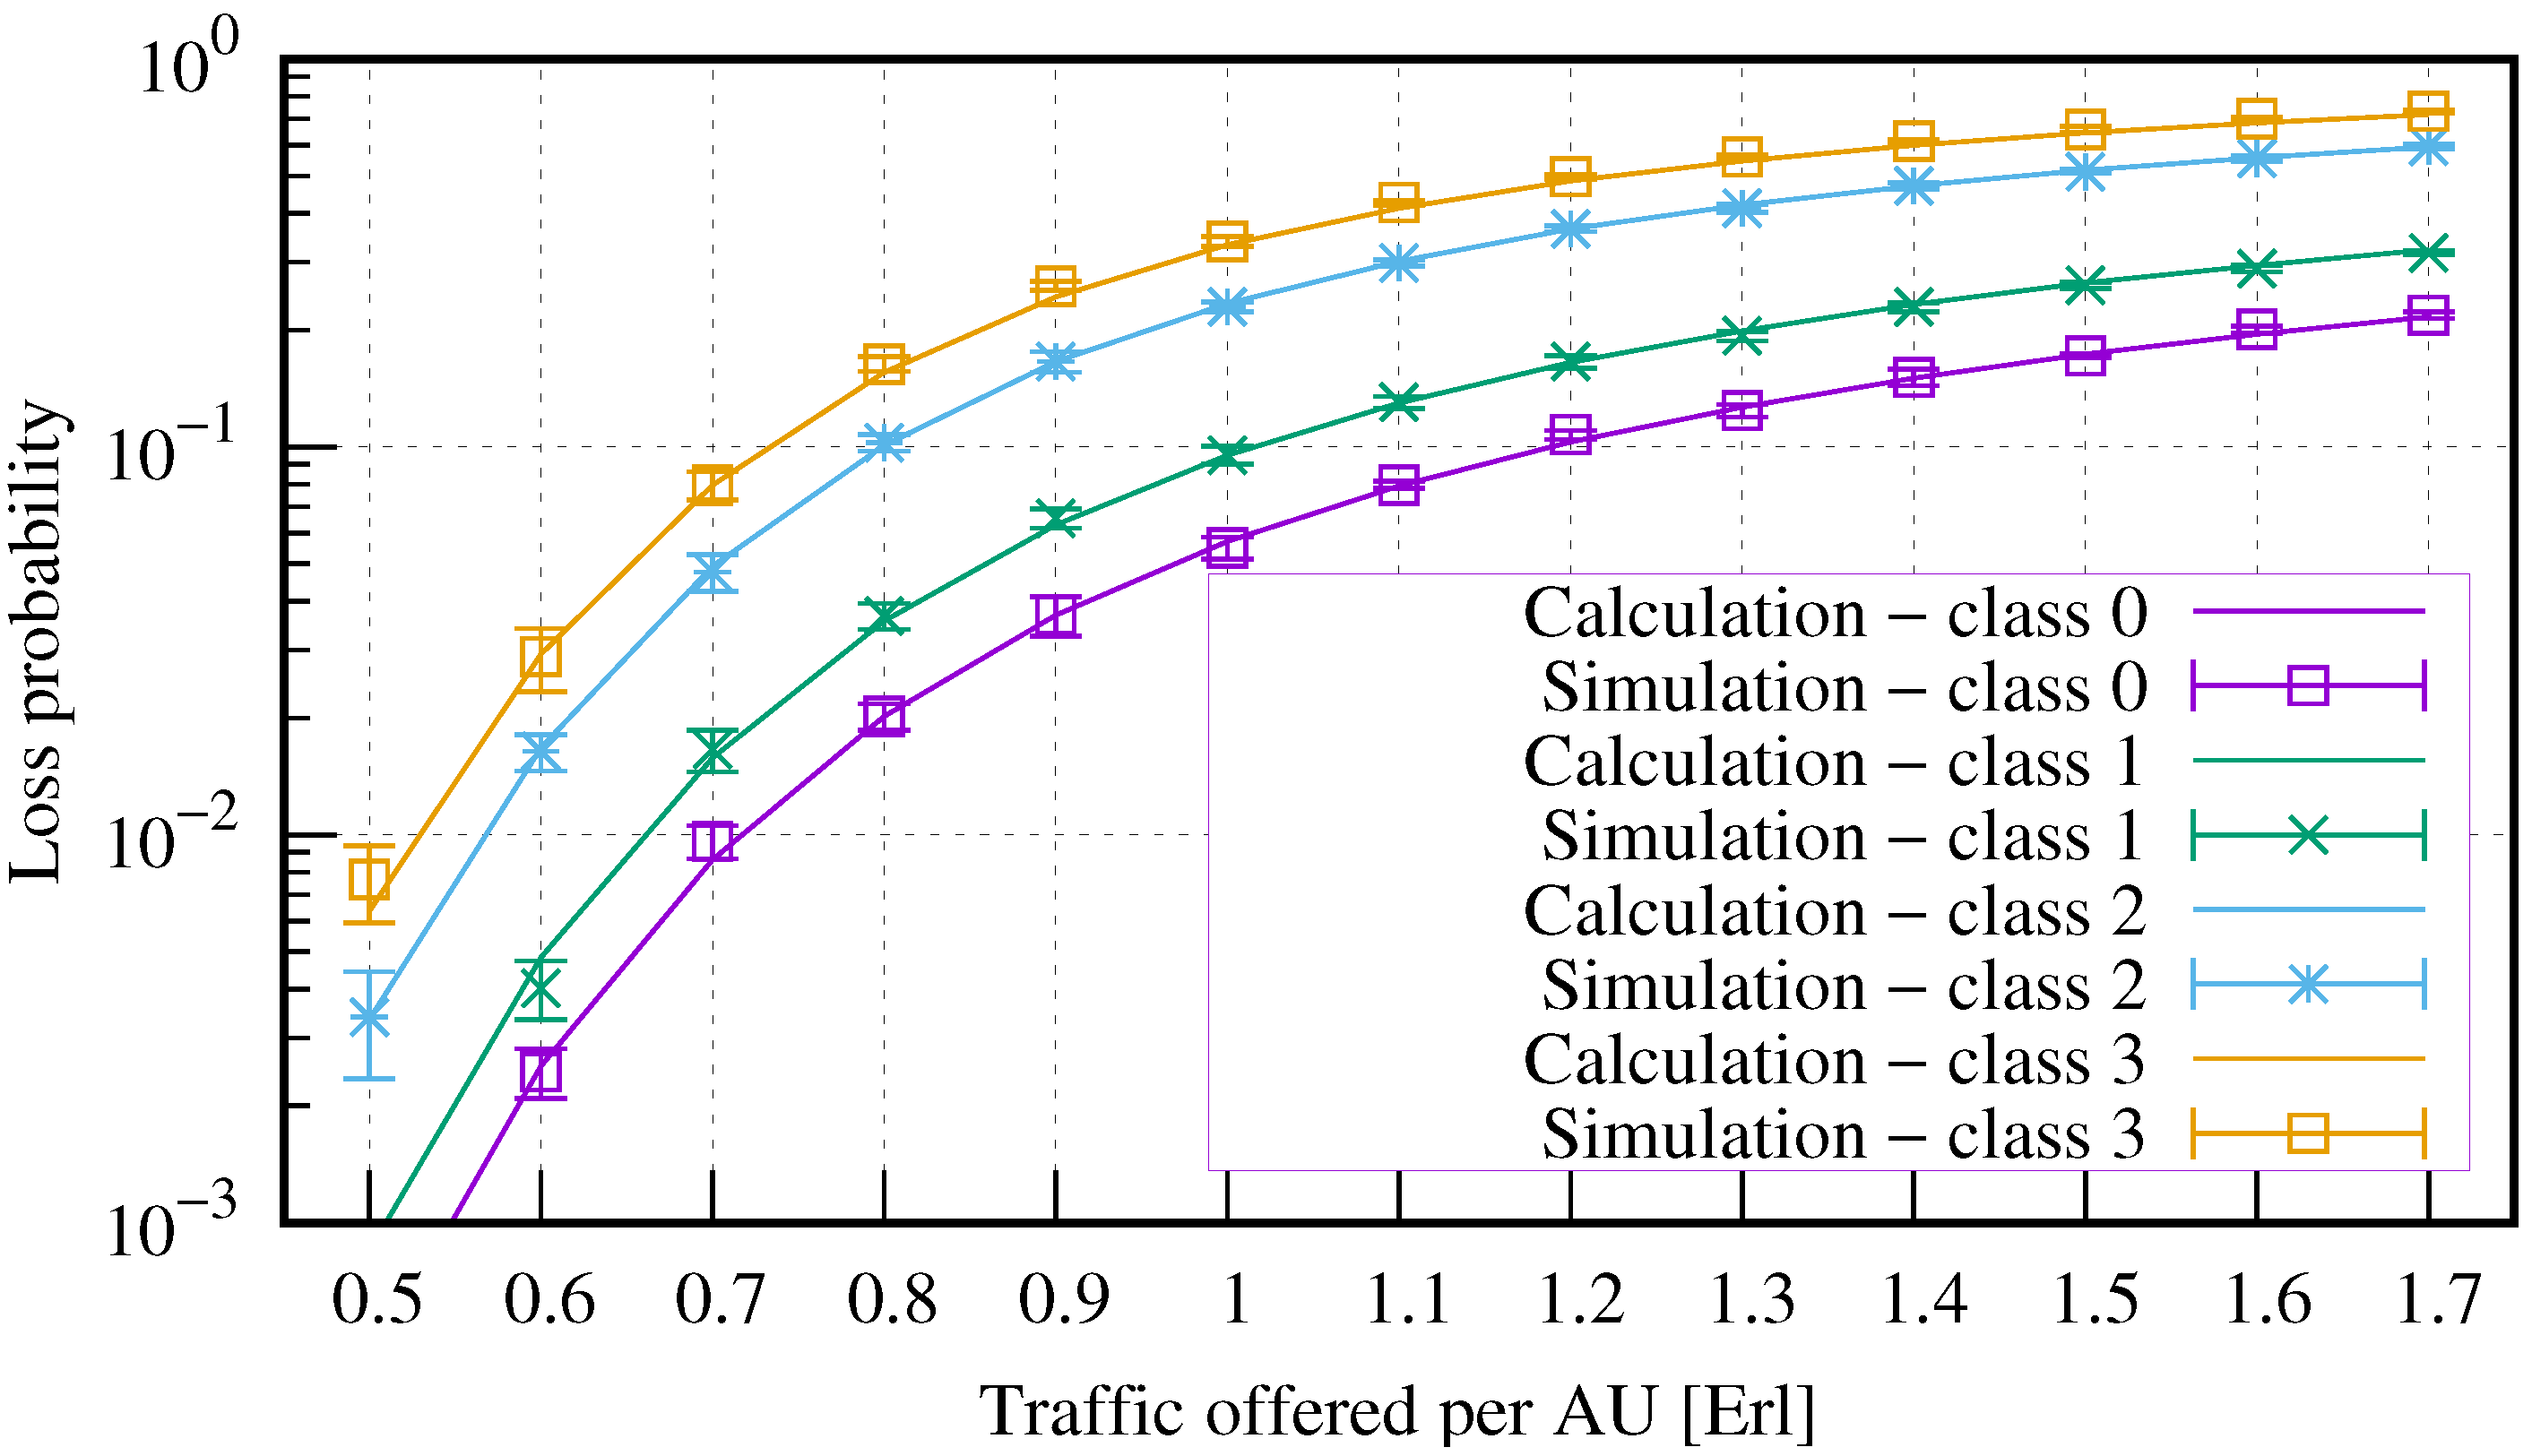
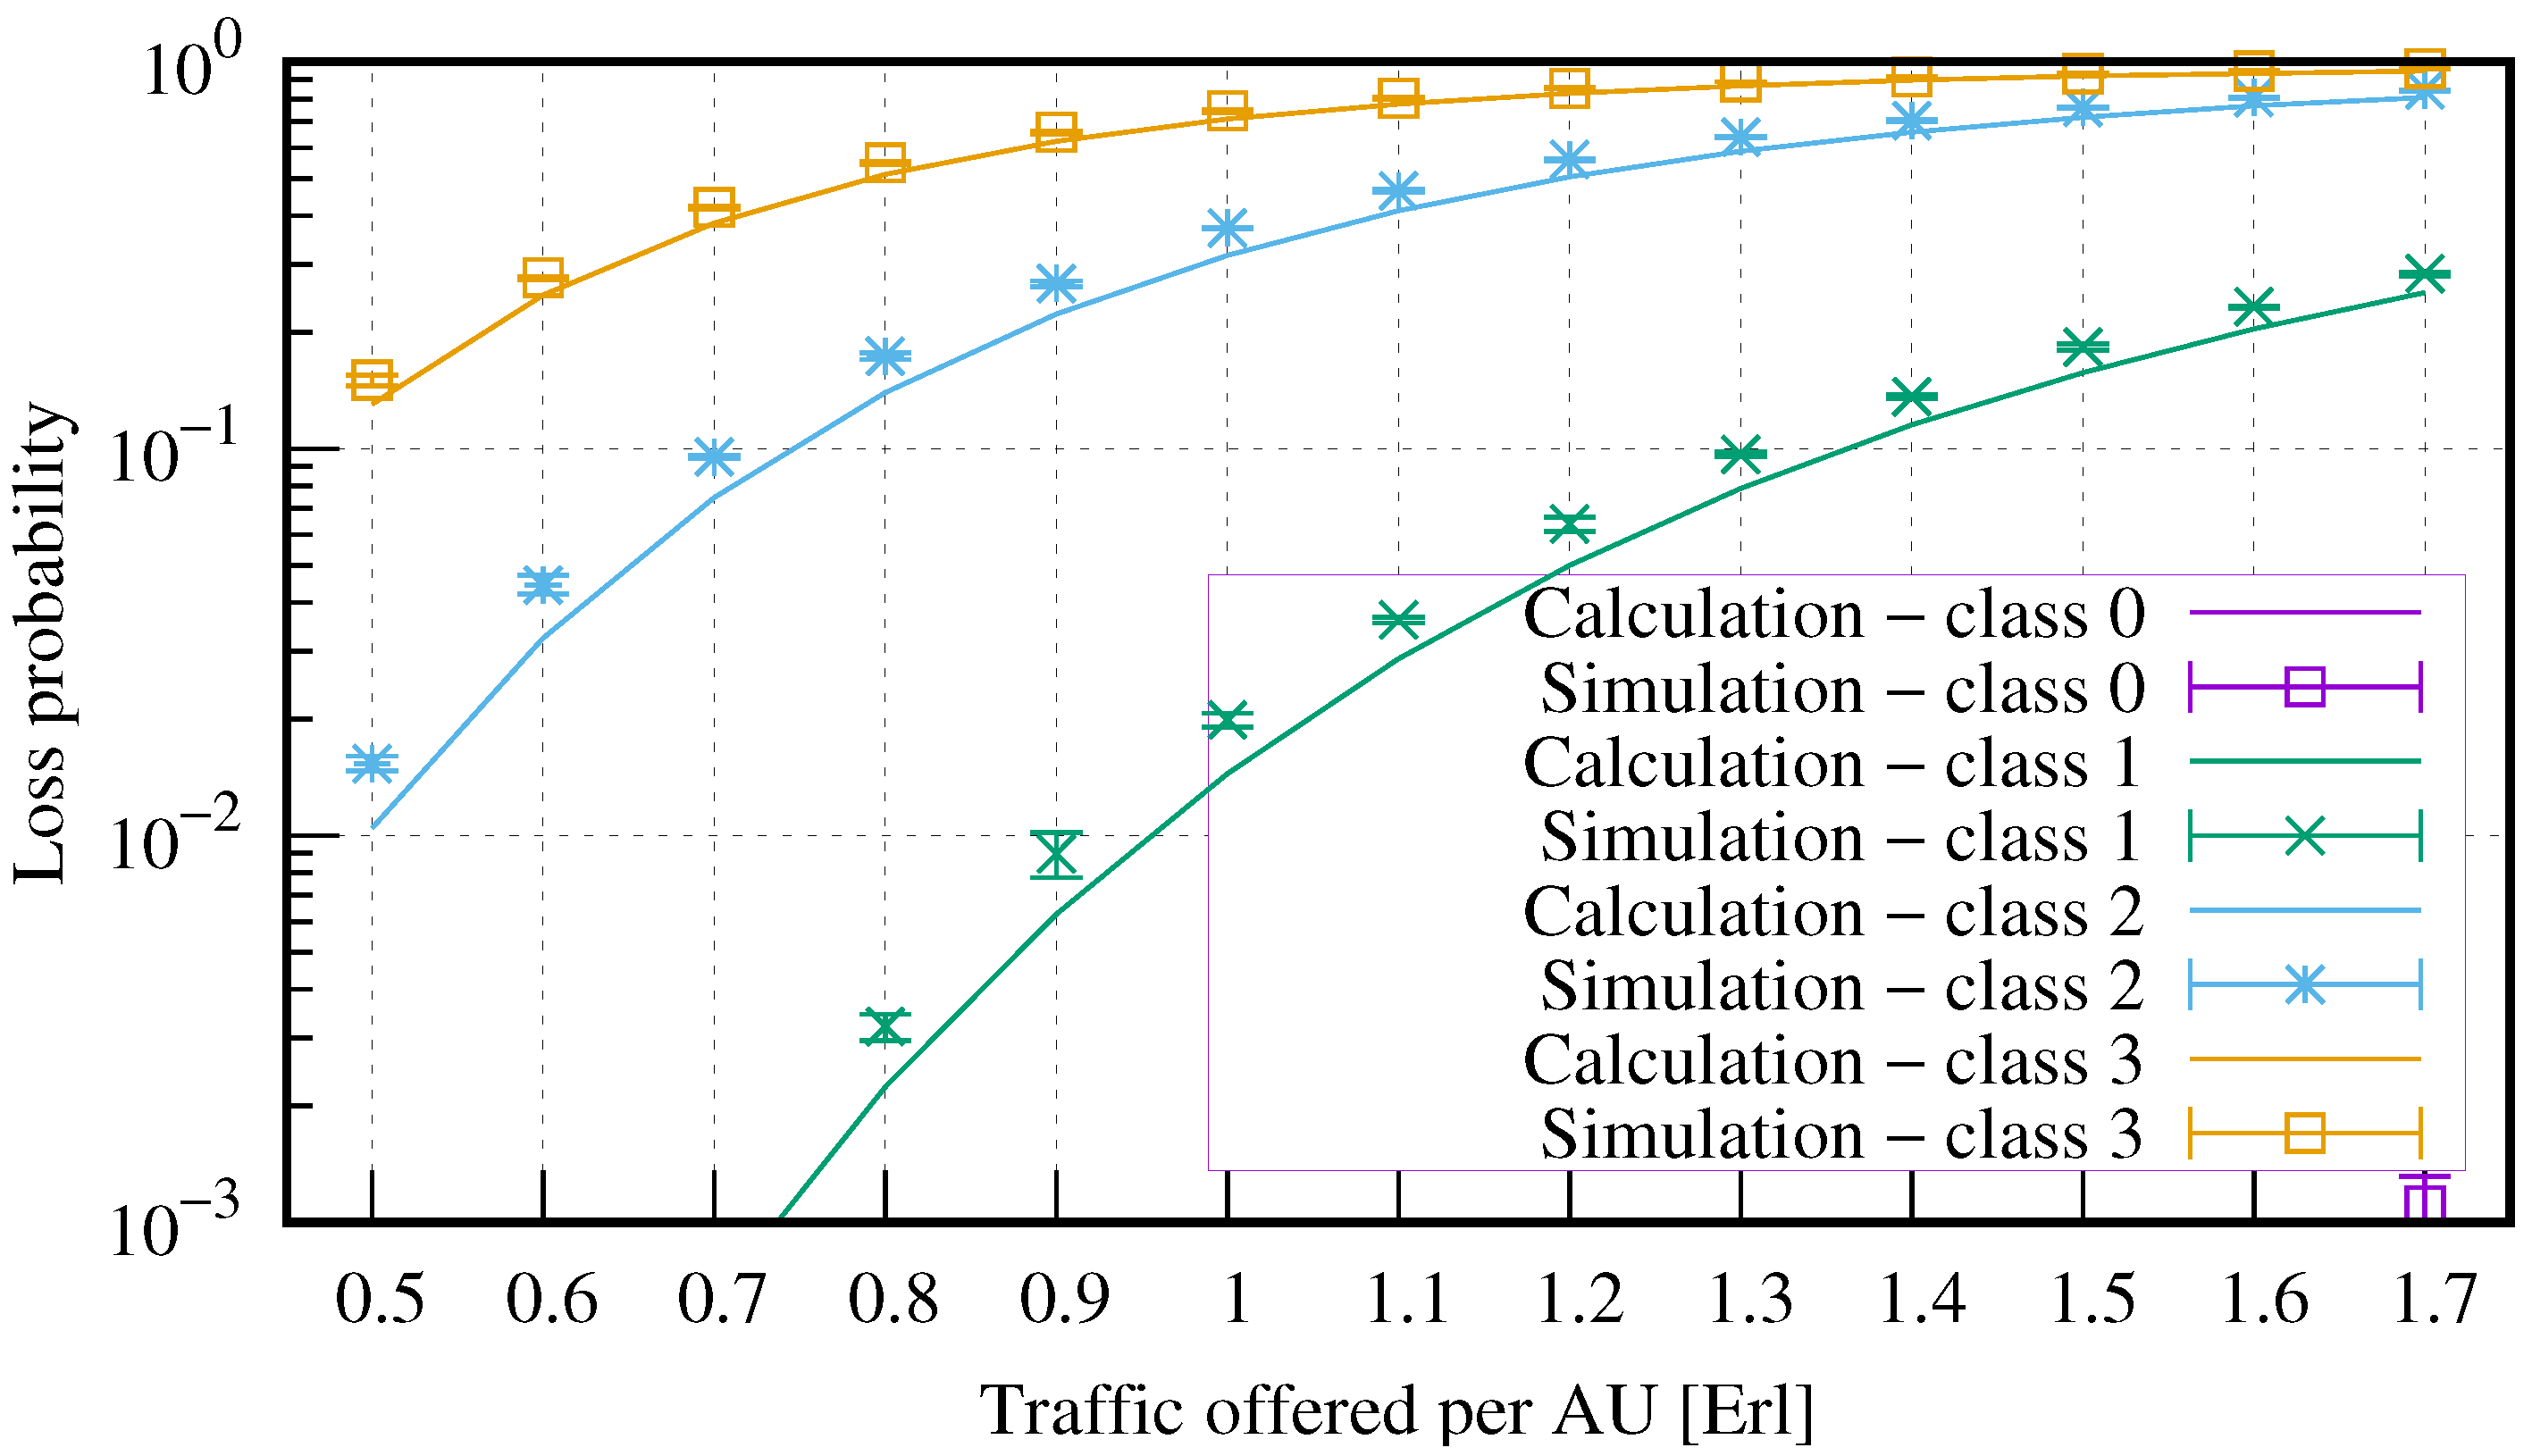
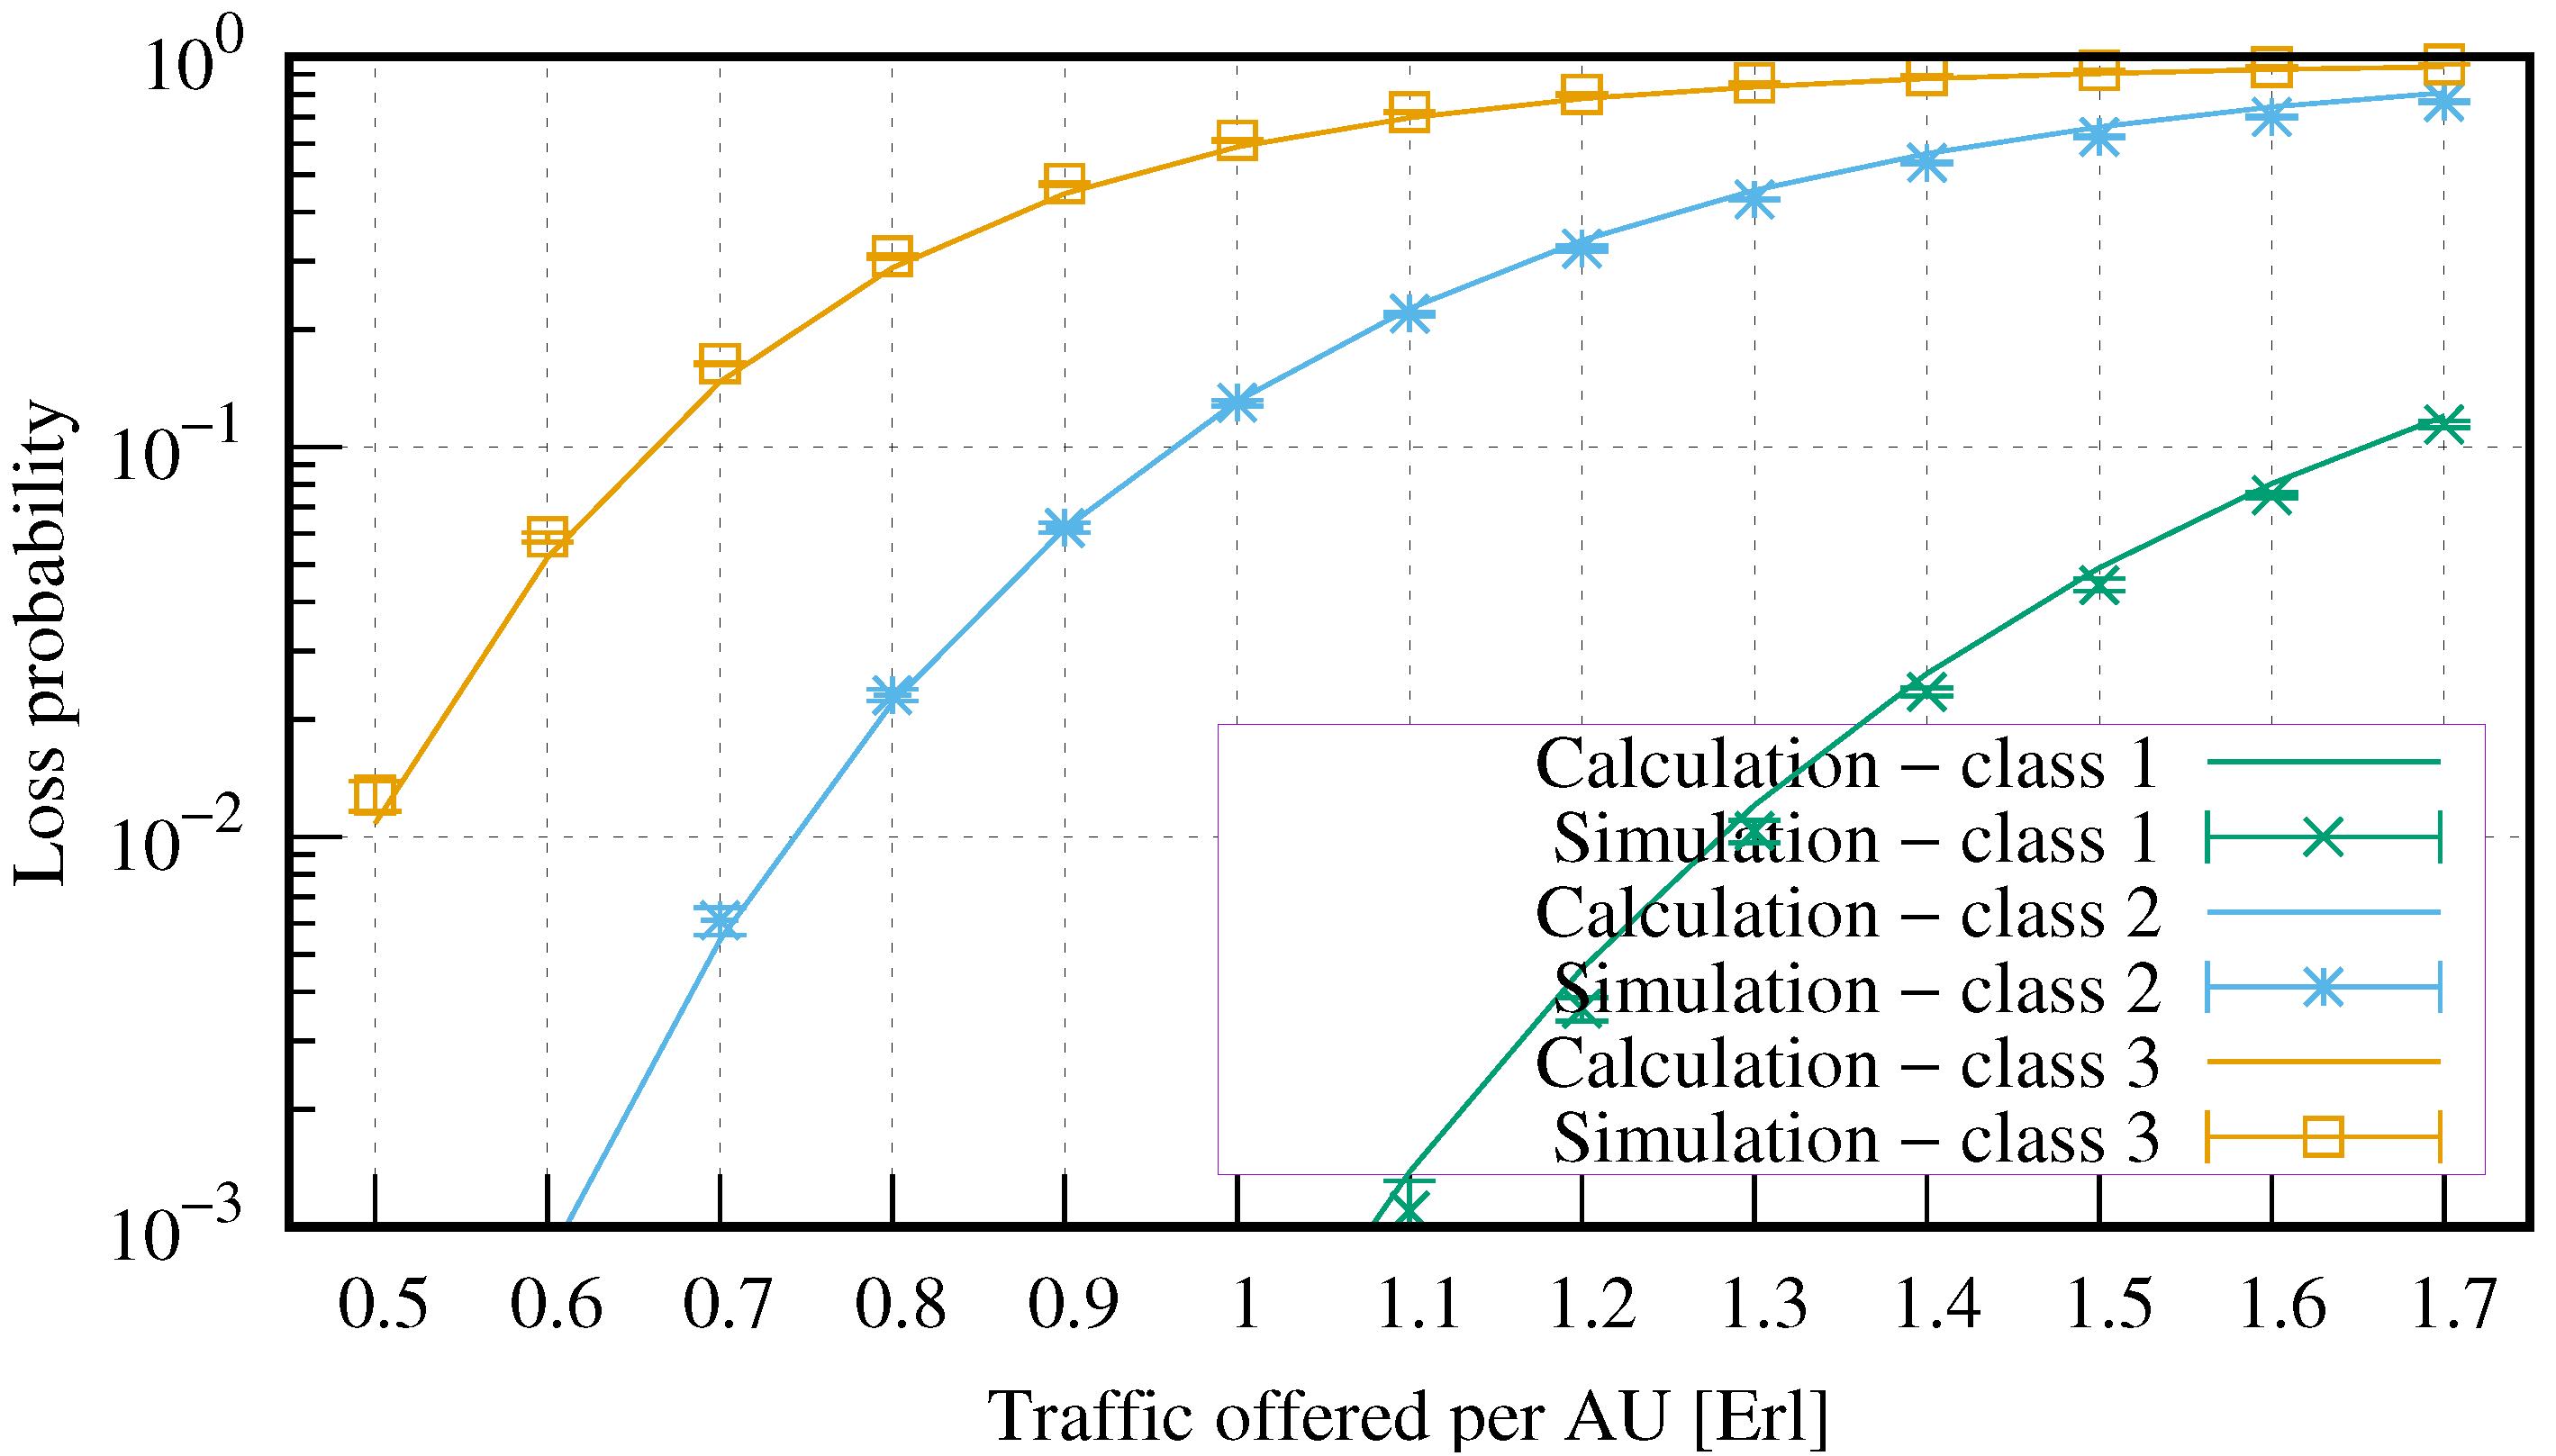
3. Numerical Results

In order to evaluate the feasibility of using the proposed model to analyze and dimension links and nodes in a multiservice network, the section will provide examples of how the model can be used to analyze a group of links jointly serving a mixture of multiservice traffic streams with priorities.
The study was carried out for six groups of links with different internal structure (capacity of component links, their number), which commonly served different mixtures of multiservice traffic with priorities (Systems 2, 3, 5, and 6). To assess the impact of the introduction of priorities on the precision and value of the results obtained, the study also included systems without priorities (i.e., System 1 and System 4). Parameters of the systems under study:
  • System 1 (only Poisson traffic; non-priority system)
    f = 40 AUs, k = 4 , t Po ( 0 ) = 4 AUs, t Po ( 1 ) = 5 AUs, t Po ( 2 ) = 8 AUs, t Po ( 3 ) = 10 AUs.
  • System 2 (only Poisson traffic; with priorities; the smaller the AU call, the higher the priority):
    f = 40 AUs, k = 4 , t Po ( 0 ) = 4 AUs, t Po ( 1 ) = 5 AUs, t Po ( 2 ) = 8 AUs, t Po ( 3 ) = 10 AUs.
  • System 3 (only Poisson traffic; with priorities; the smaller the AU call, the higher the priority):
    f = 20 AUs, k = 4 , t Po ( 0 ) = 4 AUs, t Po ( 1 ) = 5 AUs, t Po ( 2 ) = 8 AUs, t Po ( 3 ) = 10 AUs.
  • System 4 (BPP traffic; non-priority system):
    f = 40 AUs, k = 4 , t Po ( 0 ) = 4 AUs, t Po ( 1 ) = 5 AUs, t Pa ( 2 ) = 8 AUs, t Po ( 3 ) = 10 AUs. A total of 250 traffic sources for Engset and Pascal classes.
  • System 5 (BPP traffic; with priorities, the smaller the AU call, the higher the priority):
    f = 40 AUs, k = 4 , t Po ( 0 ) = 4 AUs, t En ( 1 ) = 5 AUs, t Pa ( 2 ) = 8 AUs, t Po ( 3 ) = 10 AUs. A total of 250 traffic sources for Engset and Pascal classes.
It was also assumed that BPP traffic is offered to each system in the following proportion:
A X ( 0 ) t X ( 0 ) : A X ( 1 ) t X ( 1 ) : A X ( 2 ) t X ( 2 ) : A X ( 3 ) t X ( 3 ) = 1 : 1 : 1 : 1 .
The results of the study are presented in the form of figures, which show, on a logarithmic scale, the calculated probabilities of loss of calls of each class and the corresponding simulation results, depending on the average traffic volume per unit of allocation in the system:
a = c M A X ( c ) t X ( c ) k f ,
where X { En , Po , Pa } and M = M En M Po M Pa .
Each simulation experiment consisted of seven independent runs, and the duration of a single run was 100 , 000 units of system time, with a factor of 500 units of time taken as the system stabilization time. The results of the simulation experimenters were statistically analyzed to determine the confidence intervals based on the t-student distribution.
After analyzing the initial three systems, certain patterns emerge (Figure 1, Figure 2 and Figure 3). To begin with, System 1 outcomes act as a reference point for Systems 2 and System 3.
In System 1, typical results for a regular LAG with multiservice traffic, where calls demanding more resources tend to have a higher probability of loss (Figure 1).
Moving on to System 2 (Figure 2), after implementing priorities, the probability of loss for the highest priority class becomes insignificant to the point that it is not even noticeable on the plot. This is because this class has exclusive access to the LAG. In the event that the links in the LAG start to fill up and there is a possibility of losing a call from the highest priority class, the system checks the LAG’s contents for serviced calls with lower priorities (i.e., t 1 , t 2 , t 3 ). If any of these lower-priority calls are present, they may be displaced by the incoming call if they are to provide enough resources.
Another noteworthy observation when comparing the results of System 2 to those of System 1 is that traffic classes with lower priorities, such as t 2 , can have a lower probability of loss than those without any priorities. This can be attributed to the exponential shape of the call handling time distribution. Without priorities, when the LAG accepts a call that takes an unusually long time of service, it ties up resources until the end of the service process. Conversely, when priorities are in place, calls with extended service time and lower priority are pushed out by higher-priority calls, creating space for calls with potentially shorter service time and thereby enhancing the overall performance of the LAG.
Comparing System 2 (Figure 2) and System 3 (Figure 3) where the capacity of individual resource was reduced by half, we can observe the standard behavior of LAG—reducing the link capacity increases the loss probability. Imposing priorities does not change this behavior.
When we compare System 4 (Figure 4) and System 5 (Figure 5), which are similar to Systems 1 and 2 with a different traffic type, we observe similar behavior between these pairs. Since there is a presence of Engset traffic for class t 1 and Pascal traffic for class t 2 , slightly lower and higher loss probabilities, respectively, can be observed when compared to systems where all sources generate Poisson traffic. The loss chances for Poisson classes remain unchanged.
Observing the results shown in Figure 1, Figure 2, Figure 3, Figure 4 and Figure 5, it can be noted that Figure 2, Figure 3 and Figure 5 do not include results for class 0; although, this class is mentioned in the definition of all the systems shown in these figures. This is due to the very small values of loss probabilities obtained for class 0 calls during the examination of Systems 2, 3, and 5, in which class 0 is the highest priority class. In each of these cases, the obtained loss probabilities were well below the value of 0.001 and were therefore not included in the figures.
Table 1 and Table 2 show a system-wise comparison of each class; for Systems 1 and 2 and 4 and 5, confidence intervals were omitted.
When analyzing Table 1, the impact of priorities is clear. Loss probability of the highest priority class (class 0) is non existent; this could change if the simulation was long enough, and class 1 has significantly reduced loss probability. Classes 2 and 3 experience increased loss probability. Similar results can be observed when analyzing Table 2. When comparing System 2 and System 5, the impact of different traffic types can be noticed. In System 5, class 1 is of Engset type, thus we can observe slight loss probability reduction when comparing to class 1 of System 2. In System 5, class 2 is of Pascal type, thus it experiences increased loss chance when compared to class 2 observed in System 2.

4. Conclusions

This article proposes an analytical model of a limited-availability group designed to handle multiservice BPP traffic with priorities. The model was subjected to intensive evaluation both in terms of its flexibility (structure of the group, variation of the mixture of carried traffic streams) and accuracy. The exemplary results included in the article illustrate its satisfactory accuracy for assessing the probability of blocking a diverse mix of calls in a system with service priorities. The evaluation of the accuracy of the model is based on a comparison of the calculation results obtained with the results of simulation experiments. The model presented is an original model. In the authors’ known analysis of multiservice systems, the systems handling a mixture of multiservice BPP traffic with priorities have also not been analyzed so far. The model presented in this paper can be used to analyze and dimension nodes and links in wired and wireless multiservice networks. In the event of practical implementation, several significant challenges may arise. Careless prioritization without prior simulation could result in severe consequences for certain lower-priority services, potentially leading to significant traffic loss during spikes. Generally, it is advisable to allocate the highest priorities to classes with low volume, such as emergency calls. Another challenge could be the time required for the algorithm to enforce and manage priorities, which may introduce additional latency. Potential future investigations include applying this model to over-the-top CDNs and expanding the simulation to include analytical models for Clos switching networks with multicast connections.

Author Contributions

B.N. and P.Z.: conceptualization, validation, writing—review and editing; B.N.: data curation, formal analysis, investigation, methodology, resources, software, visualization, writing—original draft; P.Z.: funding acquisition, project administration, supervision. All authors have read and agreed to the published version of the manuscript.

Funding

This research was funded by the Polish Ministry of Science and Higher Education (No. 0313/SBAD/1311).

Data Availability Statement

Data are contained within the article.

Conflicts of Interest

The authors declare no conflicts of interest.

References

  1. Dwivedi, Y.K.; Hughes, L.; Baabdullah, A.; Ribeiro-Navarrete, S.; Giannakis, M.; Al-Debei, M.; Dennehy, D.; Metri, B.; Buhalis, D.; Cheung, C.; et al. Metaverse beyond the hype: Multidisciplinary perspectives on emerging challenges, opportunities, and agenda for research, practice and policy. Int. J. Inf. Manag. 2022, 66, 102542.1–102542.55. [Google Scholar] [CrossRef]
  2. Kowalik, K.; Andruloniw, P.; Partyka, B.; Zwierzykowski, P. Telecom Operator’s Approach to QoE. J. Telecommun. Inf. Technol. 2022, 2, 26–34. [Google Scholar] [CrossRef]
  3. Andruloniw, P.; Kowalik, K.; Partyka, B.; Zwierzykowski, P. Multi-Layer QoE Learning System Implemented by Fiberhost. Appl. Sci. 2023, 13, 2300. [Google Scholar] [CrossRef]
  4. Nowak, B.; Piechowiak, M.; Stasiak, M.; Zwierzykowski, P. An analytical model of a system with priorities servicing a mixture of different elastic traffic streams. Bull. Pol. Acad. Sci. Tech. Sci. 2020, 68, 263–270. [Google Scholar] [CrossRef]
  5. Glabowski, M.; Sobieraj, M.; Stasiak, M. Modelling Limited-Availability Groups with BPP Traffic and Bandwidth Reservation. In Proceedings of the 2009 Fifth Advanced International Conference on Telecommunications, Venice/Mestre, Italy, 24–28 May 2009; pp. 89–94. [Google Scholar] [CrossRef]
  6. Sobieraj, M.; Stasiak, M.; Weissenberg, J.; Zwierzykowski, P. Single hysteresis model for limited-availability group with BPP traffic. J. Telecommun. Inf. Technol. 2013, 3, 89–96. [Google Scholar]
  7. Sobieraj, M.; Stasiak, M.; Zwierzykowski, P. Model of the Threshold Mechanism with Double Hysteresis for Multi-service Networks. In Proceedings of the Computer Networks: Computer Networks: 19th International Conference, CN 2012, Szczyrk, Poland, 19–23 June 2012; Kwiecień, A., Gaj, P., Stera, P., Eds.; Springer: Berlin/Heidelberg, Germany, 2012; pp. 299–313. [Google Scholar]
  8. Sobieraj, M.; Zwierzykowski, P.; Leitgeb, E. Determination of Traffic Characteristics of Elastic Optical Networks Nodes with Reservation Mechanisms. Electronics 2021, 10, 1853. [Google Scholar] [CrossRef]
  9. Sobieraj, M.; Zwierzykowski, P.; Leitgeb, E. Modelling and Optimization of Multi-Service Optical Switching Networks with Threshold Management Mechanisms. Electronics 2021, 10, 1515. [Google Scholar] [CrossRef]
  10. Vlasakis, M.; Keramidi, I.; Moscholios, I.; Sarigiannidis, P.; Logothetis, M. A Call Admission Control Mechanism based both on Queueing and the Probabilistic Bandwidth Reservation Policy in Mobile Hotspots. In Proceedings of the 2022 Panhellenic Conference on Electronics & Telecommunications (PACET), Tripolis, Greece, 2–3 December 2022; pp. 1–6. [Google Scholar] [CrossRef]
  11. Keramidi, I.P.; Vardakas, J.S.; Ramantas, K.; Moscholios, I.; Verikoukis, C. Computational Load Management Strategies in Cell-Free-Based, Converged-Optical-Wireless 6G Networks. In Proceedings of the ICC 2023—IEEE International Conference on Communications, Rome, Italy, 28 May–1 June 2023; pp. 5316–5321. [Google Scholar] [CrossRef]
  12. Logothetis, M.; Moscholios, I. Efficient Multirate Teletraffic Loss Models beyond Erlang; John Wiley & Sons, Ltd.: Hoboken, NJ, USA, 2019. [Google Scholar] [CrossRef]
  13. Stasiak, M.; Glabowski, M.; Wisniewski, A.; Zwierzykowski, P. Modeling and Dimensioning of Mobile Wireless Networks: From GSM to LTE; John Wiley & Sons, Ltd.: Hoboken, NJ, USA, 2010. [Google Scholar]
  14. Wei, D.; Zheng, D.; Yang, L.; Cai, R. Low earth orbit satellite admission control scheme based on deep Q-learning. In Proceedings of the 2023 3rd International Conference on Neural Networks, Information and Communication Engineering (NNICE), Guangzhou, China, 24–26 February 2023; pp. 89–92. [Google Scholar] [CrossRef]
  15. Awasthi, C.; Nawal, M.; Kumar Mishra, P. Fuzzy Logic Based Hybrid Approach CAC Scheme in 5G. In Proceedings of the 2021 5th International Conference on Information Systems and Computer Networks (ISCON), Mathura, India, 22–23 October 2021; pp. 1–6. [Google Scholar] [CrossRef]
  16. Imole, O.E.; Walingo, T. Multimedia Call Admission Control for Mobile Terminals in Geostationary Satellite Networks. In Proceedings of the 2019 IEEE AFRICON, Accra, Ghana, 25–27 September 2019; pp. 1–4. [Google Scholar] [CrossRef]
  17. Delgado, O.; Jaumard, B. Joint admission control and resource allocation with GoS and QoS in LTE uplink. In Proceedings of the 2010 IEEE Globecom Workshops, Miami, FL, USA, 6–10 December 2010; pp. 829–833. [Google Scholar] [CrossRef]
  18. Kim, Y.; Pack, S.; Lee, W. Mobility-Aware Call Admission Control Algorithm in Vehicular WiFi Networks. In Proceedings of the 2010 IEEE Global Telecommunications Conference GLOBECOM 2010, Miami, FL, USA, 6–10 December 2010; pp. 1–5. [Google Scholar] [CrossRef]
  19. Perros, H.; Elsayed, K. Call admission control schemes: A review. IEEE Commun. Mag. 1996, 34, 82–91. [Google Scholar] [CrossRef]
  20. Zwierzykowski, P. Modeling Traffic Management Mechanisms in Multi-Service Mobile Networks. Ph.D. Thesis, Poznań University of Technology, Poznań, Poland, 2014. (In Polish). [Google Scholar]
  21. Parniewicz, D.; Stasiak, M.; Zwierzykowski, P. Traffic engineering for multicast connections in multiservice cellular networks. IEEE Trans. Ind. Inform. 2013, 9, 262–270. [Google Scholar] [CrossRef]
  22. Stasiak, M.; Sobieraj, M.; Weissenberg, J.; Zwierzykowski, P. Analytical model of the single Treshold mechanism with hysteresis for multi-service networks. IEICE Trans. Commun. 2012, e95-b, 120–132. [Google Scholar] [CrossRef]
  23. Parniewicz, D.; Stasiak, M.; Zwierzykowski, P. Multicast Connections in Mobile Networks with Embedded Threshold Mechanism. In Proceedings of the Computer Networks—18th Conference, CN 2011, Ustron, Poland, 14–18 June 2011; Kwiecien, A., Gaj, P.S., Eds.; Springer: Berlin/Heidelberg, Germany, 2011; Volume 160, pp. 407–416. [Google Scholar] [CrossRef]
  24. Stasiak, M.; Wiewióra, J.; Zwierzykowski, P. Analytical Model of the WCDMA Radio Interface in UMTS Network with User Differentiation. In Proceedings of the 5th Advanced International Conference on Telecommunications (AICT09), Venice, Italy, 24–28 May 2009; pp. 83–88. [Google Scholar] [CrossRef]
  25. Głąbowski, M.; Sobieraj, M. Simulation Studies of Link Group in Elastic Optical Networks Used in Internet of Things Solutions. Transp. Telecommun. 2023, 24, 278–287. [Google Scholar] [CrossRef]
  26. Głąbowski, M.; Sobieraj, M.; Stasiak, M. Analytical Model of a Single Link of Elastic Optical Networks. IEEE Access 2022, 10, 90200–90212. [Google Scholar] [CrossRef]
  27. Sobieraj, M.; Zwierzykowski, P.; Leitgeb, E. Simulation Studies of Elastic Optical Networks Nodes with Multicast Connections. Hum.-Centric Comput. Inf. Sci. 2022, 12, 05-1–05-13. [Google Scholar] [CrossRef]
  28. Głąbowski, M.; Sobieraj, M.; Stasiak, M.; Leitgeb, E. Analytical Modeling of Switching Fabrics of Elastic Optical Networks. IEEE Access 2020, 8, 193462–193477. [Google Scholar] [CrossRef]
  29. Głąbowski, M.; Ivanov, H.; Leitgeb, E.; Sobieraj, M.; Stasiak, M. Simulation studies of elastic optical networks based on 3-stage Clos switching fabric. Opt. Switch. Netw. 2020, 36, 100555. [Google Scholar] [CrossRef]
  30. Gerstel, O.; Jinno, M.; Lord, A.; Yoo, S.B. Elastic optical networking: A new dawn for the optical layer? IEEE Commun. Mag. 2012, 50, S12–S20. [Google Scholar] [CrossRef]
  31. Tomkos, I.; Azodolmolky, S.; Solé-Pareta, J.; Careglio, D.; Palkopoulou, E. A tutorial on the flexible optical networking paradigm: State of the art, trends, and research challenges. Proc. IEEE 2014, 102, 1317–1337. [Google Scholar] [CrossRef]
  32. Kabacinski, W.; Abdulsahib, M.; Michalski, M. Wide-Sense Nonblocking W-S-W Node Architectures for Elastic Optical Networks. IEICE Trans. Commun. 2019, 102-B, 978–991. [Google Scholar] [CrossRef]
  33. Abuelela, E.; Zal, M.; Kabacinski, W. Simultaneous Connections Routing in Wavelength-Space-Wavelength Elastic Optical Switches. Sensors 2023, 23, 3615. [Google Scholar] [CrossRef]
  34. Kabaciński, W. Nonblocking Electronic and Photonic Switching Fabrics; Springer: Berlin/Heidelberg, Germany, 2005. [Google Scholar]
  35. Stasiak, M. Effective Availability in Switching Networks Modeling Issues; Monography; Poznań University of Technology: Poznań, Poland, 2005. (In Polish) [Google Scholar]
  36. Zhu, R.; Zhao, Y.; Yang, H.; Yu, X.; Tan, Y.; Zhang, J.; Wang, N.; Jue, J.P. Multi-dimensional resource assignment in spatial division multiplexing enabled elastic optical networks with multi-core fibers. In Proceedings of the 2016 15th International Conference on Optical Communications and Networks (ICOCN), Hangzhou, China, 24–27 September 2016; pp. 1–3. [Google Scholar] [CrossRef]
  37. Klinkowski, M.; Zalewski, G.; Jaworski, M.; Perello, J.; Spadaro, S. Performance Evaluation of Multi-Core Fiber-based Dynamic Spectrally and Spatially Flexible Optical Network with Limited Transceiver Resources. In Proceedings of the 2019 21st International Conference on Transparent Optical Networks (ICTON), Angers, France, 9–13 July 2019; pp. 1–4. [Google Scholar] [CrossRef]
  38. Parniewicz, D.; Stasiak, M.; Wiewióra, J.; Zwierzykowski, P. An Approximate Model of the WCDMA Interface Servicing a Mixture of Multi-rate Traffic Streams with Priorities. In Computer Performance Engineering: 5th European Performance Engineering Workshop, EPEW 2008, Palma de Mallorca, Spain, 24–25 September 2008; Thomas, N., Juiz, C., Eds.; Springer: Berlin/Heidelberg, Germany, 2008; pp. 168–180. [Google Scholar]
  39. Delbrouck, L. A Unified Approximate Evaluation of Congestion Functions for Smooth and Peaky Traffics. IEEE Trans. Commun. 1981, 29, 85–91. [Google Scholar] [CrossRef]
  40. Delbrouck, L. The Uses of Kosten’s Systems in the Provisioning of Alternate Trunk Groups Carrying Heterogeneous Traffic. IEEE Trans. Commun. 1983, 31, 741–749. [Google Scholar] [CrossRef]
  41. Delbrouck, L. On the Steady-State Distribution in a Service Facility Carrying Mixtures of Traffic with Different Peakedness Factors and Capacity Requirements. IEEE Trans. Commun. 1983, 31, 1209–1211. [Google Scholar] [CrossRef]
  42. Głąbowski, M.; Hanczewski, S.; Stasiak, M.; Weissenberg, J. Modeling Erlang’s ideal grading with multi-rate BPP traffic. Math. Probl. Eng. 2012, 2012, 456910. [Google Scholar] [CrossRef]
  43. Stasiak, M. An approximate model of a switching network carrying mixture of different multichannel traffic streams. IEEE Trans. Commun. 1993, 41, 836–840. [Google Scholar] [CrossRef]
  44. Stasiak, M.; Wiewióra, J.; Zwierzykowski, P. The Analytical Model of the WCDMA interface with priorities in the UMTS network. In Proceedings of the International Symposium on Information Theory and its Applications (ISITA2008), Auckland, New Zealand, 7–10 December 2008. [Google Scholar]
  45. Stasiak, M.; Wiewióra, J.; Zwierzykowski, P. WCDMA Interface in UMTS Network Carrying a Mixture of Multi-rate Traffic with Different Priorities. In Proceedings of the International Conference on Telecommunications, Marrakech, Maroco, 25–27 May 2009; pp. 265–270. [Google Scholar]
  46. Katzschner, L.; Scheller, R. Probability of loss of data traffics with different bit rates hunting one common PCM-channel. In Proceedings of the 8th International Teletraffic Congress, Melbourne, Australia, 10–17 November 1976; pp. 1–8. [Google Scholar]
Figure 1. Loss probability for System 1 (only Poisson traffic; non-priority system).
Electronics 13 01174 g001
Figure 2. Loss probability for System 2 (only Poisson traffic; with priorities; the smaller the AU call, the higher the priority).
Electronics 13 01174 g002
Figure 3. Loss probability for System 3 (reduced individual resource capacity).
Electronics 13 01174 g003
Figure 4. Loss probability for System 4 (BPP traffic; non-priority system).
Electronics 13 01174 g004
Figure 5. Loss probability for System 5 (BPP traffic; with priorities, the smaller the AU call, the higher the priority).
Electronics 13 01174 g005
Table 1. Simulation loss probabilities comparison of System 1 and System 2.
System 1System 2
Traffic Offered per AUClass 0Class 1Class 2Class 3Class 0Class 1Class 2Class 3
0.50.0004890.0009600.0033930.007651000.0001210.012376
0.60.0024530.0040320.0164020.028782000.0019880.056719
0.70.0096310.0165800.0476110.079639000.0119210.153557
0.80.0201890.0366340.1025310.163669000.0467280.290932
0.90.0368550.0655310.1662460.26029400.0001400.0966120.441738
10.0549560.0952500.2297380.33940200.0006450.1668030.569067
1.10.0799040.1302110.2975460.42639400.0024820.2483420.685357
1.20.1075190.1657650.3653560.49761500.0081360.3396140.773264
1.30.1239950.1930640.4129880.55860200.0211320.4283090.827772
1.40.1513030.2293270.4707400.61293200.0417860.5175230.876802
1.50.1720700.2608630.5133840.65875000.0859790.6063750.912321
1.60.2006720.2883530.5539880.70178700.1437620.6829680.931384
1.70.2184560.3168380.5953310.73317800.1829860.7464830.949185
Table 2. Simulation loss probabilities comparison of System 4 and System 5.
System 4System 5
Traffic Offered per AUClass 0Class 1Class 2Class 3Class 0Class 1Class 2Class 3
0.50.0004510.0012740.0028390.005998000.0001240.013104
0.60.0025690.0045510.0160060.029894000.0015210.051729
0.70.0098740.0165450.0488860.082628000.0092190.160706
0.80.0212160.0351370.0968040.154802000.0380840.298639
0.90.0372740.0638560.1680570.25433700.0001180.0892830.420095
10.0585050.0952010.2315800.34520000.0008070.1564610.570705
1.10.0810050.1291020.2989700.42332700.0029820.2241930.672637
1.20.1020570.1586360.3603820.48923800.0089080.3233560.767958
1.30.1253680.1946320.4169660.55558700.0218350.4153580.825324
1.40.1480290.2232920.4630230.60691800.0407660.5011720.872552
1.50.1709540.2565350.5093600.65100600.0711980.5808380.908226
1.60.1907380.2804680.5540940.69137000.1232480.6643920.930823
1.70.2167470.3072600.5906740.72629000.1668050.7222700.948625
Disclaimer/Publisher’s Note: The statements, opinions and data contained in all publications are solely those of the individual author(s) and contributor(s) and not of MDPI and/or the editor(s). MDPI and/or the editor(s) disclaim responsibility for any injury to people or property resulting from any ideas, methods, instructions or products referred to in the content.

