Abstract
To comprehensively investigate the key features of lane-changing (LC) risk for different vehicle types during left and right LC, and to improve the accuracy of LC risk recognition, this paper proposes a key feature selection and risk recognition model based on vehicle trajectory data. Based on a HighD high-precision vehicle trajectory dataset, the trajectory data of LC vehicles and surrounding vehicles of each vehicle type are extracted. SDI (stop distance index) and CI (crash index) are selected as surrogate indicators to calculate the risk exposure level (REL) and risk severity level (RSL). The K-means algorithm is used to cluster the REL and RSL to obtain the LC risk level, which is divided into three levels. The combination of basic features and interaction features of LC vehicles and surrounding vehicles with LC risk levels is constructed as the LC risk feature dataset. Based on the LightGBM (light gradient boosting machine) algorithm, the importance of features is sorted. Finally, a CNN-BiLSTM-Attention model is established to recognize the LC risk of each vehicle type during left and right LC. The results indicate that significant differences exist among different vehicle types and LC directions. Compared with CNNs (convolutional neural networks), LSTM (long short-term memory), and BiLSTM (bi-directional long short-term memory), CNN-BiLSTM-Attention performs best in recognizing the risk of LC in all cases. Moreover, the key feature groups that have the optimal result of recognizing the risk of LC in different cases are obtained.
1. Introduction
Lane-changing (LC) behavior is a critical aspect of the main vehicle behaviors. Particularly on highways, when vehicles are traveling at high speeds, LC maneuvers can significantly increase the risk of collisions or rear-end accidents with other vehicles, or trigger emergency braking and evasive actions by surrounding vehicles [1]. Furthermore, improper or frequent LC at inappropriate locations and times can disrupt the overall traffic flow, reduce the spacing gaps between vehicles, and increase the potential for traffic congestion. Therefore, early recognition of LC risk levels can contribute to enhancing driving safety in situations such as aggressive driving, cutting in, and malicious overtaking, preventing traffic accidents, improving travel quality, and enhancing travel efficiency [2].
In the early years, the research on analyzing and recognizing LC risk was mainly based on historical traffic accident data [3,4] or driving simulators [5]. These approaches provided valuable insights into understanding the influencing factors contributing to LC risk. However, they had certain limitations. Historical traffic accident data analysis allowed for researchers to examine real-world LC accidents and extract useful information regarding LC risk. Nevertheless, this approach was constrained by the availability and quality of the historical traffic accident data, as well as the challenges in accurately attributing causality to specific LC behaviors. Driving simulators offered a controlled environment for researchers to study and simulate various driving scenarios, including LC behaviors. However, driving simulators may not fully replicate real-world driving conditions, and the generalization of findings from simulator studies to actual on-road situations could be limited.
To address these limitations, recent advancements in technology have enabled the collection of high-precision vehicle trajectory data in real-world settings [6]. For instance, cameras, radars, and drones have revolutionized data collection processes, leading to the creation of extensive datasets such as NGSIM (Next Generation Simulation), HighD [7,8], and ExiD [9]. These datasets provide microscopic vehicle behaviors and detailed driving information, allowing for a deeper comprehensive understanding of the complex interactions between vehicles during the LC maneuvers [10]. Throughout in-depth analysis of trajectory data, it becomes possible to identify critical risk trends and anomalies associated with LC.
LC key feature selection and risk recognition serve as crucial components in the development of advanced driver assistance systems (ADASs), which play a pivotal role in assisting drivers to mitigate crash risks and enhance overall road safety. Nevertheless, as each vehicle type possesses unique kinematic performance and driving characteristics [11], during the LC progress, the thresholds for risk levels, the key risk features, and the influence on the adjacent vehicles vary according to the vehicle types [12]. A one-size-fits-all approach to ADASs may not effectively address the needs of all vehicle types. However, the majority of research has paid attention to passenger vehicles; few studies have focused on other vehicle types. Additionally, the LC behavior can be separated into left LC (LLC) and right LC (RLC) according to the LC direction. Due to the differences in traffic situations and blind spots during the LLC and RLC, the key risk features and risk levels may also differ.
Thus, a more in-depth understanding of the LC behaviors and the risk features influencing multi-vehicle types of LLC and RLC needs to be attained. This will support the provision of more scientific LC risk assessment and management. Furthermore, studies on LC risk can advise drivers’ actions and serve as a guide for enhancing driving assistance technologies. Hence, this paper aims to propose a framework to select key LC features and recognize LC risk for multi-vehicle types. The three contributions of this study are (1) determining the thresholds of LC risk levels of LLC and RLC of multi-vehicle types by quantifying the possibility and severity of LC risks; (2) selecting and analyzing the key features for LLC and RLC of each vehicle type based on the LightGBM algorithm; (3) constructing a CNN-BiLSTM-Attention model for LC risk recognition and determining the optimal feature sets for risk recognition in all LC scenarios.
This study is organized as follows: Section 2 provides an overview of the related literature. Section 3 presents the overall methodology, including preparation of the LC feature dataset, the ranking of LC features importance based on LightGBM, and LC risk recognition based on CNN-BiLSTM-Attention. Then, in Section 4, the LC samples extracted from the HighD dataset are presented and applied in this methodology. The LC risk features are selected, and the CNN-BiLSTM-Attention model is used to recognize the LC risk for multi-vehicle types under different risk features. The final section outlines the conclusions of this study.
2. Literature Review
2.1. Trajectory Dataset Used in LC Risk
With the continuous development of information technology, a large vehicle trajectory dataset has been accumulated and widely applied in the field of intelligent transportation. Research on recognizing LC risk using vehicle trajectory datasets can provide important support and guidance for the development of intelligent transportation.
The NGSIM dataset is one of the most widely used vehicle trajectory datasets. Zhang et al. [13] proposed an LC prediction framework based on feature learning. They constructed a temporal dataset with over 1000 features from the NGSIM dataset and introduced a three-step feature learning algorithm based on XGBoost. Chen et al. [14] presented a framework for key feature selection and risk prediction of car LC behavior on highways. They extracted LC candidate features from the NGSIM dataset and employed fault tree analysis (FTA) and K-means algorithm to determine LC risk levels. Recently, LC behavior and risk studies have also made use of a novel vehicle trajectory dataset called HighD [6]. Li et al. [15] extracted 560 LC trajectories from the HighD dataset to determine the parameters influencing the LC duration. Mahajan et al. [16] proposed an LC risk assessment approach that combines modified time-to-collision (MTTC) and CRash IMpact (CRIM) by using the HighD dataset. A DNN (deep neural network)-based algorithm for identifying and predicting vehicle intentions was created by Benterki et al. [17], and this approach was applied to the HighD dataset. Xue et al. [18] proposed a framework to predict left LC and right LC, which is to predict LC decision with XGBoost and LC trajectory with LSTM. The NGSIM and HighD datasets are used to validate the model. In addition, serval scholars have conducted research on LC risk by using their trajectory dataset. Park et al. [19] proposed a method called the lane change risk index (LCRI) to estimate collision risk during LC, using the data obtained by drones from the work zone and general section. Xing et al. [20] utilized vehicle trajectory data from toll plazas to introduce an extended time-to-collision (TTC) measure for assessing vehicle collision risk. Wen et al. [21] collected the trajectory data on the adjacent sections of a tunnel entrance and extracted 615 LC samples. The influence of LC risk indicators was verified using the mixed logit model.
In brief, the trajectory dataset has been extensively utilized in studies on LC behavior risk. The dataset comprises naturalistic driving data collected in a real road traffic environment, reflecting the actual driving behaviors and scenarios. By leveraging the trajectory dataset, researchers can delve into the dynamics of LC maneuvers, uncovering patterns and critical risk indicators associated with LC.
2.2. LC Risk Prediction and Recognition
Predicting and recognizing LC risks helps in the early identification of potential risks during LC maneuvers. The current research in this field primarily concentrates on three main areas: key feature influencing, surrogate safety measurement (SSM) for risk analysis, and LC risk recognition-based intention recognition.
Key features in the LC process mainly include LC gap, LC duration, and LC behavior impact on the following vehicle [22]. Toledo [23] conducted a statistical comparison of LC duration for passenger vehicles and heavy vehicles, respectively, on I-80 in Emeryville, California. Yang [22] extracted 5339 LC incidents from the Shanghai Natural Driving Study, and built the multi-level model to identify the factors affecting lead and lag gap acceptance, then a three-level mixed-effects linear regression model was developed to explore the variables affecting lane change duration. Wang [24] retrieved 5608 cut-in events to identify the characteristics and developed a multilevel mixed-effects linear model to examine the influencing factors of the acceptance of lead and lag gaps. The results showed the gaps were affected by environment variables, vehicle types, and kinematic parameters. Li [25] investigated the LC duration of discretionary LC events based on a trajectory dataset of 2905 passenger cars and 433 heavy vehicles. Four stochastic LC duration models were built according to the vehicle types and LC direction.
Surrogate safety measurements (SSMs) have been widely used to quantify potential traffic risk. Due to the stochastic nature of traffic accidents and the limited accident samples available, SSMs are proposed to quantitatively assess the risk of conflicts between vehicles [26]. An SSM primarily employs various indicators to measure safety, including time-based indicators such as time-to-collision (TTC) and post-encroachment time (PET), space-based indicators such as margin to collision (MTC) and the difference in space distance and stopping distance (DSS), deceleration-based indicators such as deceleration rate to avoid a crash (DRAC), and energy-based indicators such as crash index (CI) and conflict index (CFI). Murata et al. [27] analyzed TTC and ETTC (enhanced time-to-collision) distribution against subject vehicle velocity and relative velocity by using the real vehicle data collected by TOYOTA. Samson [28] mainly studied the difference of SSD between passenger cars and trucks under different scenarios. Fu [29] proposed a collision threshold determination method based on Bayesian hierarchical extreme values using DRAC. Indicators REL and RSL were created by Park [19] based on the SDI to represent the possibility and seriousness of vehicle conflict risks. Yang et al. [22] extracted 5339 LC events from the Shanghai Naturalistic Driving Study, using speed change rate, brake timestamping, and TTC to assess the impact on the following vehicles by the LC events. To determine the LC risk, Wu et al. [30] suggested a temporal and spatial risk estimation (TSRE) to determine real-time LC risk for 1444 LC events from the NGSIM dataset. FTA was employed to combine temporal risk level (TRL) and spatial risk level (SRL) into a comprehensive risk index.
LC risk recognition methods based on LC intention identification aim to determine the likelihood of potential risk by analyzing the interaction between vehicles. The approaches primarily include statistical models and machine learning models. Li et al. [31] built a machine learning-based approach to predict the short-term impacts of LC behaviors. They calculated the LCI on crash risks and traffic operation and estimated the SVR model to predict the LCI based on microscopic parameters. Chen [32] proposed a pre-emptive LC risk level prediction method, containing the ENN-SMOTETomek Link (EST) to resampling and LightGBM to boost the prediction performance. Zhang [33] established the GMM-HMM(hidden Markov model with the Gaussian mixture model) approach to decompose the LC scenarios into primitives. K-means based on DTW (dynamic time warping) is applied to cluster the primitives into 13 LC interaction patterns. Huang [34] identified the driving intention and the risk of surrounding vehicles by establishing a probabilistic driving risk assessment framework. Wang [35] proposed a driving risk assessment method for LC vehicles based on SSM. XGBoost under different optimization algorithms was employed to identify the risk during the LC process. Zhang [36] extracted LC samples from the HighD dataset, and used LightGBM based on Shapley additive explanation to predict LC risk.
In summary, although significant advancements have been made in understanding LC behavior and risk identification through previous studies, there are still some limitations. Most of the research focused only on passenger cars, with limited studies associated with other vehicle types, and few studies have distinguished LLC and RLC behaviors. Additionally, in order to obtain generalizability and portability of LC risk, a significant number of LC samples must be used to examine the influencing features of LC risk. To address these shortcomings, this study aims to propose a framework for LC risk feature selection and risk recognition for multi-vehicle types. With sufficiently large LC samples extracted from the HighD dataset, the key LC risk features will be selected to recognize the LC risk of multi-vehicle types.
3. Methodology
3.1. Overall Framework
The overall research framework of this paper, including 4 steps, is shown in Figure 1. Firstly, the vehicle types are classified by clustering the length and width. All vehicle types’ LC trajectory data are extracted. Secondly, the LC vehicles and surrounding vehicles’ trajectory data are matched based on vehicle information, and the features of LC vehicles, surrounding vehicles, and the interaction features between the vehicles are extracted as candidate LC risk features. Next, the risk exposure level (REL) and risk severity level (RSL) are determined by SDI (stopping distance index) and CI (crash index), respectively. Additionally, a K-means clustering algorithm is used to label the risks of LC; then, the risk level is reconstructed with the candidate LC risk features to establish the LC risk dataset. After that, the LightGBM algorithm is used to select the key features by importance. The features with non-zero importance and the top 200/100/50 ranked features are selected. Finally, the CNN-BiLSTM-Attention model is constructed to recognize the LC risk, comparing the accuracy, recall rate, and F1 score with CNN, LSTM, and BiLSTM under different feature quantities.
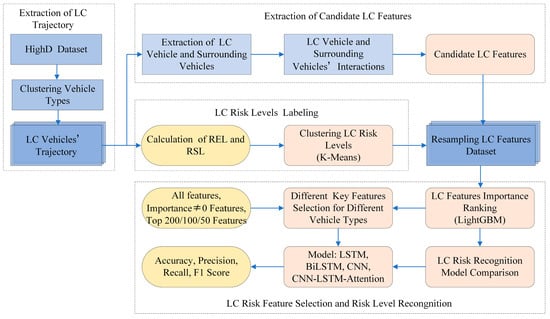
Figure 1.
The framework of the LC risk recognition.
3.2. LC Feature Dataset Preparation
3.2.1. Extraction of LC Trajectory
From the moment a vehicle enters the observing section until it leaves, if the lane ID changes, it can be considered as an LC event. When a vehicle changes lanes, it begins to continuously drift steadily in one direction, with the longitudinal displacement increasing until the end of the LC process, at which moment the longitudinal position no longer deviates [37]. Hence, this study defines the moment when the vehicle begins to continuously deviate longitudinally as the starting time, and the moment when the vehicle no longer deviates longitudinally towards one side as the end time. At the same time, the LC is classified as left lane change (LLC) or right lane change (RLC) based on the changes of lane ID [13].
3.2.2. LC Features
With the continuous advancement of vehicle perception technology, sensors on autonomous vehicles are now capable of perceiving the driving environment through both internal and external sensing. Internal information primarily includes the vehicle’s state such as position, speed, acceleration, jerk, and yaw angle. External information encompasses the position, speed, acceleration, relative distance, and relative velocity of surrounding vehicles [14]. This information plays a crucial role in accurately identifying LC intentions, behaviors, as well as potential risks [38]. To better understand and adapt to various driving scenarios, machine learning algorithms can extract diverse features from trajectory data. Hence, selecting appropriate LC features is essential to enhance the accuracy and reliability of the algorithm, ultimately leading to safer and more intelligent autonomous driving.
The LC process, as illustrated in Figure 2, involves the interaction of the target vehicle (TV) with four surrounding vehicles, which include the current-lane preceding vehicle (CPV), current-lane following vehicle (CFV), target-lane preceding vehicle (TPV), and target-lane following vehicle (TFV) [39].
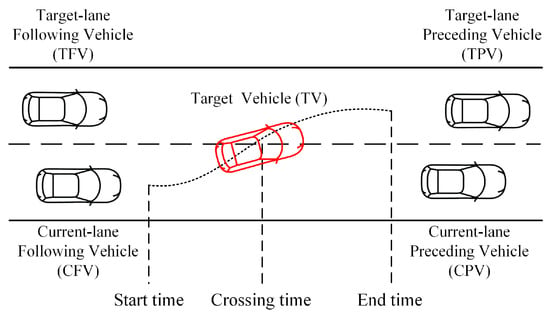
Figure 2.
LC interaction scenario.
This study considers the basic features and interaction features of TV and CPV, CFV, TPV, and TFV as candidate features. A total of 682 features are extracted from each set of LC trajectory data. The explanation of each candidate features is shown in Table 1.

Table 1.
Extracted LC risk candidate features.
3.2.3. Calculation of Risk Indicators for LC
Considering the likelihood and severity of the potential risk, namely, REL and RSL [19], this study chose SDI and CI as the SSMs to evaluate the LC risk [40].
- Calculation of REL
SSD (stopping sight distance) [41] is the minimum distance needed for a vehicle to the complete stop from the start of braking, when there is an obstacle ahead or an emergency stop [28]. SSD for the lead and following vehicles at timestamp t can be determined as Equations (1) and (2):
where, , are the velocity of the lead and following vehicles, , are the acceleration of lead and following vehicles, PRT is the following driver’s reaction time, PRT = 1.5 s, L is the initial distance between the lead and following vehicles.
SDI (stopping distance index) is the rear-end risk between the lead and following vehicles based on SSD:
When , the following vehicle is able to stop safely when the lead vehicle makes a sudden stop, SDI = 0, there will be no collision between the lead and following vehicles, and when , SDI = 1, the lead and following vehicles may collide.
Park [19] introduced risk exposure level (REL), which denotes the percentage of unsafe LC duration (ULCD) within the total LC duration (TLCD). It reflects the likelihood of the potential risk during the LC progress, the value of REL ranges from 0 to 1, as shown in Equation (4):
where ULCD is the duration when SDI = 1; TLCD is the total LC duration.
- Calculation of RSL
The crash index (CI), introduced by Ozbay et al. [42], is a measure of the severity of potential risk. CI incorporates the principles of kinematics, considering the impact of speed on the kinetic energy, along with the time before the potential risk [16]. CI can be obtained by Equation (5):
where MTTC is the modified time-to-collision, which takes into account the effects of speed, acceleration, and the distance between the front and following vehicles [43], as shown in Equations (6) and (7):
Risk severity level (RSL) quantifies the severity of potential risks that may arise during LC maneuvers. RSL is calculated as the ratio of the maximum CI value observed in the LC process of vehicle i to the maximum CI value observed in the LC processes of all vehicles in the same track k. The value of RSL ranges from 0 to 1, as depicted in Equation (8):
Taking the ID = 30 in track01 as an example, the SDI and CI values at each timestamp of TV and CPV during the whole LC progress can be obtained according to Equations (3) and (5), and the values of REL and RSL are calculated, respectively, as in Figure 3.

Figure 3.
A sample of the calculation of REL and RSL. (a) The calculation of REL based on SDI; (b) the calculation of RSL based on CI.
- Calculation of the integrated REL and RSL REL for the entire LC progress
The REL and RSL values for the entire LC process between the TV and CPV, CFV, TPV, and TFV are calculated according to Equations (1)–(8), denoted as REL(j) and RSL(j), respectively. These values represent the likelihood and severity of potential risks between the TV and each surrounding vehicle. The definitions of REL and RSL can be considered as probability values; therefore, Equations (9) and (10) are utilized to calculate the integrated potential risk values of REL and RSL of TV.
where j is the number of the surrounding vehicles; j = 1, 2, 3, 4.
3.2.4. Labeling the Risk of LC
The likelihood and severity of the TV for potential risk during the LC process can be ascertained as detailed in Section 3.2.3. However, the following situations could arise when assessing the level of the potential risk [44]: one situation is the possibility is low but the severity is high, and the other one is the possibility is high but the severity is low. How do we measure which one poses a higher risk level?
To obtain the LC risk level, this paper utilized the K-means algorithm to label the level of LC risk. This algorithm is commonly used to process two-dimensional data, and the basic principle is to find a division scheme of K clusters that minimizes the loss function corresponding to the clustering result iteratively [45]. Additionally, K-means have been proven effective in LC risk clustering by Chen [14] and Wang [35]. Therefore, the K-means algorithm is applied to cluster the REL and RSL of all LC vehicles. Then, the potential risk level of each LC event is obtained. The algorithm works as follows [46]:
Step#01: Randomly select K points from the REL and RSL data of all LC samples as initial cluster centers.
Step#02: Calculate the Euclidean distance between each point and the initial cluster centers. Assign each point to the closest cluster based on the distance criterion.
Step#03: Calculate the mean value of the data in each cluster and use this mean value as the new cluster center.
Step#04: Repeat steps 2 and 3 until the cluster centers no longer change.
Step#05: Output the cluster centers and the clustering results and obtain the LC risk level of each LC event.
To evaluate the clustering result of K-means, the silhouette score (SC) is selected to assess the compactness and separation of clusters. The SC measures how similar an object is to its own cluster center compared to other clusters. It is defined as Formula (11):
where a(i) is the average distance within its own cluster; b(i) is the average distance from all sample points in its nearest cluster. S(i) ranges from −1 to 1, where a high value indicates that the object is well matched to its own cluster and poorly matched to the neighboring cluster. By utilizing the SC, we can quantitatively evaluate the efficacy of the K-means algorithm in clustering LC risk levels.
3.3. LC Features Importance Ranking Based on LightGBM
In Section 3.2.2, a total of 682 candidate features were extracted from each set of LC trajectory data. However, it is important to note that not all features contribute equally to the recognition of LC risks. In fact, some redundant features may introduce noise and diminish the accuracy of the model [47]. Additionally, incorporating too many features may result in an excessive increase in the dimensionality of the LC risk feature dataset, potentially leading to overfitting. Consequently, both model training time and memory usage will significantly increase [32]. Therefore, to enhance the accuracy and efficiency of the LC risk recognition model, it is imperative to rank the importance of LC risk features, eliminate redundant and irrelevant features, and select the most influential ones.
Feature selection includes three main types: filter, wrapper, and embedding. LightGBM (light gradient boosting machine) is one kind of wrapper method [32]. LightGBM was introduced by Microsoft in 2016 as an improvement over the GBDT (gradient boosting decision tree) algorithm. Its primary focus lies in addressing the issue of poor scalability and low efficiency when dealing with high-dimensional features or large datasets [48]. To enhance the training efficiency and generalization capability of the model, LightGBM adopts histogram algorithms and gradient-based one-side sampling (GOSS). Therefore, the LightGBM algorithm is utilized to rank the LC risk features in this study.
LightGBM converts each column of feature values of the dataset into a histogram, specifically; divides the value range of each feature into k bins; and then performs statistics on each bin to obtain the number of samples in the bin, the mean value, and other statistical information, and stores the results in a histogram. After histogram computation, all the original features are converted to histograms, and each feature value is stored as an integer in all the bins of each histogram, so LightGBM only needs to traverse each histogram and compute the segmentation gain by taking each histogram as a segmentation point, and then it can find the optimal segmentation histogram as a segmentation node. The specific steps of the LightGBM-based LC risk feature are as follows:
Step#01: The LC risk dataset
is the feature vector of the i-th LC sample, s is the number of features, and yj is the label of the i-th LC sample.
Step#02: The recognition results of the risk level of the i-th LC sample:
where is the set consisting of leaf node weight z in the independent tree structure q, K is the total number of trees, is the data space for the regression tree, which can map LC samples to their corresponding leaf nodes L. m is the number of features, and T represents the number of leaf nodes.
Step#03: Considering both the horizontal and vertical perspectives, the LightGBM model calculates the importance of each feature by using gain and split. The gain (G) symbolizes the information gain achieved by each splitting variable, while the split (S) indicates the frequency of usage for each feature among all samples.
where and represent the left subtree and right subtree after node I is split, and denote the count of left subtrees and right subtrees, represents the number of times the m-th feature has been utilized during training.
Step#04: Combining horizontal and vertical importance provides a comprehensive assessment of feature importance, and the weighted average of these two importance values is utilized in this paper:
where w is the weight to adjust the relative weight of horizontal and vertical importance.
Step#05: The importance of all features can be calculated by their values, and feature selection can be performed by ranking the importance of features.
3.4. LC Risk Recognition Based on CNN-BiLSTM-Attention
3.4.1. CNN
CNNs (convolutional neural networks) are feedforward neural network models with a convolutional structure, essentially functioning as multi-layer perceptron. The CNN is composed of various layers, such as the input layer, convolutional layer, pooling layer, fully connected layer, and output layer. One notable aspect of CNN is its ability to grasp numerous high-dimensional features through the convolutional layer. These features are subsequently downscaled via the pooling layer to efficiently extract local features from the input feature sequence [49]. Nonetheless, CNN encounters challenges when handling sequential data, as it struggles to capture long-term dependencies within the sequence [50].
3.4.2. BiLSTM
LSTM (long short-term memory) networks are a variant of an RNN (recurrent neural network) [51]. LSTM addresses the problem of vanishing gradients in RNNs and can identify long-term dependencies in sequential data by incorporating a memory state and gate mechanism to update the cell state’s information retention. Each LSTM unit consists of three gates, the forget gate, the input gate, and the output gate, which selectively control the flow of information into the unit [52], Figure 4a depicts the structure of LSTM.
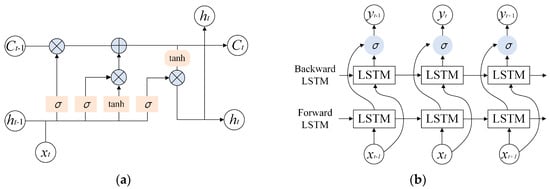
Figure 4.
Structure of LSTM and BiLSTM. (a) Structure of LSTM; (b) Structure of BiLSTM.
BiLSTM (bi-directional long short-term memory) networks are a variant of LSTM networks, consisting of a forward LSTM network and a backward LSTM network, as the Figure 4b shows. By extracting both forward and backward historical features and investigating the inherent relationship between present and past/future data, the BiLSTM networks enhance the data utilization and the model’s predictive accuracy [53]. However, BiLSTM is limited to evaluating forward and backward contextual information at a given node and is unable to utilize future and past information at a single node.
3.4.3. Attention Mechanism
The attention mechanism is an algorithm that mimics the human attention mechanism, initially developed for image classification and natural language processing. By allocating weights or emphasis depending on the probability distribution of the data and the relationship between variables, the attention mechanism highlights the parts of the input data that are more pertinent to the output task. Thereby, more critical and important information is extracted to enhance the overall performance [54]. Attention mechanisms include positional attention, input sequence attention, self-attention, and cooperative attention. Among these, self-attention only extracts information from the input without utilizing additional information. Self-attention is more suitable for practical engineering applications since it requires fewer parameters and computes more quickly [55]. In light of this, the self-attention mechanism is employed to construct an LC risk recognition model [56].
The structure of the self-attention mechanism is illustrated in Figure 5. The query matrix (Q), key matrix (K), and value matrix (V) are computed using the input data through three linear layers. Then, the transpose multiplication of Q and K, divided by the scaling factor dk, and applying a softmax function to the resulting matrix, to obtain the self-attention weight matrix A. Finally, multiplying the V and A yields the self-attention weighting. The specific formulas are as follows:
where Q, K, and V denote query, key, and value matrix, respectively.
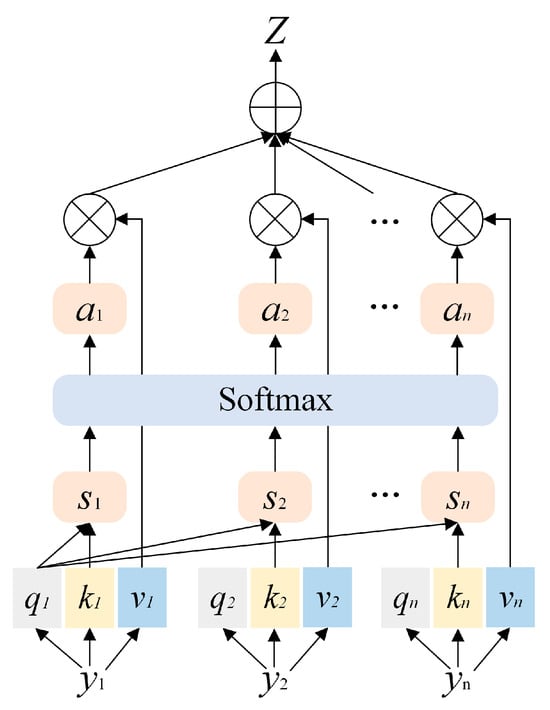
Figure 5.
Structure of self-attention mechanism.
Here, softmax was chosen to normalize the weight of important features [39]; it is shown in Formula (21):
where C is the number of LC risk levels. The softmax function can transform raw attention scores into a probability distribution that ranges from 0 to 1 and sums to 1 [57]. That enables the model to learn and concentrate its attention on important parts relevant to the current task, while reducing the weights of other parts to ignore irrelevant information. The softmax function has been widely used in attention mechanism for LC prediction and risk recognition [55,56]. By using the softmax as the activation function in the attention mechanism, we can effectively capture and highlight important features related to LC risk.
3.4.4. CNN-BiLSTM-Attention
In summary, this paper proposes the CNN-BiLSTM-Attention model for LC risk identification, aiming to leverage the advantages of CNN, BiLSTM, and self-attention [58]. The network architecture can be found in Figure 6. Specifically, CNN is utilized to extract local features from the input sequence, while BiLSTM is used to better understand the contextual information of the entire sequence by capturing long-term dependencies in the sequential data. The attention mechanism, on the other hand, performs weighted averaging on the hidden states output by BiLSTM. It automatically learns to selectively focus on the most relevant information for the current task, dynamically attending to different segments of the input sequence and extracting the most informative segments. This enhances the model’s ability to handle crucial information and improves the performance in recognizing LC risk [59].
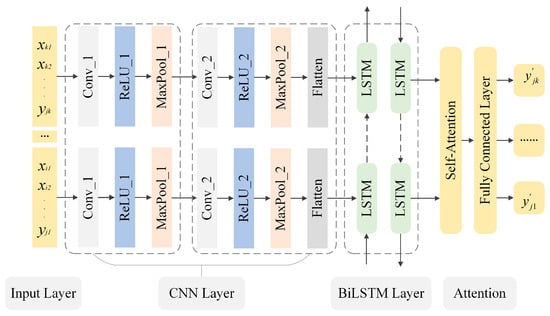
Figure 6.
Structure of CNN-BiLSTM-Attention.
3.4.5. Evaluation Measures
In this study, the performance of the model is assessed by precision (P), recall (R), and F1-score (F1). Specifically, P measures the percentage of all samples correctly predicted positive among all samples predicted positive. R represents the proportion of correctly predicted positive samples among all actual positive samples. The F1-score is the harmonic mean of precision and recall, providing a comprehensive assessment of the model’s predictive performance. The definitions of these evaluation measures are as follows [60]:
where TP is the samples are correctly predicted as positive, FP refers to the negative examples incorrectly predicted as positive, and FN denotes the positive examples incorrectly predicted as negative.
4. Application and Discussion
4.1. HighD Dataset
The HighD [6] dataset obtained vehicle trajectory data from six different locations on highways near Cologne by drone, with no disruption to drivers, as shown in Figure 7. The data collection duration is 16.5 h, involving a total of 110,500 vehicles with a cumulative distance traveled of 45,000 km. The position error is less than 10 cm. The HighD dataset consists of 60 tracks, with tracks 58–60 specifically collected at the entrance ramps. To study LC risks for different vehicle types on the main highway, this paper focuses on tracks 1–57. Each trajectory datum includes vehicle ID, length, width, lateral and longitudinal position coordinates, lateral and longitudinal velocity and acceleration, as well as the IDs of surrounding vehicles, as shown in Table 2.

Figure 7.
The schematic diagram for the HighD dataset. (a) The length of the section is about 420 m; (b) information of the vehicles in the HighD dataset.

Table 2.
Format of HighD dataset.
4.2. Extraction and Processing of LC Data
4.2.1. Clustering Result of Vehicle Types
In the HighD dataset, vehicles are categorized into two types: car and truck. This study aims to investigate the LC risks for multi-vehicle types. Therefore, the K-means algorithm is employed to cluster the vehicle by length and width. It is found that the clustering performance is optimal when dividing into three clusters (SC = 0.92768). The clustering results are illustrated in Figure 8 and Table 3.
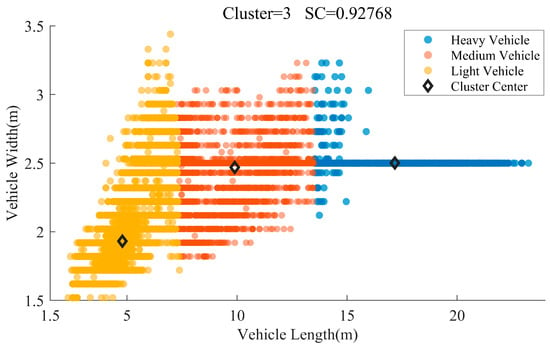
Figure 8.
The clustering results of the vehicle types.

Table 3.
The clustering results of the vehicle types.
4.2.2. Extraction of LC Data
Based on the definition of LC samples in Section 3.2, we extract the trajectory data of the entire LC process of the TV with the surrounding vehicles (CPV, CFV, TPV, and TFV). These trajectory data are then divided into LLC and RLC based on the direction of the LC. The entire LC trajectory of ID = 188, in track 01, is shown in Figure 9.
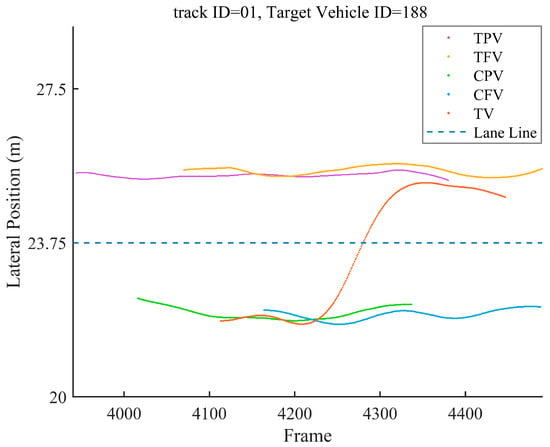
Figure 9.
The LC trajectory of TV and surrounding vehicles, TV ID = 188, track id = 01.
The extraction results of the LC sample data are presented in Table 4. Finally, 9559 LC samples are extracted from the HighD dataset, in which light vehicles demonstrate the highest LC proportion, reaching 9.94%, while heavy vehicles are the lowest proportion, at 3.92%. In terms of LC direction, RLC accounts for 55.86% of the total LC for light vehicles, while LLC has a higher proportion of 53.27% for heavy vehicles.

Table 4.
The extraction results of the LC data of the HighD dataset.
4.3. Labeling of the LC Risk Level
According to Section 3.2.3, the REL and RSL of each LC vehicle of the entire LC process are calculated. Then, the K-means algorithm is applied to cluster the REL and RSL of all the LC vehicles. The SC results indicate that the optimal clustering performance is achieved when dividing the LC risk levels into three clusters. The LC risk levels are labeled as low-risk (Level 1), medium-risk (Level 2), and high-risk (Level 3). The clustering results for the LC risk levels and SC of LLC and RLC for each vehicle type are shown in Figure 10 and summarized in Table 5.
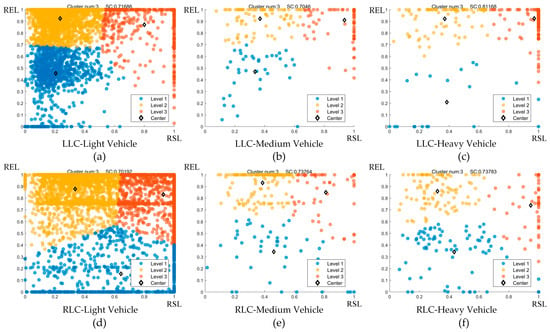
Figure 10.
The clustering results of LLC and RLC for all vehicle types. (a) The clustering result of LLC-Light Vehicle, SC = 0.71686; (b) The clustering result of LLC-Medium Vehicle, SC = 0.70460; (c) The clustering result of LLC-Heavy Vehicle, SC = 0.81168; (d) The clustering result of RLC-Light Vehicle, SC = 0.70192; (e) The clustering result of RLC-Medium Vehicle, SC = 0.73764; (f) The clustering result of RLC-Heavy Vehicle, SC = 0.73783.

Table 5.
The clustering results of LLC and RLC for all vehicle types.
As shown in Table 5, the LC risk clustering centers of LLC and RLC for multi-vehicle types differ significantly. Furthermore, the sample sizes for different vehicle types exhibit variation, particularly for light vehicles and heavy vehicles. To be specific, for Level 3, there are 490 LLC samples and 1937 RLC samples of light vehicles, and 186 LLC samples and 55 RLC samples of heavy vehicles. For medium vehicles, Level 1 includes 37 LLC samples and 86 RLC samples, while Level 3 includes 107 LLC samples and 66 RLC samples.- These variations may be caused by the fact that the drivers are positioned on the left side, which gives them a better sight when changing to the left lane. The heavy vehicles change from the outer lane to the inner lane when they change to the left lane. The average speed of the inner lane is typically higher than that of the outer lane, which introduces more risk to heavy vehicles.
4.4. Selection of LC Risk Features
As shown in Table 5, there is an imbalance in the number of samples for each LC risk level among different vehicle types and directions. To improve the accuracy of the LC risk recognition model, random under-sampling was conducted on the LC samples for each vehicle type and direction. To ensure that each sample contains the trajectory data before and after the crossing lane time, the trajectory data of each LC sample were sampled at a time interval of 0.4 s, 10 frames. Then, a new LC risk feature dataset (LCRDataset) was constructed by combining 682 LC risk features with risk levels. The new dataset was restructured into six datasets according to the LC direction and vehicle types: LLC-Light Vehicle, LLC-Medium Vehicle, LLC-Heavy Vehicle, RLC-Light Vehicle, RLC-Medium Vehicle, and RLC- Heavy Vehicle. Finally, the LightGBM algorithm was utilized to rank the importance of features of these six datasets.
In the restructured six LC risk feature datasets, this study divided the training set and test set in a 7:3 ratio. Based on the feature importance ranking results, features with non-zero importance were categorized according to the basic features and the interaction features. The specific feature importance values and their sum can be found in Figure 11.
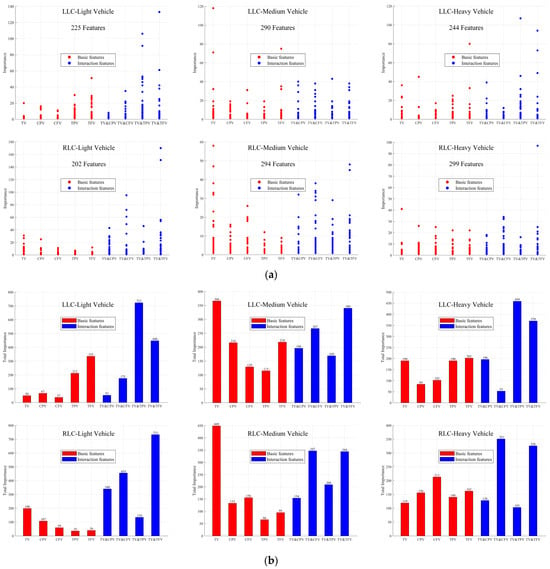
Figure 11.
Analysis of features with importance ≠ 0. (a) Distribution of features with importance ≠ 0; (b) distribution of the sum of feature importance values with importance ≠ 0.
Figure 11 shows that the influence of LC risk features differs from vehicle types and directions. Specifically, for LLC-Light Vehicles, the most important feature is the distance between TV and TFV, the sum of feature importance follows the order TV&TPV > TV&TFV > TFV > TPV > TV&CFV. For RLC-Light Vehicles, the most important feature is the minimum distance between TV and TFV, the sum of feature importance follows the order TV&TFV > TV&CFV > TV&CPV > TV > TV&TPV. For LLC-Medium Vehicles, the width of the TV is of the highest importance, and the order of the sum of importance is TV > TV&TFV > TV&CPV > TFV > CPV, while for LLC-Heavy Vehicles, the feature with the highest importance is the average lateral velocity of TV, and the sum of importance follows the order TV > TV&CFV > TV&TFV > TV&TPV > CFV. The comparison indicates that the influence varies for different vehicle types and LC direction. For LLC-Light Vehicle, the interaction features between TV and TPV should be paid more attention; the interaction features between TV and TFV should be given more attention in RLC-Light Vehicle, and for Medium Vehicle, the basic features of the TV at both LLC and RLC. Additionally, for Heavy Vehicle, the basic features of TV contribute more during LLC, while basic features of CFV contribute more during RLC. Hence, it is necessary to investigate specifically for different vehicle types and LC directions when recognizing the LC risk.
4.5. Comparison of LC Risk Recognition Model Performance
The CNN-BiLSTM-Attention model was used to recognize the LC risk levels for different vehicle types for LLC and RLC, considering different numbers of features (all features, features with importance ≠ 0, top 200/100/50 features). The performance is shown in Table 6.

Table 6.
Comparison of LC risk recognition performance under different features based on CNN-BiLSTM-Attention.
We can figure out the optimal number of features for the CNN-BiLSTM-Attention model under different LC scenarios. For LLC-Light Vehicle, LLC-Medium Vehicle, RLC-Light Vehicle, and RLC-Heavy Vehicle, the model performed best when selecting the top 100 features, while for LLC-Heavy Vehicle and RLC-Medium Vehicle, it performed best when choosing the top 200 features. The confusion matrices of each optimal case are shown in Figure 12.
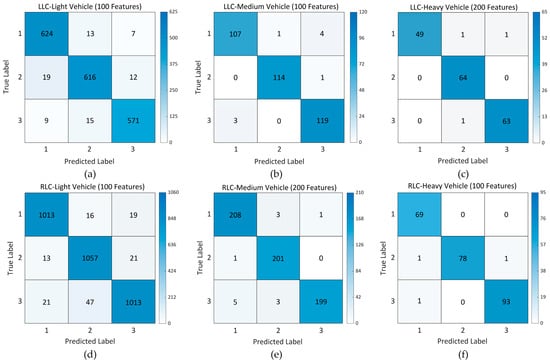
Figure 12.
Confusion matrices of each optimal case based on CNN-BiLSTM-Attention. (a) Confusion matrices of LLC-Light Vehicle under the top 100 features; (b) Confusion matrices of LLC-Medium Vehicle under the top 100 features; (c) Confusion matrices of LLC-Heavy Vehicle under the top 200 features; (d) Confusion matrices of RLC-Light Vehicle under the top 100 features; (e) Confusion matrices of RLC-Medium Vehicle under the top 200 features; (f) Confusion matrices of RLC-Heavy Vehicle under the top 100 features.
In addition, the recognition performance of the CNN-BiLSTM-Attention model under different numbers of features was compared with CNN, LSTM, and BiLSTM. Table 7 shows the comparison of the LC risk recognition performance of LLC-Light Vehicle.

Table 7.
Comparison of LC risk recognition performance under different models and features for LLC-Light Vehicle.
As shown in Table 7, it is apparent that the CNN-BiLSTM-Attention algorithm outperforms other algorithms in terms of LC risk recognition for LLC-Light Vehicle, regardless of the number of features. Notably, when the CNN-BiLSTM-Attention model utilized the top 100 features, the overall R, P, and F1 score are 96.02%, 96.05%, and 96.03%, respectively. These recognition outcomes surpass those attained with other feature numbers, which are superior to other cases.
Furthermore, to provide insights into the efficiency and effectiveness of each model, we conducted a comparison of the computational cost and performance of different models for LLC-Light Vehicle, and the results are presented in Table 8:

Table 8.
Comparison of computational cost and overall performance of models for LLC-Light Vehicle.
The models were all computed on an NVIDIA GeForce GTX 1650 GPU. The results in Table 8 clearly indicate that the CNN-BiLSTM-Attention model has a larger number of parameters compared to other models. This is mainly due to the utilization of attention mechanisms. With respect to the testing times, for instance, even when considering all features, the test time of CNN, LSTM, BiLSTM, and CNN-BiLSTM-Attention are 0.062 s, 0.104 s, 0.104, and 0.159, respectively. Notably, once the networks are well trained, the test time of the CNN-BiLSTM-Attention model is still very small. Taking the performance into consideration, our proposed CNN-BiLSTM-Attention method significantly enhances the precision at an acceptable computational cost.
By providing these comparative metrics, it becomes evident that there are performance differences among the models as well as variations in testing time. Particularly, the CNN-BiLSTM-Attention model indicates a balanced trade-off between performance and computational cost. These findings offer valuable insights for future research.
For other scenarios, the CNN-BiLSTM-Attention model exhibits better compared to other models. Due to the restriction of this article’s length, a comprehensive description will not be presented here.
5. Conclusions
This study proposes a framework for selecting key features and recognizing the risk level of multi-vehicle types for LLC and RLC. Firstly, a large amount of LC samples, including 8561 light vehicles, 463 medium vehicles, and 535 heavy vehicles, were extracted. And 682 candidate features, including the basic features and interaction features from TV and adjacent vehicles, were chosen. Meanwhile, the REL and RSL of the entire LC process were quantified by calculating SDI and CI, and the K-means algorithm was used to cluster LC risk levels. Subsequently, random under-sampling was performed on the LC samples of each vehicle type for the LLC and RLC risk feature dataset, which was constructed by combining the candidate LC risk features with their corresponding risk levels.
Additionally, the LightGBM algorithm was implemented to select the significant risk features of LLC and RLC for each vehicle type. By comparing the distribution of features with non-zero importance under different scenarios, we observed that basic features and interaction features have significant differences in the LC risk of LLC and RLC for multi-vehicle types. Then, the CNN-BiLSTM-Attention model was proposed to accurately recognize LC risk. Compared with the CNN, LSTM, and BiLSTM models, the CNN-BiLSTM-Attention model consistently outperformed the other models in all scenarios. Additionally, we found selecting key features as input features can improve the performance, and the optimal risk features were determined for recognizing LC risk. Furthermore, by comparison of computational cost and performance, it became apparent that the CNN-BiLSTM-Attention model strikes a balanced trade-off between performance and computational cost.
Consequently, the validation of a large number of LC samples from the naturalistic driving dataset confirms the that framework proposed in this study can be utilized in practical application. (1) The method can be used to establish the interaction scenarios library for different vehicle types by obtaining the real-time position, speed, acceleration, relative position, relative speed, relative acceleration, and other information. (2) The potential risk features for multi-vehicle types can be applied in the advanced driver assistance system (ADAS) to improve safety. (3) This framework can enable the system to deliver alerts and assistance tailored to specific driving scenarios, thereby allowing drivers to make informed decisions that reduce the likelihood of accident.
However, there are still some limitations that need to be improved in future research. For key feature selection, only the basic features and interaction features are considered in this study, while the weather indicators, road types, and drivers’ characteristics are not included due to the HighD dataset being the trajectory data. Also, only the vehicle types of TV are taken into account for the differences in LC risk, while the interaction between TV with different vehicle types are not considered. In future research, a more comprehensive LC risk feature system should be formed by integrating weather conditions, road alignment, driving behaviors, and traffic conditions to improve the reliability, comprehensiveness, and accuracy of LC risk feature selection and risk recognition.
Author Contributions
Conceptualization, L.Z. and W.L.; methodology, L.Z.; software, L.Z.; validation, L.Z.; formal analysis, L.Z.; investigation, L.Z.; resources, L.Z.; data curation, L.Z.; writing—original draft preparation, L.Z.; writing—review and editing, L.Z.; visualization, L.Z.; supervision, W.L.; project administration, W.L.; funding acquisition, W.L. All authors have read and agreed to the published version of the manuscript.
Funding
This work was supported by the project of Research and Application of Comprehensive Blockage Control of Urban Expressway and Urban Road Cooperative Control, grant number BEH-2019-ZX-052.
Institutional Review Board Statement
Not applicable.
Data Availability Statement
The HighD dataset is available at https://levelxdata.com/highd-dataset/, accessed on 4 November 2018.
Acknowledgments
The authors are grateful to the journal’s editorial team and anonymous reviewers for their thoughtful comments and suggestions, which greatly contributed to the improvement of this manuscript.
Conflicts of Interest
The authors declare no conflicts of interest.
References
- Prasolenko, O.; Chumachenko, V. Regularities of the Traffic Lane Change by the Driver When Interacting with Car-Obstacle. Transp. Technol. 2023, 2023, 1–11. [Google Scholar] [CrossRef]
- Liu, H.; Wu, K.; Fu, S.; Shi, H.; Xu, H. Predictive Analysis of Vehicular Lane Changes: An Integrated LSTM Approach. Appl. Sci. 2023, 13, 10157. [Google Scholar] [CrossRef]
- Reimer, B.; Donmez, B.; Lavallière, M.; Mehler, B.; Coughlin, J.F.; Teasdale, N. Impact of Age and Cognitive Demand on Lane Choice and Changing under Actual Highway Conditions. Accid. Anal. Prev. 2013, 52, 125–132. [Google Scholar] [CrossRef] [PubMed]
- Zheng, Z.; Ahn, S.; Monsere, C.M. Impact of Traffic Oscillations on Freeway Crash Occurrences. Accid. Anal. Prev. 2010, 42, 626–636. [Google Scholar] [CrossRef] [PubMed]
- Farah, H.; Toledo, T. Passing Behavior on Two-Lane Highways. Transp. Res. Part F Traffic Psychol. Behav. 2010, 13, 355–364. [Google Scholar] [CrossRef]
- Krajewski, R.; Bock, J.; Kloeker, L.; Eckstein, L. The highD Dataset: A Drone Dataset of Naturalistic Vehicle Trajectories on German Highways for Validation of Highly Automated Driving Systems. In Proceedings of the 2018 21st International Conference on Intelligent Transportation Systems (ITSC), Maui, HI, USA, 4–7 November 2018; pp. 2118–2125. [Google Scholar]
- Kurtc, V. Studying Car-Following Dynamics on the Basis of the HighD Dataset. Transp. Res. Rec. 2020, 2674, 813–822. [Google Scholar] [CrossRef]
- Xue, Q.; Wang, K.; Lu, J.J.; Xing, Y.; Gu, X.; Zhang, M. An Improved Risk Estimation Model of Lane Change Using Naturalistic Vehicle Trajectories. J. Transp. Saf. Secur. 2022, 15, 963–986. [Google Scholar] [CrossRef]
- Li, Y.; Liu, Y.; Ni, D.; Ji, A.; Li, L.; Zou, Y. A Reproducible Approach to Merging Behavior Analysis Based on High Definition Map. arXiv 2023, arXiv:2303.11531. [Google Scholar]
- Jokhio, S.; Olleja, P.; Bärgman, J.; Yan, F.; Baumann, M. Analysis of Time-to-Lane-Change-Initiation Using Realistic Driving Data. IEEE Trans. Intell. Transport. Syst. 2023, 1–13. [Google Scholar] [CrossRef]
- Cao, X.; Young, W.; Sarvi, M.; Kim, I. Study of Mandatory Lane Change Execution Behavior Model for Heavy Vehicles and Passenger Cars. Transp. Res. Rec. 2016, 2561, 73–80. [Google Scholar] [CrossRef]
- Li, Y.; Li, L.; Ni, D. Exploration of Lane-Changing Duration for Heavy Vehicles and Passenger Cars: A Survival Analysis Approach. arXiv 2021, arXiv:2108.05710. [Google Scholar]
- Zhang, Y.; Shi, X.; Zhang, S.; Abraham, A. A XGBoost-Based Lane Change Prediction on Time Series Data Using Feature Engineering for Autopilot Vehicles. IEEE Trans. Intell. Transport. Syst. 2022, 23, 19187–19200. [Google Scholar] [CrossRef]
- Chen, T.; Shi, X.; Wong, Y.D. Key Feature Selection and Risk Prediction for Lane-Changing Behaviors Based on Vehicles’ Trajectory Data. Accid. Anal. Prev. 2019, 129, 156–169. [Google Scholar] [CrossRef]
- Li, Y.; Li, L.; Ni, D.; Zhang, Y. Comprehensive Survival Analysis of Lane-Changing Duration. Measurement 2021, 182, 109707. [Google Scholar] [CrossRef]
- Mahajan, V.; Katrakazas, C.; Antoniou, C. Crash Risk Estimation Due to Lane Changing: A Data-Driven Approach Using Naturalistic Data. IEEE Trans. Intell. Transport. Syst. 2022, 23, 3756–3765. [Google Scholar] [CrossRef]
- Benterki, A.; Boukhnifer, M.; Judalet, V.; Maaoui, C. Driving Intention Prediction and State Recognition on Highway. In Proceedings of the 2021 29th Mediterranean Conference on Control and Automation (MED), Puglia, Italy, 22 June 2021; pp. 566–571. [Google Scholar]
- Xue, Q.; Xing, Y.; Lu, J. An Integrated Lane Change Prediction Model Incorporating Traffic Context Based on Trajectory Data. Transp. Res. Part C Emerg. Technol. 2022, 141, 103738. [Google Scholar] [CrossRef]
- Park, H.; Oh, C.; Moon, J.; Kim, S. Development of a Lane Change Risk Index Using Vehicle Trajectory Data. Accid. Anal. Prev. 2018, 110, 1–8. [Google Scholar] [CrossRef]
- Xing, L.; He, J.; Abdel-Aty, M.; Cai, Q.; Li, Y.; Zheng, O. Examining Traffic Conflicts of up Stream Toll Plaza Area Using Vehicles’ Trajectory Data. Accid. Anal. Prev. 2019, 125, 174–187. [Google Scholar] [CrossRef]
- Wen, H.; Chen, Z. Modeling the Risks of Lane-Changing on Adjacent Sections of Tunnel Entrances. IEEE Access 2023, 11, 65312–65326. [Google Scholar] [CrossRef]
- Yang, M.; Wang, X.; Quddus, M. Examining Lane Change Gap Acceptance, Duration and Impact Using Naturalistic Driving Data. Transp. Res. Part C Emerg. Technol. 2019, 104, 317–331. [Google Scholar] [CrossRef]
- Toledo, T.; Koutsopoulos, H.N.; Ben-Akiva, M.E. Modeling Integrated Lane-Changing Behavior. Transp. Res. Rec. 2003, 1857, 30–38. [Google Scholar] [CrossRef]
- Wang, X.; Yang, M.; Hurwitz, D. Analysis of Cut-in Behavior Based on Naturalistic Driving Data. Accid. Anal. Prev. 2019, 124, 127–137. [Google Scholar] [CrossRef]
- Li, G.; Yang, Z.; Pan, Y.; Ma, J. Analysing and Modelling of Discretionary Lane Change Duration Considering Driver Heterogeneity. Transp. B Transp. Dyn. 2023, 11, 343–360. [Google Scholar] [CrossRef]
- Wang, C.; Xie, Y.; Huang, H.; Liu, P. A Review of Surrogate Safety Measures and Their Applications in Connected and Automated Vehicles Safety Modeling. Accid. Anal. Prev. 2021, 157, 106157. [Google Scholar] [CrossRef]
- Murata, E.; Usui, T.; Nogi, K.; Takahashi, H. Study on TTC Distribution When Approaching a Lead Vehicle; SAE Technical Paper; SAE International: Warrendale, PA, USA, 2016; No. 2016-01–1452. [Google Scholar]
- Samson, C.J.R.; Hussain, Q.; Alhajyaseen, W.K.M. Analysis of Stopping Sight Distance (SSD) Parameters: A Review Study. Procedia Comput. Sci. 2022, 201, 126–133. [Google Scholar] [CrossRef]
- Fu, C.; Sayed, T. Comparison of Threshold Determination Methods for the Deceleration Rate to Avoid a Crash (DRAC)-Based Crash Estimation. Accid. Anal. Prev. 2021, 153, 106051. [Google Scholar] [CrossRef]
- Wu, J.; Wen, H.; Qi, W. A New Method of Temporal and Spatial Risk Estimation for Lane Change Considering Conventional Recognition Defects. Accid. Anal. Prev. 2020, 148, 105796. [Google Scholar] [CrossRef]
- Li, M.; Li, Z.; Xu, C.; Liu, T. Short-Term Prediction of Safety and Operation Impacts of Lane Changes in Oscillations with Empirical Vehicle Trajectories. Accid. Anal. Prev. 2020, 135, 105345. [Google Scholar] [CrossRef]
- Chen, T.; Shi, X.; Wong, Y.D.; Yu, X. Predicting Lane-Changing Risk Level Based on Vehicles’ Space-Series Features: A Pre-Emptive Learning Approach. Transp. Res. Part C Emerg. Technol. 2020, 116, 102646. [Google Scholar] [CrossRef]
- Zhang, Y.; Zou, Y.; Selpi; Zhang, Y.; Wu, L. Spatiotemporal Interaction Pattern Recognition and Risk Evolution Analysis During Lane Changes. IEEE Trans. Intell. Transp. Syst. 2023, 24, 6663–6673. [Google Scholar] [CrossRef]
- Huang, H.; Wang, J.; Fei, C.; Zheng, X.; Yang, Y.; Liu, J.; Wu, X.; Xu, Q. A Probabilistic Risk Assessment Framework Considering Lane-Changing Behavior Interaction. Sci. China Inf. Sci. 2020, 63, 190203. [Google Scholar] [CrossRef]
- Wang, H.; Jin, Y.; Zhang, Z. Risk Assessment Method for Lane-Changing Vehicles Based on Surrogate Safety Measure. In Proceedings of the 2nd International Conference on Mechanical, Electronics, and Electrical and Automation Control (METMS 2022), Guilin, China, 7–9 January 2022; Ye, X., Ed.; SPIE: Guilin, China, 2022; p. 8. [Google Scholar]
- Zhang, Y.; Chen, Y.; Gu, X.; Sze, N.N.; Huang, J. A Proactive Crash Risk Prediction Framework for Lane-Changing Behavior Incorporating Individual Driving Styles. Accid. Anal. Prev. 2023, 188, 107072. [Google Scholar] [CrossRef] [PubMed]
- Ma, C.; Li, D. A Review of Vehicle Lane Change Research. Phys. A Stat. Mech. Its Appl. 2023, 626, 129060. [Google Scholar] [CrossRef]
- Shangguan, Q.; Fu, T.; Wang, J.; Fang, S.; Fu, L. A Proactive Lane-Changing Risk Prediction Framework Considering Driving Intention Recognition and Different Lane-Changing Patterns. Accid. Anal. Prev. 2022, 164, 106500. [Google Scholar] [CrossRef] [PubMed]
- Gao, K.; Li, X.; Chen, B.; Hu, L.; Liu, J.; Du, R.; Li, Y. Dual Transformer Based Prediction for Lane Change Intentions and Trajectories in Mixed Traffic Environment. IEEE Trans. Intell. Transp. Syst. 2023, 24, 6203–6216. [Google Scholar] [CrossRef]
- Mahmud, S.S.; Ferreira, L.; Hoque, M.S.; Tavassoli, A. Application of Proximal Surrogate Indicators for Safety Evaluation: A Review of Recent Developments and Research Needs. IATSS Res. 2017, 41, 153–163. [Google Scholar] [CrossRef]
- Wood, J.S.; Donnell, E.T. Stopping Sight Distance and Available Sight Distance: New Model and Reliability Analysis Comparison. Transp. Res. Rec. 2017, 2638, 1–9. [Google Scholar] [CrossRef]
- Ozbay, K.; Yang, H.; Bartin, B.; Mudigonda, S. Derivation and Validation of New Simulation-Based Surrogate Safety Measure. Transp. Res. Rec. 2008, 2083, 105–113. [Google Scholar] [CrossRef]
- He, Z.; Qin, X.; Liu, P.; Sayed, M.A. Assessing Surrogate Safety Measures Using a Safety Pilot Model Deployment Dataset. Transp. Res. Rec. 2018, 2672, 1–11. [Google Scholar] [CrossRef]
- Chen, Q.; Huang, H.; Li, Y.; Lee, J.; Long, K.; Gu, R.; Zhai, X. Modeling Accident Risks in Different Lane-Changing Behavioral Patterns. Anal. Methods Accid. Res. 2021, 30, 100159. [Google Scholar] [CrossRef]
- Mba, J.C.; Angaman, E.S.E.F. A K-Means Classification and Entropy Pooling Portfolio Strategy for Small and Large Capitalization Cryptocurrencies. Entropy 2023, 25, 1208. [Google Scholar] [CrossRef] [PubMed]
- Ikotun, A.M.; Ezugwu, A.E.; Abualigah, L.; Abuhaija, B.; Heming, J. K-Means Clustering Algorithms: A Comprehensive Review, Variants Analysis, and Advances in the Era of Big Data. Inf. Sci. 2023, 622, 178–210. [Google Scholar] [CrossRef]
- Li, X.; Wang, W.; Zhang, Z.; Rötting, M. Effects of Feature Selection on Lane-Change Maneuver Recognition: An Analysis of Naturalistic Driving Data. JICV 2019, 1, 85–98. [Google Scholar] [CrossRef]
- Ke, G.; Meng, Q.; Finley, T.; Wang, T.; Chen, W.; Ma, W.; Ye, Q.; Liu, T.-Y. LightGBM: A Highly Efficient Gradient Boosting Decision Tree. In Proceedings of the Advances in Neural Information Processing Systems, Long Beach, CA, USA, 4–9 December 2017. [Google Scholar]
- Izquierdo, R.; Quintanar, A.; Parra, I.; Fernandez-Llorca, D.; Sotelo, M.A. Experimental Validation of Lane-Change Intention Prediction Methodologies Based on CNN and LSTM. In Proceedings of the 2019 IEEE Intelligent Transportation Systems Conference (ITSC), Auckland, New Zealand, 27–30 October 2019; pp. 3657–3662. [Google Scholar]
- Zhang, Y.; Zhang, S.; Luo, R. Lane Change Intent Prediction Based on Multi-Channel CNN Considering Vehicle Time-Series Trajectory. In Proceedings of the 2022 IEEE 25th International Conference on Intelligent Transportation Systems (ITSC), Macau, China, 8 October 2022; pp. 287–292. [Google Scholar]
- Tang, L.; Wang, H.; Zhang, W.; Mei, Z.; Li, L. Driver Lane Change Intention Recognition of Intelligent Vehicle Based on Long Short-Term Memory Network. IEEE Access 2020, 8, 136898–136905. [Google Scholar] [CrossRef]
- Yu, D.; Lee, H.; Kim, T.; Hwang, S.-H. Vehicle Trajectory Prediction with Lane Stream Attention-Based LSTMs and Road Geometry Linearization. Sensors 2021, 21, 8152. [Google Scholar] [CrossRef]
- Wang, K.; Hou, J.; Zeng, X. Lane-Change Intention Prediction of Surrounding Vehicles Using BiLSTM-CRF Models with Rule Embedding. In Proceedings of the 2022 China Automation Congress (CAC), Xiamen, China, 25 November 2022; pp. 2764–2769. [Google Scholar]
- Li, Z.-N.; Huang, X.-H.; Mu, T.; Wang, J. Attention-Based Lane Change and Crash Risk Prediction Model in Highways. IEEE Trans. Intell. Transport. Syst. 2022, 23, 22909–22922. [Google Scholar] [CrossRef]
- Yang, S.; Chen, Y.; Cao, Y.; Wang, R.; Shi, R.; Lu, J. Lane Change Trajectory Prediction Based on Spatiotemporal Attention Mechanism. In Proceedings of the 2022 IEEE 25th International Conference on Intelligent Transportation Systems (ITSC), Macau, China, 8 October 2022; pp. 2366–2371. [Google Scholar]
- Scheel, O.; Nagaraja, N.S.; Schwarz, L.; Navab, N.; Tombari, F. Attention-Based Lane Change Prediction. In Proceedings of the 2019 International Conference on Robotics and Automation (ICRA), Montreal, QC, Canada, 20–24 May 2019; pp. 8655–8661. [Google Scholar]
- Yan, J.; Peng, Z.; Yin, H.; Wang, J.; Wang, X.; Shen, Y.; Stechele, W.; Cremers, D. Trajectory Prediction for Intelligent Vehicles Using Spatial-attention Mechanism. IET Intell. Transp. Syst. 2020, 14, 1855–1863. [Google Scholar] [CrossRef]
- Wu, Z.; Liang, K.; Liu, D.; Zhao, Z. Driver Lane Change Intention Recognition Based on Attention Enhanced Residual-MBi-LSTM Network. IEEE Access 2022, 10, 58050–58061. [Google Scholar] [CrossRef]
- Scheel, O.; Nagaraja, N.S.; Schwarz, L.; Navab, N.; Tombari, F. Recurrent Models for Lane Change Prediction and Situation Assessment. IEEE Trans. Intell. Transport. Syst. 2022, 23, 17284–17300. [Google Scholar] [CrossRef]
- Powers, D.M.W. Evaluation: From Precision, Recall and F-Factor to ROC, Informedness, Markedness & Correlation. arXiv 2020, arXiv:2010.16061. [Google Scholar]
Disclaimer/Publisher’s Note: The statements, opinions and data contained in all publications are solely those of the individual author(s) and contributor(s) and not of MDPI and/or the editor(s). MDPI and/or the editor(s) disclaim responsibility for any injury to people or property resulting from any ideas, methods, instructions or products referred to in the content. |
© 2024 by the authors. Licensee MDPI, Basel, Switzerland. This article is an open access article distributed under the terms and conditions of the Creative Commons Attribution (CC BY) license (https://creativecommons.org/licenses/by/4.0/).