Article

A P-Q Coordination Control Strategy of VSC-HVDC and BESS for LVRT Recovery Performance Enhancement

College of Electrical Engineering, Zhejiang University, Hangzhou 310027, China
*
Author to whom correspondence should be addressed.
Electronics 2024, 13(4), 741; https://doi.org/10.3390/electronics13040741
Submission received: 30 December 2023 / Revised: 5 February 2024 / Accepted: 8 February 2024 / Published: 12 February 2024

Abstract

:
Voltage source converter (VSC)-based multi-terminal direct current (MTDC) transmission technology has been a research focus, and the low-voltage ride-through (LVRT) and recovery in receiving-end systems is one of the major problems to consider. A coordinated control strategy for a VSC-MTDC system is proposed to improve the frequency and voltage dynamics in the receiving-end system during the LVRT and recovery processes. A battery energy storage system (BESS) plays a significant role in providing frequency and voltage support with its flexible power control capability. During the LVRT process, the BESS can provide reactive current injection and active current absorption to improve system stability in the AC side, and during the recovery process, an adaptive current limitation method is proposed for the BESS converter to dynamically adjust the active and reactive power outputs according to the frequency and voltage deviation severity. Meanwhile, the coordination of the sending-end systems and DC chopper can reduce the power output to avoid DC overvoltage during LVRT, and it can also provide frequency support to the receiving-end system with the DC voltage transmitting frequency information during the recovery process. A simulation was carried out on the MATLAB/Simulink platform, and a three-terminal VSC-MTDC system was used to validate the effectiveness of the proposed strategy.

1. Introduction

Wind power has rapidly developed, playing a significant role in power supply, and voltage source converter (VSC)-based high-voltage direct current (HVDC) has been the most promising and rapidly developing technique for offshore wind farm (WF) connection due to its outstanding advantages compared with the conventional line-commutated converter-based HVDC (LCC-HVDC) transmission, e.g., independent active and reactive power control, black start capability, self-commutation, etc. [1]; hence, it is widely used in engineering projects [2]. For instance, there has been a certain number of VSC-HVDC projects for offshore WF connection reported in Germany and Britain [3], and some HVDC projects in Jiangsu and Guangdong have also been put into operation in recent years in China [4,5,6]. For a VSC-HVDC system, low-voltage ride-through (LVRT) is always a problem. When a serious grid fault occurs in the receiving-end system, the transmitted power via the receiving-end converter will possibly drop dramatically, and the power from the sending-end AC system and WF will then accumulate on the DC link, causing a DC voltage rise and triggering the DC overvoltage protection [7]. Furthermore, the grid fault will result in a risk of frequency disturbance in the receiving-end system; hence, frequency support should also be taken into consideration in the control strategy during LVRT and system recovery [8].
As for the VSC-MTDC LVRT technique, there are two main issues that need to be solved: (1) AC voltage sag and (2) DC voltage rise. To support the AC voltage, it is necessary to inject a certain reactive current to the grid according to a grid code [9]. Aside from extra static synchronous compensators [10,11], converters also have the ability to provide reactive power compensation. As for VSC-HVDC converters, the reactive current can be provided and prioritized over the active current to restore the grid voltage during LVRT [12]. The wind turbine converters can also provide reactive power support via an additional fault current limiter as an auxiliary device [13] or by introducing a feedforward compensation term in the rotor- and grid-side converter control loops [14]; however, these methods can only be applied to WFs that connect to the grid via an AC transmission line, and the frequency support has not been taken into account. On the other hand, the main reason that DC voltage rise occurs is due to a power imbalance in the DC link. To solve this issue, one direct method is to install energy dissipation equipment, such as DC choppers [15] and dynamic braking systems [16]. However, this may require the electronic devices to withstand a large surplus current, which may increase the investment cost. Another way to reduce the imbalanced power is via a fast active power reduction in the sending-end systems. For instance, the researchers of [17,18,19] have intentionally decreased the AC voltage of a WF to activate the WF LVRT and reduce the WF power output when a grid fault occurred. Nevertheless, a large burst in the current in the braking resistors still exists in the early stage of the grid fault [19], and the LVRT and recovery of the WF may bring out other protection or synchronization instability problems [20,21]. Hence, the coordination of converters and energy dissipation equipment can be further explored to avoid DC overvoltage during the LVRT process.
After the fault is cleared, the receiving-end grid needs to return to a steady state as soon as possible. During this process, the fluctuations in both the system frequency and voltage should be suppressed. The flexible power control proposed in [12] makes the most use of reactive power support capability for grid voltage restoration during the LVRT and recovery processes without considering frequency support. Some researchers have proposed an active energy control to recover the WF’s active power and the energy of the WF converter [22], and some have paid attention to DC voltage restoration [23], but the dynamics of the AC grid have not been discussed. In [8], a voltage and frequency regulation control strategy for wind turbines based on a super capacitor (SC) has been proposed. The functional mode of the SC can be switched so that it can provide reactive power support during the fault and active power support in the recovery stage. Similarly, a frequency voltage support method has been proposed for distributed energy resources in [24], such as a converter-interfaced battery energy storage system (BESS). The active and reactive power outputs will increase or decrease linearly according to the frequency and voltage variation but without coordination. The above two methods do not realize the coordination of active and reactive powers. Another control strategy for a BESS in a low-voltage distribution grid was developed in [25], in which frequency and voltage coordination control were realized by adjusting the reference current magnitude and its angle. However, this control strategy is not suitable for high-voltage transmission systems such as VSC-HVDC. Additionally, the common disadvantage of the methods in [24,25] is that the rated capacity of the converter is not considered. In fact, the capacity of the converter can be adaptively distributed for active and reactive powers, and then the converter can realize the coordinated control of the frequency and voltage support, which can be fully utilized in our research. Additionally, sending-end systems can also participate in receiving-end system frequency regulation, further improving the system frequency dynamics.
Based on the above analysis, this paper proposes a P-Q coordination control strategy for a VSC-MTDC power system integrated with a BESS to improve the system frequency and voltage dynamics during the LVRT and system recovery processes. The converters will coordinate to provide AC voltage support and avoid DC overvoltage with the help of the DC chopper when a grid fault occurs in the receiving-end system, and then participate in frequency and voltage fluctuation suppression during the recovery process. With a fast response and flexible power control capability, the BESS will play an important role in the whole process to provide frequency and voltage support.
The main contributions of this paper are listed as follows:
(1)
An active power absorption control rule is proposed for a BESS to absorb active power according to the voltage drop during the LVRT process. Such a design can improve the system frequency regulation dynamics and enhance the system transient stability.
(2)
An adaptive current limitation method is proposed for a BESS in which the active and reactive current references will be limited according to the frequency and voltage deviation during the recovery process. In this way, the active and reactive powers can be dynamically adjusted while considering the frequency and voltage fluctuation degree and the constraint of the converter-rated capacity to provide both frequency and voltage support.
(3)
The coordination sequence of the sending-end systems and DC chopper is improved to reduce the surplus power that needs to be dissipated and to lower the requirement for electronic devices. Additionally, such coordination can also allow the sending- end systems to provide frequency regulation, with the DC voltage transmitting frequency information during the recovery process.
The rest of this paper is organized as follows: Section 2 demonstrates the problems in the existing control strategy. Section 3 presents the proposed P-Q coordination control strategy in detail. The design of the key parameters and the system stability analysis are conducted in Section 4. The simulation is based on the MATLAB/Simulink platform and the results are given in Section 5. Finally, the conclusions are drawn in Section 6.

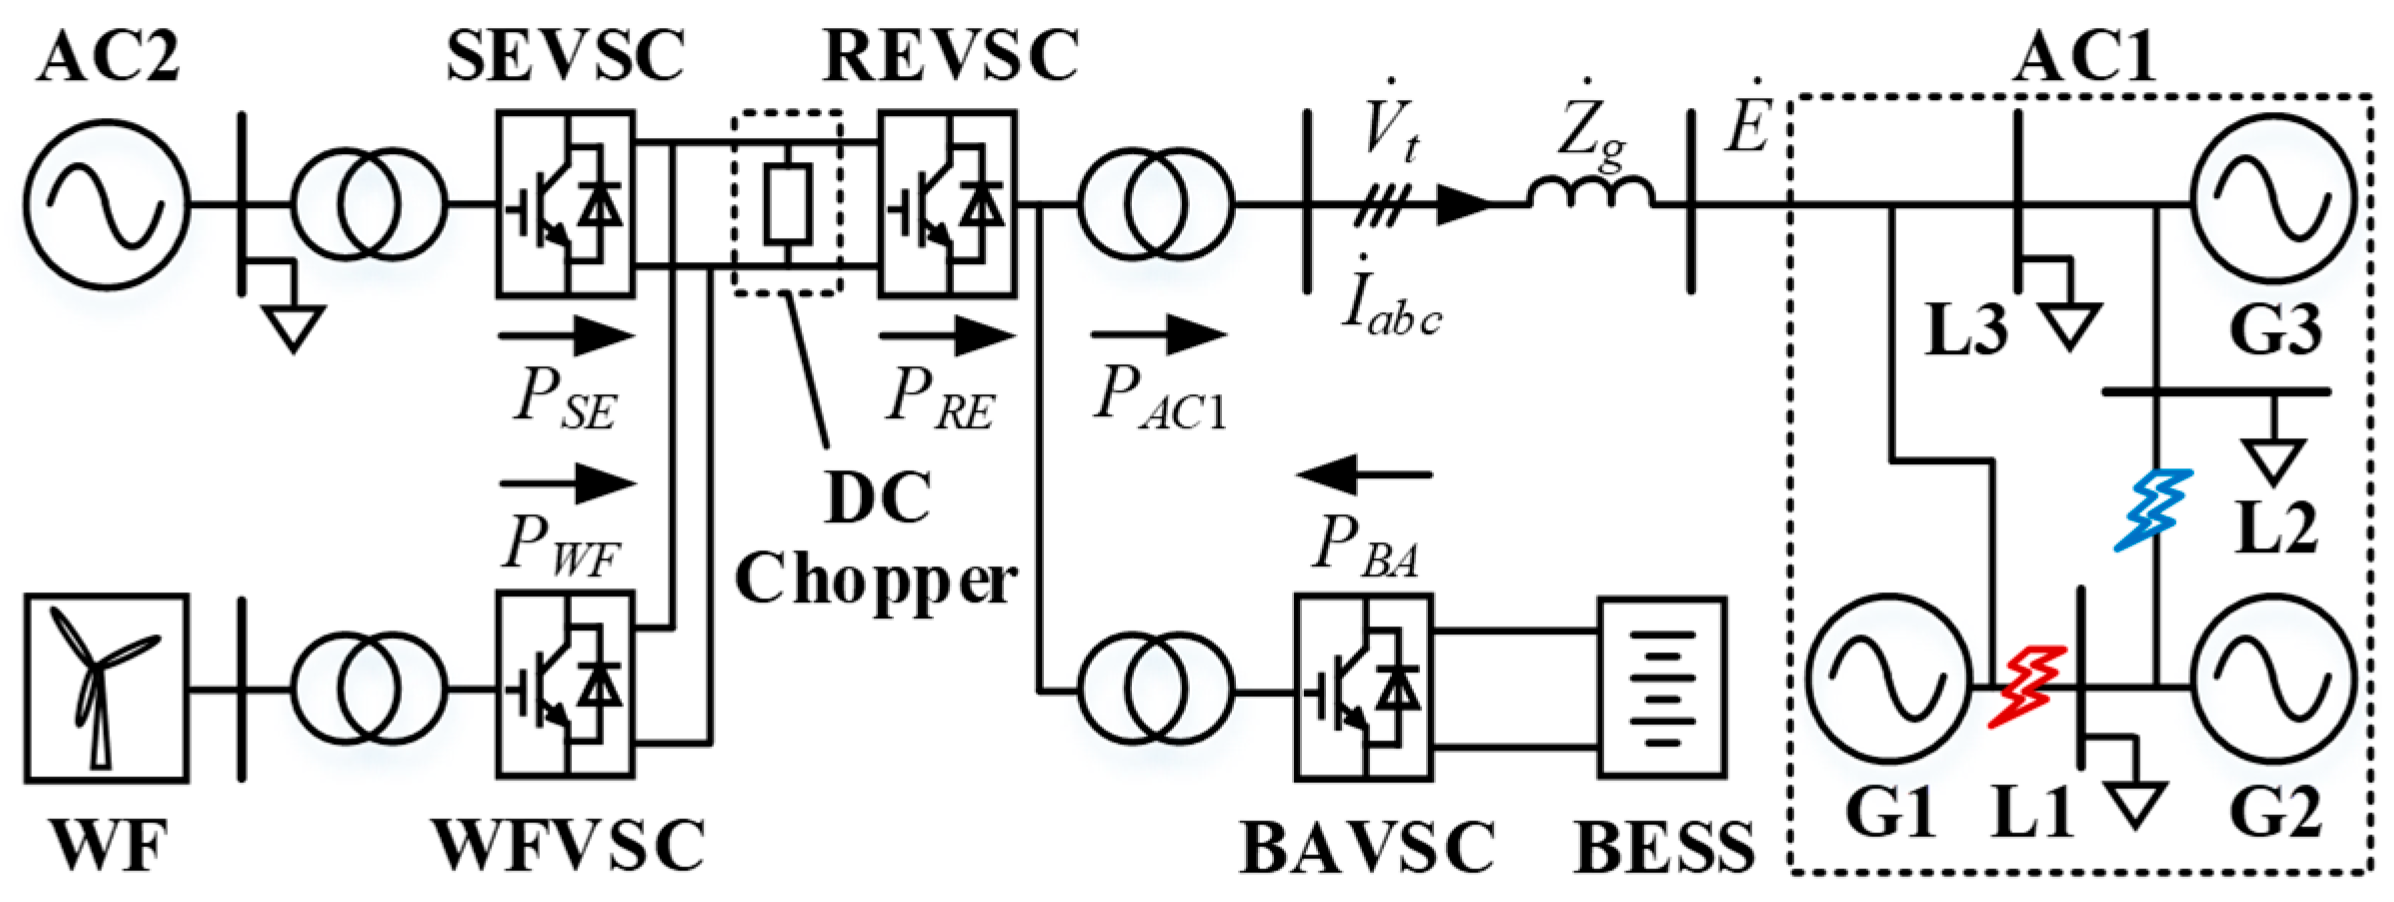
2. System Configuration and Problem Description

2.1. System Configuration

In Figure 1, a typical three-terminal VSC-HVDC system is used to represent a typical VSC-MTDC topology, and a wind farm is interconnected via a converter station with the system, which can be regarded as a typical VSC-HVDC application scenario and be widely used in a real power system [5,6]. The receiving-end system, AC1, is a modified three-machine nine-bus system with three synchronous generators (SGs), G1–G3, and load nodes, L1–L3. The sending-end system, AC2, is represented by one SG for the sake of simplicity. A single doubly fed induction generator (DFIG)-based wind turbine (WT) is used to represent the whole aggregated WF. The two AC systems and the WF are interconnected via three converters, namely REVSC, SEVSC, and WFVSC. The power from the sending-end system, AC2, and the WF are transmitted to the receiving-end system, AC1, through the HVDC link. A DC chopper is connected to the DC terminal of REVSC in parallel. Additionally, a BESS near REVSC is connected to AC1 via BAVSC. The arrows in Figure 1 denote the positive power flow direction. Other details will be explained in Section 5.

2.2. Conventional Control Strategy

In a conventional control strategy, when a grid fault occurs in AC1, the possible control methods for converters and the DC chopper in Figure 1 include the following:
(1)
BAVSC P-f and Q-V control [24], which enables BAVSC to generate/absorb active and reactive power with the ramp rate control when the grid frequency and voltage deviate from the nominal values.
(2)
REVSC reactive current control [12], which injects the reactive current as a priority for voltage support as per the grid code during LVRT and adjusts the active current reference according to the change in the reactive current reference.
(3)
WFVSC AC voltage reduction control and WF active power reduction control [19], which change the AC voltage to 0.2 p.u. after detecting that the DC voltage exceeds the limit, intentionally leading to the LVRT process of the WF and reducing the WF power output.
(4)
SEVSC active power reduction control [26], which controls the sending-end AC system to reduce the power output when the DC voltage exceeds the limit.
(5)
DC chopper control [19], which triggers the DC chopper to dissipate the surplus power in the DC link when the DC voltage increases to the limit value.
In this way, based on the aforementioned control methods, during the LVRT process, the system dynamics can be improved on both AC and DC sides: (1) On the AC side, BAVSC and REVSC can provide certain reactive power to support the AC voltage drop. (2) On the DC side, WFVSC, SEVSC, and the DC chopper can cooperate to avoid DC overvoltage.
However, such a control strategy mainly focuses on the grid voltage support but gives little consideration to frequency regulation, especially during system recovery. Although the BAVSC control can provide both frequency and voltage support in the whole process, it lacks collaboration between the active and reactive powers and ignores the rated capacity of the converter as a constraint. Furthermore, the present coordination sequence of the sending-end systems and DC chopper still require the DC chopper to dissipate the rated power output from the sending-end systems in the early stage of the grid fault; hence the rated current of electronic devices should be large enough to withstand the power flow in the first few hundred milliseconds.

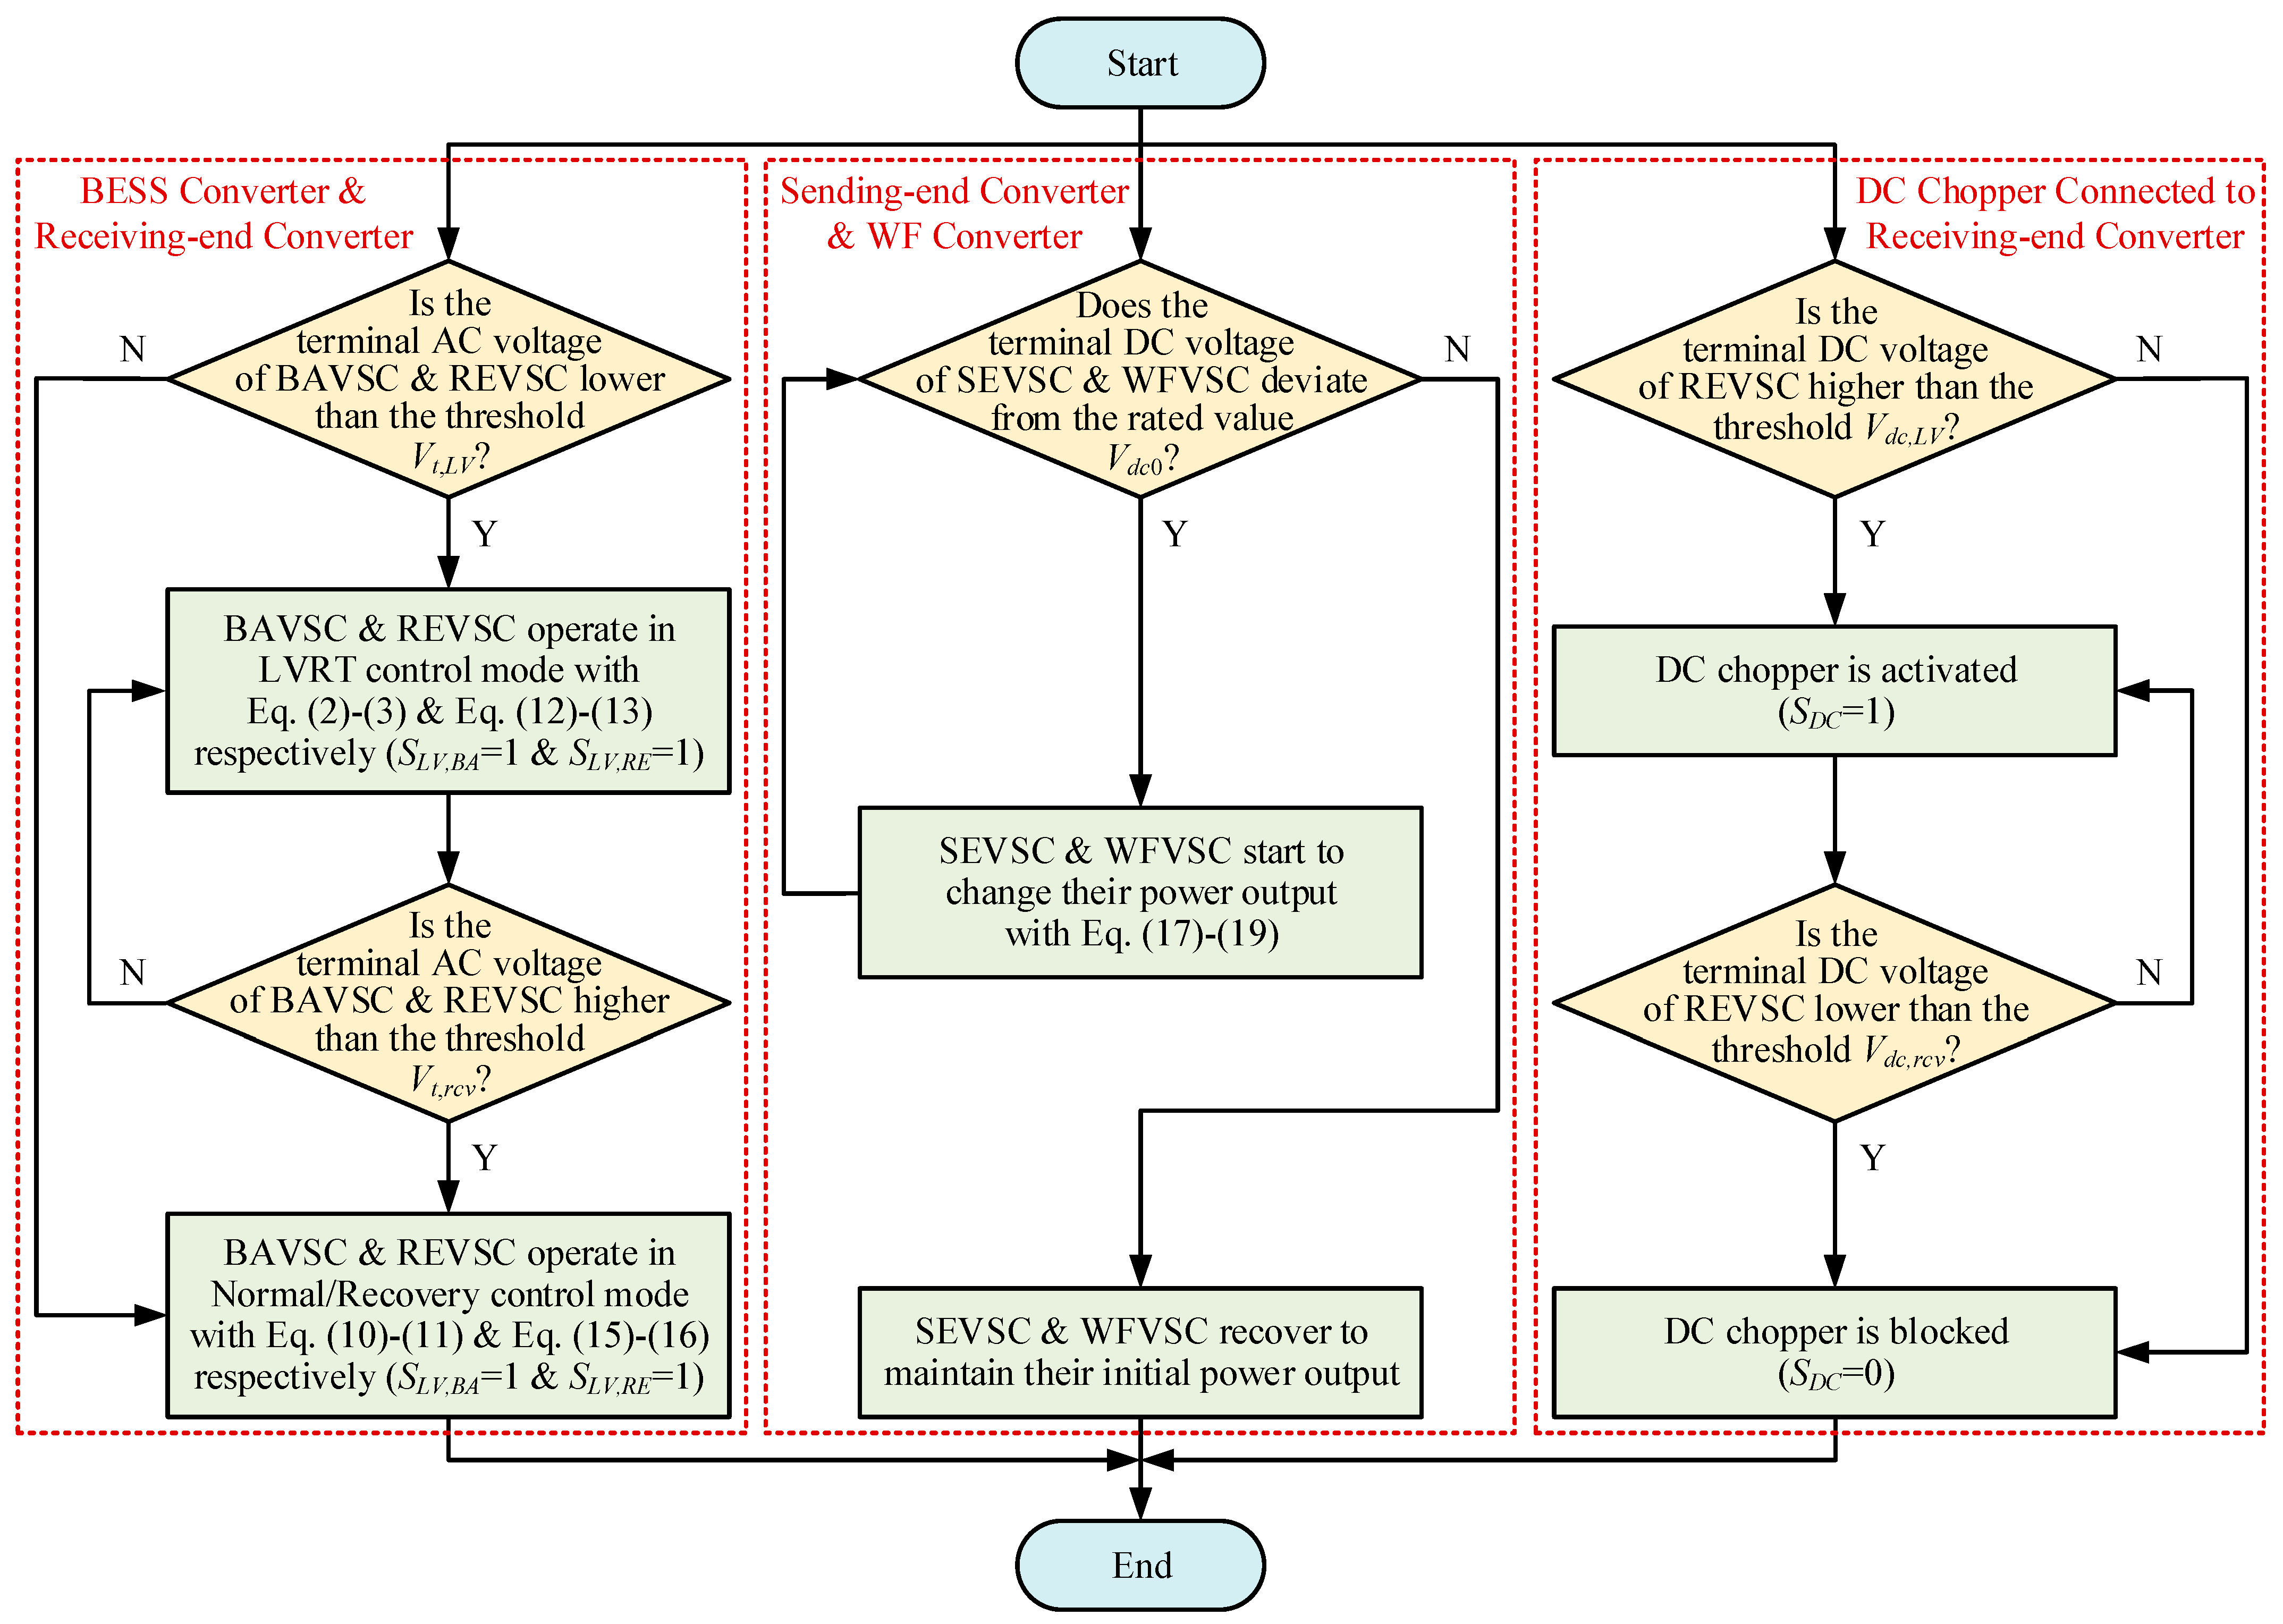
3. The Proposed P-Q Coordination Control Strategy

3.1. Overall Description

To avoid the aforementioned problems, a P-Q coordination control strategy is developed to improve the frequency and voltage dynamics by utilizing all potential equipment in the following two processes as follows: (1) During the LVRT process, the BESS and the receiving-end converters adopt the reactive current control to provide voltage support, while the sending-end converter and the WF reduce the power output via droop control, and the DC chopper is activated to dissipate the surplus power to avoid DC overvoltage. (2) During the recovery process, the BESS converter adopts the proposed adaptive current limitation to enhance both the frequency and voltage dynamics, and the sending-end converter and the WF can further participate in frequency regulation via DC voltage modulation.
The overall control diagram is shown in Figure 2. It can be seen that all the converters and the DC chopper only need local signal measurements (frequency and AC and DC voltages) to be activated. The system’s AC voltage measurement can be used to estimate whether the system is under the LVRT process, and it can also be used as the trigger signal to switch the control modes of each controller in different periods. This paper will mainly focus on the time scale of frequency and voltage regulation; the inner control loops and the PWM generation blocks of certain control blocks in Figure 2 are not discussed, and the typical PI control loop parameters used in [27] are used in the study and shown in Appendix A.

3.2. BESS Converter Control

During the LVRT process, the main target of the BESS converter control is to support the system voltage, and the frequency support and system stability enhancement should also be taken into account. The following is the generator swing equation:
2 H G d ω d t = P m P e
where HG is the inertial time constant; ω is the angular frequency; and Pm and Pe are the mechanical power and electrical power, respectively.
When a grid fault occurs, a dramatic drop in the system voltage results in Pe sharply reducing, while Pm can be considered unchanged at the moment; hence, the rotor speed increases, i.e., the system frequency increases. From this aspect, the BESS needs to absorb active power to improve frequency regulation.
According to the requirement of LVRT in the grid code [9], converter-interfaced equipment should provide a certain reactive current for voltage support, while there are few specific requirements for the active current. Considering the fact that the voltage drop degree can reflect the frequency deviation level during LVRT, and referring to the calculation of the reactive current in the grid code [9], the active current absorption is designed to be proportional to the value of the AC voltage drop. Therefore, by considering the reactive current control during the LVRT process, the control rule of the BESS converter can be designed as follows:
I q , B A r e f = min k q ( 0.9 V t , B A ) , I max
I d , B A r e f = min k d ( 0.9 V t , B A ) , I max 2 ( I q , B A r e f ) 2
where Vt,BA is the converter terminal voltage; kq and kd are the proportional coefficients of the reactive and active current references, respectively; and Imax is the converter current limit defined as in [27]:
I max = min { 1.2 I n , S B A / V t , B A }
where In is the rated converter current, and SBA is the rated converter capacity.
It can be seen from (2) and (3) that, during LVRT, the BESS converter can provide reactive power and, in the meantime, absorb active power. Such a design can not only provide frequency support, but also help improve the system’s transient stability, which will be further demonstrated in Section 4.
After the fault is cleared, the system frequency and voltage should return to the nominal values as soon as possible. The active and reactive power references, Pref and Qref, in Figure 2 can be calculated as follows [28]:
P r e f = K B f ( f B A f B A 0 )
Q r e f = K B V ( V t , B A V t 0 , B A )
where KBf and KBV are the droop coefficients of the active and reactive power references, respectively; fBA and fBA0 are the measured system frequency and its rated value, respectively; and Vt0,BA is the rated value of the converter terminal voltage.
Then, the original active and reactive current references, I d , B A r e f 0 and I q , B A r e f 0 , can be generated via outer PI loops, as shown in Figure 2. To avoid the current exceeding the maximum value, the current references should also be limited. Traditional methods for current limitation mainly include the following: (1) reactive current injection in priority, which has been adopted during the LVRT process, and (2) active current injection in priority. However, during the recovery process, both the frequency and voltage fluctuations should be well suppressed. Hence, an adaptive current limitation method is proposed in which the active and reactive current references should be limited according to the frequency and voltage deviations. The more the frequency/voltage deviates from the nominal value, the more the active/reactive current reference should be distributed. The coordination index M is proposed to compare the frequency and voltage deviations in the same dimension:
M = M f M V 2 + M f 2
M f = f B A f 0 f max f 0 f B A > f 0 + Δ f d b 0 f 0 Δ f d b f B A f 0 + Δ f d b f 0 f B A f 0 f min f B A < f 0 Δ f d b
M V = V t , B A V t 0 V t max V t 0 V t , B A > V t 0 + Δ V t , d b 0 V t 0 Δ V t , d b V t , B A V t 0 + Δ V t , d b V t 0 V t , B A V t 0 V t min V t , B A < V t 0 Δ V t , d b
where fBA, f0, Vt,BA, and Vt0 are the measured and rated system frequency and converter terminal voltage values, respectively; fmax and fmin are the maximum and minimum allowable frequency values, respectively; Vtmax and Vtmin are the maximum and minimum allowable voltage values, respectively; and Δfdb and ΔVt,db are the dead-band ranges of the frequency and voltage, respectively. Specifically, if both Mf and MV are 0, M equals 0. Then, the active and reactive current references can be limited, as shown below, and their maximum limitation values, I d , B A max and I q , B A max , changing with fBA and Vt,BA, are shown in Figure 3:
I d , B A r e f = sign ( I d , B A r e f 0 ) min I d , B A r e f 0 , I d , B A max
I q , B A r e f = sign ( I q , B A r e f 0 ) min I q , B A r e f 0 , I q , B A max
where sign(x) is the sign function and denotes the sign of the variable x; I d , B A max = M · I max ; and I q , B A max = 1 M   2 · I max .
Based on (7)–(11) and Figure 3, it can be seen that Mf and MV reflect the system frequency and voltage deviations, while M reflects the ratios of Mf and MV and is also used to adjust the limitation values of the active and reactive currents. In this way, the active and reactive powers can be provided in a proper ratio to support both the system frequency and voltage, and can thus improve the system recovery comprehensively.
Additionally, the trigger signal SLV,BA in Figure 2 is used to estimate whether the system is undergoing the LVRT process, and it enables the converter to switch to the corresponding control rules. The signal is obtained via a hysteresis comparator with the terminal voltage as the input signal. Once the system voltage drops to below the threshold value Vt,LV, SLV,BA turns to 1 and enables the converter to adopt the control rules in (2) and (3); when the system voltage rises above the threshold value Vt,rcv, SLV,BA turns to 0 and the converter switches to the control rules in (10) and (11). The above process corresponds to the “P-Q Coordination Inner Current Limit” and “Mode Switch” blocks in Figure 2.
Note that the state of charge (SOC) of the BESS may have an impact on the control accuracy of the converter, which has been studied in our previous work [26]. In this paper, the influence of the SOC on the BESS is ignored.

3.3. Receiving-End Converter Control

Similar to the BESS converter, the receiving-end converter also needs to support the system voltage, while the receiving-end converter also needs to try to maintain the DC voltage and cannot inject active power into the DC link. Hence, the control rule of the receiving-end converter during the LVRT process is as follows [9,12]:
I q , R E r e f = min k q ( 0.9 V t , R E ) , I max
I d , R E r e f = I max 2 ( I q , R E r e f ) 2
where Vt,RE is the converter terminal voltage; Imax is the converter current limit and can also be defined as (4), with the subscripts “BA” replaced by “RE”; and SRE is the rated converter capacity.
In this way, the control rules in (12) and (13) enable the receiving-end converter to provide reactive power support as a priority during LVRT. It can be seen that the severity of the system voltage drop has a strong impact on active power transmission, since a deep voltage drop may enlarge the value of I q , R E r e f and then greatly reduce I d , R E r e f and the active power output.
During the recovery process, the converter restarts to control the DC voltage. In order to suppress frequency deviation rapidly, the DC voltage can be used to transfer frequency information to the sending-end AC system and wind farm and enable them to participate in frequency regulation, and the DC voltage reference Vdcref can be calculated as follows [29]:
V d c r e f = V d c r e f 0 + K V ( f R E f R E 0 )
where Vdcref0 is the rated DC voltage reference; KV is the droop coefficient; and fRE and fRE0 are the measured system frequency and its rated value, respectively. In this way, the system frequency deviation can be transferred into DC voltage deviation and can be detected by the sending-end and WF converters.
As for the current reference limitation, considering that the receiving-end converter needs to control the DC voltage and transfer the active power, the active current should be injected as a priority during the recovery process, and the active and reactive current references can be obtained as follows:
I d , R E r e f = min I d , R E r e f 0 , I max
I q , R E r e f = sign ( I q , R E r e f 0 ) min I q , R E r e f 0 , I max 2 ( I d , R E r e f ) 2
where I d , R E r e f 0 and I q , R E r e f 0 are the original active and reactive current references generated via outer PI loops, as shown in Figure 2.
Similarly, the trigger signal SLV,RE in Figure 2 can also be obtained via the hysteresis comparator with the same threshold parameters as in the BESS converter: when SLV,RE = 1, the converter adopts the control rules in (12) and (13); otherwise, it adopts (15) and (16). The process also corresponds to the “P-Q Coordination Inner Current Limit” and “Mode Switch” blocks in Figure 2.

3.4. Sending-End Systems Control

The sending-end systems include the sending-end AC system and WF. Based on the previous analysis and control rules, there are two possible reasons why the DC voltage rises: (1) the receiving-end system is under the LVRT process or (2) the receiving-end system frequency is larger than the rated value. Under either circumstance, the sending-end systems should reduce the power output. In this way, as for the sending-end converter, the power reference PSEref changes according to the DC voltage as follows [26]:
P S E r e f = P S E 0 + K P ( V d c , S E V d c 0 , S E )
where PSE0 is the initial power reference; KP is the droop coefficient; and Vdc,SE and Vdc0,SE are the measured DC voltage and its rated value, respectively.
As for the WF, to avoid the protective and synchronous problems caused by LVRT in the WF [20,21], the WF converter will change the WF frequency reference fWFref based on the DC voltage instead of changing the WF voltage, and then the WF can adjust its power output reference PWFref according to the WF frequency deviation [26,29]. Moreover, to prevent the WF frequency from exceeding the limitation fWFmax, a limiter is further added in the WF converter, as shown in Figure 2. The control rules can be expressed as follows [26,29]:
f W F r e f = f W F 0 + K f ( V d c , W F V d c 0 , W F )
P W F r e f = P W F 0 K σ ( f W F f W F 0 )
where fWF0 is the rated WF frequency; Vdc,WF and Vdc0,WF are the measured DC voltage and its rated value, respectively; PWF0 is the initial WTG power output, generally determined by the MPPT control mode; fWF and fWF0 are the measured WF frequency and its rated value, respectively; and Kf and Kσ are the droop coefficients for the WF converter and WF, respectively.
Based on the control rules in (17)–(19), the sending-end systems can decrease the power output to reduce the power imbalance when a grid fault occurs in the receiving-end system, and they can also adaptively change the power output during the system recovery process to help suppress the frequency deviation.

3.5. DC Chopper Control

When a severe fault occurs in the receiving-end system, the power transmission will be seriously affected, and the DC voltage may rise sharply. At this time, power reduction from the sending-end systems is not enough to keep DC voltage stability. Thus, a DC chopper should be activated for energy dissipation.
The DC chopper is connected to the DC terminal of the receiving-end converter in parallel. The IGBTs and centralized braking resistor are connected in series, and PWM is used to control all the IGBTs, with the absorbed power being determined by the duty cycle [15]. It should be noted that the adopted topology of the DC chopper may not be the best, but improving the topology is not the key point of this paper. The main purpose of this paper is to demonstrate the effect of the DC chopper and the coordination of each equipment during the LVRT and recovery processes.
It can be seen from the “Duty Cycle Loop” in Figure 2 that the duty cycle of the PWM is determined by the DC voltage. The higher the DC voltage, the more imbalanced power should be absorbed, and the larger the duty cycle should be. Moreover, since the receiving-end converter will control the DC voltage to transmit system frequency deviation during the recovery process, a hysteresis comparator is also adopted here to avoid misoperation: when the DC voltage rises above the threshold value Vdc,LV, the trigger signal SDC turns to 1 and activates the DC chopper for energy dissipation; when the DC voltage drops below the threshold value Vdc,rcv, then SDC turns to 0 and blocks the DC chopper, which corresponds to the “Trigger Signal” block in Figure 2.

3.6. Discussion

Based on the aforementioned design, the control rules of each equipment can coordinate with each other for frequency and voltage support during the LVRT and recovery processes, and the corresponding algorithm flow chart is shown in Figure 4.
(1) During the LVRT process, the system’s AC voltage decreases rapidly. When detecting that the AC voltage is lower than Vt,LV, the BESS and receiving-end converters will inject a reactive current as a priority with (2), (3), (12), and (13) as per the grid code requirement. Meanwhile, the BESS will absorb certain active power with (3) to help reduce the frequency deviation and improve the system stability if the reactive power output does not reach the converter capacity.
As for the DC side, since the system voltage reduction lowers the power transmission capability of the receiving-end converter, the power imbalance may cause the DC voltage to rise. Consequently, the sending-end and WF converters can detect the DC voltage deviation and change the power outputs to reduce the imbalanced power with (17)–(19). If the DC voltage continues rising and exceeds the threshold value Vdc,LV, the DC chopper will then be activated to absorb the surplus power. In this way, the system dynamics during LVRT in both the AC and DC sides can be improved.
(2) During the recovery process, it is important to suppress the system frequency and voltage fluctuations as soon as possible. When the AC voltage rises above Vt,rcv, both the BESS and receiving-end converters turn to normal/recovery mode and can provide frequency and voltage support with (10), (11), (15), and (16). Considering that traditional current limitation methods take only active or reactive current as a priority, a new current limitation method in (7)–(9) is proposed in which the active and reactive currents can be limited according to the frequency and voltage deviation severity, enabling active and reactive powers to be provided in a proper ratio. Only the local signal measurement is needed, and the calculation is updated in real time.
Moreover, during the recovery process, the DC chopper will be blocked when detecting that the DC voltage is lower than Vdc,rcv. Additionally, the receiving-end converter can further change the DC voltage according to the system frequency with (14) so that the frequency information can be transmitted to the sending-end systems, and AC2 and WF can also participate in frequency regulation with (17)–(19), improving system recovery.
It can be seen that full use has been made of the BESS to improve both the frequency and voltage dynamics during the whole process, which illustrates its significant role in providing system support. Furthermore, it should be noted that the coordination sequence of the sending-end systems and DC chopper has been improved in the proposed control. In the conventional control, the power reduction in the sending-end systems is activated at the same time when the DC chopper is triggered, while in the proposed control, the power output from the sending-end systems will decrease as soon as the DC voltage increases, and the DC chopper will be activated later when the DC voltage exceeds the threshold value. Such a difference is significant to enable the sending-end systems to take part in the receiving-end system frequency regulation during the recovery process and reduce the surplus power that needs to be dissipated by the DC chopper.

4. Key Parameters Affecting Analysis and Design

4.1. Transient Voltage Stability Analysis during LVRT

4.1.1. Relationship between Terminal Voltage and Active Current

According to Figure 1, the current of the converter side satisfies I ˙ a b c = I ˙ a b c , B A + I ˙ a b c , R E , where I ˙ a b c , B A and I ˙ a b c , R E are the current vectors of the BAVSC and REVSC terminals. Then, it can be transformed into the dq frame:
I d I q = I d , B A I q , B A + I d , R E I q , R E
It neglects the inner loop of the converter, i.e.,   I d , B A = I d , B A r e f , I q , B A = I q , B A r e f , I d , R E = I d , R E r e f , I q , R E = I q , R E r e f . Moreover, when neglecting the transformer saturation and loss, the terminal voltage values of the BESS and receiving-end converters are considered equal, i.e., Vt,BA = Vt,RE = Vt. By combining (2), (3), (12), (13), and (20), the relationship between the terminal voltage Vt and the active current Id on the converter side (namely “control curve” in the following) can be obtained as follows:
I d = max I max 2 k q ( 0.9 V t ) 2 k d ( 0.9 V t ) S B A S R E , I max 2 k q ( 0.9 V t ) 2 1 S B A S R E , 0
where the term SBA/SRE is used to unify the base value of the current between the two converters. For the sake of simplicity, the values of kq in (2) and (12) are the same.
As for the grid side, the network equation can be expressed as follows:
V ˙ t = E ˙ + Z ˙ g I ˙
where E ˙ is the grid voltage, and Z ˙ g = Z g θ g , which is the line impedance of the grid.
By transforming (22) into a Vt-oriented dq frame and combining (2) and (12), the relationship between Vt and Id on the grid side (namely the “system curve” in the following) can be derived as follows:
V t Z g ( I d cos θ I q sin θ ) 2 + Z g ( I d sin θ + I q cos θ ) 2 = E 2 I q = k q ( 0.9 V t ) 1 + S B A S R E
Therefore, (21) and (23) constitute the system quasi-steady model during LVRT, and the intersection of the two curves is the system equilibrium point.

4.1.2. Key Factors Influencing Transient Voltage Stability

According to (21) and (23), the two curves are mainly influenced by the grid voltage E, the grid impedance amplitude Zg and its angle θg, and the proportional coefficients kq and kd, which also affect the existence of the equilibrium point as well as the system transient voltage stability. The influence of these factors on the equilibrium point will be analyzed based on the Vt-Id plane. The default values of the parameters are set as E = 0.3 p.u., Zg = 0.5 p.u., θg = 80°, kq = 2, and kd = 3, and only one parameter will vary, while the others will be fixed in each figure.
(1)
Grid voltage E
The system Vt-Id characteristics when changing the grid voltage drop E are shown in Figure 5a. All of the system equilibrium points are stable (for example, it can be seen that the control curve shows a negative feedback characteristic at point A). It can be seen from Figure 5a that with the decreasing grid voltage, the system equilibrium point does not exist. In other words, under an extremely deep voltage drop, the system may not be able to maintain stability.
(2)
Grid impedance amplitude Zg
The system Vt-Id characteristics when changing the grid impedance amplitude Zg are shown in Figure 5b. Point B is an unstable equilibrium point since the control curve shows a positive feedback characteristic. It can be seen from Figure 5b that with the increasing grid impedance amplitude, the system equilibrium point does not exist, i.e., a large impedance may deteriorate the system’s stability.
(3)
Grid impedance angle θg
The system Vt-Id characteristics when changing the grid impedance angle θg are shown in Figure 5c. It can be seen from Figure 5c that when changing grid impedance angle, the system equilibrium point always exists, which means the change in the grid impedance angle has little influence on the existence of the system equilibrium point.
(4)
Proportional coefficient kq
The system Vt-Id characteristics when changing the proportional coefficient kq are shown in Figure 5d. It can be seen from Figure 5d that changing the kq value will influence the two curves, and the system’s stable equilibrium point always exists, which means there is no limitation to the value of kq. However, if kq is too large, the curves will be sharp, and a small disturbance in Vt may cause a large variation in Id. Considering the requirements of the grid code that the recommended value of kq ranges from 1.5 to 3 [9], kq is set to be 2 in this paper.
(5)
Proportional coefficient kd
The system Vt-Id characteristics when changing the proportional coefficient kd are plotted in Figure 5e. Two system curves, shown as red and blue lines, correspond to E = 0.4 and 0.2 p.u., respectively. Specifically, the control curve ① corresponds to kd = 0, which means that the BESS does not absorb active power during LVRT.
It can be seen from Figure 5e that kd only influences the control curve. When E = 0.4 p.u., the system curve can intersect with all of the control curves with different kd values. But when E = 0.2 p.u., and with a decreasing kd value, the system equilibrium point tends to be unstable (such as point C) or even does not exist (the control curve does not intersect with the system curve in blue), which demonstrates that a certain active power absorption of the BESS converter during LVRT can improve the system’s transient stability. According to Figure 5e, the value of kd should not be smaller than 3. Considering the fact that a kd value that is too large may also lead to a large variation in Id under a small disturbance in Vt, kd is set to be 3 in this paper.

4.2. Key Parameter Design

4.2.1. Droop Coefficients

As for the BESS converter control rules in (5) and (6), it can be considered that when the system frequency or voltage reaches the maximum allowable deviation, the active or reactive power output should also reach the maximum [26]. Considering that the maximum reactive power QBAmax is theoretically only related to the converter capacity, i.e., QBAmax=SBA, the droop coefficients KBf and KBV can be designed as follows:
K B f = P B A max / Δ f max
K B V = S B A / Δ V t max
where Δfmax = fmaxf0 is the maximum allowable frequency deviation and ΔVtmax = VtmaxVt0 is the maximum allowable voltage deviation, set to be 0.5 Hz and 0.1 p.u., respectively [9,30], and PBAmax is the nominal maximum power of the BESS.
In the same way, as for the control rules in (14) and (17)–(19), it can be considered that when the system frequency reaches the maximum allowable deviation, the DC voltage should also reach the limited allowable value, and in the meantime, the power reduction in the sending-end systems should also reach the maximum. Thus, referring to [26], the droop coefficients KV, KP, Kf, and Kσ can be designed as follows:
K V = Δ V d c lim / Δ f max
K P = Δ P S E max / Δ V d c lim
K f = Δ f W F max / Δ V d c lim
K σ = Δ P W F max / Δ f W F max
where ΔVdclim is the limited DC voltage deviation during the recovery process, set to be 0.05 p.u. to ensure operational safety; ΔPSEmax is the maximum power output variation in the sending-end AC system, and the value is the same as the initial power output of the system PSE0; ΔfWFmax is the maximum frequency deviation in the WTG normal operating range, i.e., 0.5 Hz [30]; ΔPWFmax = σmaxPWF0 is the maximum power output variation of WF; PWF0 is the WF’s initial power output; and σmax is the maximum power reduction ratio, generally set as 0.2.

4.2.2. Threshold Values of Hysteresis Comparators

In the proposed strategy, several hysteresis comparators are used for trigger signal generation. The hysteresis comparators in the BESS and receiving-end converters are used for LVRT estimation. Generally, the system is considered to be undergoing the LVRT process when Vt < 0.9 p.u. [9]. To avoid frequent state switch due to voltage fluctuation, the two thresholds, Vt,LV and Vt,rcv, are set to be 0.9 p.u. and 0.95 p.u., respectively, in this paper.
Similarly, the hysteresis comparator in the DC chopper control strategy is added for DC chopper activation. Combined with the improved coordination sequence of the sending-end systems and DC chopper, when the DC voltage deviation exceeds ΔVdclim, this indicates that the rise in the DC voltage is caused by a grid fault, and the DC chopper should be activated. Thus, the upper threshold Vdc,LV is set to be Vdc0 + ΔVdclim, i.e., 1.05 p.u., while the lower threshold Vdc,rcv is set to be 1.03 p.u. in this paper.

4.2.3. Resistor in DC Chopper

Based on the previous analysis, the centralized braking resistor should handle all of the surplus power during LVRT. Considering that the DC voltage exceeds the maximum limit, the value of the resistor can be calculated as follows:
R D C = V d c max 2 P d c
where Vdcmax is the maximum allowable DC voltage and is set as 1.1 p.u. [23], and Pdc is the surplus DC power. As for the conventional control, the worst condition is that the surplus power equals the initial power output of AC2 and the WF; hence, Pdc_C = PSE0 + PWF0. As for the proposed control, since the activation sequence has been improved, the surplus power is equal to the remaining power of the WF, i.e., Pdc_P = (1 − σmax)PWF0.

5. Case Study

The studied three-terminal VSC-HVDC system in Figure 1 is modeled on the MATLAB/Simulink platform. All of the system parameters and the control parameters based on the parameter design in Section 4 can be found in Appendix A. A comparison study is conducted using three strategies: (1) no auxiliary support (NAS) from any converters, (2) the conventional control strategy (CCS) in Section 2, and (3) the proposed control strategy (PCS) in Section 3. A comparison of the control rules used under the CCS and PCS is listed in Table 1. In this study, a series of three-phase grounding faults, regarded as the most serious type of faults in the power system, will be set to test the proposed control strategy.

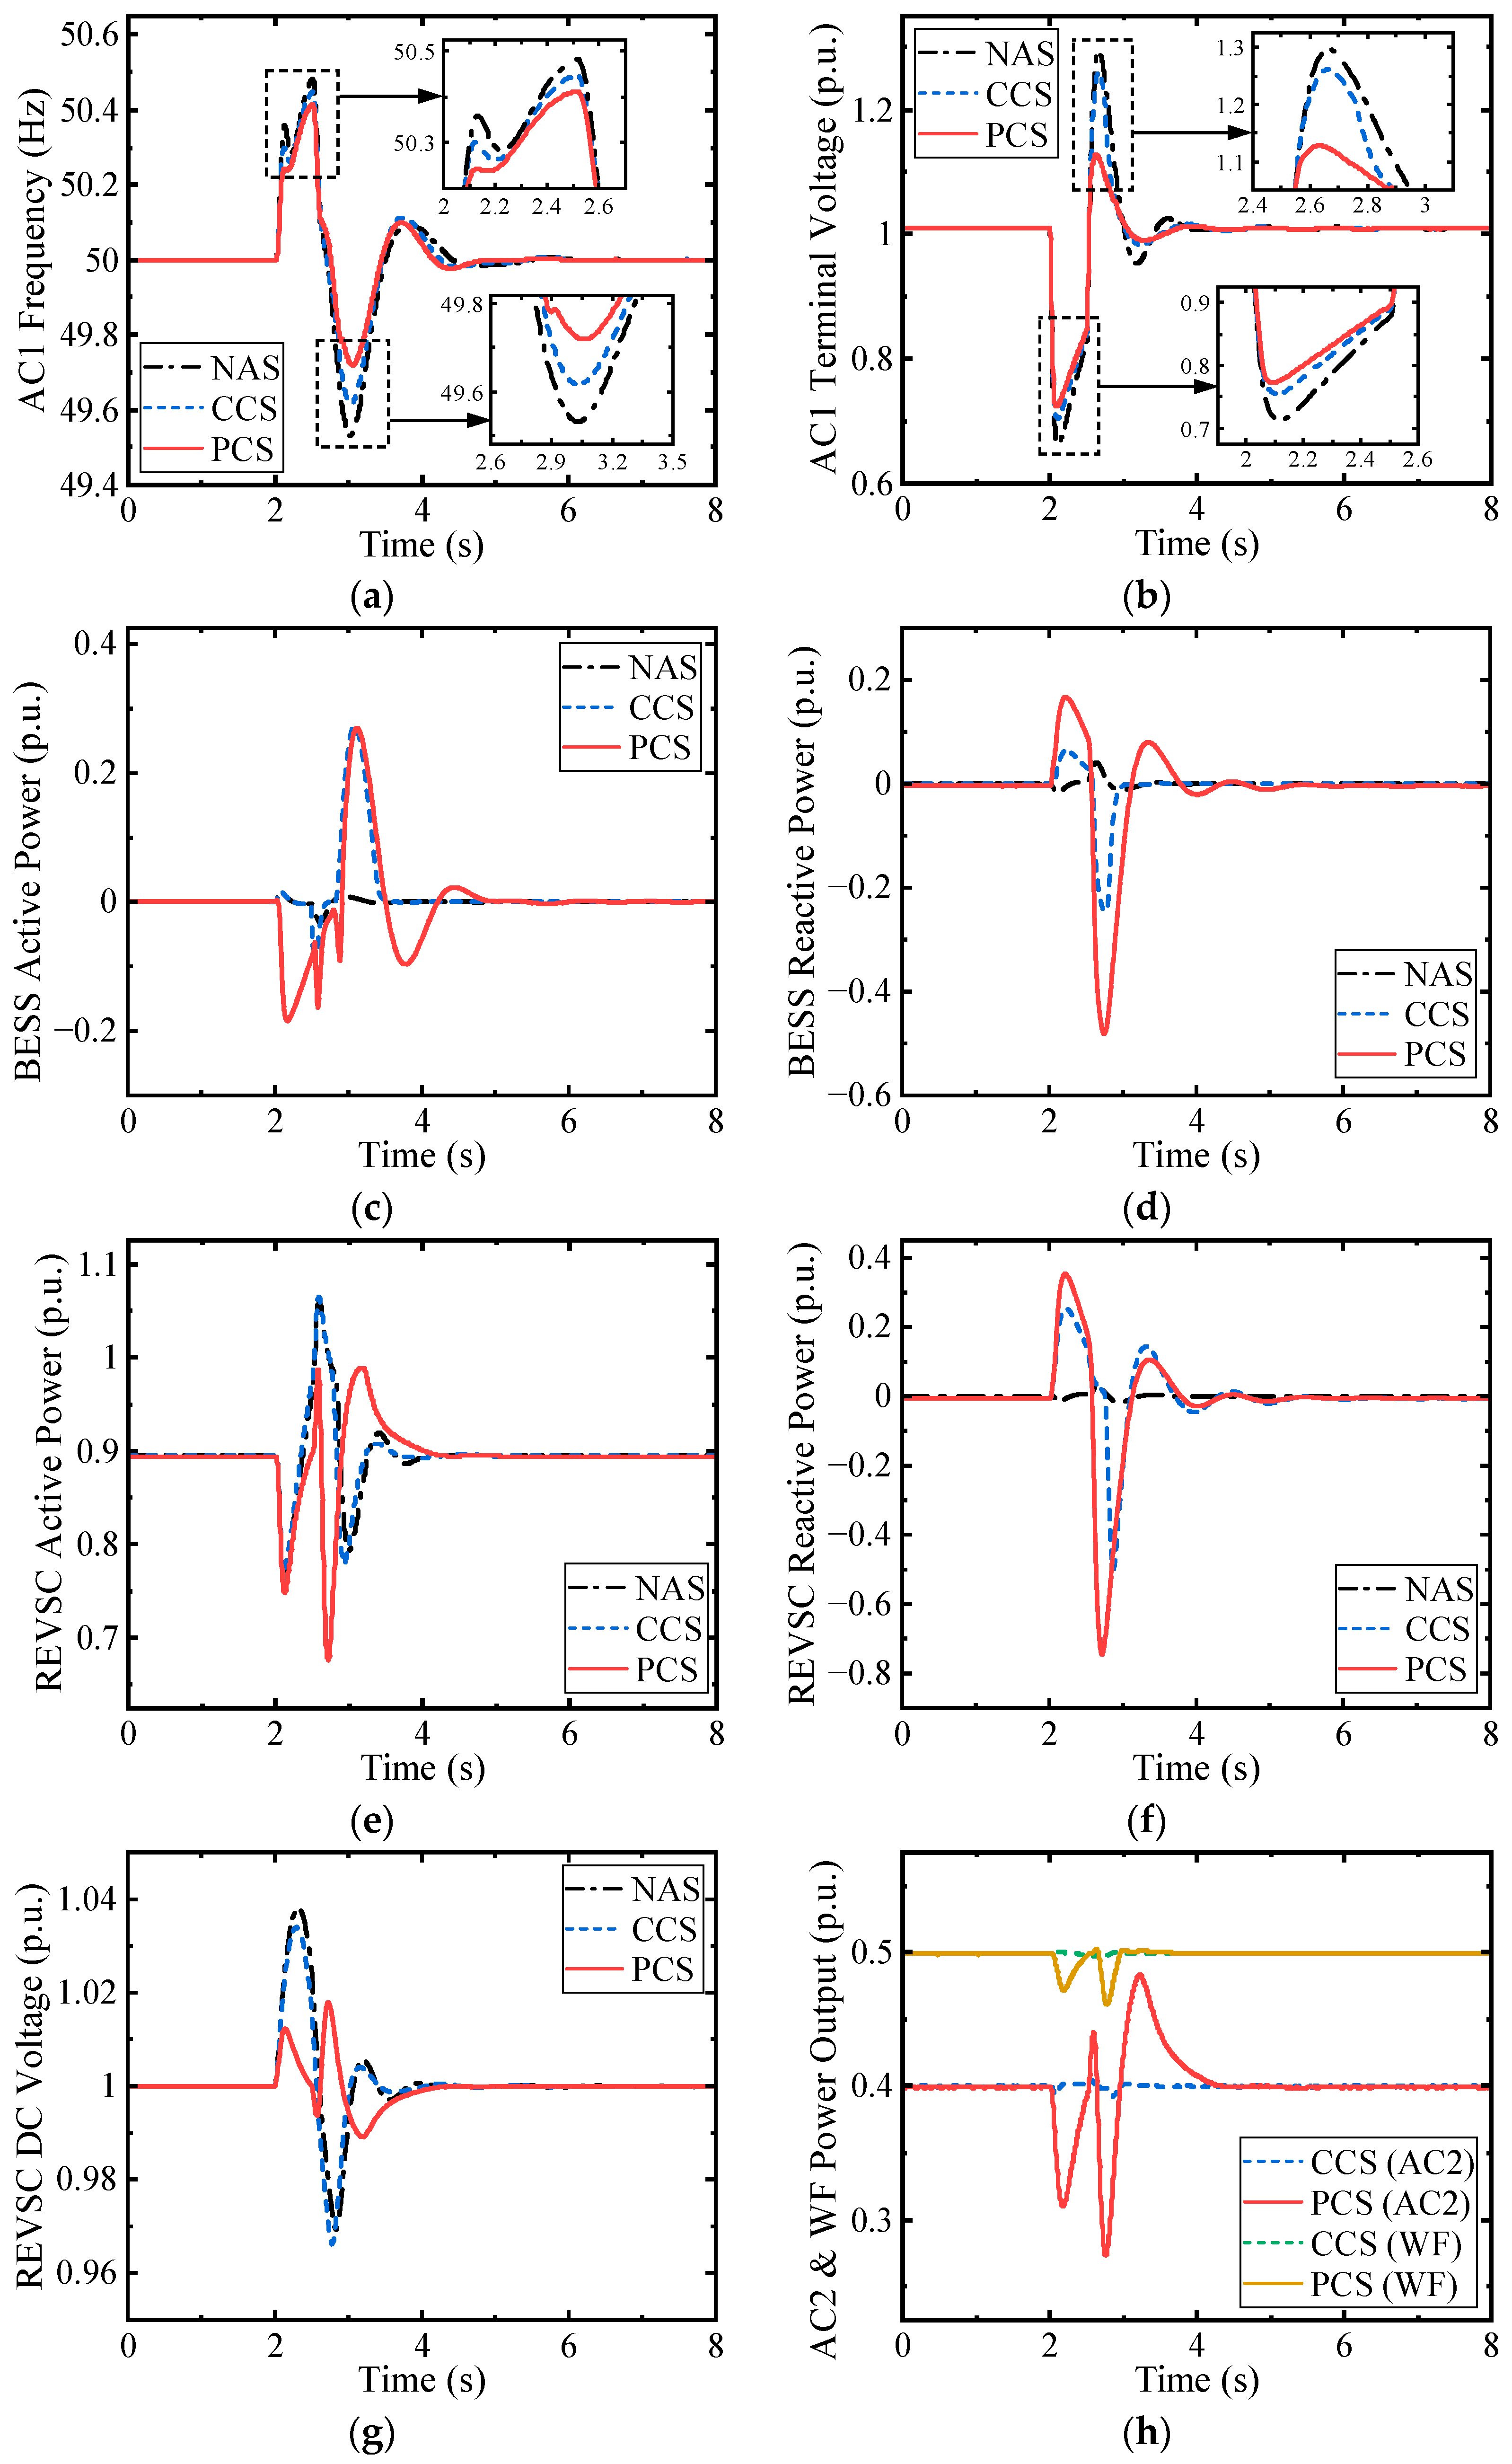
5.1. Case 1: Deep Voltage Drop in AC1

A three-phase grounding fault occurs between G1 and L1 in Figure 1 at t = 2 s, and the fault is cleared after 0.5 s. The system response results under different control strategies are plotted in Figure 1.
The frequency performance and voltage performance of AC1 are given in Figure 6a,b. The instant voltage drop is a deep drop level of more than 0.5 p.u. It can be seen that both the CCS and PCS can effectively provide frequency and voltage support during LVRT and recovery. Specifically, during the LVRT process, the voltage improvement with the PCS is nearly the same as that with the CCS, and it is not significantly improved compared with NAS. This is because, during LVRT, the reactive current control of the PCS and CCS are the same, while the current output of the converter is finite, and the AC terminal voltage is low when the fault occurs; hence, the maximum reactive power support from REVSC and BAVSC is also quite limited, further limiting the voltage improvement objectively.
On the other hand, BAVSC is further enabled to absorb a certain active current in the PCS during LVRT, thus improving the frequency dynamics to some extent compared with the CCS, which is one of the contributions of the paper. Moreover, during the recovery process, the frequency and voltage dynamic improvement with the PCS is much better than that obtained with the CCS, augmenting the system recovery significantly. This is because the proposed P-Q coordination control in BAVSC under the PCS can adjust active and reactive currents dynamically according to the fluctuations in frequency and voltage; thus, the converter capacity can be fully utilized in comparison with the active current control in CCS.
As for the DC side, it can be seen from Figure 6g that both the CCS and PCS can avoid the DC overvoltage, and the CCS can maintain the DC voltage at a lower level during LVRT compared to the PCS. However, according to Figure 6h, the maximum DC chopper current under the PCS is about one-third lower than that under the CCS, which only requires electronic devices with a smaller rated current, hence reducing the cost.

5.2. Case 2: Light Voltage Drop in AC1

A three-phase grounding fault occurs between G2 and L2 in Figure 1 at t = 2 s, and the fault is cleared after 0.5 s. The system response results under different control strategies are plotted in Figure 1, where the instant voltage drop is a light drop level.
It can be seen from Figure 7a,b that the PCS can provide better frequency and voltage support than the CCS during both the LVRT and recovery processes. It should be noted that, since the fault is remote to the converter terminal, the voltage drop is not quite deep, so the REVSC active power transmission is not seriously affected. Hence, the power imbalance in the DC link does not lead to the DC voltage exceeding 1.05 p.u., as shown in Figure 7g, and power reduction is not activated from the sending-end systems nor the DC chopper under the CCS. On the contrary, it can be seen from Figure 7h that, under the PCS, AC2 and the WF will change the power output when the DC voltage changes in the LVRT process, so the imbalanced power can be reduced to some extent, and the DC voltage deviation can be suppressed. Meanwhile, during the recovery process, the DC voltage can further transmit frequency information, and AC2 and the WF can then participate in frequency support.

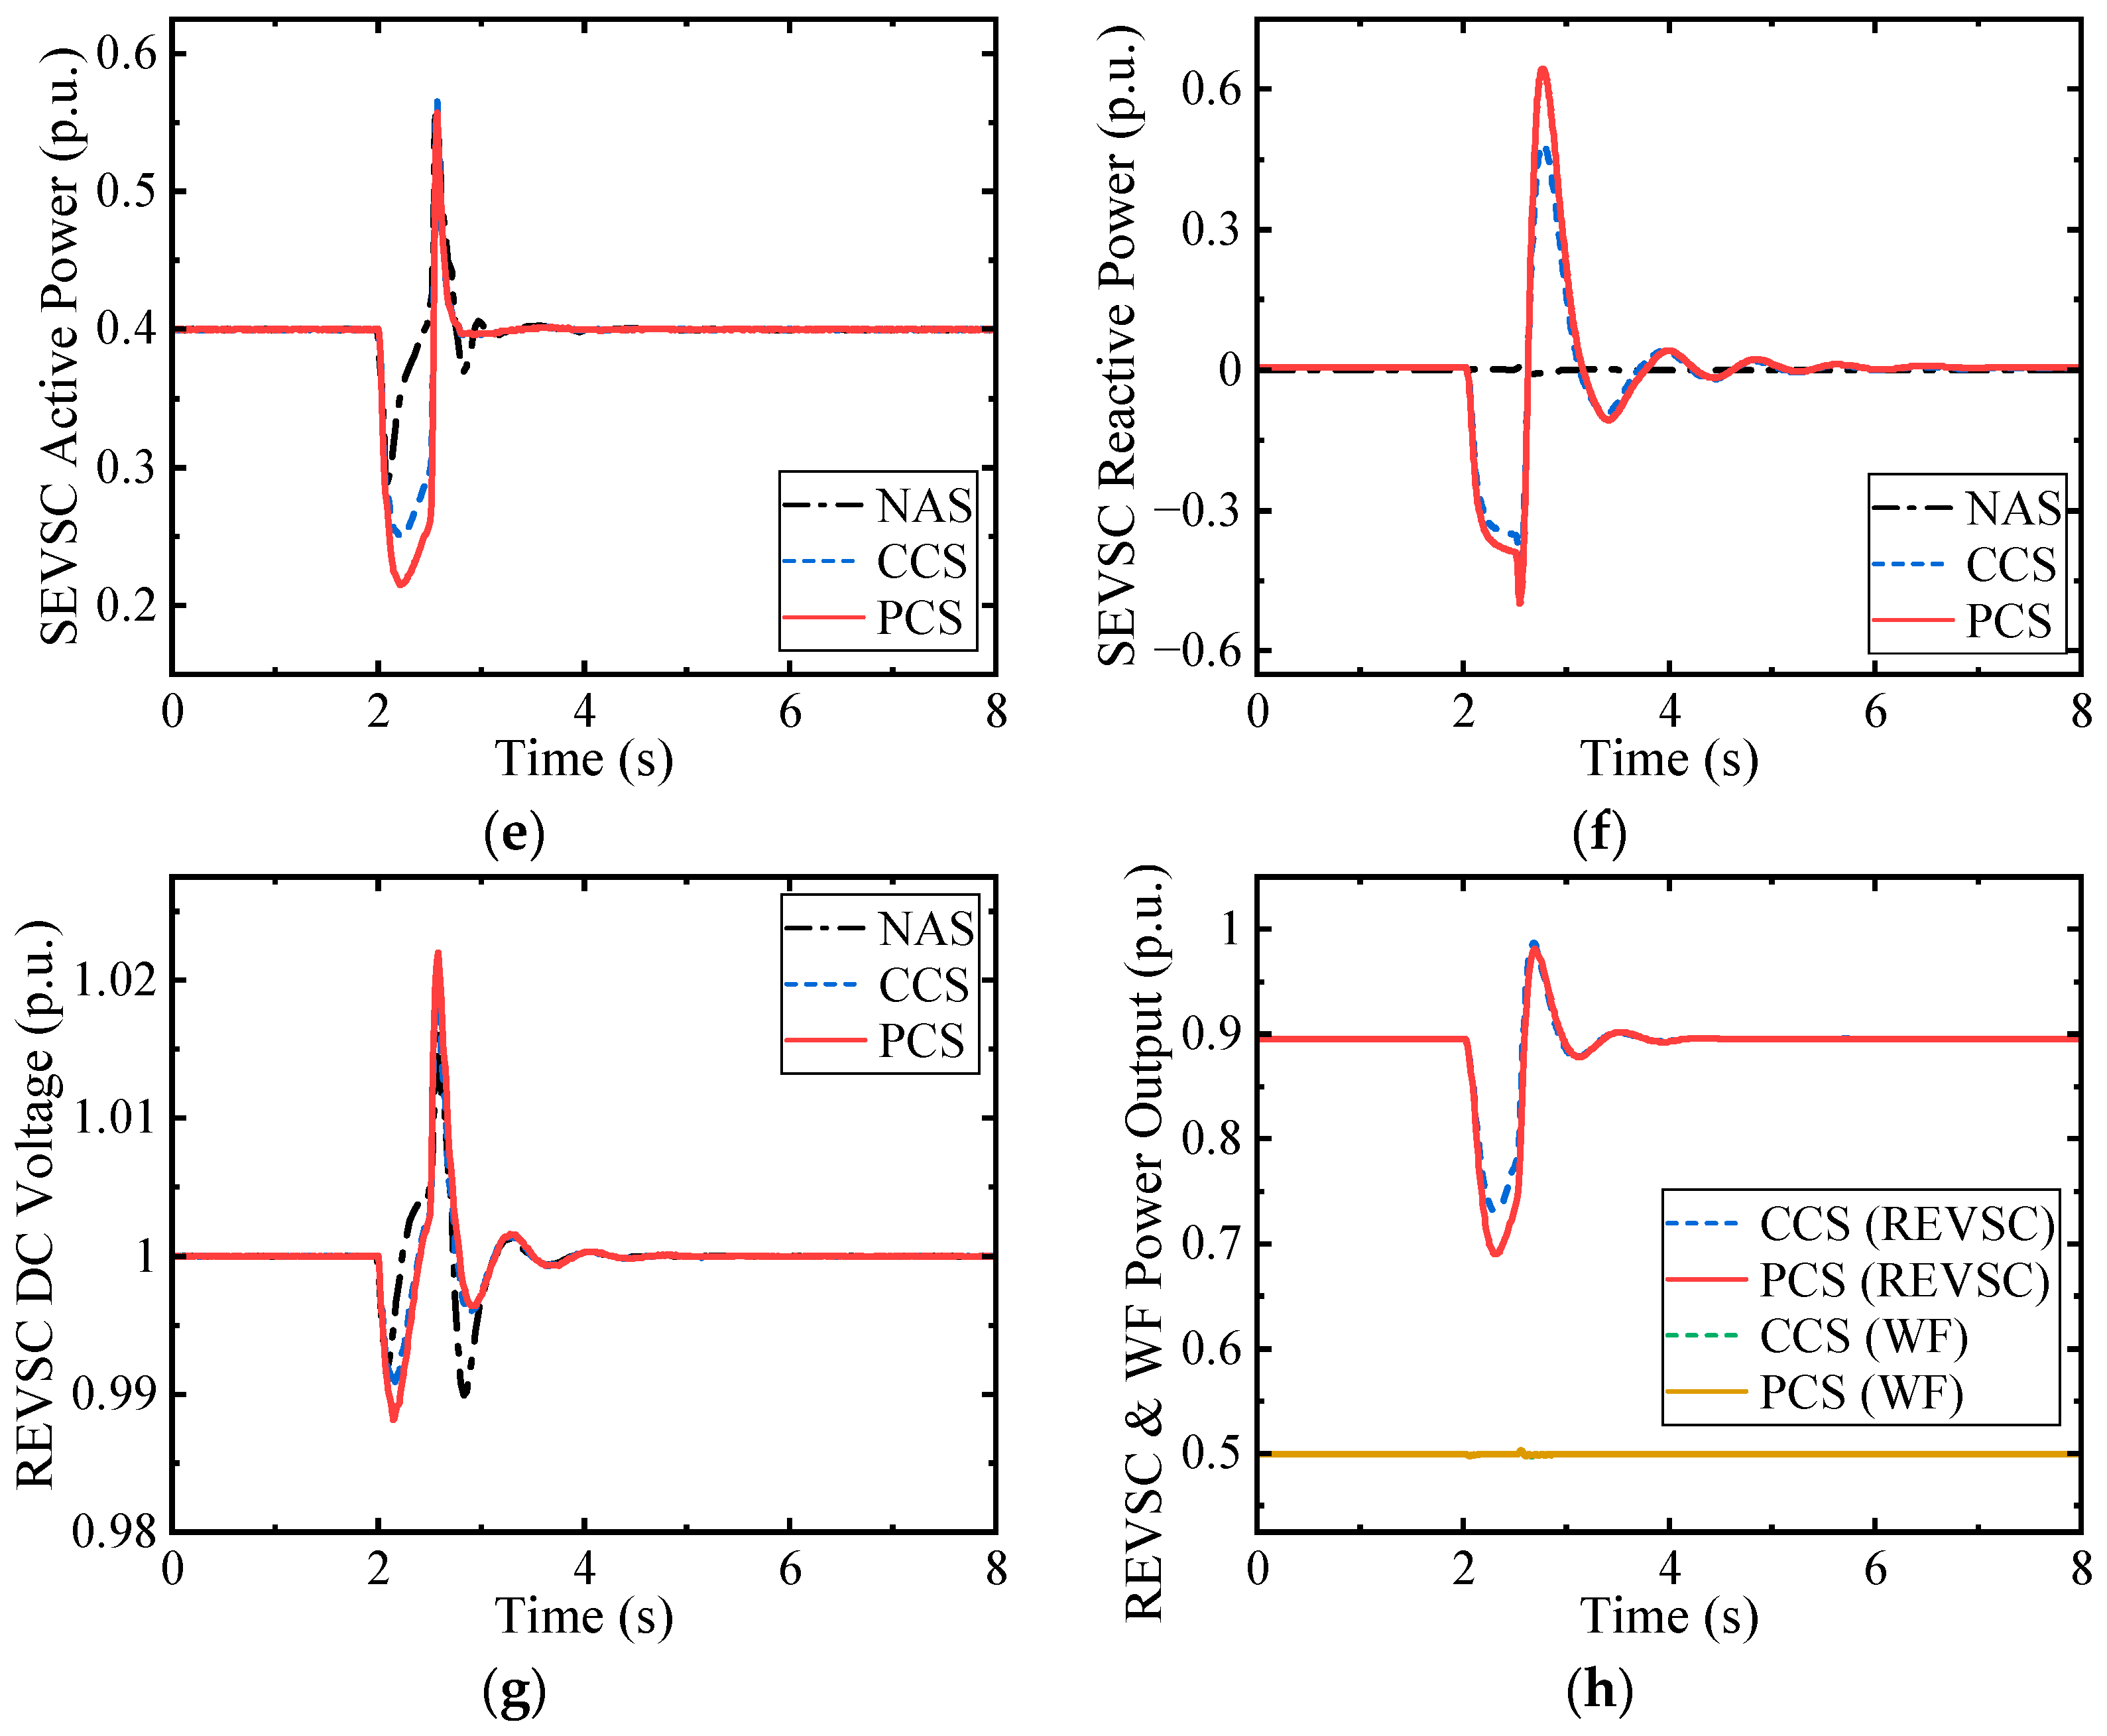
5.3. Case 3: Deep Voltage Drop in AC2

The efficacy of the proposed control strategy for LVRT and its recovery when a grid fault occurs in the receiving-end system has been validated. In fact, the control rules of the receiving-end converter during the LVRT and recovery processes can also be adopted in the sending-end converter. To carry out the validation, the AC2 sending-end system can be modified, as shown in Figure 8, which consists of SGs G4–G6, load nodes L4–L6, and a local BESS1 connected with BAVSC1, and their parameters are the same as that of the SGs G1–G3, load nodes L1–L3, and BESS in AC1, respectively, as shown in Table A2. The control rules (12), (13), (15), and (16) and the hysteresis comparator for mode switch in REVSC have been adopted in SEVSC, and the control strategy for BAVSC has also been adopted in BAVSC1. A three-phase grounding fault occurs between G4 and L4 in Figure 8 at t = 2 s, and the fault is cleared after 0.5 s. The system response results under different control strategies are plotted in Figure 9.
It can be seen from Figure 9a,b that the PCS can also be adopted in the sending-end converter to enhance system frequency and voltage stability during both the LVRT and recovery processes. Note that there are some differences between the results in Cases 1 and 2 and Case 3. On one hand, since the fault occurs in the sending-end system, the reactive power flow of SEVSC, as shown in Figure 9f, is opposite to that of REVSC when the fault occurs in the receiving-end system, as shown in Figure 6f and Figure 7f. On the other hand, the grid fault in AC2 results in a reduction in the SEVSC power output and a slight decrease in the DC voltage, as shown in Figure 9e,g. Therefore, according to the control rules, the DC chopper will not be activated, and the WF will maintain the initial power output, as shown in Figure 9h. This also means that only BESS1 provides frequency support, but there is no additional power support from the WF or AC1 during the recovery process.

6. Conclusions

In this paper, a P-Q coordination control strategy for VSC-MTDC system frequency and voltage performance enhancement during LVRT recovery is proposed, and the BESS plays a significant role in the whole process. During the LVRT process, the BESS as well as the receiving-end converter can provide reactive power injection as per the grid code, and the BESS can further absorb active power to suppress the frequency fluctuation and enhance system stability; additionally, the improved coordination sequence of the sending-end systems and DC chopper can not only effectively avoid DC overvoltage but also lower the requirement for electronic devices of the DC chopper. As for the recovery process, an adaptive current limitation method is proposed for the BESS converter to realize the dynamic adjustment of active and reactive powers with the coordination index and provide frequency and voltage support accordingly; additionally, the receiving-end converter can control the DC voltage to transmit frequency information to the sending-end systems and enable them to participate in frequency regulation. The proposed control strategy can also be adopted in other system topologies, and the generalized control strategy for more operation conditions (such as high-voltage ride-through) will be studied in our future work.

Author Contributions

Conceptualization, Z.W. and J.W.; methodology, Z.W. and J.W.; software, J.W. and R.L.; validation, R.L.; formal analysis, Z.W. and J.W.; investigation, J.W.; resources, Y.S.; data curation, Y.S.; writing—original draft preparation, Z.W. and J.W.; writing—review and editing, Z.W., J.W., R.L. and Y.S.; visualization, Y.S.; supervision, Z.W. and J.W.; project administration, Z.W. and J.W.; funding acquisition, Z.W. All authors have read and agreed to the published version of the manuscript.

Funding

This research was jointly supported by the National Natural Science Foundation of China (NSFC China), grant number 52077196 and U2166601.

Data Availability Statement

Data are contained within the article.

Acknowledgments

We acknowledge all the constructive suggestions and contributions from the Editors and Reviewers involved in this paper.

Conflicts of Interest

The authors declare no conflicts of interest.

Appendix A

In the system, the base power, base AC voltage, and base DC voltage are 400 MVA, 220 kV, and 400 kV, respectively.
Table A1. The parameters of the converters and HVDC link.
SymbolItemValueSymbolItemValue
SVSC/p.u.Rated VSC capacity (except BAVSC)1f0/HzRated system frequency50
SBA/p.u.Rated BAVSC capacity0.5fWF0/HzRated WF frequency50
VVSC/p.u.Rated VSC AC RMS voltage0.909LT, RT/p.u.Transformer inductance and resistance0.1, 0.005
Sdc/p.u.Rated DC power1Zg, θg/p.u.Line impedance and angle0.5, 80°
Vdc0/p.u.Rated DC voltage1RDC/p.u.Resistor in DC chopper3.03
Table A2. The parameters of SGs (G1–G3), loads (L1–L3), and BESS in the AC1 system.
SymbolItemValueSymbolItemValue
SG1/G2/G3/p.u.Rated power2.5, 2.5, 2.5TCH1/CH2/CH3/sTurbine time constant0.2, 0.2, 0.2,
VG1/G2/G3/p.u.Rated terminal voltage1, 1, 1.PG1/G2/G3ref/p.u.Initial power output0.85, 0.78, 0.69
HG1/G2/G3/sInertia time constant6, 6, 6PL1/L2/L3/p.u.Load1+j0, 3.8+j0, 4.4-j1.2
KG1/G2/G3Droop coefficient40, 40, 40PBAmax/p.u.BESS maximum power0.5
TG1/G2/G3/sGovernor time constant0.08, 0.08, 0.08
Table A3. The parameters of SG and load in the AC2 system.
SymbolItemValueSymbolItemValue
SG/p.u.Rated generator power4.0TG, TCH/sGovernor and turbine time constants0.08, 0.2
VG/p.u.Rated terminal voltage1.0PG/p.u.Initial generator power output3.6
HG/sInertia time constant8PL/p.u.Initial load3.2
KGDroop coefficient of generator40PSE0/p.u.Initial power reference of SEVSC0.4
Table A4. The parameters of the wind farm.
SymbolItemValueSymbolItemValue
Sn/p.u.Rated DFIG power2.778 × 10−3vn/m·s−1Rated wind speed12
Pn/p.u.Rated active power2.5 × 10−3HWT/sInertia time constant4.32
NwtNumber of DFIGs200σmMaximum power reduction ratio0.2
Table A5. The control parameters of the converters and DC chopper.
SymbolItemValueSymbolItemValue
KBf, KBVBAVSC power droop coefficients20, 2kpiConverter proportional gain of inner PI loop0.3
KVREVSC voltage droop coefficients5kiiConverter integral gain of inner PI loop10
KPSEVSC power droop coefficient8kpoConverter proportional gain of outer PI loop2
KfWFVSC frequency droop coefficient0.2kioConverter integral gain of outer PI loop40
KσWF power droop coefficient10Vt,LV, Vt,rcvHysteresis comparator thresholds in BAVSC and REVSC0.9, 0.95
kqBAVSC and REVSC reactive current droop coefficient2Vdc,LV, Vdc,rcvHysteresis comparator thresholds in DC chopper control1.05, 1.03
kdBAVSC active current droop coefficient3Δfdb, ΔVt,dbFrequency and voltage dead-band ranges of the BAVSC0.001, 0.01
Figure A1. The diagram of the generator governor and turbine.
Electronics 13 00741 g0a1

References

  1. Koondhar, M.A.; Kaloi, G.S.; Saand, A.S.; Chandio, S.; Ko, W.; Park, S.; Choi, H.-J.; El-Sehiemy, R.A. Critical technical issues with a voltage-source-converter-based high voltage direct current transmission system for the onshore integration of offshore wind farms. Sustainability 2023, 15, 13526. [Google Scholar] [CrossRef]
  2. Yang, L.; Li, Y.; Li, Z.; Wang, P.; Xu, S.; Gou, R. A simplified analytical calculation model of average power loss for modular multilevel converter. IEEE Trans. Ind. Electron. 2019, 66, 2313–2322. [Google Scholar] [CrossRef]
  3. Apostolaki-Iosifidou, E.; McCormack, R.; Kempton, W.; McCoy, P.; Ozkan, D. Transmission design and analysis for large-scale offshore wind energy development. IEEE Power Energy Technol. Syst. J. 2019, 6, 22–31. [Google Scholar] [CrossRef]
  4. Liu, L.; Li, X.; Jiang, Q.; Teng, Y.; Chen, M.; Wang, Y.; Zeng, X.; Luo, Y.; Pan, P. A multi-terminal control method for AC grids based on a hybrid high-voltage direct current with cascaded MMC converters. Electronics 2023, 12, 4799. [Google Scholar] [CrossRef]
  5. Jiang, Q.; Li, B.; Liu, T. Tech-economic assessment of power transmission options for large-scale offshore wind farms in China. Processes 2022, 10, 979. [Google Scholar] [CrossRef]
  6. Wu, J.; Wang, Z.-X.; Xu, L.; Wang, G.-Q. Key technologies of VSC-HVDC and its application on offshore wind farm in China. Renew. Sustain. Energy Rev. 2014, 36, 247–255. [Google Scholar] [CrossRef]
  7. Ramtharan, G.; Arulampalam, A.; Ekanayake, J.B.; Hughes, F.M.; Jenkins, N. Fault ride through of fully rated converter wind turbines with AC and DC transmission systems. IET Renew. Power Gener. 2010, 3, 426–438. [Google Scholar] [CrossRef]
  8. Li, Z.; Liu, F. Frequency and voltage regulation control strategy of wind turbine based on supercapacitors under power grid fault. Energy Rep. 2023, 10, 2612–2622. [Google Scholar] [CrossRef]
  9. Liu, Y.; Wang, Y.; Liu, H.; Xiong, L.; Li, M.; Peng, Y.; Xu, Z.; Wang, M. An LVRT strategy with quantitative design of virtual impedance for VSG. Int. J. Electr. Power Energy Syst. 2022, 140, 107661–107670. [Google Scholar] [CrossRef]
  10. Döşoğlu, M.K. Enhancement of LVRT capability in DFIG-based wind turbines with STATCOM and supercapacitor. Sustainability 2023, 15, 2529. [Google Scholar] [CrossRef]
  11. Kim, M.-N.; Yi, J.-S.; Won, C.-Y.; Lee, J.-H. Methods to improve dynamic system response of power compensators using supercapacitors in low-voltage ride-through (LVRT) conditions. Electronics 2022, 11, 1144. [Google Scholar] [CrossRef]
  12. Liu, Y.; Chen, Z. A flexible power control method of VSC-HVDC link for the enhancement of effective short-circuit ratio in a hybrid multi-infeed HVDC system. IEEE Trans. Power Syst. 2013, 28, 1568–1581. [Google Scholar] [CrossRef]
  13. Rashid, G.; Ali, M.H. Fault ride through capability improvement of DFIG based wind farm by fuzzy logic controlled parallel resonance fault current limiter. Electr. Power Syst. Res. 2017, 146, 1–8. [Google Scholar] [CrossRef]
  14. Wu, Z.; Zhu, C.; Hu, M. Improved control strategy for DFIG wind turbines for low voltage ride through. Energies 2013, 6, 1181–1197. [Google Scholar] [CrossRef]
  15. Xu, B.; Gao, C.; Zhang, J.; Yang, J.; Xia, B.; He, Z. A novel DC chopper topology for VSC-based offshore wind farm connection. IEEE Trans. Power Electron. 2021, 36, 3017–3027. [Google Scholar] [CrossRef]
  16. Cao, S.; Xiang, W.; Lu, X.; Lin, W.; Zhang, K.; Wen, J.; Zhang, X. Energy dissipation of MMC-HVDC based onshore wind power integration system with FB-DBS and DCCB. IET Renew. Power Gener. 2019, 14, 222–230. [Google Scholar] [CrossRef]
  17. Erlich, I.; Feltes, C.; Shewarega, F. Enhanced voltage drop control by VSC–HVDC systems for improving wind farm fault ridethrough capability. IEEE Trans. Power Deliv. 2014, 29, 378–385. [Google Scholar] [CrossRef]
  18. Jing, Y.; Li, R.; Xu, L.; Wang, Y. Enhanced AC voltage and frequency control on offshore MMC station for wind farm. J. Eng. 2017, 2017, 1264–1268. [Google Scholar] [CrossRef]
  19. Wang, X.; Yang, R.; Shi, Z.; Cai, X.; Shi, X.; Chen, Y. Coordinated low voltage ride-through of MMC-HVDC transmission system and wind farm with distributed braking resistors. IEEE Access 2022, 10, 87860–87869. [Google Scholar] [CrossRef]
  20. Goksu, O.; Teodorescu, R.; Bak, C.L.; Iov, F.; Kjaer, P.C. Instability of wind turbine converters during current injection to low voltage grid faults and PLL frequency based stability solution. IEEE Trans. Power Syst. 2014, 29, 1683–1691. [Google Scholar] [CrossRef]
  21. Zhang, X.; Wu, Z.; Hu, M.; Li, X.; Lv, G. Coordinated control strategies of VSC-HVDC-based wind power systems for low voltage ride through. Energies 2015, 8, 7224–7242. [Google Scholar] [CrossRef]
  22. Zhou, H.; Yao, W.; Zhou, M.; Ai, X.; Wen, J.; Cheng, S. Active energy control for enhancing AC fault ride-through capability of MMC-HVDC connected with offshore wind farms. IEEE Trans. Power Syst. 2023, 38, 2705–2718. [Google Scholar] [CrossRef]
  23. Li, W.; Zhu, M.; Chao, P.; Liang, X.; Xu, D. Enhanced FRT and postfault recovery control for MMC-HVDC connected offshore wind farms. IEEE Trans. Power Syst. 2020, 35, 1606–1617. [Google Scholar] [CrossRef]
  24. Serban, E.; Ordonez, M.; Pondiche, C. Voltage and frequency grid support strategies beyond standards. IEEE Trans. Power Electron. 2017, 32, 298–309. [Google Scholar] [CrossRef]
  25. Charalambous, A.; Hadjidemetriou, L.; Kyriakides, E.; Polycarpou, M.M. A coordinated voltage–frequency support scheme for storage systems connected to distribution grids. IEEE Trans. Power Electron. 2021, 36, 8464–8475. [Google Scholar] [CrossRef]
  26. Wu, J.; Wang, Z.; Liu, R.; Shan, Y.; Wang, C. Decentralized primary frequency regulation for hybrid multi-terminal direct current power systems considering multi-source enhancement. J. Mod. Power Syst. Clean Energy, 2023; accepted. [Google Scholar]
  27. Lou, G.; Yang, Q.; Gu, W.; Zhang, J. An improved control strategy of virtual synchronous generator under symmetrical grid voltage sag. Int. J. Electr. Power Energy Syst. 2020, 121, 106093. [Google Scholar] [CrossRef]
  28. De Brabandere, K.; Bolsens, B.; Van den Keybus, J.; Woyte, A.; Driesen, J.; Belmans, R. A voltage and frequency droop control method for parallel inverters. IEEE Trans. Power Electron. 2007, 22, 1107–1115. [Google Scholar] [CrossRef]
  29. Li, Y.; Zhang, Z.; Yang, Y.; Li, Y.; Chen, H.; Xu, Z. Coordinated control of wind farm and VSC–HVDC system using capacitor energy and kinetic energy to improve inertia level of power systems. Int. J. Electr. Power Energy Syst. 2014, 59, 79–92. [Google Scholar] [CrossRef]
  30. Li, L.; Zhu, D.; Zou, X.; Hu, J.; Kang, Y.; Guerrero, J.M. Review of frequency regulation requirements for wind power plants in international grid codes. Renew. Sustain. Energy Rev. 2023, 187, 113731–113747. [Google Scholar] [CrossRef]
Figure 1. The diagram of the studied three-terminal VSC-HVDC system.
Electronics 13 00741 g001
Figure 2. The diagram of the overall control strategy.
Electronics 13 00741 g002
Figure 3. The effects of fBA and Vt,BA on the active and reactive current limitations. (a) The effect of fBA and Vt,BA on active current limitation; (b) the effect of fBA and Vt,BA on reactive current limitation.
Electronics 13 00741 g003
Figure 4. The coordination chart of the equipment under the proposed control strategy during the LVRT and recovery processes.
Electronics 13 00741 g004
Figure 5. The diagrams of the system Vt-Id characteristics. (a) when the grid voltage drop E changes; (b) when the grid impedance amplitude Zg changes; (c) when the grid impedance angle θg changes; (d) when the proportional coefficient kq changes; (e) when the proportional coefficient kd changes.
Electronics 13 00741 g005
Figure 6. The simulation results for deep voltage drop in receiving-end system AC1. (a) The frequency in system AC1; (b) the terminal voltage in system AC1; (c) the active power output of the BESS converter; (d) the reactive power output of the BESS converter; (e) the active power output of the receiving-end converter; (f) the reactive power output of the receiving-end converter; (g) the DC voltage of the DC transmission line; (h) the current in DC chopper.
Electronics 13 00741 g006aElectronics 13 00741 g006b
Figure 7. The simulation results for light voltage drop in receiving-end system AC1. (a) The frequency in system AC1; (b) the terminal voltage in system AC1; (c) the active power output of the BESS converter; (d) the reactive power output of the BESS converter; (e) the active power output of the receiving-end converter; (f) the reactive power output of the receiving-end converter; (g) the DC voltage of the DC transmission line; (h) the active power output of the sending-end system AC2 and WF.
Electronics 13 00741 g007
Figure 8. The diagram of the modified sending-end system AC2 with SGs, load nodes, and a BESS.
Electronics 13 00741 g008
Figure 9. The simulation results for deep voltage drop in sending-end system AC2. (a) The frequency in system AC2; (b) the terminal voltage in system AC2; (c) the active power output of the BESS converter; (d) the reactive power output of the BESS converter; (e) the active power output of the sending-end converter; (f) the reactive power output of the sending-end converter; (g) the DC voltage of the DC transmission line; (h) the active power output of the receiving-end converter and WF.
Electronics 13 00741 g009aElectronics 13 00741 g009b
Table 1. A comparison of the control rules under the CCS and PCS.
EquipmentCCSPCS
Control RulesActivationControl RulesActivation
BAVSCIq,BA injection as a priorityVt,BA < Vt,LVIq,BA injection as a priority and Id,BA absorptionVt,BA < Vt,LV
Id,BA injection as a priorityVt,BA > Vt,rcvadaptive current limitation controlVt,BA > Vt,rcv
REVSCIq,RE injection as a priorityVt,RE < Vt,LVIq,RE injection as a priorityVt,RE < Vt,LV
Id,RE injection as a priorityVt,RE > Vt,rcvId,RE injection as a priorityVt,RE > Vt,rcv
SEVSCVdc-PSE droop controlVdc,SE > Vdc,LVVdc-PSE droop controlVdc,SE ≠ 0
WFVSCdecrease WF voltage to 0.2 p.u.Vdc,WF > Vdc,LVVdc-fWF droop controlVdc,WF > 0
WFLVRT and reduce power outputVt,WF < Vt,LVfWF-PWF droop controlfWF > fWF0
DC ChopperactivatedVdc,RE > Vdc,LVactivatedVdc,RE > Vdc,LV
blockVdc,RE < Vdc,rcvblockVdc,RE < Vdc,rcv
Disclaimer/Publisher’s Note: The statements, opinions and data contained in all publications are solely those of the individual author(s) and contributor(s) and not of MDPI and/or the editor(s). MDPI and/or the editor(s) disclaim responsibility for any injury to people or property resulting from any ideas, methods, instructions or products referred to in the content.

