Abstract
Aiming at the fact that the moving target defense game model fails to accurately portray attack and defense gains, resulting in bias in attack and defense games and the inability to select effective defense strategies, we construct the moving target three-way evolutionary game defense model (MTTEGDM). Firstly, the model is defined and analyzed theoretically under the premise of uncertainty and irrationality. Then, combined with the three-way decisions, the attack intention is introduced into the target network loss calculation, and a dynamic weight adjustment algorithm based on the three-way decisions is proposed to accurately characterize the attack and defense gains from a multi-attribute perspective. Finally, the evolutionary game model is used to analyze the evolution trend of the multi-stage defense strategy, so as to carry out feasible and effective defense behavior. The simulation results show that the model can accurately predict the optimal defense strategy of moving targets in different stages. Through a Monte Carlo simulation experiment, the proposed algorithm is compared with the traditional evolutionary game model, and the effectiveness and security of the proposed algorithm are verified.
1. Introduction
With the continuous update of attack technology, firewalls, and malicious code intrusion detection based on traditional passive defense technology, in the face of new attacks and unknown vulnerabilities, computer systems, networks and data are often in the “easy to attack, difficult to defend” passive situation. To protect computer systems, networks, and data from potential threats and attacks, a series of technologies and strategies for active defense technology came into being. These mainly include Moving Target Defense, Behavioral Analysis-based Defense, Real-time Threat Intelligence, Intelligent Automated Response, Zero-Trust Security Model, etc. Among these, Moving Target Defense addresses the static nature of network deployment by irregularly changing the attack surface over time in a dynamic manner. This results in an unpredictable attack surface state for the attacker, increasing the complexity and cost of network attacks, reducing the vulnerability exposure of the network system, and lowering the probability of successful attacks. As a result, it improves defense capability [1].
Defense strategy selection is a key issue in Moving Target Defense, and researchers use various optimization algorithms, such as genetic algorithms [2], particle swarm optimization [3], and simulated annealing [4], to find the best defense strategy. However, these methods still have some limitations. The main manifestations are (1) lack of modeling capability of the adversarial environment: this makes it difficult to accurately describe and capture the adversarial relationship and adversarial behaviors between the defender and the attacker in moving target defense [5]; (2) difficulty in adequately considering the problem of incomplete information faced by the defender: this makes it impossible to accurately understand the attacker’s intentions and capabilities, resulting in a lack of precision in the selection of defense strategies [6]; (3) failure to adequately consider the mutual influence of the attack and defense confrontation: choosing a defense strategy may lack the ability to predict and respond to the attacker’s behavior [7]; and (4) inability to flexibly respond to changes in the dynamic environment: the strategy often lacks a mechanism to adjust and update in response to dynamic environmental changes [8].
In order to solve the above problems, domestic and foreign scholars have utilized game theory [9] to carry out research on related techniques, such as [10,11,12]. The application of game theory and the combination of Moving Target Defense (MTD) have proven to be effective in the field of network security [13]. However, they did not fully consider the impact of the attacker’s intention to attack with a different emphasis on the defender’s decision process. They also failed to accurately portray the gains from both attack and defense, resulting in a bias in the defense within the game. Consequently, in situations where information is insufficient and inaccurate, the defender may face challenges in effectively selecting defense strategies.
Three-way decisions [14] is a generalization of two-way decisions, which is the introduction of a third situation in two extreme cases. When the available information is not sufficient to support making a clear choice of acceptance or rejection, the third situation can be selected to delay the decision and used to deal with complex and uncertain problems. Three-way decisions has been widely used in various fields with great success [15,16,17]. For example, Shah et al. [18] proposed an integrated face recognition mechanism based on three-way decisions for human–computer interaction to improve the accuracy of the authorization and recognition processes. This increases the value of the face recognition system by introducing a three-way decisions recognition method to enhance the accuracy of the system and reduce the number of false rejections. Wang et al. [19] addresses the inability to comprehensively and accurately characterize diverse data in disease-risk assessments. It proposes a multi-granularity, three-way decisions method based on a multi-mixed-attribute information system. This approach aims to improve the accuracy of hypertension-risk assessments, allowing for early intervention and prevention of chronic diseases and reducing disease incidence. Siminski et al. [20] applied three-way decisions to a cascade of neuro-fuzzy classifiers and proposed a three-way decisions neuro-fuzzy classification system. This system was introduced to achieve a lower generalization error compared to the two-way classifier. HU et al. [21] addresses the problem of decision evolution in time series by proposing the idea of a three-way game. This approach utilizes game-theoretic methods to adjust the thresholds and , adapt the decision information system to changes in the time series and enhancing its prediction accuracy. Zhang et al. [22] explored a game involving the uncertainty of the boundary domain and the misclassification rate of the decision region in a sequential three-way decisions model. It proposed an optimization model to find the adaptive decision thresholds for each granular layer, aiming to minimize the misclassification rate in the decision model.
Three-way decisions has the characteristic of being suitable for dealing with uncertainty and ambiguity. This characteristic is similar to the essence of strategy selection in network attack and defense games. Therefore, the three-way decisions is introduced into the attack and defense gain quantification to construct the three-way evolution dynamic adjustment algorithm. This algorithm calculates the loss of security attributes of cyber-attacks and quantifies the attack and defense gains from a multi-attribute perspective.
Based on the above analysis, it is proposed to adopt the dynamic game method mainly based on the signal evolution game, integrate the idea of three-way decisions, construct the moving target three-way evolutionary game defense model, break through the limitation of the participant’s completely rational network attack and defense scenarios, establish quantitative assessment criteria for network attack and defense benefits from the perspective of multiple attributes, and adopt the weighted method for calculating the network attack and defense benefits, enhancing the universality of the benefit calculation method.
The main contributions of this paper are as follows:
- (1)
- Constructing the MTTEGDM with the signal game as the premise, releasing the error information in priority to induce the attacker to make the wrong judgment, breaking through the assumption of the defender’s complete rationality, and calculating the future discounted return by using the Markov decision process, so as to make the attack and defense game model closer to the real situation.
- (2)
- Constructing an evolutionary dynamic adjustment method based on three-way decisions, introducing the attack intention into the attack and defense quantification from the perspective of network security attributes, customizing the loss function based on the information evolution, and giving full consideration to the degree of harm associated with the attack strategy.
- (3)
- Constructing an MTD-based attack success probability calculation method that limits the maximum number of resources being reconfigured while considering the impact of the reconfiguration rate under resource constraints more accurately describes the success of an attack under the conditions of Moving Target Defense.
- (4)
- The MTD optimal defense policy selection algorithm is designed to provide decision support for network active defense. The effectiveness of the proposed model and method is verified through simulation experiments. Furthermore, the algorithm’s suitability for the actual situation is enhanced due to its consideration of the dynamics of attack and defense games and the quantification of gains from a multi-attribute perspective.
2. Related Work
2.1. Three-Way Decisions
Three-way decisions, proposed by the Canadian scholar Prof. Yao Y.Y in line with human cognition [14], are a kind of decision theory. The theory has been widely used in machine learning, face recognition, disease risk assessment, intrusion detection, and other fields. Three-way decisions are one of the core ideas of decision rough set theory, which extends the traditional two-way decision semantics of positive and negative domains to three-way decision semantics of positive, boundary, and negative domains. It decides with the smallest risk among them as the optimal decision, providing an effective strategy and method for solving complex problems.
Let the state space be , which denotes that an event belongs to and does not belong to X, and the action set , which contains three kinds of decision actions, denoting that the three kinds of decision actions are accepted, delayed, and rejected, respectively. Considering that taking different actions will bring about different degrees of loss, denote to represent the loss under the taking of action when , and denote to indicate the loss under the taking of action when . The loss matrix for different actions is shown in Table 1.

Table 1.
Loss matrix corresponding to different actions taken in different states.
Then, the expected loss under action can be expressed s, respectively, as follows:
According to the Bayesian decision criterion, the decision rule for minimizing the expected loss can be obtained as follows:
- (1)
- ;
- (2)
- ;
- (3)
- .
among,
2.2. Evolutionary Game
Evolutionary Game Theory was first proposed by mathematician John von Neumann and economist Oskar Morgenstern in the 1940s. They first systematically introduced the basic concepts and principles of game theory in their co-authored classic book ‘The Theory of Games and Economic Behavior’. The theoretical framework of evolutionary games was outlined in this seminal work. This marked the initial exploration of evolutionary game theory.
Evolutionary Game Theory is a mathematical model and theoretical framework. Its core idea is to link individual decision behavior and utility in game theory with genetic mechanisms and fitness in evolutionary biology. The theory studies the interactions and competition between multiple individuals (or individuals representing different strategies) in a population, and how these individuals adjust and propagate their strategies as they evolve.
In an evolutionary game, an individual’s strategy is transmitted through a genetic or hereditary mechanism, while an individual’s fitness represents the degree of success in adapting to survive and reproduce in its environment. Individuals’ strategies can be cooperative, competitive, or other different behavioral patterns. The study of evolutionary games focuses on the transmission and evolution of individuals or strategies in populations under different strategies and interactions.
The analytical methods of evolutionary games include equilibrium concepts in game theory, such as Nash equilibrium and Evolutionarily Stable Strategy (ESS). These concepts are used to study which strategies will be stable in the population during the evolutionary process. It also includes mathematical models such as replicator dynamics and simulation methods for modeling and predicting the evolution of strategies.
Evolutionary Game Theory has a wide range of applications, including biology, social sciences, economics, and other fields. It has been used to study a variety of phenomena such as animal behavior, social norms, and economic markets, and has provided insight into the evolution and stability of behavioral patterns such as collaboration, competition, cooperation, and conflict. For example, Xue et al. [23] applies Evolutionary Game Theory to satellite switching and proposes a multi-attribute quantum satellite switching strategy based on Evolutionary Game Theory, which has stability and fairness, and can effectively equalize the satellite load. Su and Ji [24] apply Evolutionary Game Theory to medical data sharing, consider random factor perturbation, and construct a tri-partite evolutionary game system containing medical institutions, technical support enterprises, and the government, in order to promote the cooperation of multiple subjects in medical data sharing and improve the level of open governance of healthcare data. MA et al. [25] analyze the error generation mechanism in attack and defense games, quantitatively define the observation error in network defense, and propose an improved evolutionary game model, which strengthens the model’s tolerance to information deviation.
To summarize, Evolutionary Game is a mathematical model that integrates game theory and evolutionary biology to study the evolution and stability of strategies in populations. It combines individual decision and fitness with genetic mechanisms to analyze the propagation and evolution of different strategies in populations. It has a wide range of application areas and research value.
2.3. Moving Target Defense
Moving Target Defense (MTD) is a concept and research direction proposed by the Defense Advanced Research Projects Agency (DARPA) of the U.S. DARPA launched a program in 2011 called ‘Cyber Moving Target Defense’ (Moving Target Cyber Defense). The program aims to develop new defense strategies and technologies to enhance the security and resilience of cyber systems.
Moving Target Defense (MTD) is a network security strategy. It is designed to enhance the security of network systems and make them more difficult to attack and penetrate. The strategy increases the complexity and difficulty of attackers’ attacks. This is achieved by changing the network environment, system configuration, and defenses to protect system resources and sensitive information [1]. The core concept of Moving Target Defense is to continually change the target, attributes, location, structure, or behavior of a network system. This transforms it into a moving target, making it difficult for attackers to accurately identify and exploit system vulnerabilities. In contrast to traditional static defenses, moving target defense employs dynamic, changing, and unpredictable strategies to increase the uncertainty of attacks.
Moving target defense is widely used in various fields, and related technologies are constantly updated. For example, S et al. [5] address the negative impact on network performance when MTD defends against scanning attacks. They use an MTD Adaptive Delay System (MADS) to provide feasible MTD-based protection against scanning attacks without affecting the network service parameters. Bo et al. [26], in order to stop False Data Injection (FDI) attacks, use Hidden Moving Target Defense (HMTD), which hides the system from the attacker by changing the reactance of the transmission line. To evaluate HMTD concealment, they propose a new Randomly Enabled HMTD (RHMTD) operation. RHMTD utilizes random weights to introduce randomness and uses derived concealment operating conditions as constraints to achieve concealment of three alarm attacker models. Sun [27] uses MTD to defend against low-rate denial-of-service attacks. They propose an adaptive moving target defense method, which increases the difficulty and cost of LDoS attacks from the perspective of polymorphism, dynamics, and randomness of MTD techniques, respectively. This method reduces the high cost of MTD deployment to achieve a balance between performance and cost.
Moving target defense can improve the security of network systems and increase the complexity and cost of attacks by attackers. However, it can also introduce additional complexity and management difficulties. Addressing these challenges requires a combination of practical considerations and risk management.
In conclusion, moving target defense is a network security strategy. It increases the difficulty and uncertainty for attackers by constantly changing the network environment and system configuration. This approach transforms the network system into a moving target, aiming to improve the system’s security and its ability to withstand attacks.
3. Moving Target Three-Way Evolutionary Game Defense Model
3.1. Three-Way Evolutionary Game Defense Model Construction
- (1)
- General Framework
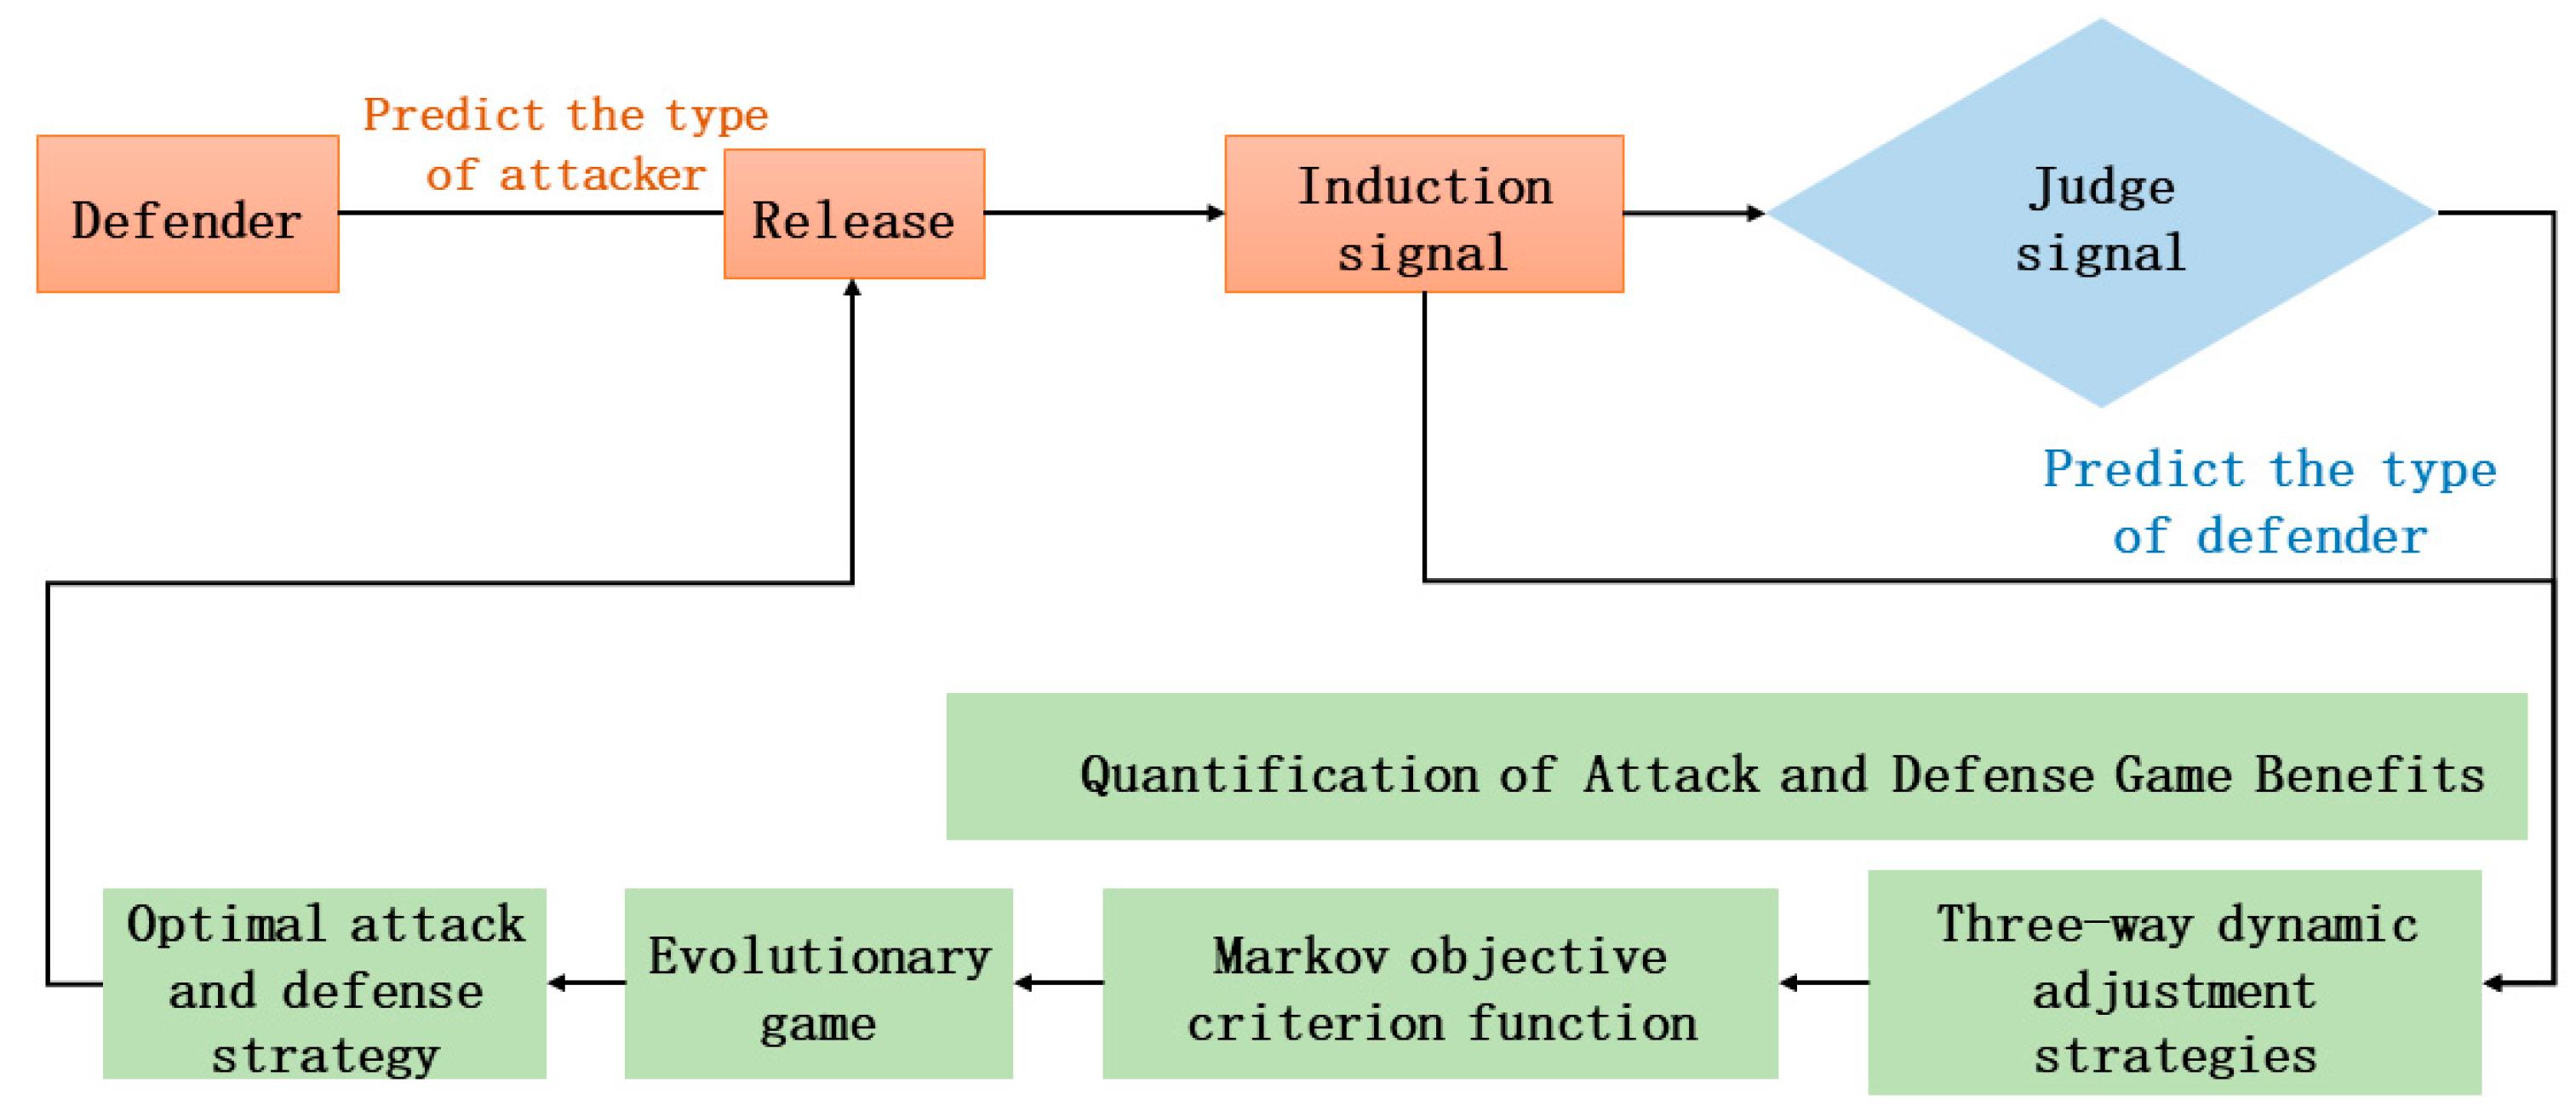
On the basis of the information evolution game model, we fuse three-way decisions, quantify the attack and defense gains from the perspective of multi-attribute, customize the loss function, dynamically adjust the threshold, and accurately portray the damage of the attack on the network security attributes. We combine the characteristics of the MTD defense strategy, taking into account the impact of resource limitation and reconfiguration rate on the probability of the defense’s success, as well as the misidentification risk for both attack and defense parties. Additionally, we add the third-party reward and punishment mechanism factors [28]. This ensures that the attack and defense gains align more with the actual situation and can be effectively applied to the selection of optimal defense strategies. The overall framework of the constructed three-way evolutionary attack and defense game defense model is shown in Figure 1.
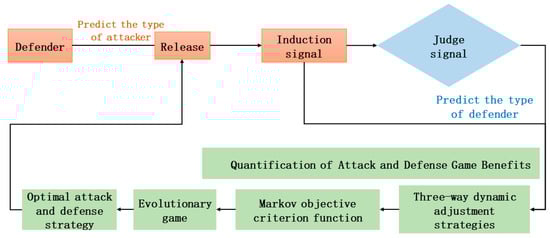
Figure 1.
General framework of the offense–defense game.
At the initial stage of attack and defense, the defender sends induced signals in priority, according to the a priori knowledge of the attacker’s type [29]. This causes the attacker to obtain erroneous information in the detection stage. This leads to an erroneous judgment of the defender’s real type, through which the defender is able to interfere with the attacker’s judgment process and increase its advantage in the attack and defense confrontation. Secondly, considering the attacker’s intention to attack, the three-way dynamic adjustment strategy is used for the weighted calculation of network security attributes. Finally, the Markov decision process is introduced to consider the multi-stage future expected returns, to find the evolutionary stable equilibrium [30], and to select the optimal attack and defense strategies.
The game can end in two cases: the defensive strategy adopted by the defender can withstand all the attacking strategies, and the attacker has achieved the goal of the attack.
Combining the MTD attack and defense confrontation characteristics, the game model has the following features:
- (1)
- Using the defender as a signal sender and inducing the attacker to get the wrong information makes the defense gain maximized.
- (2)
- Quantifying offensive and defensive gains from a multi-attribute perspective makes offensive and defensive interactions more relevant.
- (3)
- Adopting the idea of evolutionary game theory, we conduct repetitive games between the attacking and defending sides, construct replicated dynamic equations, solve for the evolutionarily stable equilibrium, and challenge the assumption of complete rationality in traditional games.
- (4)
- A Markov decision process is used to transform future returns into real returns, constructing a multi-stage discounted objective criterion function to find the optimal defense strategy.
- (2)
- Model Definition
In this paper, a signal evolution game is used. According to the a priori knowledge of the attack type, the defender takes the initiative to release the best-induced signal to confuse the attacker, which, in turn, increases the uncertainty of the defense type and improves the defense performance. This, in turn, achieves the purpose of active defense. Second, the three-way dynamic weight adjustment strategy is used to calculate the loss of security attributes of network attacks and quantify the attack and defense gains from a multi-attribute perspective. Finally, the repeated game between the two sides of the game through the learning and evolution mechanism breaks through the limited rationality constraints of the traditional game and researches the evolution law of the security state of the network system and the corresponding defense decision method.
Definition 1.
Moving target three-way evolutionary game defense model (MTTEGDM, Moving target three-way evolutionary game defense model) can be represented as an eleven-tuple with each parameter defined as follows:
- (1)
- is the space of gamers, where is the attacker, and is the defender.
- (2)
- is the set of types of game participants. The shorter time attackers can spend to seize control of the resources on the attacked surface means the stronger the attacking capability. Where is the overall set of attackers’ types, and , , and are the total number of defender’s types.
- (3)
- is the total number of stages of the multi-stage game, , .
- (4)
- is the set of attack and defense strategies of the game participants, denoting the complete set of courses of action chosen by the attackers and defenders. For the defender, denotes the set of optional defense strategies at stage , and denotes the set of optional attack strategies at stage .
- (5)
- is the defender’s signal space, i.e., the induction factor, and the signal name corresponds to the defender’s type. The defender can autonomously choose the induction signal to be sent to achieve the effect of camouflage. In order to defend against attacks, the defender releases induction signals when the IDS detects abnormal behavior or abnormal traffic to interfere with the attacker’s choice of attack strategy.
- (6)
- is the set of a priori beliefs of the participants in the game, indicating the likelihood that a participant will guess that the other participants are of a certain type when choosing their side’s type.
- (7)
- is the posterior probability that after t attack confrontations, the attacker observes the defender’s defense strategy information, resulting in a change in the attacker’s beliefs about the defender, forming the attacker’s posterior probability regarding the defender, denoted as .
- (8)
- is the signal attenuation factor, which indicates the degree of attenuation of the false signal in different game stages, , then the posterior probability of the attacker against the defender type: . represents the number of game stages.When , that is, in the first stage of the attack and defense game, the signal did not decay. At this time, the false defense signal deterrence, deception, and inducement play the largest role. With the advancement of the game process, the signal attenuation and the degree of attenuation increase, deterrence, deception, and inducement of the role of decline. When , at this time, the influence of the false defense signal on the attack and defense game disappears.
- (9)
- is the set of initial security states of the network system.
- (10)
- is the set of security states of the network system. The states in and correspond to the game phases, and the evolutionary game culminates in state during game stage with an initial state .
- (11)
- denotes the security state transfer probability, and denotes the probability that the system jumps from state to state .
- (12)
- is the discount factor, which indicates the proportion of returns in game stage that is discounted compared to the initial stage, .
- (13)
- is the set of payoff functions, and and represent the payoff functions of the defender and the attacker in the game stage.
3.2. Quantification of Attack and Defense Game Benefits
By establishing a three-way decision attack intention identification model, based on the threat level of the attack, the three-way decisions method is used to construct a defense strategy game model based on the dynamic adjustment of the strategy of the weights. The quantification of the gains of the attacking and defending sides is the most critical part of the decision algorithm. The closer the quantization method is to the real attack and defense scenarios, the more instructive it is to the defense decision. However, there is no unified standardization of attack and defense gain quantification in the academic world. In this paper, from the perspective of network security attributes of both attacking and defending sides of moving targets, combined with the characteristics of moving target attack and defense strategies, we analyze and quantify the gains of moving target attack and defense strategies comprehensively. Reference [31] This paper quantifies the following.
3.2.1. Attack Benefit (AB)
Attack gains reflect the benefits that the attacker can get by implementing the attack behavior. A successful attack aims to obtain control of system resources, enabling the attacker to use the attack surface and system resources to achieve direct gains. In case of an attack failure, the attacker fails to obtain control of system resources. Although the attack process can yield relevant information about the defense, it also leaves traces in the defense system. The defense system will base its focus on defense on the history of attack data regarding vulnerabilities. If the attacker then takes action to exploit these vulnerabilities, it becomes difficult to succeed in the attack.
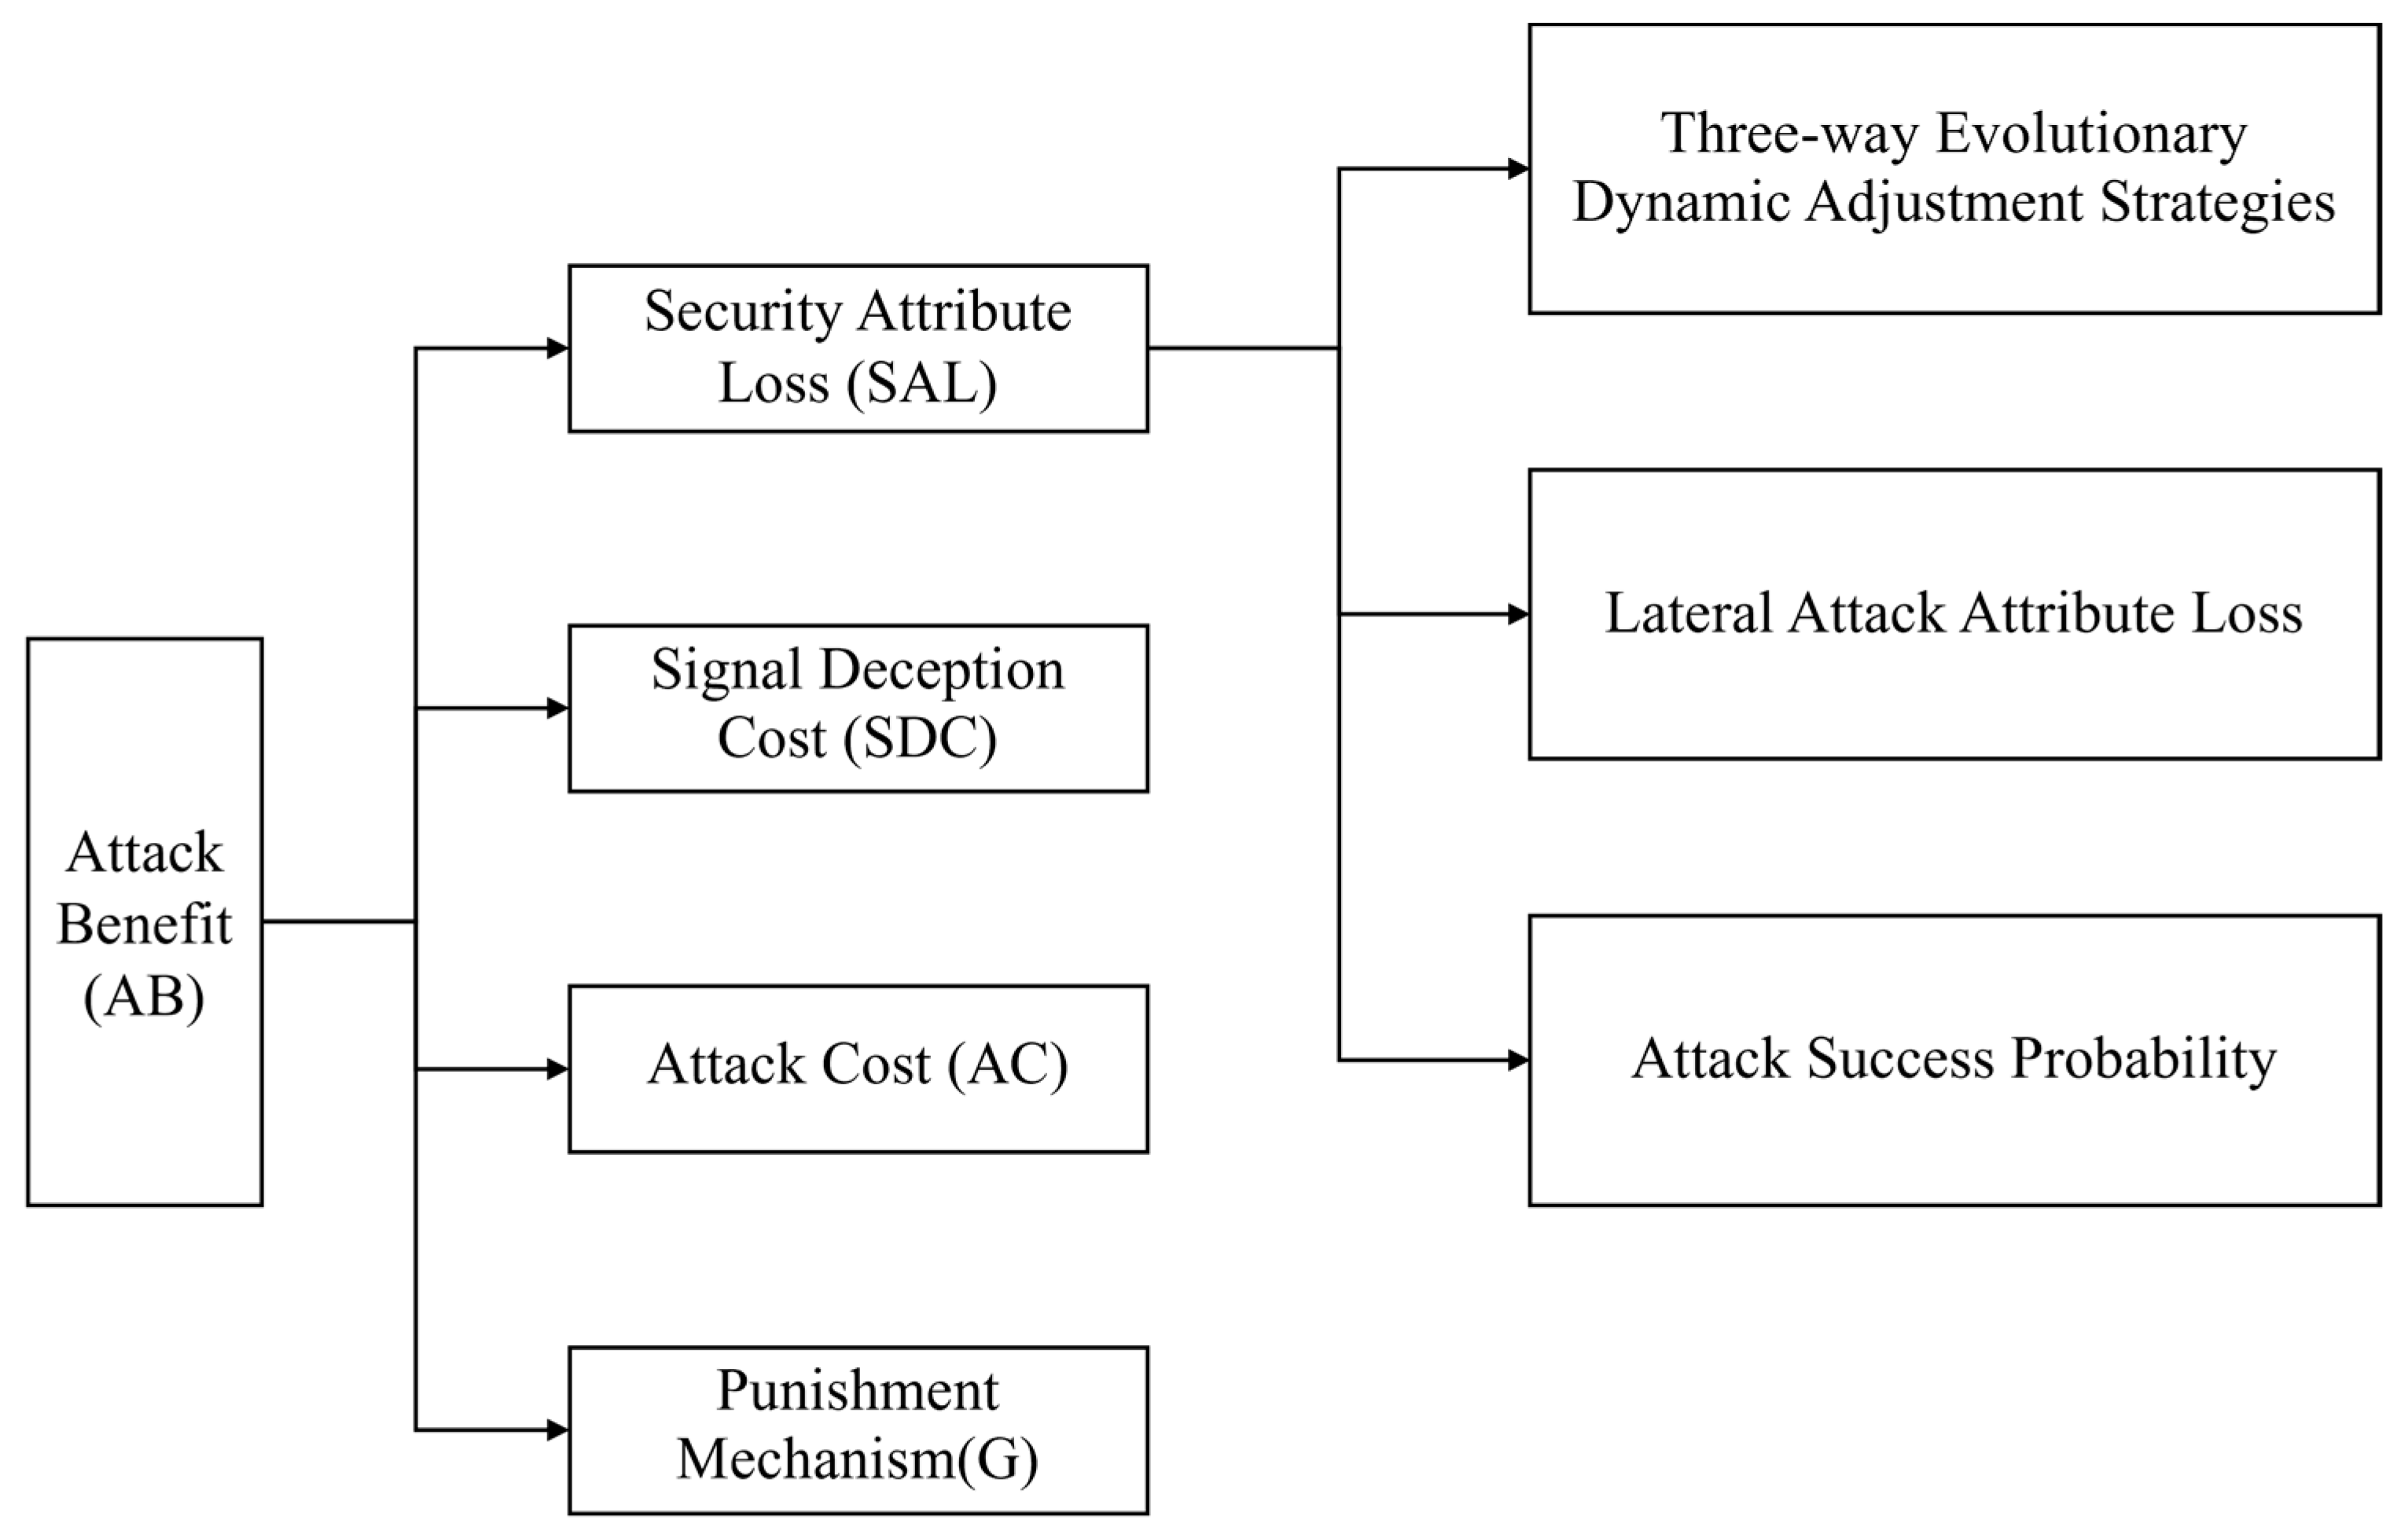
Consequently, the attacker’s party only gains the benefit of the attack if the attack succeeds. The attack benefit consists of four parts and the structure is shown in Figure 2.

Figure 2.
Structure of attack benefits.
- (1)
- Security Attribute Loss (SAL)
- (1)
- Three-way Evolutionary Dynamic Adjustment Strategies
Different attackers have different intentions for attacking the target network. For example, certain countries may use cyberattacks to gain access to military, political, or economic intelligence of other countries, thereby causing damage to the confidentiality of the target network. On the other hand, an attacker may try to disrupt a competitor’s business process through a cyberattack to gain a market advantage, thereby causing damage to the integrity of the target network. In addition, DDoS attacks are a common tactic in which a large amount of malicious traffic is sent to a target network that exceeds its processing capacity, thereby paralyzing network services and causing damage to the availability of the network target. Each of these different attacks has a devastating impact on affecting critical aspects of the target network. The impacts are also different depending on the intention of the attack, so we cannot generalize and must discuss them separately. The attacker’s impact on the target network is manifested through the impact on the value of the network system.
The value of a network system can be represented by the security attributes of a network device, denoted by , where , , and are the value of the device in terms of confidentiality, integrity, and availability, respectively. In different application scenarios, the importance of security attributes is different, and the value is also different.
The attack impact degree reflects the impact of the attack action on the value of the network system and is denoted by , where , , and are the weights of the impact brought by the attack action on the security attributes, such as confidentiality, integrity, and availability of the network devices, respectively.
In network attack and defense, the weights of three factors affecting network security vary in different attack and defense contexts. By analyzing the weights of different influencing factors under various attacks, let denote three distinct cases of confidentiality, integrity, and availability sorted by weight size. These factors are fictionalized as the first attribute, the second attribute, and the third attribute according to the security attribute importance in different contexts. The values of security attributes represent the sorting of the attributes’ importance, i.e., the positive domain , the negative domain , and the bounded domain in the three-way decisions domains. The rule is shown in Equation:
Implementing different weighting strategies produces different losses, noting that , , and denote the loss function values corresponding to implementing the three weighting strategies , , and , respectively, when we face an attack; and , , and denote the loss function values corresponding to implementing the three weighting strategies , , and , respectively, when we have no attack.
Unlike the classical rough set model, all three regions of the decision rough set are uncertain. Therefore, we define the loss function based on the information evolution.
Information evolution takes place only between neighboring levels. In the state with the attack: is the evolution rate from the boundary domain to the positive domain, reflecting the cost of executing the boundary domain policy. The cost coefficient when executing the positive domain policy is 0, while the cost coefficient when executing the negative domain policy is 1. In the state without attack: is the evolution rate from the boundary domain to the negative domain, reflecting the cost of executing the boundary domain policy. The cost coefficient when executing the positive domain policy is 1, and the cost coefficient when executing the negative domain policy is 0. The correspondence between weights and loss values is shown in Table 2.
Table 2.
Correspondence of loss values for the three-way decisions.
At this point, assuming that the attacker chooses as the attack strategy, the expected value of the damage to the security attributes caused by the attack action can be quantified by Equation (1):
where is a security attribute of a network device, , is the weight of the impact of the attack action on the security attribute of the network device, and is the value of the network device in terms of security attributes.
The loss of cybersecurity attributes is shown in Equation (5) as follows:
- (2)
- Lateral Attack Attribute Loss
Web host security includes the presence of direct and indirect attacks on the host from an attacker. The introduction of lateral attacks can increase the overall benefit to the attacker. Lateral attacks enable attackers to quickly extend the scope of an attack after successfully penetrating a system, increasing the depth and breadth of the attack, thereby maximizing the benefits of the attack. By circumventing detection and defense mechanisms, the attacker reduces the risk of detection and increases the likelihood of the success of the attack, thus increasing the actual benefit of the attack. In addition, the introduction of horizontal attacks provides attackers with the opportunity to gradually gain access to more privileges and sensitive information, which provides favorable conditions for future attacks and enhances the strategic and long-term benefits of the attacks. This highlights the need to comprehensively consider the threat of lateral attacks in network defense and take effective protective measures to slow down the activities of attackers inside the network and reduce the actual gains and potential impact of attacks.
For example, assuming that there is a vulnerability in a company’s internal network, an attacker can quickly spread through the company’s internal network through a lateral attack by successfully obtaining employee login credentials. Utilizing the progressively gained privileges, the attacker successfully accesses the finance department’s system and eventually gains control over sensitive financial information. This example highlights the significant impact of horizontal attacks. Therefore, we cannot ignore the impact of lateral attacks on revenue.
For horizontal attacks launched by other hosts, when the attacker launches horizontal attacks on the host i, there is an infection coefficient that affects the cost and benefit of the attack. The infection coefficient is related to the number of infection times from horizontal attacks.
Let represent the set of infection coefficient , where represents the infection coefficient when a horizontal attack carries out times of infection. indicates whether host is off or on at time , with indicating off and indicating on. is the network connectivity state matrix. or 1 indicates whether the host and cannot communicate with each other or can communicate with each other, specifying . Let , when , host and can transmit information to each other at the time , enabling the propagation of the malicious attack behavior of the attacker, i.e., horizontal attack behavior.
represents the coefficient of infection when horizontal attacks carry out infections. When the horizontal attack carries out one round of infection, that is, the attacker carries out the horizontal attack in the sequence of hosts , and the infection coefficient is as follows:
When the horizontal attack carries out two rounds of infection, that is, the attacker carries out the horizontal attack in the sequence of hosts , and the infection coefficient is as follows:
When the horizontal attack carries out three rounds of infection, that is, the attacker carries out the horizontal attack in the sequence of hosts , and the infection coefficient is as follows:
Thus, the infection coefficient of horizontal attack infection, times, can be deduced in turn.
Where, is the infectious attenuation factor, indicating that the benefits and costs of horizontal attacks will be weakened to a certain extent compared with direct attacks. The attenuation factor of infection increases exponentially, and when there are four infections, . Since the convergence error is set to in the experiment, the infection frequency of four or more times has little impact on the benefit/cost of network attack and defense, so only the cases where the infection frequency of horizontal attacks is one, two, and three times are considered.
- (3)
- Attack Success Probability ()
The probability of a successful attack reflects the probability of the attacker successfully breaking through the defense of the defender. The probability of attack success is mainly affected by the probability of attack detection and the probability of defense success . And the success probability of MTD defense is mainly affected by three aspects, resource limitation, reconfiguration rate, and attack capability of the attack strategy.
Based on the characteristics of MTD, the implementation of the defense strategy requires the reconfiguration of resources to improve the effectiveness and probability of the success of the attack, thereby enhancing the availability and performance of the game model. As the time required for system reconfiguration increases, the attacker has more time to collect information, resulting in a higher probability of a successful attack.
It is first necessary to determine the impact of the reconfiguration rate on resource availability, service request response time, and attacker success probability. Ensuring that a minimum number of resources is always available to process service requests, we consider limiting the maximum number of resources being reconfigured (a parameter set by the system administrator to control the trade-off between performance and availability). If number of resources is being reconfigured, other reconfiguration requests may be dropped or queued.
In the case of resource constraint , the resource reallocation rate will be constrained. The larger is, the larger the reconfiguration rate a becomes, and the smaller is, the smaller the reconfiguration rate becomes. Therefore, the attacker’s probability of success is a function of the average reallocation rate .
In addition, the defense success probability is related to the attack strength of the attacker’s selected attack strategy . The attack strength directly affects the defense performance, and the greater the attack strength, the lower the defense success probability.
Defense success probability :
where denotes the maximum number of resources, denotes the reconfiguration rate, and denotes the attack capability of attack strategy .
That is, the attack success rate is: .
In summary, the loss of cybersecurity attributes is quantified:
Assume that the attacker picks strategy , and the defender of type picks defense strategy , the probability of the attack’s success is .
The gain can only be obtained if the attacker succeeds in their attack. The expected value of the damage to the security attribute caused by attack action can be quantified by Equation (1):
where is a security attribute of a network device, , is the weight of the impact of the attack action on the security attribute of the network device, and is the value of the network device in terms of security attributes.
The loss of cybersecurity attributes is shown in Equation (11) as follows:
where is the resource importance level, which refers to the importance of the attacker’s target resource during a complete attack.
- (2)
- Signal Deception Cost (SDC)
After observing the m1 signal sent by the defender, the attacker considers the probability of defender type to be . Similarly, the attacker’s probability of the defender type is different after observing different signals. Therefore, the attack strategies adopted are different.
The release of induced signals causes the attacker to misjudge the type of defender, and therefore adopt an attack strategy based on induced signals, resulting in compromised attack gains.
where denotes the attack loss function, and the loss incurred when the attack strategy is and the defense strategy is is represented by the attack loss matrix , denoted as follows:
RAP1 is the relative attack benefit: denotes the difference between the defense cost and the attack cost when defender does not send the induction signal. RAP2 is the relative attack benefit: denotes the difference between the defense cost and the attack cost after defender sends the induction signal.
- (3)
- Attack Cost (AC)
The cost paid by the attacker for discovering and exploiting the system resources on the attack surface includes six indicators to evaluate and analyze the attack’s cost. These indicators are the time needed to discover and invade the system resources, hardware and software resources, professional knowledge, risk cost, ease of detection, and the cost of analyzing the induced signals.
- (4)
- Punishment Mechanism (G)
In the field of cybersecurity, traditional attack and defense games constitute only a part of the cybersecurity situation, whereas in reality, cybersecurity involves a much wider range of participants. The presence of third-party entities or factors has a direct or indirect impact on the cybersecurity situation. The introduction of a penalty mechanism by a third-party regulator has a profound impact on the decision-making of moving target defense.
First, regulators integrate moving target defense into the broader legal compliance framework by imposing modest penalties on attacking parties. This encourages cyber defenders to take proactive initiatives to ensure that their moving target defenses are compliant with regulations and standards, thereby reducing the legal risk of a breach.
Second, the effect of penalty mechanisms to drive attackers to improve cybersecurity standards is equally significant in moving target defense. Attackers choose their targets more carefully because they may face more severe consequences, prompting defenders to focus more on effectiveness and compliance in moving target selection and implementation.
Third, the deterrent effect of regulators positively affects moving target defense decisions. While attackers are less motivated, defenders are more motivated to enhance prevention and detection mechanisms in moving target defense strategies, aiming to improve the overall security level of the network.
The task of maintaining public interest is also reflected in moving target defense. By imposing moderate penalties on attackers, regulators help ensure the effectiveness of mobile target defense, thereby maintaining the public security of the entire network ecosystem.
Finally, the impetus of the penalty mechanism helps facilitate information sharing, including with regulators and other entities. Knowing the potential consequences of a breach, defenders are more willing to share critical information about moving target defenses in order to collectively improve the security of the entire cyber ecosystem. Overall, regulators’ penalty mechanisms play a crucial role in guiding and facilitating moving target defense decisions in the cyber-attack-defense game, contributing positively to a more secure, compliant, and stable cyber environment.
Denote the penalty imposed by the regulator on the attacker as G. Let the regulatory strike factor be β. When the defender implements a defensive strategy, the probability that the attacker’s attack succeeds is θ. The penalty imposed by the regulator on the attacker for carrying out the attack is .
In summary, during phase , when the attacker and the defender use strategies to play an attack and defense game against , the attacker’s gain from attacking in the attack and defense game is as follows:
3.2.2. Defense Benefit (DB)
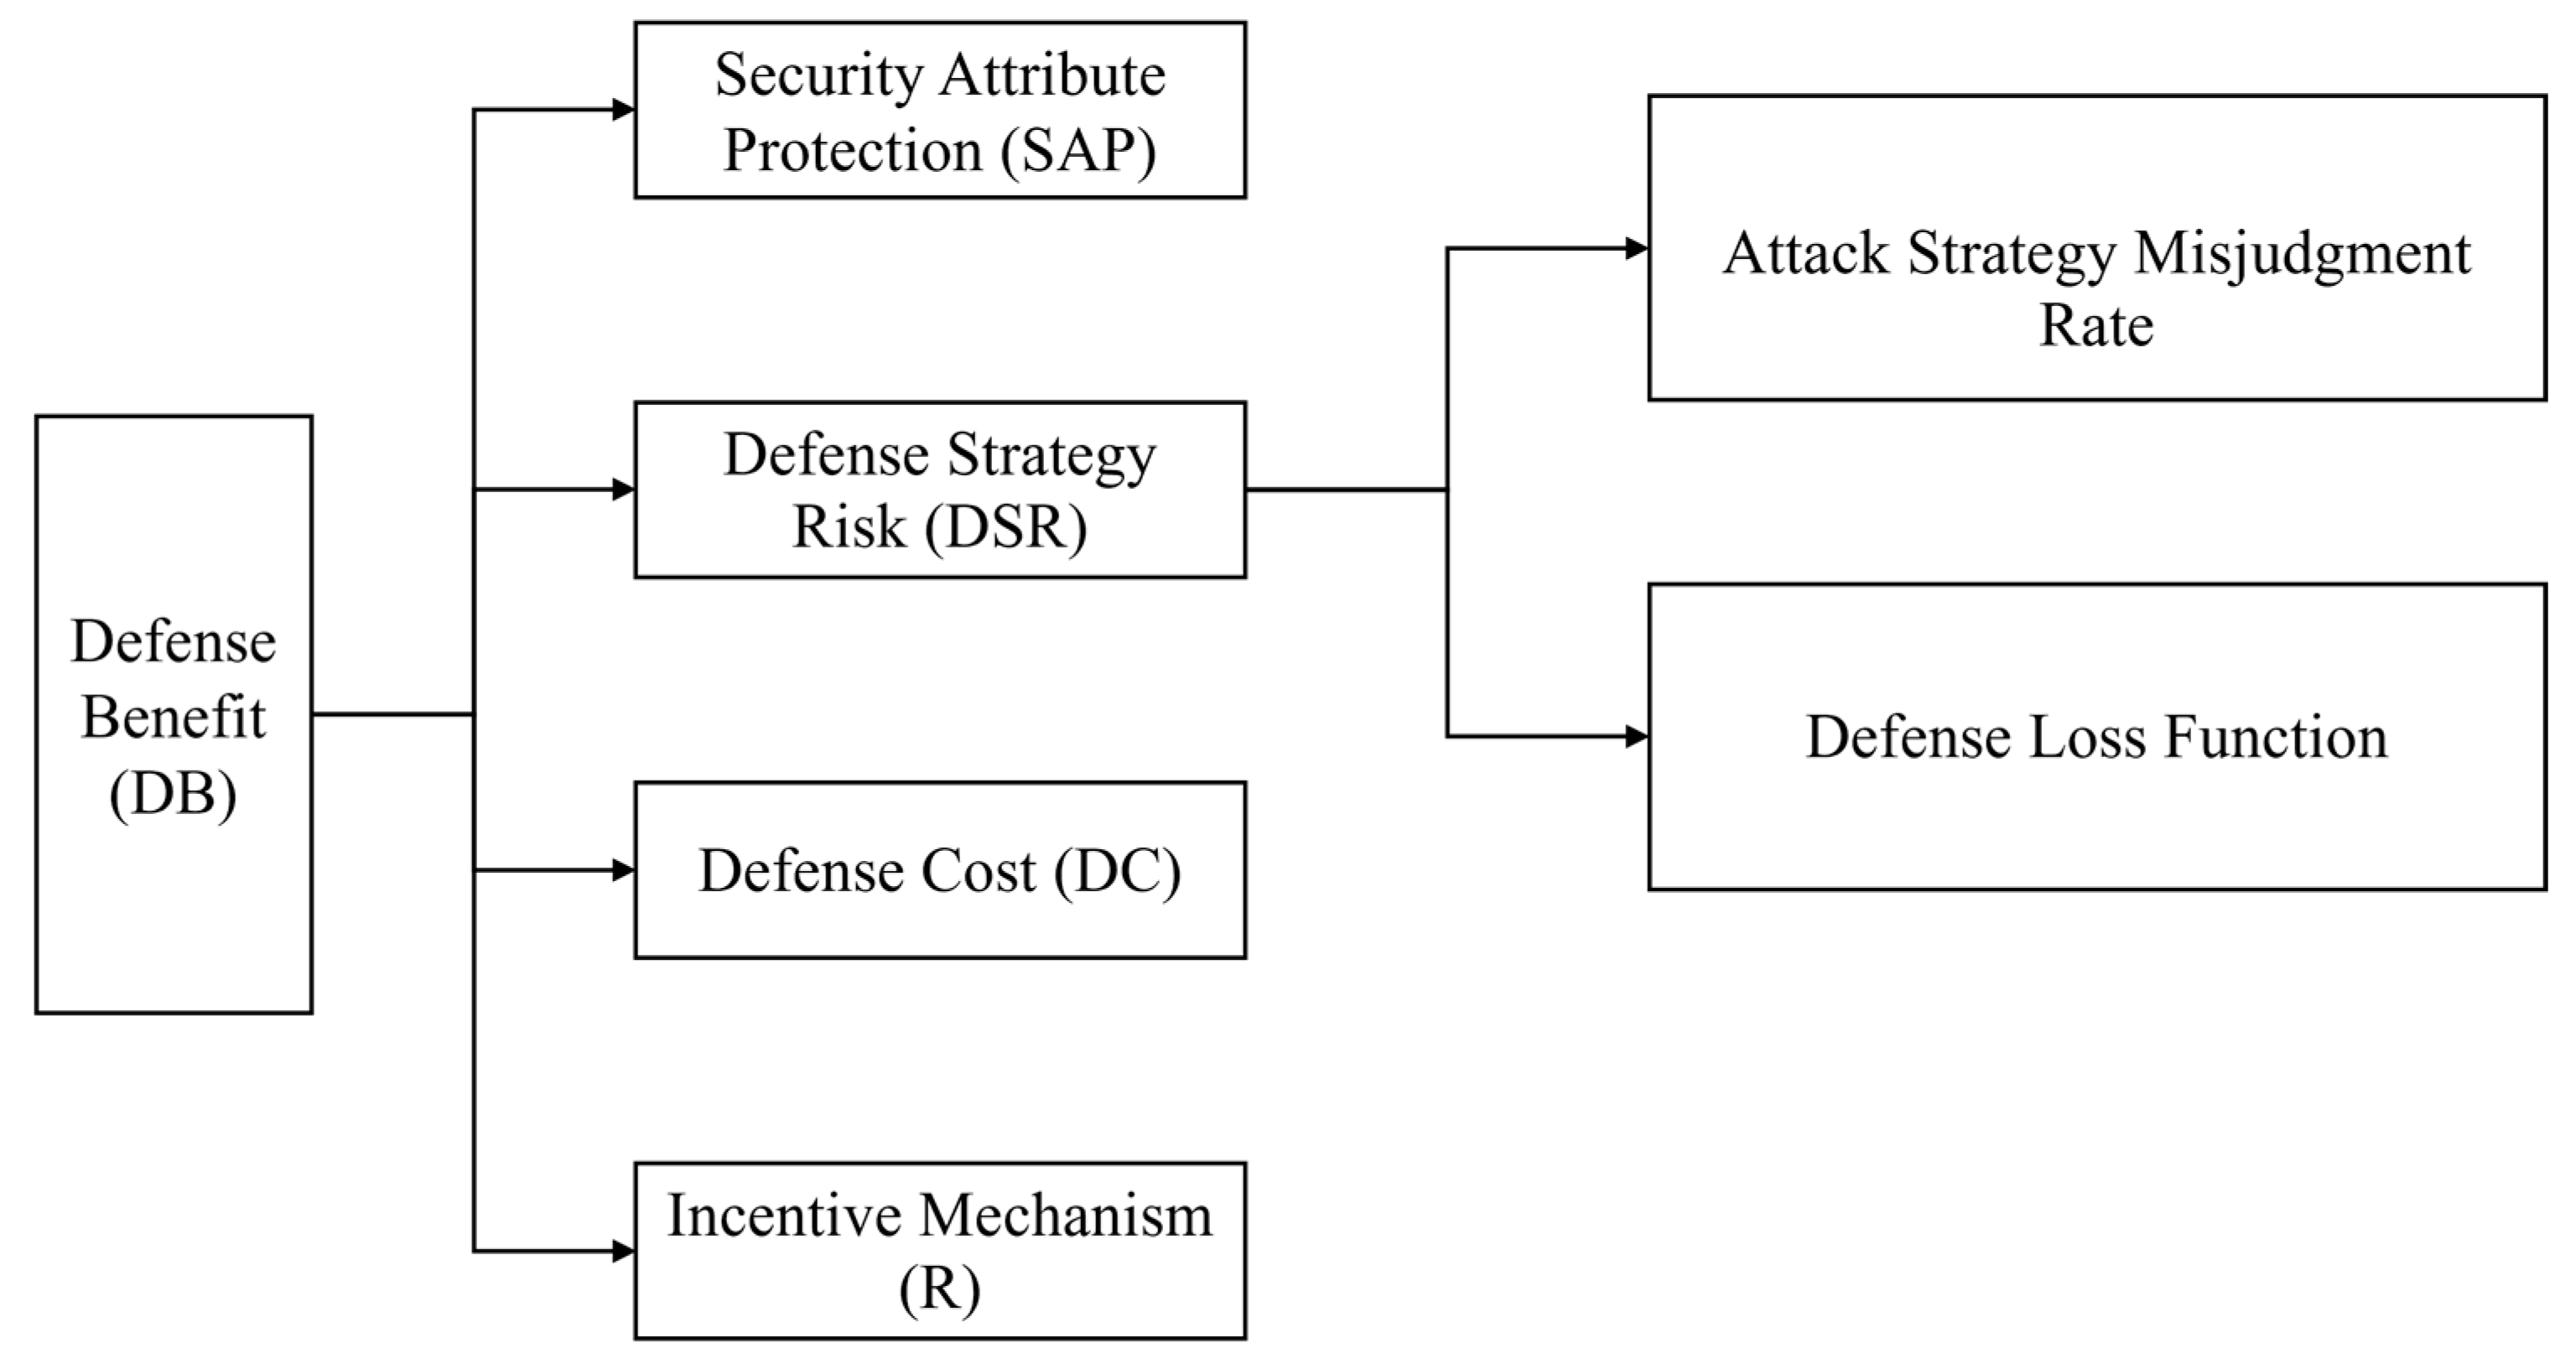
Defensive gain reflects the value of the network system that the defender can protect by performing defensive actions, i.e., the gain from diverting system resources from the attacking side. Regardless of the success or failure, the defender can gain. Specific performance: When the defense is successful, the defender can successfully defend against the attack, protect the value of the network system, and obtain the direct defense gain. When the defense fails, the defender cannot protect the value of the network system, but in the process of defense, can obtain the attacker’s relevant information to improve the probability of success of the next defense, and thus can obtain the indirect defense gain. The defense benefit consists of four parts and the structure is shown in Figure 3.
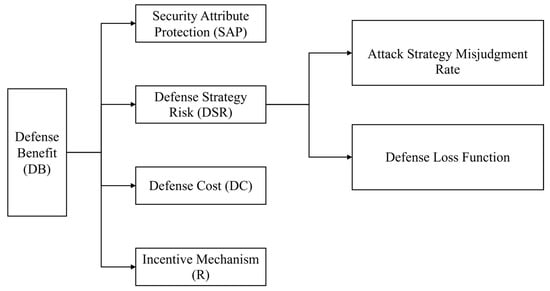
Figure 3.
Structure of defense benefits.
- (1)
- Security Attribute Protection (SAP)
When the defense succeeds or fails, the defender receives different benefits.
When the defense succeeds, the benefit expectation of the defensive behavior in terms of security attributes is quantified as follows:
When the defense fails, the benefit expectation of the defensive behavior in terms of security attributes is quantified as follows:
where is the discount factor for returns when the defense fails.
The loss of cybersecurity attributes is shown in Equation (14) as follows:
- (2)
- Defense Strategy Risk (DSR)
The risk to the system occurs when the defender misjudges the attack strategy and adopts a defensive strategy.
- (1)
- Attack Strategy Misjudgment Rate
Since the IDS may incur misdiagnosis and misdetection when detecting an attack strategy, PMR is the set of probabilities that aj is misdiagnosed as aw, denoted as , w = j when it means that no misdetection occurs. Therefore, the misjudgment probability matrix E(P) can be obtained.
- (2)
- Defense Loss Function
The loss incurred when the attack strategy ax and the defense strategy dy are adopted is represented by the defense loss matrix E(d), denoted as follows:
When attack strategy ax is determined, is subsequently determined. When a misdetection occurs, the defender mistakes ax for a−x, at which point the defender chooses defense strategy instead of . Where is denoted as the defense loss function, as shown in Equation (17).
where RDG is the Relative Defense Gain: denotes the difference between the attack cost and the defense cost after the defender sends the induction signal.
When the real attack ax is misjudged as aw, the risk-reward associated with adopting defense strategy dy is:
- (3)
- Defense Cost (DC)
It mainly consists of four components: Attack Surface Shifting Cost (ASSC), Negative Impact Cost (NC), Attack Identification Cost (AIC), and Signal Camouflage Cost (SCC). ASSC refers to the overhead of changing system resources when the attack surface is transferred, and the size of this cost is related to the pre-altered system attack surface dimension (including system vulnerability utilization cost). NC refers to the loss brought by changing system resources when the attack surface is transferred, which results in the system not being able to work normally or the quality of service is degraded, and resource availability is reduced. The size of this cost is related to the reconfiguration rate a of the defense strategy, the shorter the period, the larger the NC. AIC refers to the cost of detecting and identifying different types of attackers; the higher the level of competence, the more difficult it is for attackers to be detected and identified, and the higher their cost. SCC refers to the cost of constructing the induced signal.
- (4)
- Incentive Mechanism (R)
In the field of cybersecurity, traditional attack and defense games constitute only part of the cybersecurity situation, whereas in reality, cybersecurity involves a much wider range of participants. The existence of third-party entities or factors has a direct or indirect impact on the cybersecurity situation. The introduction of third-party reward mechanisms is mainly aimed at improving the overall effectiveness of cybersecurity.
In the context of moving target defense, the reward mechanism has a far-reaching impact by motivating the defender to take proactive measures. First, the reward mechanism encourages the defender to take effective protective measures, increase the investment and implementation of security measures, and improve the overall security level of the network. Second, in order to obtain rewards, defenders are willing to share threat intelligence and vulnerability information appropriately without harming their own interests, which promotes information sharing and contributes to a comprehensive understanding of the response to emerging threats. In addition, the reward mechanism promotes cooperation and joint defense, enhancing the resilience of the entire ecosystem. Cooperation and joint defense allow for a collaborative response to complex cyberattacks, making network participants more collectively resilient to threats and thus strengthening the security of the entire network. By increasing the cost of attacks, the reward mechanism makes it more difficult for attackers to successfully execute attacks, reducing the frequency and impact of attacks. Taken together, the introduction of a reward mechanism under moving target defense not only improves the overall effectiveness of network security, but also stimulates the defender to take proactive measures, share information, and strengthen the cooperative posture, thus providing an effective means to establish a more secure, collaborative, and stable network environment.
Denote the incentive pay off by . Let (where denotes the amount of information made public, and denotes the degree of social benefit). Therefore, when the defender implements a defensive strategy, let the amount of information disclosed by the defender at this time be ; then .
In summary, during phase , when the attackers and defenders use strategies to play the attack and defense game against , the defender’s defensive gain in the attack and defense game is as follows:
3.3. Evolutionary Equilibrium Solution
In this paper, the MTD attack and defense confrontation are divided into a multi-stage Markov process, and the objective criterion function is designed to calculate the total gain from the initial to the end of the attack and defense phase. Due to the existence of a series of noise effects, such as signal attenuation in the process of network attack and defense confrontation, and since the attack and defense gain is related to time, the discount factor is introduced. The discount factor discounts future gains or losses to the current value to reflect the time value for the decision. This introduction enhances the model’s integration of long-term impacts and strategies when formulating objective criterion functions based on Markov processes. The discount factor allows the model to focus more on the long-term impact of future security threats and countermeasures on the security of the system, while simultaneously motivating the system to adopt more robust and durable security measures. By making trade-offs between the present and the future, the discount factor helps to synthesize immediate returns and long-term gains, avoiding a focus solely on immediate benefits while neglecting the impact of long-term strategies. This approach enhances not only the consideration of long-term strategies but also improves the model’s adaptability to uncertainty and risk. It contributes to more comprehensive and sustainable cybersecurity decision-making.
Different discount factor values can significantly impact decision modeling results. Higher discount factors emphasize gains or losses in the current period. This emphasis may result in biased models that overlook long-term strategies and focus solely on short-term effects. Conversely, a lower discount factor prioritizes long-term effects, enhancing the model’s accuracy for future security threats and countermeasures. Additionally, discount factor values reflect an organization’s risk tolerance, influencing investment in security measures and resource allocation. Choosing the appropriate discount factor value is a critical decision. It requires carefully balancing potential impacts to ensure that the model aligns with the strategic goals of the organization.
The method from the related Jiang et al. [32] is used, which adopts the discount expectation criterion function to measure the different strategies. The gain, i.e.,
Introducing replicated dynamic equations to solve multi-stage game equilibria:
- (1)
- The defender releases an induced signal, and the attacker picks the optimal attack strategy.
The attack gain and attack expected gain when the defender in stage adopts a rank defense strategy and sends a -induced signal:
- (2)
- The attacker chooses the optimal attack strategy by analyzing the incoming signals.
The defense gain and defense expected gain of the defender in stage are as follows:
Constructing equations for replication dynamics:
- (3)
- Solve the -stage equilibrium strategy of the evolutionary game :
- (4)
- According to the above sought equilibrium solution and Bayes’ law, the a posteriori probability of the defender’s judgment is solved. The modified posteriori probability is then substituted into the next stage of the attack and defense confrontation to accelerate the convergence speed of the evolutionary game.
3.4. Algorithm Design and Analysis
3.4.1. Algorithm for Selecting Defense Strategies for Three-Way Evolutionary Games
Based on the above research, an algorithm for the selection of defense strategies for the three-way evolutionary game for moving targets is given, as shown in Algorithm 1.
| Algorithm 1: Algorithm for Selecting Defense Strategies for Moving Target Three-way Evolutionary Games |
| Input MTTEGDM Output Optimal Defense Strategy BEGIN
|
Initialize the MTTEGDM parameters, enter the for-loop, and calculate the attack and defense gains for different pairs of attack and defense strategies at each game stage. Firstly, three-way evolutionary dynamic strategies are used to calculate the network security loss of the Defender. Secondly, the respective risk benefits of attack and defense, as well as the third party’s reward and punishment benefits, are calculated, respectively. Finally, the Markov Decision Process is used to calculate the future discounted return criterion function. Construct replicated dynamic equations. The joint equations are used to solve the equilibrium solution of the evolutionary game, and the optimal defense strategies are the output based on the principle of maximizing the defense benefits. Adjust the a priori probability of the type of the defender and use the a posteriori probability of the previous stage as the probability input value of the next stage.
3.4.2. Algorithm Analysis and Comparison
The time complexity of the MTTEGDM algorithm is mainly concentrated in Step 7. Step 7 mainly involves stages of attack and defense game benefit quantification. The time complexity of this process is . Steps 7.4, 7.5, and 7.6 solve the attack and defense evolutionary equilibrium, including defense strategies and attack strategies, respectively. At this time, the time complexity of the whole MTTEGDM algorithm is . The space consumption of the MTTEGDM algorithm is mainly concentrated on the storage of intermediate results, and the gain value accounts for the largest proportion, which contains storage units with the number of induction signals and attack and defense strategies. Therefore, its space complexity is . According to the MTTEGDM algorithm, not only can the corresponding return value of each strategy be obtained, but also the change of strategy selection state over time can be acquired by replicating the dynamic equations. This enables the analysis and prediction of the stable equilibrium of network evolution.
The method given in this paper is compared with other literature, and the results are shown in Table 3.
Table 3.
Comparison of algorithms.
Through comparative analysis, it can be seen that the Moving Target Three-Way Evolutionary Game Defense Model (MTTEGDM) proposed in this paper can meet the limited rational constraints of decision makers and can analyze multi-stage and multi-state attack and defense processes. Defenders, as signal senders, transform the passive position of defenders into initiative. They calculate the loss of network security attributes based on the weight dynamic adjustment strategy of the three-way decision and describe the attack and defense benefits more accurately. They use the Markov discount objective criterion function to comprehensively consider the multi-stage attack and defense income and select the optimal defense strategy through repeated games, which has better theoretical value and practicability than the methods in other literature presented in Table 3.
4. Simulation Experiment and Analysis
4.1. Description of Simulation Experiment Environment
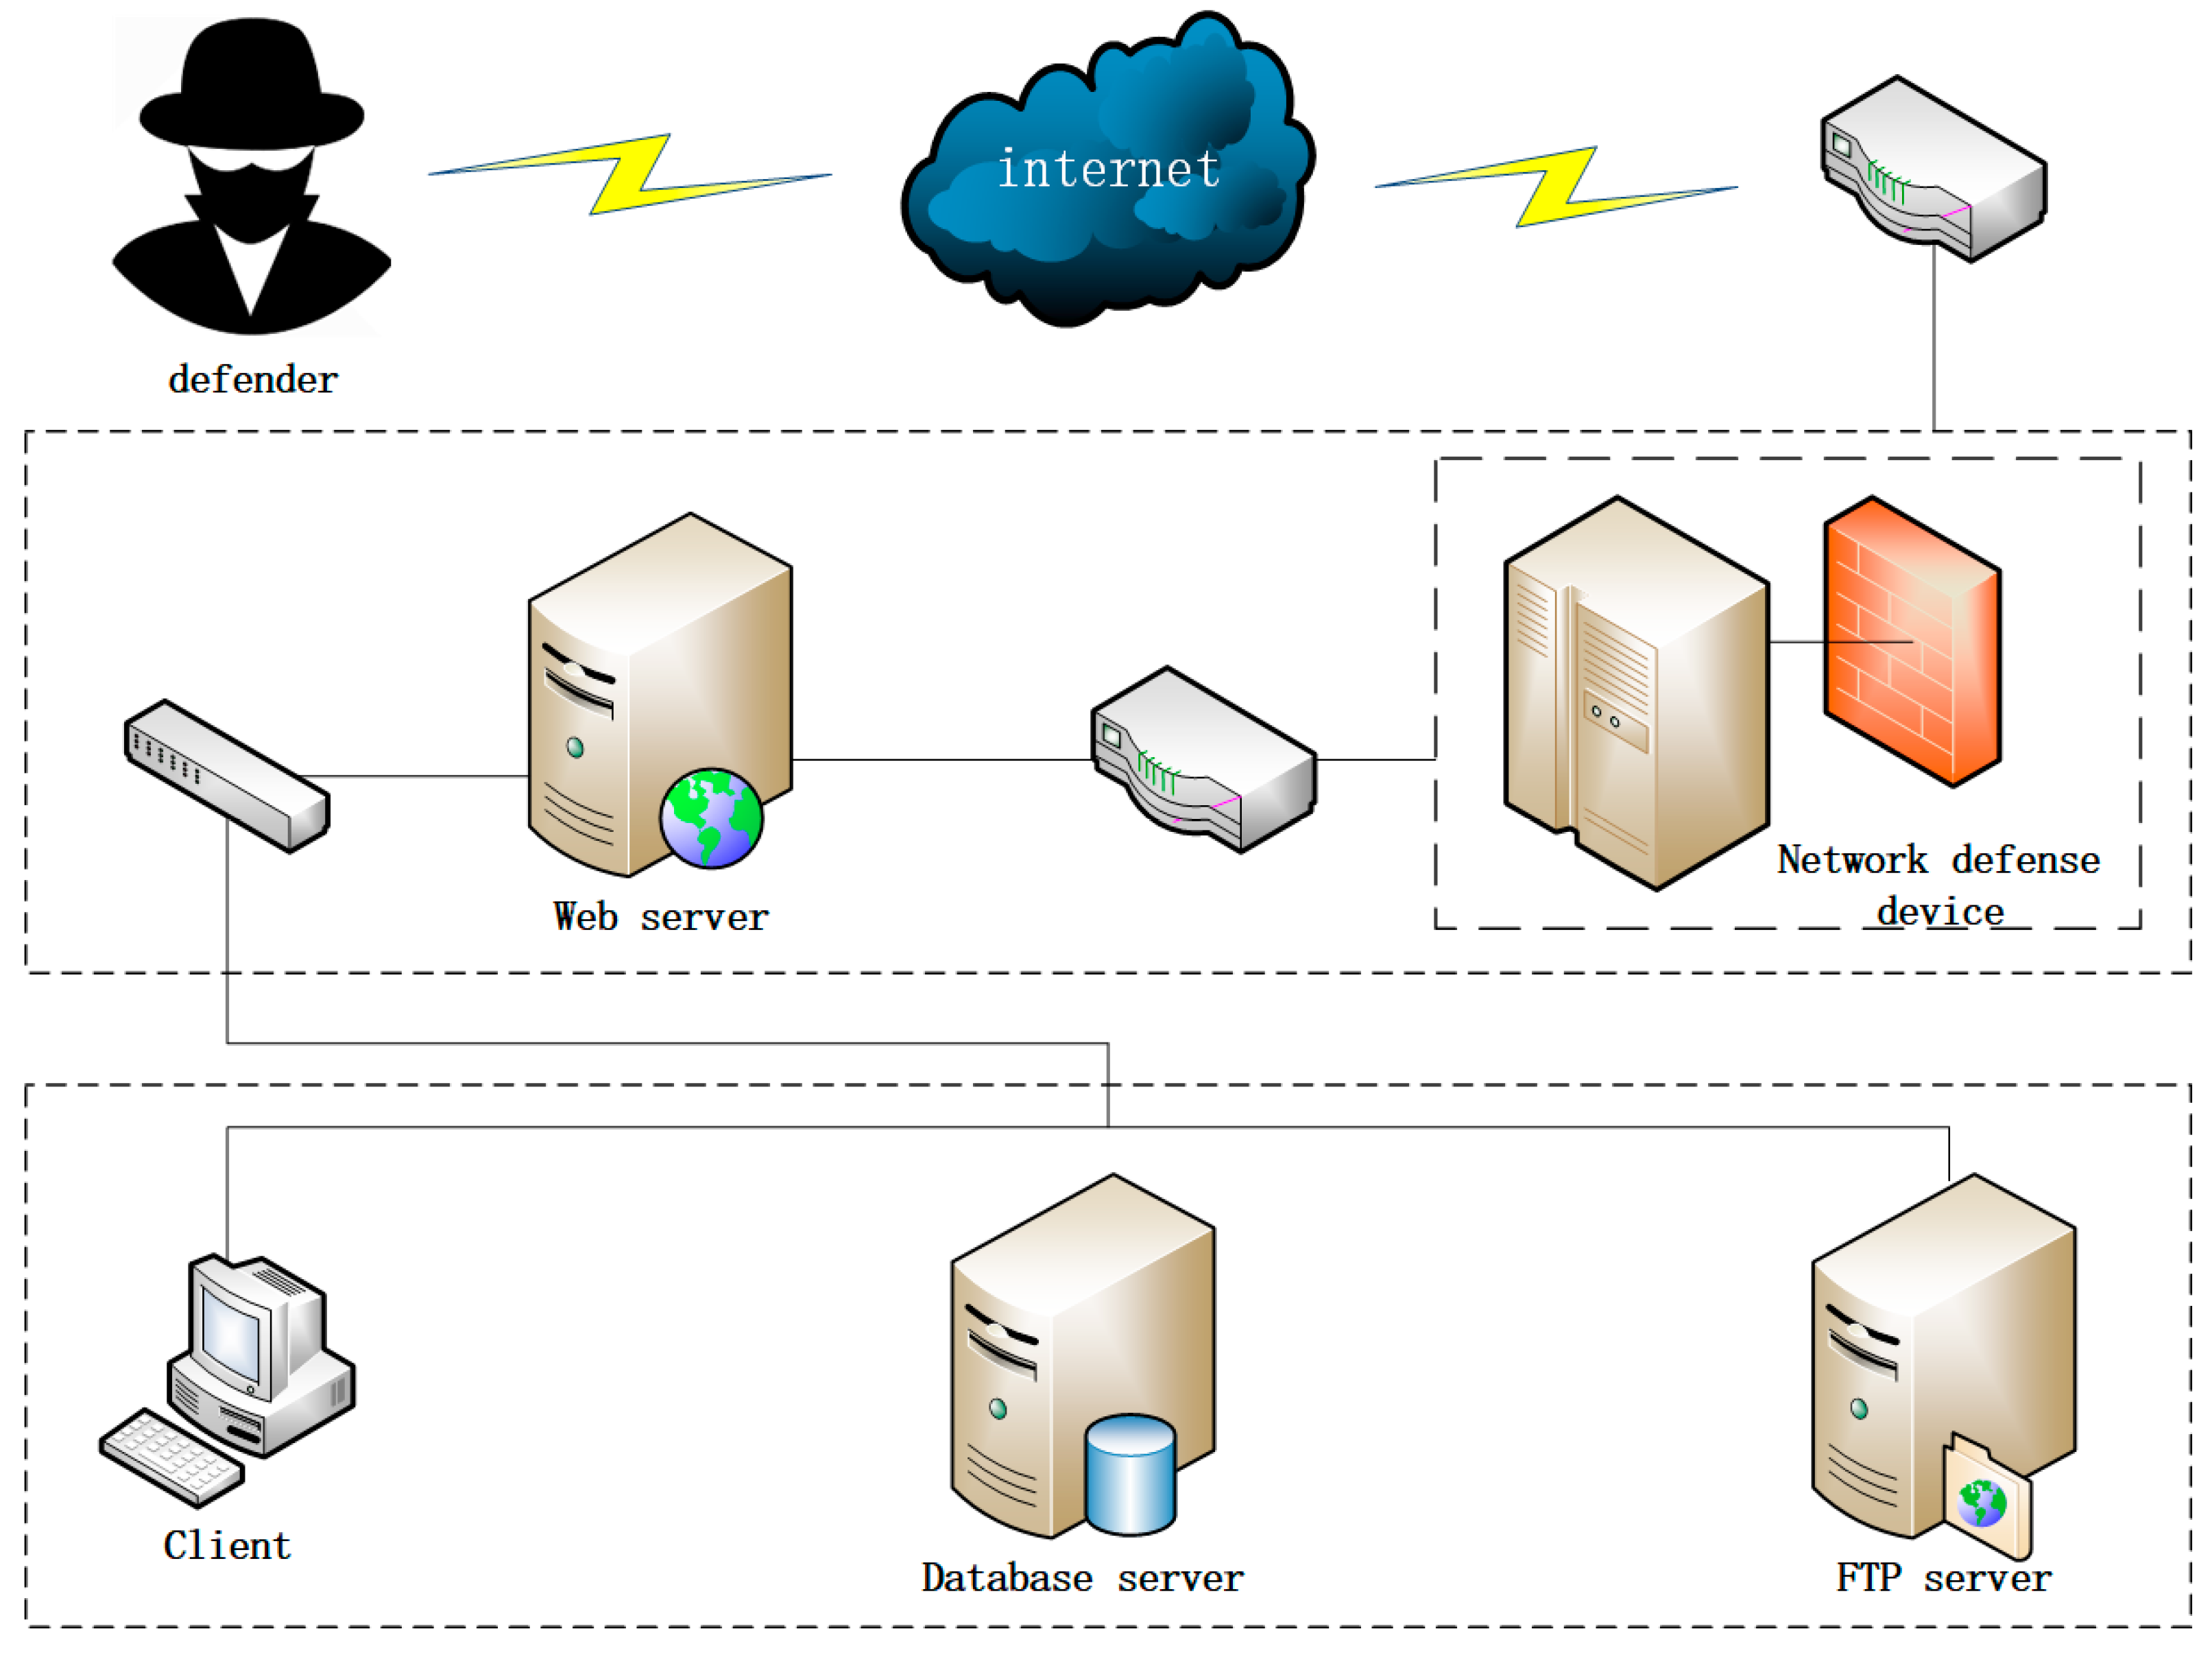
In order to verify the feasibility and effectiveness of the MTTEGDM model and algorithm, a simulation system consisting of a network defense device, a web server, a client, an FTP server, and a DB server is constructed and experimented with, as shown in Figure 4. The access control policy of this network restricts users outside the system to access the web server only, and the web server, FTP server, and client can access the DB server (which is accessible to each other in the intranet through user privileges). In this experiment, we simulated the costs versus benefits of defense and attack behaviors instead of actual attacks in a real environment. This simulation helps to understand the factors when making decisions in the field of cyber security, while making the application of the model more interpretable.
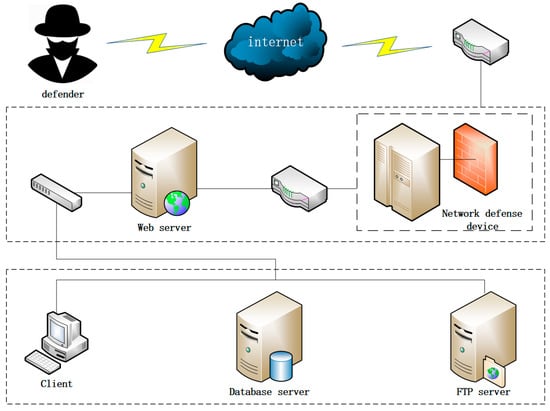
Figure 4.
Network topology.
The MTD attack and defense confrontation process is divided into five stages, each of which consists of an initial state and a stable state, making a total of ten states. The states of each stage are described as shown in Table 4, where represents the initial state of the stage, and represents the stable state of the stage.
Table 4.
Stage state descriptions.
For the state jumps between different stages, reference [34]. We assume that the state transfer probability is fixed and determine it based on historical data and expert experience, as shown in Table 5. Here, the probability represents the likelihood of transitioning from state to state . The state transfer probability is denoted as .
Table 5.
Stage state transfer probabilities.
The experimental system is scanned by the vulnerability scanner Nessus, and after analyzing the obtained vulnerability data, routing configuration information, and querying the relevant data from the National Information Security Vulnerability Database [35], the defenders are classified into two types of high and low , corresponding to the defense induced signals as , respectively. Referring to MIT Lincoln Laboratory’s classification of network attacks and defenses, as well as relevant historical data [36], combined with the gain quantification method defined in this paper, the experimentally selected attack and defense strategies are shown in Table 6 and Table 7. The attack and defense game strategies at each stage are shown in Table 8.
Table 6.
Attack strategy attribute descriptions.
Table 7.
Defense strategy attribute descriptions.
Table 8.
Content of Attack and Defense Strategies by Stage.
4.2. Benefit Calculation
Referring to Zhang et al. [37], the defense induced signaling cost as well as the attack recognition cost is set to . According to the importance of the network devices in the experimental environment and the services provided, the security attributes of the network devices are set as shown in Table 9.
Table 9.
Device security attributes.
According to the proposed three-way dynamic adjustment model, different weight adjustment strategies corresponding to different attack intensities are calculated, and the resulting impact of cyber-attacks on network security attributes is shown in Table 10.
Table 10.
Three-way dynamic adjustment algorithm stage thresholds.
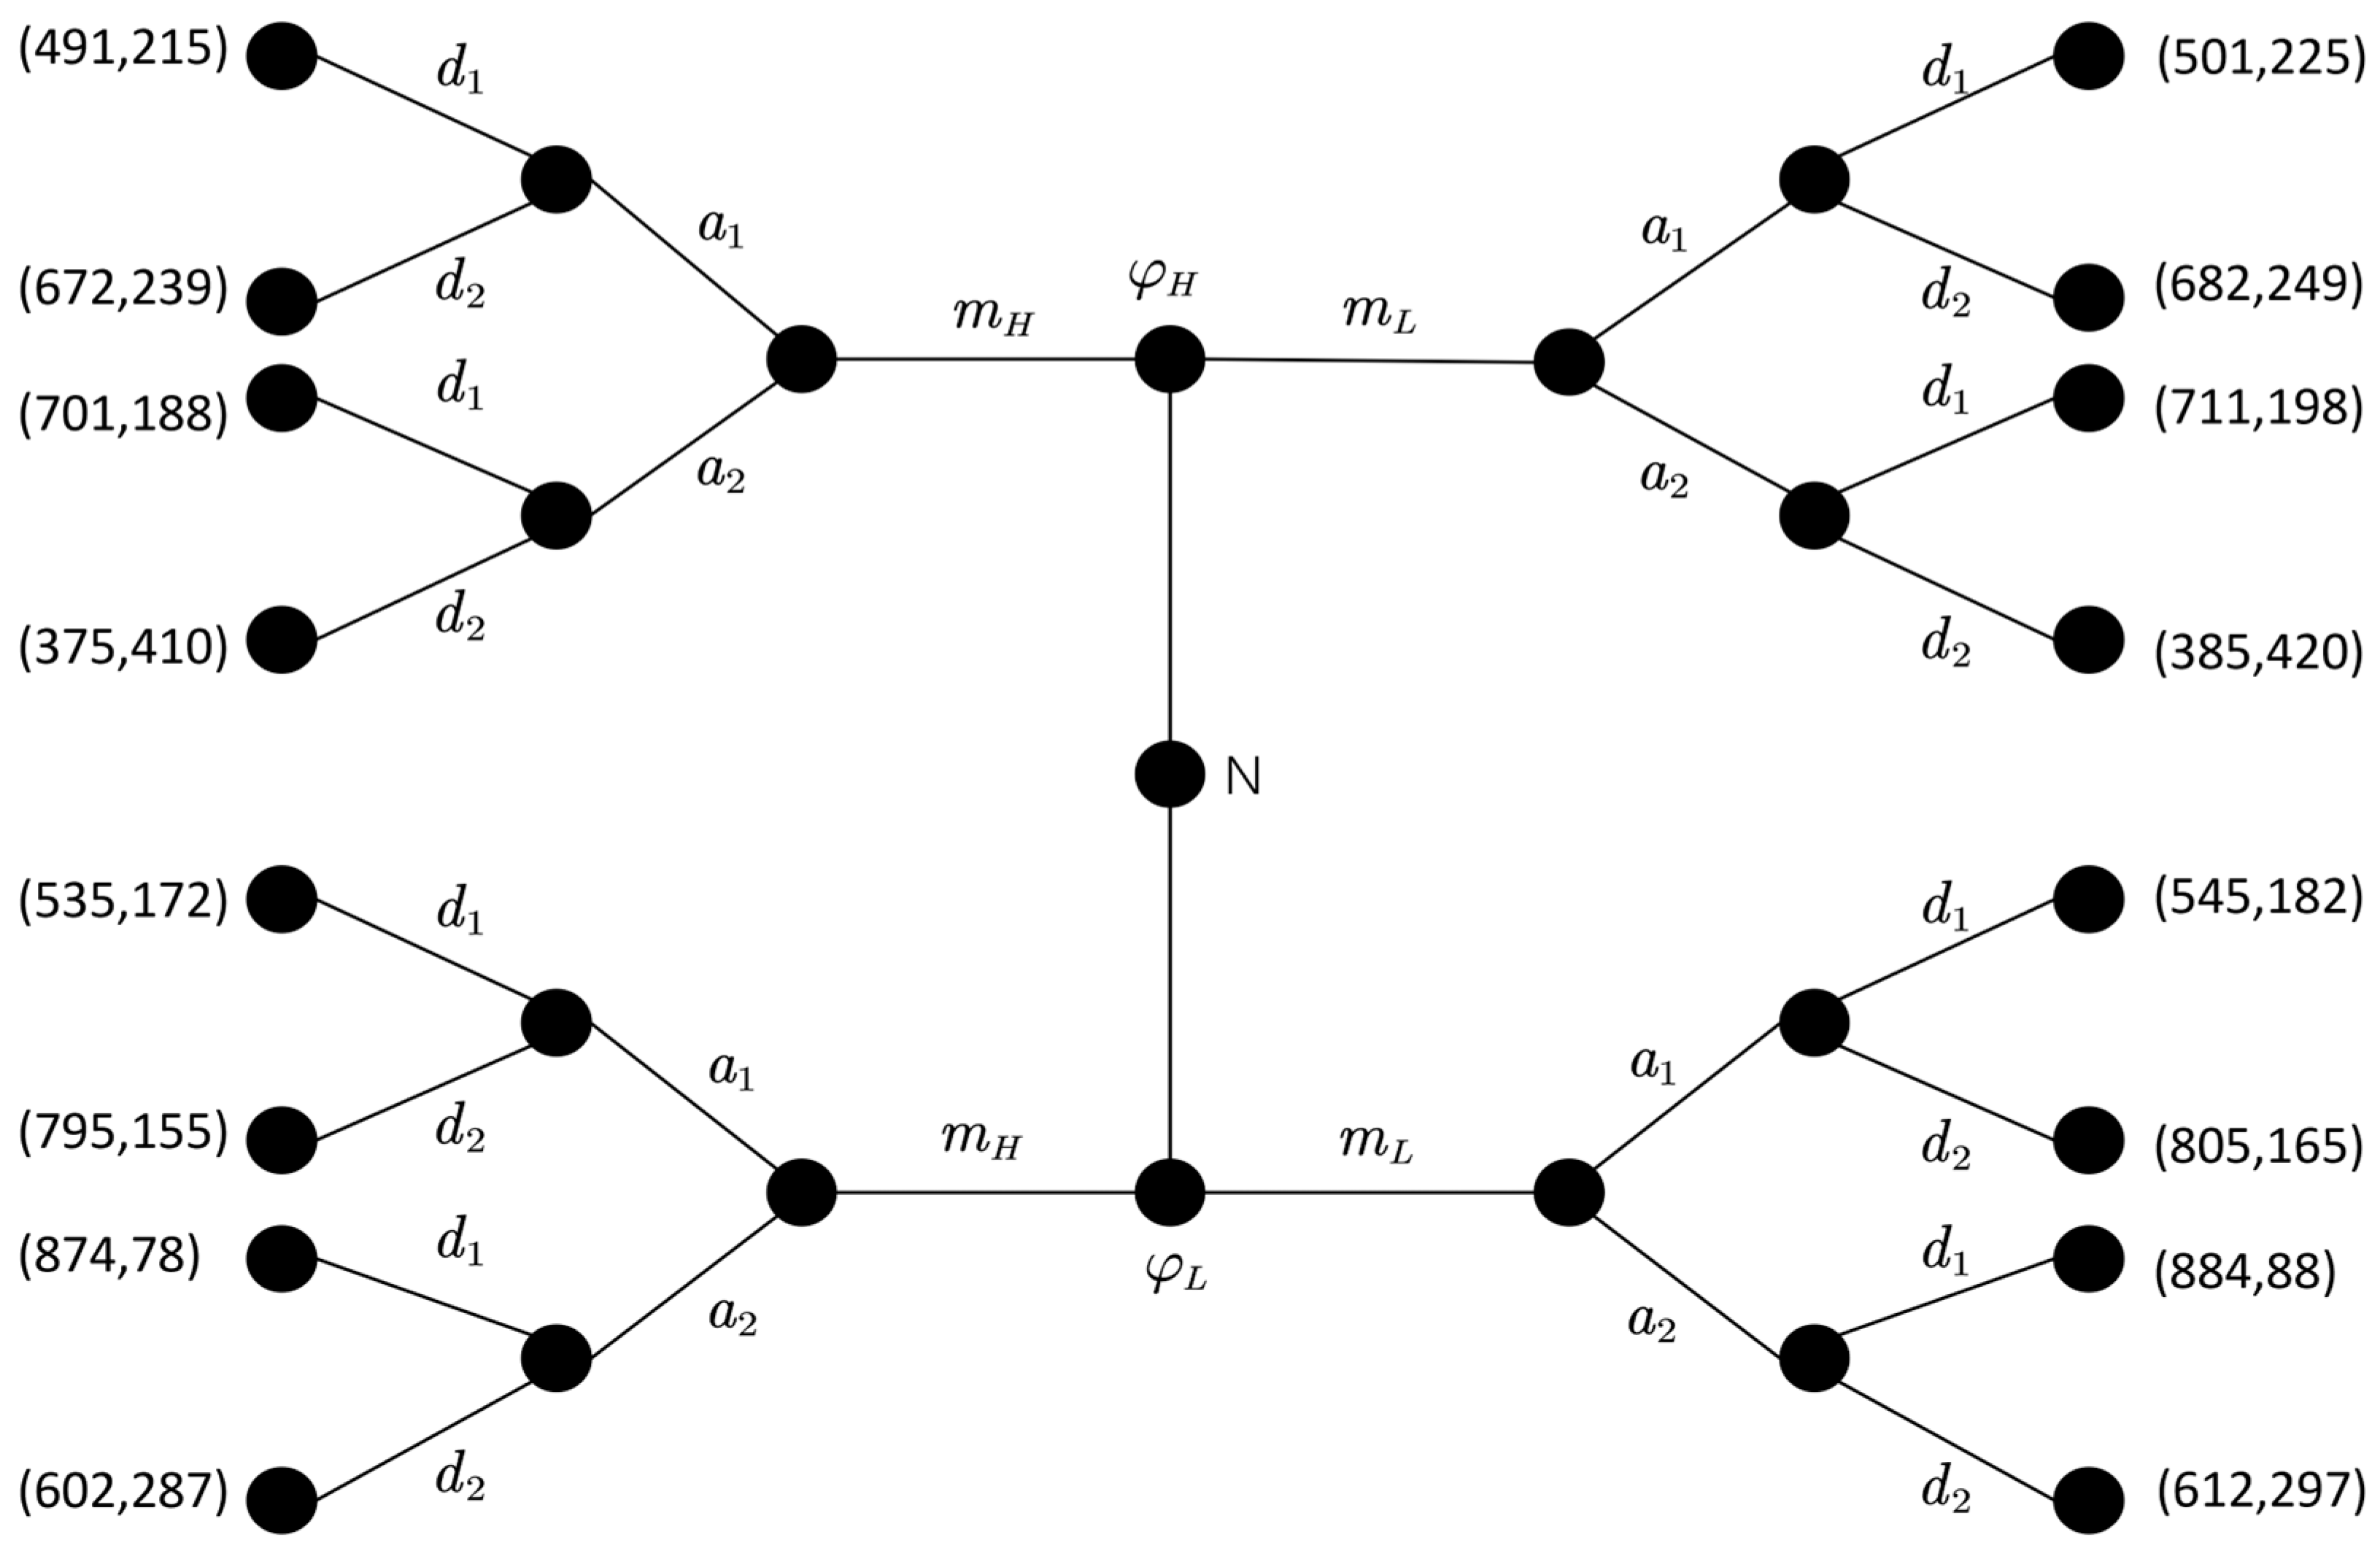
Taking the first stage as an example, with reference to Jiang et al. [32] and Equations (22) and (23), the game payoffs of the attacking and defending sides in the first stage are calculated and plotted as a game tree, as shown in Figure 5.
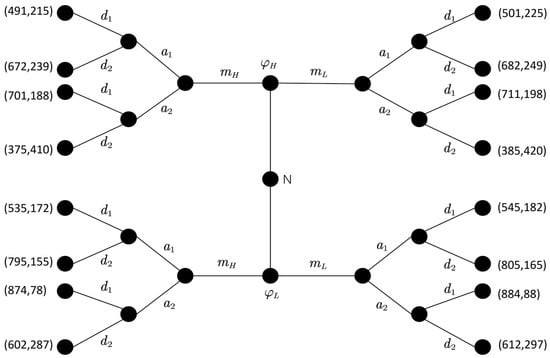
Figure 5.
MTTEGDM game model first stage game tree.
The defender naturally selects the defense type with probabilities . The attacker has a priori probability for the defense types. The attacker observes the induced signal and then corrects the a priori probability for the defense types and adopts an attack strategy. The corresponding defender adopts the corresponding defense strategy. At this stage, the attacker adopts the strategy combination , and the defender adopts the strategy combination . The attacker and defender adopt different pairs of attack and defense strategies (e.g., , etc.) to quantitatively calculate the attack and defense gains.
4.3. Equilibrium Solution and Analysis
Referring to the method of literature Xiao [38], let the Markov discount factor be . The probability that the attacker adopts an attack strategy is , and the probability that the defender adopts a defense strategy is .
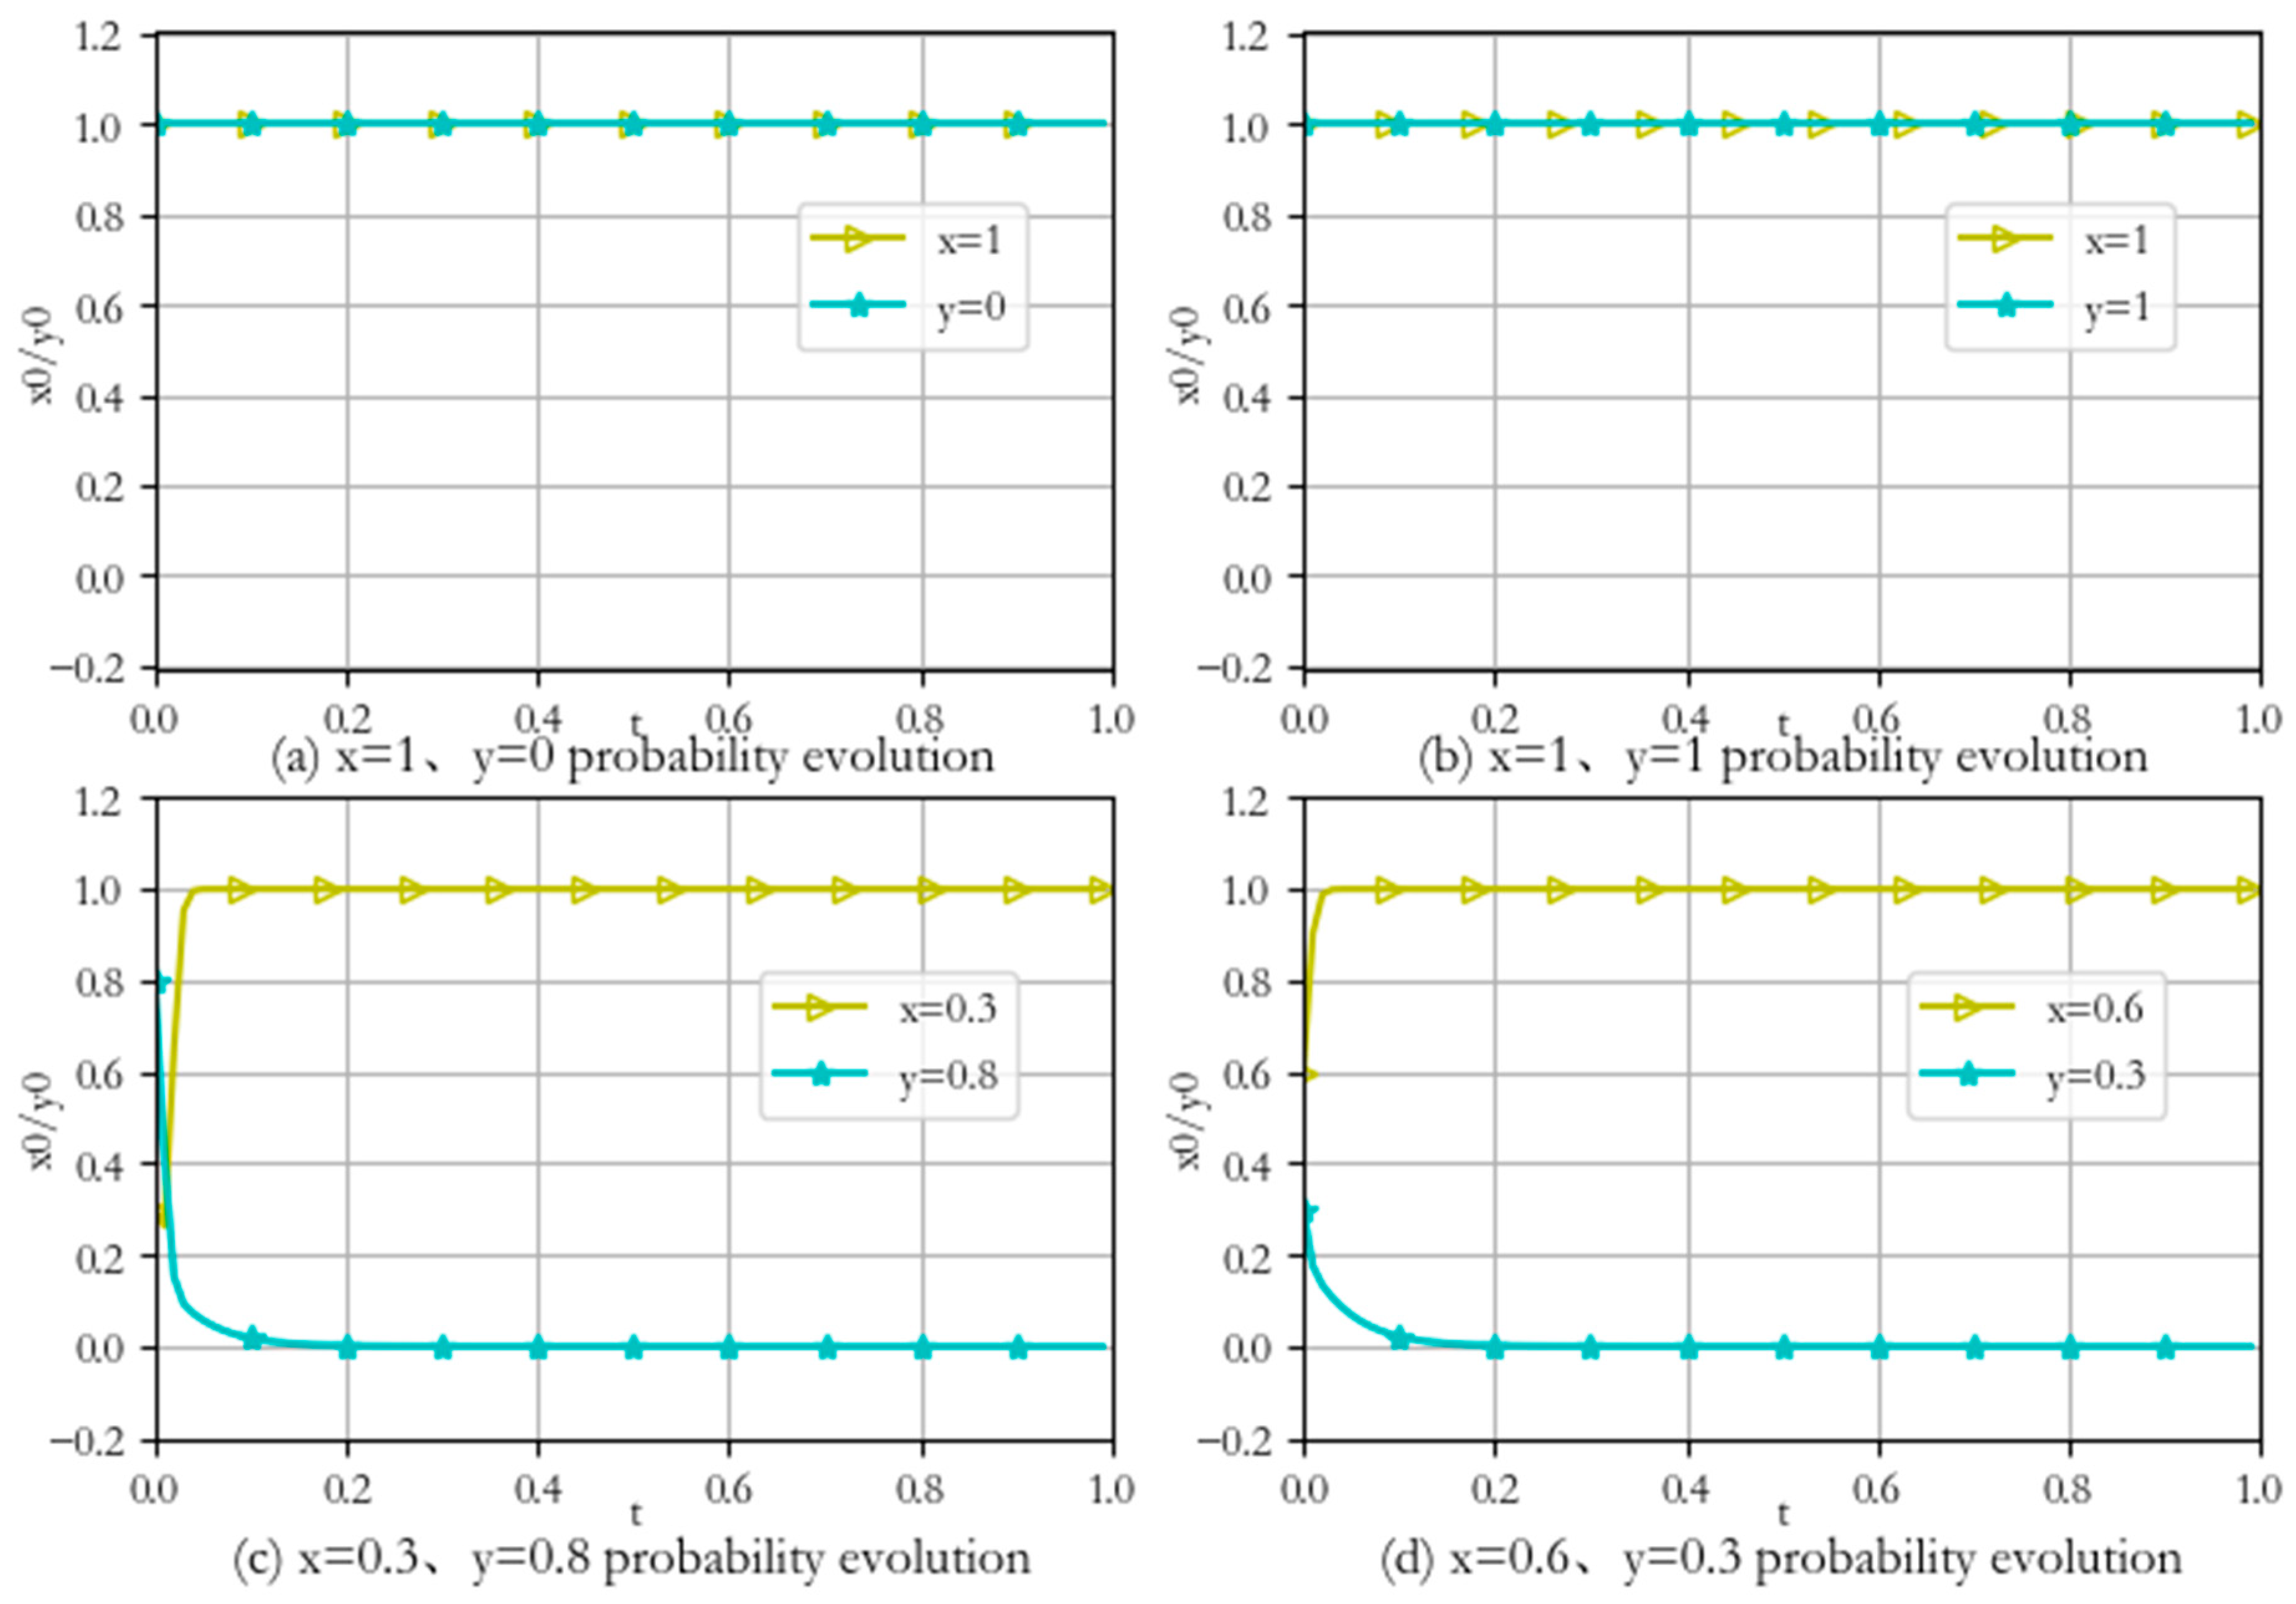
Taking the first stage as an example, four representative attack and defense group probabilities are selected for analysis. The constructed network environment is subjected to several simulation experiments, and the experimental results are shown in Figure 6.
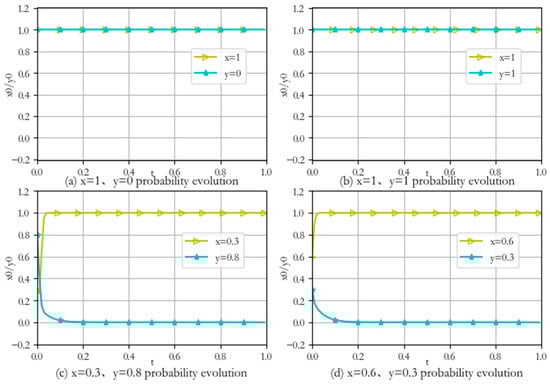
Figure 6.
Evolution of the first stage of attack and defense.
- (1)
- When the initial values are , the attacker adopts pure strategy with probability 1, and the defender adopts pure strategy with probability 1. After a period of time, the attack and defense evolution strategies do not change, i.e., the optimal defense strategy is , as shown in Figure 6a.
- (2)
- When the initial values are x = 1, y = 1, the attacker adopts pure strategy with probability 1, and the defender adopts pure strategy with probability 1. After a period of time, the attack and defense evolution strategies do not change, i.e., the optimal defense strategy is , as shown in Figure 6b.
- (3)
- When the initial values are x = 0.3, y = 0.8, the attacker selects the attack strategy with mixed probabilities (0.3, 0, 7), and the defender selects the defense strategy with mixed probabilities (0.8, 0, 2). After a period of time evolution, the probabilities of attack and defense strategies finally converge to 1 and 0, respectively, and reach a stable state. The defender takes pure strategy with a probability of 1, i.e., the optimal defensive strategy is , as shown in Figure 6c.
- (4)
- When the initial values are x = 0.3, y = 0.8, after a period of evolution, the attack and defense strategy probabilities still eventually converge to 1 and 0, reaching a stable state. The defender takes pure strategy with probability 1, i.e., the optimal defense strategy is , as shown in Figure 6d.
Corrected paragraph: From the above simulation results, it can be seen that given the initial states selected by different strategies, the system will eventually reach a certain stable state after evolution. By comparison, the evolutionary game model is consistent with the evolutionary law in the real system; therefore, the game model in this paper is effective.
The strategy selection algorithm of Section 3 is implemented using Python programming, and the initial values of the experiments are all mixed strategies. The equilibrium strategies at each stage are calculated, as shown in Table 11, where represents the optimal defense strategy of the defender at each stage.
Table 11.
Stabilized solutions for each stage of attack and defense evolution.
The ultimate goal of the attacker is to damage the DB server information of the target system. The MTD decision algorithm is implemented by Matlab 2016a and PyCharm 2021 tools. The data and images of each stage of attack and defense simulation are analyzed, and it is known that there are two attack paths for the attacker as follows:
- (1)
- Network Defense Equipment—Web Server—Client—FTP Server—Database Server
- (2)
- Network Defense Equipment—Web Server—FTP Server—Database Server
In the first stage of the game, during the interaction between the attacker and the defender, the defender adopts defense strategy at the high-level defense, releasing low-level defense signals to confuse the attacker. Meanwhile, the attacker adopts attack strategy , resulting in a separating equilibrium with a defense gain of 324. On the other hand, when the defender adopts strategy for the high-level defense, releasing high-level defense signals to confuse the attacker, and the attacker adopts attack strategy , the result is another separating equilibrium with a defense gain of 314. However, when the defender is at a low defense level, there is no equilibrium solution. Therefore, when comparing the gain values, the optimal defense strategy in this stage is when the defender at the high-level releases the low-level defense signal and adopts the defense strategy, as shown in Figure 5.
For the same reason, as can be seen in Table 11, the attacker successfully invades the Network Defense Equipment and obtains root privileges after the attack and defense into the second stage. The optimal defense strategy in this stage is when the high-level defender releases the low-level defense signals and adopts the defense strategy.
The attacker exploits the vulnerability of the Web Server and obtains its root privileges. Then, they enter the third stage of Client and the fourth stage of FTP Server privilege capture attack and defense state. In the third stage, the optimal defense strategy is to release the low-level defense signal from the high defense level and adopt the defense strategy. In the fourth stage, the optimal defense strategy is to release low-level defense signals from the high defense level and adopt defense strategy .
When the attack and defense confrontation proceeds to the fifth stage of protecting the database server, the optimal defense strategy is for the high-level defender to release the low-level defense signal and adopt the defense strategy.
Through the accumulation of the above defensive gains, it can be seen that the total defense gain of Path 1 is greater than the total defense gain of Path 2. Thus, the attack and defense process of Path 1 is more satisfying to the defense needs. Through the analysis of the characteristics of the two attack chains, in order to reduce the probability of the formation of attack chain 2, it is necessary to reduce the probability of state 2 jumping to state 4. By analyzing the attack and defense strategy of state 4, the algorithm proposed in this paper concludes that the optimal attack strategy is Oracle TNS Listener for . Therefore, the defender can focus on this attack for the moving target defense and reduce the value of to achieve the optimal defense effect.
4.4. Result Analysis
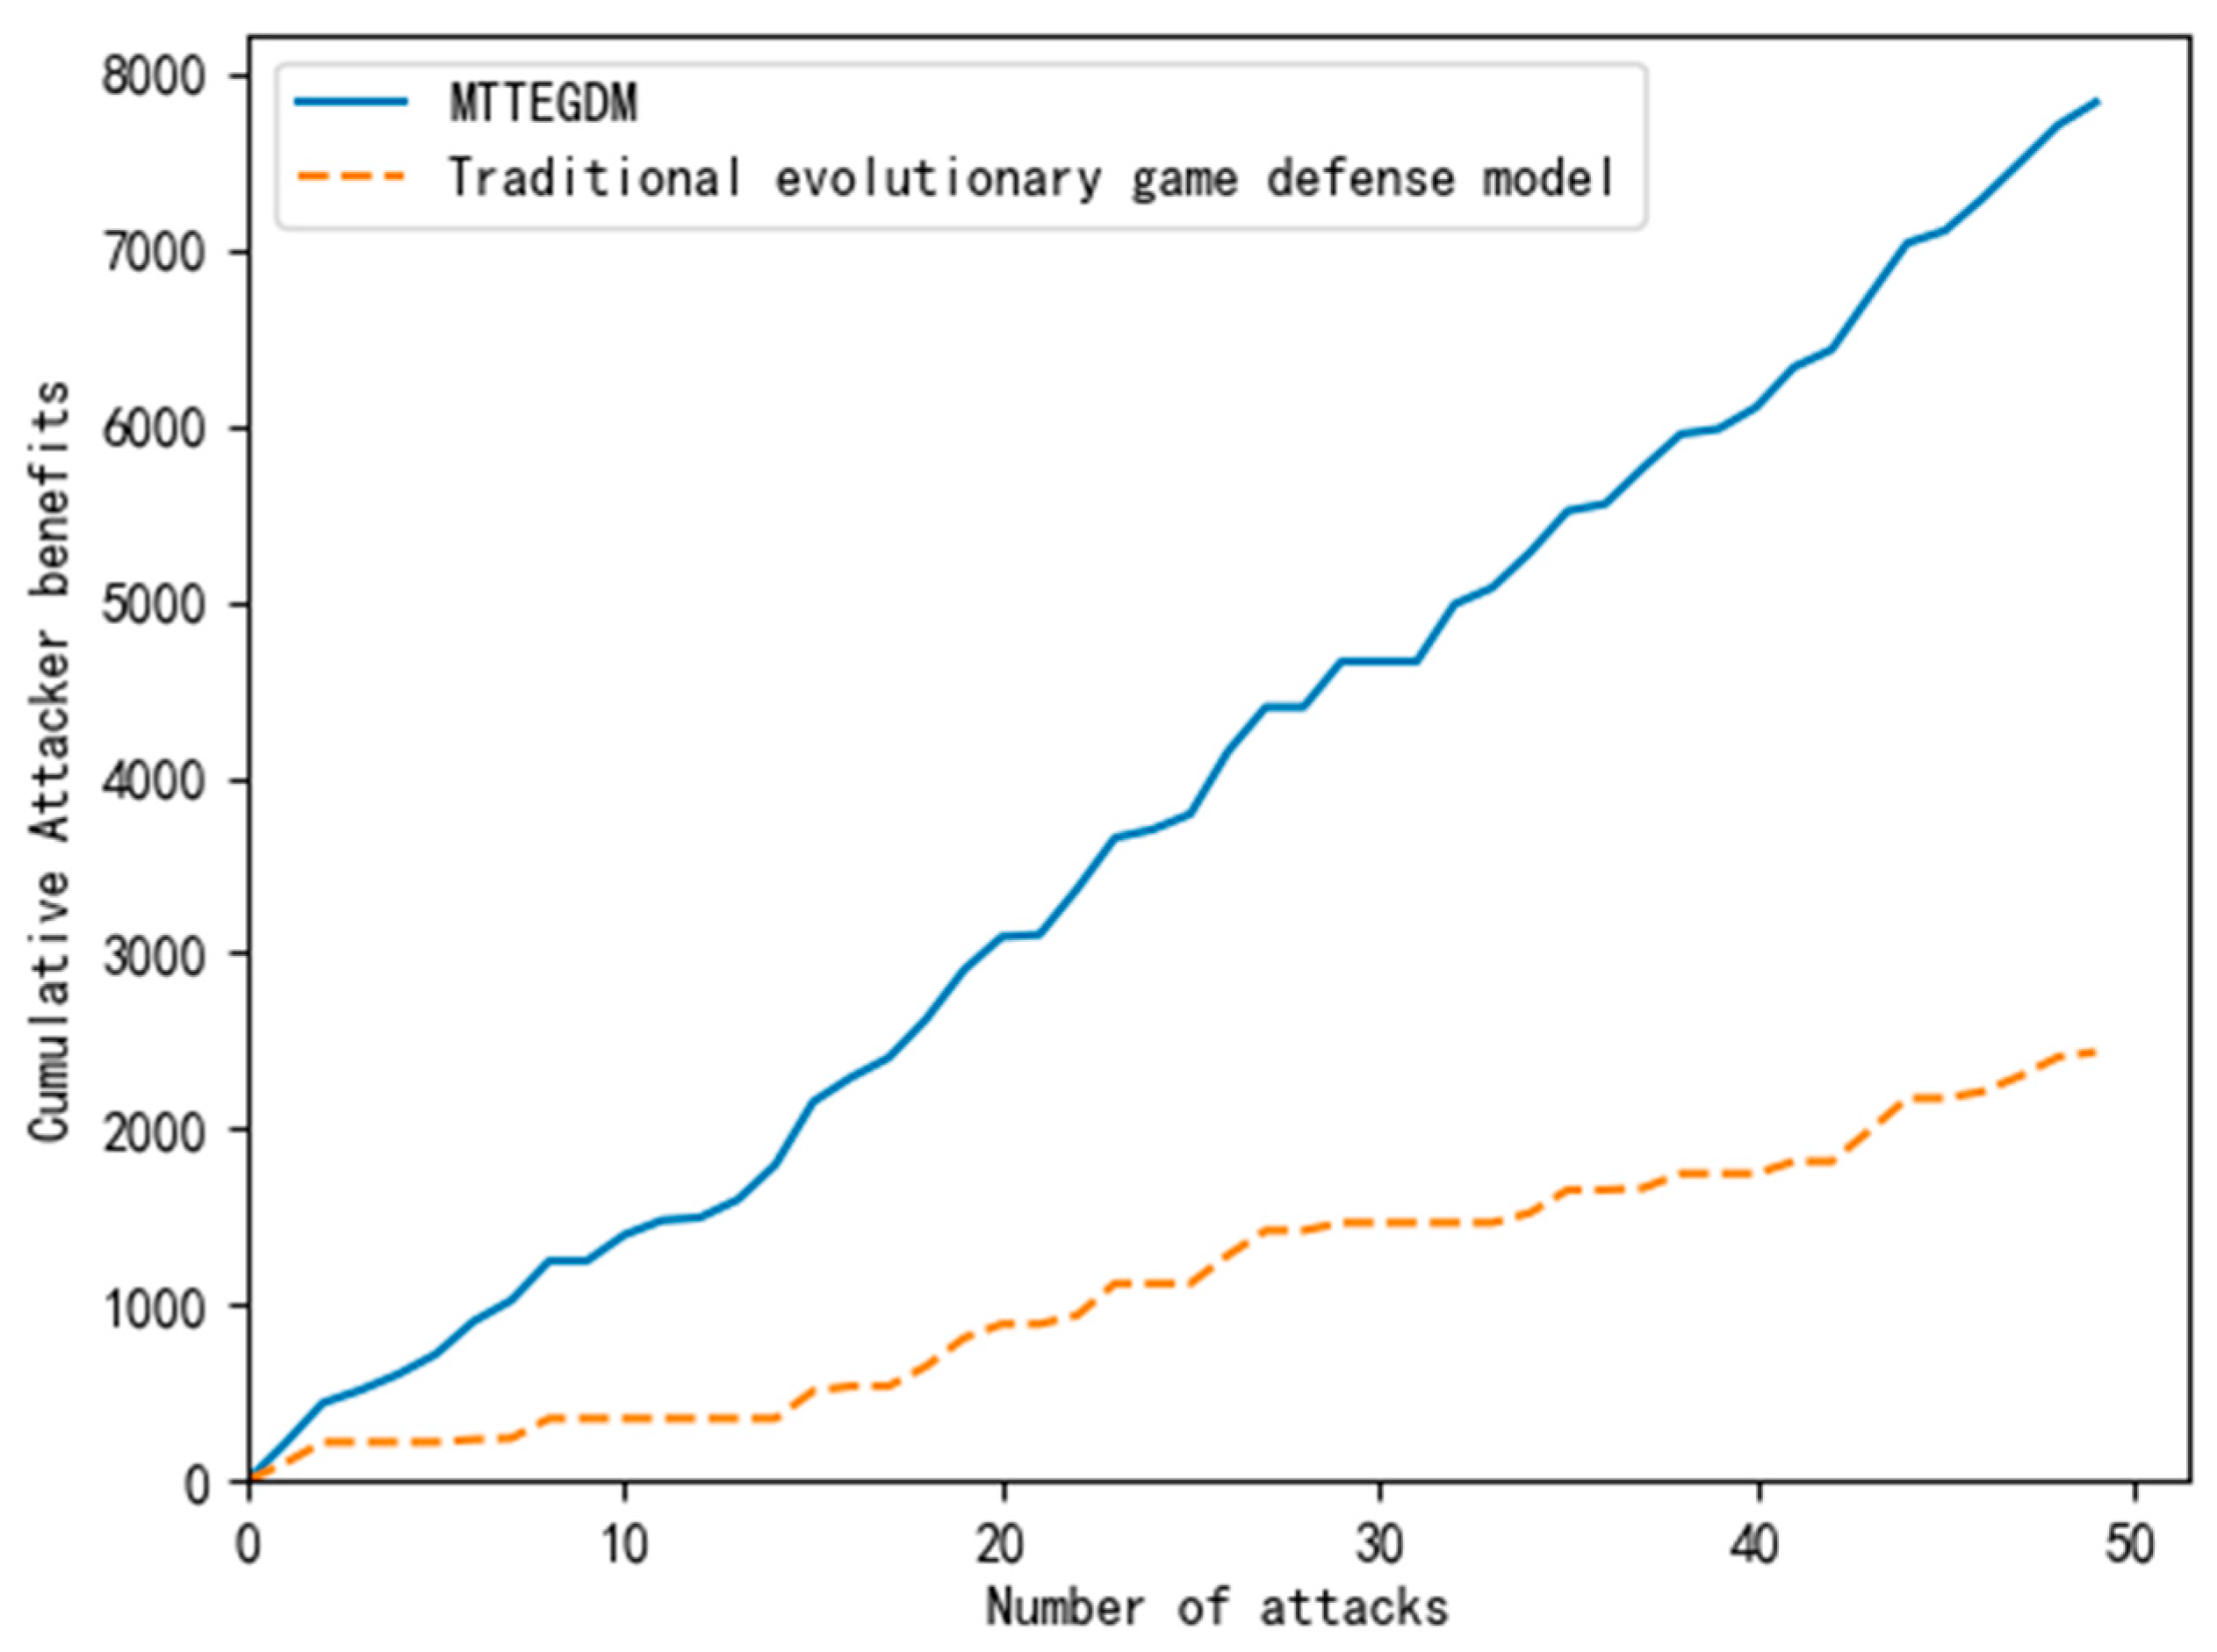
Through 50 Monte Carlo simulation experiments, the effectiveness of the proposed algorithm is verified. It is done by comparing the cumulative benefits of the Moving Target Three-way Evolutionary Game Defense Model (MTTEGDM) and the traditional evolutionary game defense model, that is, the model without the specific analysis of MTD benefits. The experimental results are shown in Figure 7.
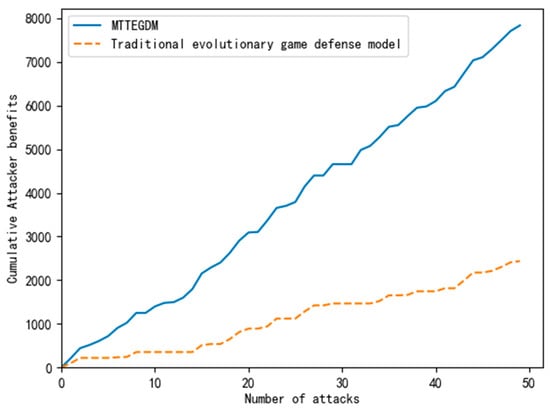
Figure 7.
Comparison of Benefits of Different Game Models.
The experimental results indicate that the traditional evolutionary game defense model exhibits low and slow cumulative defense benefits due to its lack of specific analysis of MTD benefit. In contrast, the Moving Target Three-way Evolutionary Game Defense Model (MTTEGDM) shows a steady and substantial increase. The traditional model’s failure to conduct a quantitative analysis of MTD payoff leads to errors in game payoff calculation, resulting in significant cost and resource wastage. In this paper, the MTTEGDM proposes actively releasing induced signals to deceive attackers. It takes the posterior of the previous stage as the prior probability of the next stage, with corrections applied. Simultaneously, a specialized quantitative benefit analysis is conducted for the defender using MTD. The optimal MTD defense strategy is adopted, making it more suitable for actual MTD application. This not only enhances the defense model’s effectiveness and security but also maximizes the utilization of defense resources.
5. Conclusions
Currently, applying Moving Target Defense (MTD) is a necessary trend for network security. Traditional static security defense struggles to respond effectively to constantly evolving network threats. In this context, this article proposes the Moving Target Three-way Evolutionary Game Defense Model (MTTEGDM). The model emphasizes the proactivity of MTD defense. It provides a more flexible and adaptable network defense method through a combination of signal games and evolutionary games. The use of three-way decision methods enables the model to accurately capture the intentions of attackers. It comprehensively considers multiple factors in defense decisions, thereby better adapting to the ever-changing network attack situation. The introduction of three-way decision methods not only brings the model closer to the actual attack and defense situation but also enhances the deep understanding of attacker behavior. It provides a foundation for more accurate decision-making. Introducing reward and punishment mechanisms, along with third-party supervision to optimize the overall benefits of defense, can help establish a healthy network ecosystem. This approach improves the overall level of network security. Overall, the MTTEGDM model is of great significance for the application of MTD. It emphasizes proactivity, quantitative analysis, resource optimization, and introduces attack intent using three-way decision methods. A new theoretical framework is introduced for the field of network security, providing strong support for the practical application of MTD network defense strategies. However, in the face of complex network environments, relying solely on these preliminary studies is far from enough. Faced with various attack behaviors, how to effectively defend against MTD remains a challenge worth studying.
Author Contributions
Conceptualization, Z.Z. and L.L.; formal analysis, C.Z. and J.R.; resources, L.W. and L.L.; funding acquisition, J.M., L.L. and B.L.; writing—original draft, Z.Z. and L.L. All authors have read and agreed to the published version of the manuscript.
Funding
This work was supported in part by the Hebei Province Professional Degree Teaching Case Establishment and Construction Project (Chunying Zhang: No. KCJSZ2022073), the Basic Scientific Research Business Expenses of Hebei Provincial Universities (Liya Wang: No. JST2022001), and the Tangshan Science and Technology Project (Liya Wang: No. 22130225G).
Data Availability Statement
Data are contained within the article.
Acknowledgments
Support by colleagues and the university is acknowledged.
Conflicts of Interest
The authors declare no conflicts of interest.
References
- Lei, C.; Zhang, H.Q.; Tan, J.L.; Zhang, Y.C.; Liu, X.H. Moving Target Defense Techniques: A Survey. Secur. Commun. Netw. 2018, 2018, 1–26. [Google Scholar] [CrossRef]
- Cao, G. Research on Defense Strategy Selection Based on Improved Genetic Algorithm; Tianjin University: Tianjin, China, 2021; pp. 29–40. [Google Scholar]
- Tamba, T.A. A PSO-based moving target defense control optimization scheme. In Proceedings of the 2021 SICE International Symposium on Control Systems (SICE ISCS), Virtual, 2–4 March 2021; IEEE: New York, NY, USA, 2021; pp. 46–50. [Google Scholar]
- Zhao, Z. Research on Key Technologies of Moving Target Defense Based on Software-Defined Network; PLA Information Engineering University: Zhengzhou, China, 2017; pp. 59–76. [Google Scholar]
- Dantas Silva, F.S.; Neto, E.P.; Nunes, R.S.; Souza, C.H.; Neto, A.J.; Pascoal, T. Securing Software-Defined Networks Through Adaptive Moving Target Defense Capabilities. J. Netw. Syst. Manag. 2023, 31, 61. [Google Scholar] [CrossRef]
- Zhang, N. Defensive strategy selection based on attack-defense game model in network security. Int. J. Perform. Eng. 2018, 14, 2633. [Google Scholar] [CrossRef]
- Huang, J.; Zhang, H. Optimal defense strategy selection based on improved replication dynamic evolutionary game model. J. Commun. 2018, 39, 170–182. [Google Scholar]
- Jiang, L.; Zhang, H.; Wang, J. Optimal Strategy Selection Method for Moving Target Defense Based on Signal Game. J. Commun. Tongxin Xuebao 2019, 40, 128–137. [Google Scholar]
- Heiets, I.; Oleshko, T.; Leshchinsky, O. Game-theoretic principles of decision management modeling under the Coopetition. Int. Game Theory Rev. 2021, 23, 2050010. [Google Scholar] [CrossRef]
- Li, Y.; Deng, Y.; Xiao, Y.; Wu, J. Attack and Defense Strategies in Complex Networks Based on Game Theory. J. Syst. Sci. Complex. 2019, 32, 1630–1640. [Google Scholar] [CrossRef]
- Huang, J.; Zhang, H.; Wang, J.; Huang, S. Defense strategy selection method based on offensive and defensive evolutionary game model. J. Commun. 2017, 38, 168–176. [Google Scholar]
- Sun, Y.; Ji, W.; Weng, J. Selection of optimal defense strategy for moving target signal game. Comput. Sci. Explor. 2020, 14, 1510–1520. [Google Scholar]
- Tan, J. Research on Decision-Making Method of Moving Target Defense Based on Game Theory; Information Engineering University of Strategic Support Force: Zhengzhou, China, 2022; pp. 5–17. [Google Scholar]
- Yao, Y. Three-way decisions with probabilistic rough sets. Inf. Sci. 2010, 180, 341–353. [Google Scholar] [CrossRef]
- Wang, Q.; Wan, Y.; Feng, F. Human–machine collaborative scoring of subjective assignments based on sequential three-way decisions. Expert Syst. Appl. 2023, 216, 119466. [Google Scholar] [CrossRef]
- Shen, Y. An Intrusion Detection Algorithm for DDoS Attacks Based on DBN and Three-way Decisions. J. Phys. Conf. Ser. 2022, 2356, 012044. [Google Scholar] [CrossRef]
- Yao, J.; Yao, Y.; Ciucci, D.; Huang, K. Granular computing and three-way decisions for cognitive analytics. Cogn. Comput. 2022, 14, 1801–1804. [Google Scholar] [CrossRef]
- Shah, A.; Ali, B.; Habib, M.; Frnda, J.; Ullah, I.; Anwar, M.S. An ensemble face recognition mechanism based on three-way decisions. J. King Saud Univ.-Comput. Inf. Sci. 2023, 35, 196–208. [Google Scholar] [CrossRef]
- Wang, T.; Sun, B.; Jiang, C. Kernel similarity-based multigranulation three-way decision approach to hypertension risk assessment with multi-source and multi-level structure data. Appl. Soft Comput. J. 2023, 144, 110470. [Google Scholar] [CrossRef]
- Krzysztof, S. 3WDNFS—Three-way decision neuro-fuzzy system for classification. Fuzzy Sets Syst. 2023, 466, 108432. [Google Scholar]
- Hu, Y.; Xu, J.; Zhang, Q. Three games of decision evolution sets. Comput. Eng. Appl. 2017, 53, 92–97. [Google Scholar] [CrossRef]
- Zhang, Q.; Huang, Z.; Gao, M.; Ai, Z. Sequential three-branch decision model based on uncertainty and misclassification rate game. Acta Electron. Sin. 2022, 50, 1033. [Google Scholar]
- Xue, C.; Nie, M.; Yang, G.; Zhang, M.; Sun, A.; Pei, C. Evolutionary game-based multi-user switching strategy for low-orbit quantum satellites under snowfall interference. J. Opt. 2023, 43, 248–256. [Google Scholar]
- Su, Q.; Ji, L. Research on the coordination mechanism of medical data sharing based on stochastic evolutionary game. Intell. Sci. 2023, 41, 37–47. [Google Scholar] [CrossRef]
- Ma, R.; Zhang, E.; Wang, G.; Ma, Y.; Weng, J. A network defense decision-making method based on the improved evolutionary game model. J. Electron. Inf. 2023, 45, 1970–1980. [Google Scholar]
- Liu, B.; Wu, H.; Yang, Q.; Zhang, H. Random-Enabled Hidden Moving Target Defense against False Data Injection Alert Attackers. Processes 2023, 11, 348. [Google Scholar] [CrossRef]
- Sun, T. Research on Key Technology of LDoS Defense Based on Mobile Target Defense under Microservice Architecture; Dalian Maritime University: Dalian, China, 2022. [Google Scholar]
- Zhang, Z.; Wang, X.; Su, C.; Sun, L. Evolutionary game analysis of shared manufacturing quality synergy under dynamic reward and punishment mechanism. Appl. Sci. 2022, 12, 6792. [Google Scholar] [CrossRef]
- Li, L.; Wu, J.; Zeng, W.; Liu, W. Container migration and honeypot deployment strategy based on signal game in container cloud. J. Netw. Inf. Secur. 2022, 8, 87–96. [Google Scholar]
- Hajihashemi, M.; Aghababaei Samani, K. Multi-strategy evolutionary games: A Markov chain approach. PLoS ONE 2022, 17, e0263979. [Google Scholar] [CrossRef] [PubMed]
- Wang, Z.; Lu, Y.; Li, X. Risk assessment of military information network security based on attack and defense game. Mil. Oper. Syst. Eng. 2019, 33, 35–40+47. [Google Scholar]
- Jiang, L.; Zhang, H.; Wang, J. Optimal decision-making method for moving target defense based on multi-stage Markov signal game. Acta Electron. Sin. 2021, 49, 527–535. [Google Scholar]
- Bi, W.; Lin, H.; Zhang, L. Decision-making algorithm for moving target defense based on the multi-stage evolutionary signal game model. Comput. Appl. 2022, 42, 2780–2787. [Google Scholar]
- Li, Q. Numerical Analysis; Tsinghua University Press: Beijing, China, 2001; Volume 8, pp. 51–92. [Google Scholar]
- CNNVD Classification Guide: China National Vulnerability Database of Information Security. Available online: https://www.cnnvd.org.cn (accessed on 1 February 2023).
- Richardson, R.; CSI Director. CSI computer crime and security survey. Comput. Secur. Inst. 2008, 1, 1–30. [Google Scholar]
- Zhang, H.; Li, T. Optimal active defense based on multi-stage offensive and defensive signal game. Acta Electron. Sin. 2017, 45, 431–439. [Google Scholar]
- Hu, C.; Chen, Y.; Wang, G. Research on Decision Optimization of Moving Target Defense Based on Markov Differential Game. Comput. Appl. Res. 2023, 40, 2832–2837. [Google Scholar] [CrossRef]
Disclaimer/Publisher’s Note: The statements, opinions and data contained in all publications are solely those of the individual author(s) and contributor(s) and not of MDPI and/or the editor(s). MDPI and/or the editor(s) disclaim responsibility for any injury to people or property resulting from any ideas, methods, instructions or products referred to in the content. |
© 2024 by the authors. Licensee MDPI, Basel, Switzerland. This article is an open access article distributed under the terms and conditions of the Creative Commons Attribution (CC BY) license (https://creativecommons.org/licenses/by/4.0/).