Article

Precision Data-Driven Collision Localization with a Dedicated Matrix Template for Electric Vehicle Automatic Charging

1
School of Mechatronics Engineering, Harbin Institute of Technology, Harbin 150001, China
2
Beijing Institute of Astronautical Systems Engineering, Beijing 100076, China
*
Author to whom correspondence should be addressed.
Electronics 2024, 13(3), 638; https://doi.org/10.3390/electronics13030638
Submission received: 17 December 2023 / Revised: 29 January 2024 / Accepted: 2 February 2024 / Published: 2 February 2024

Abstract

:
With the increasing maturity of autonomous driving technology and automated valet parking, public awareness of robot-based automatic charging for electric vehicles has gradually increased. The positioning of the charging port for electric vehicles is a prerequisite for achieving automatic charging. The common approach is to use visual methods for charging port positioning. However, due to factors such as external light conditions, humidity, and temperature, the visual system may experience insufficient positioning accuracy, leading to difficulties in executing the charging plug-in task. To address this issue, this paper proposes a data-driven collision localization method based on the vibration signal generated by the contact. During the data collection process, we first introduce a collision point matrix template suitable for automatic charging plug-in. This template covers the entire charging port and supports the acquisition of dense collision vibration data. Using this collision point matrix template, the collision localization problem can be transformed into a classification problem of collision vibration information corresponding to different collision points. Then, the collision vibration data obtained, based on this template, are used to train the collision localization model, which mainly consists of an echo state network (ESN) and support vector machine (SVM). The AUBO-i5 6-DOF articulated robot is employed to test the proposed collision localization method under different joint configurations. The simulated experimental results demonstrate the effectiveness of the proposed collision localization method, showcasing a promising localization accuracy and root mean square error (RMSE).

1. Introduction

With the surge in popularity of electric vehicles (EVs), the charging infrastructure has become a focal point of discussion. Currently, the predominant approach to public charging frequently requires individuals to manually retrieve the charger from the charging station and then plug it into the EV. However, the unwieldy nature of chargers with hefty power cables presents a considerable inconvenience for their users. Unlike the well-established practices in traditional gas stations, where employees undergo extensive training, the potential for misoperation during the EV charging process causes safety concerns. Users, lacking stringent training on charger utilization, may encounter safety hazards. To alleviate user burdens and mitigate potential risks, the concept of employing robotic systems for automated EV charging has emerged as an innovative alternative [1,2,3].
Currently, the positioning of automatic charging systems relies predominantly on machine vision technology at the charging port [4,5,6,7]. In structured environments, machine vision systems exhibit commendable stability and high precision, meeting the requirements of robot-based electric vehicle (EV) automatic charging solutions for precise plug insertion. However, in unstructured environments, vision systems face various challenges, including variations in light conditions, hazy weather, and fluctuations in temperature and humidity. These changes in external conditions can impact the accuracy of the vision system, leading to difficulties in charging plug insertion. Once external conditions change, rectifying these influences is often challenging in the short term. To address the limitations in visual accuracy, compensation for plug insertion can be achieved using impedance control schemes when plug-in errors are minimal [
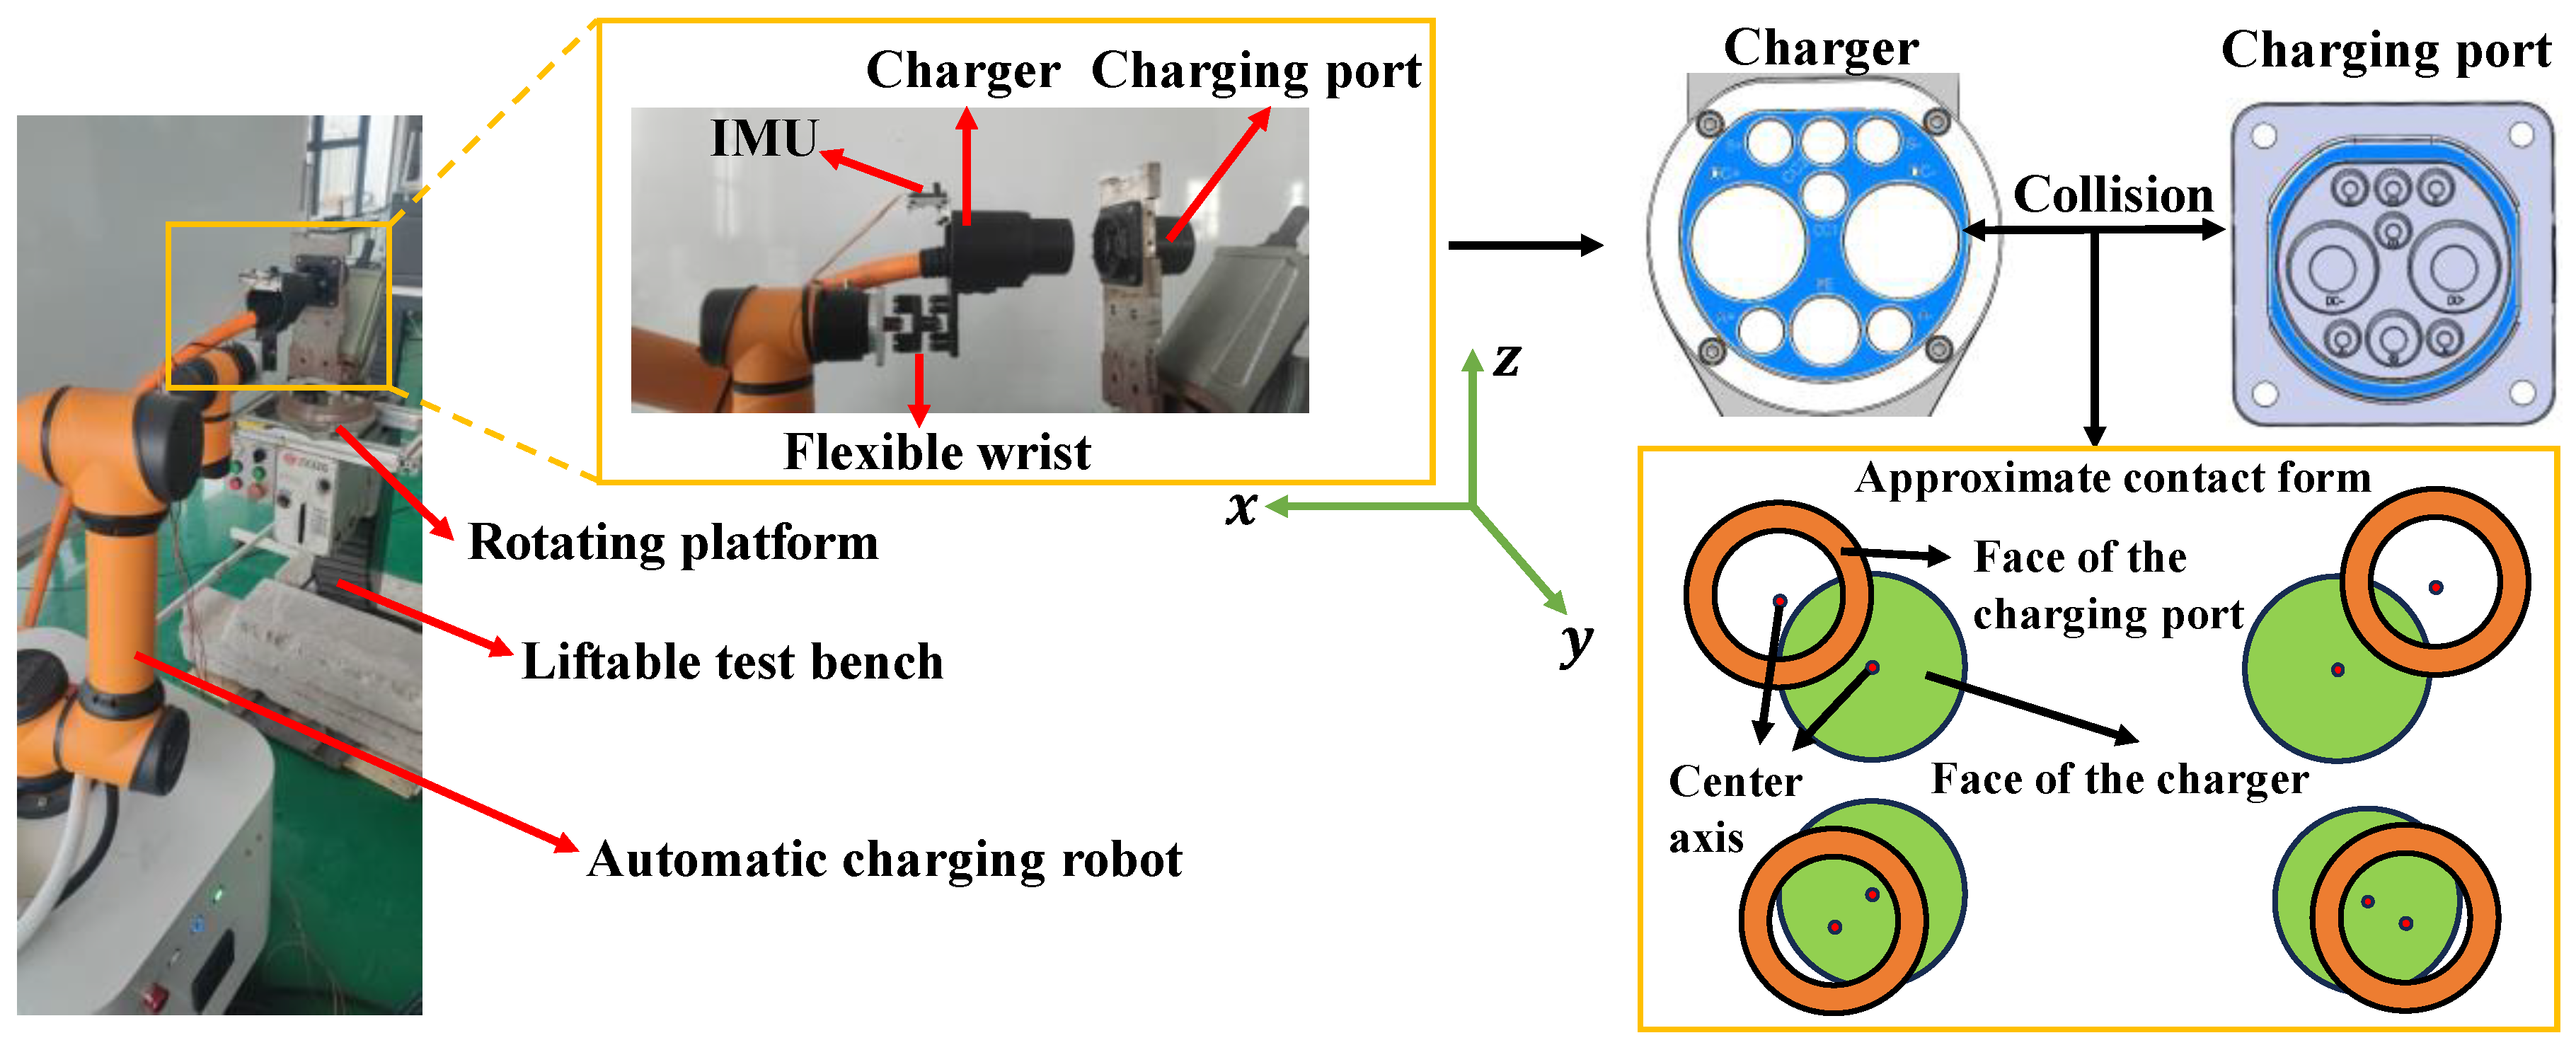
8]. However, when deviations are substantial, the charging gun may fail to make contact with the charging port, resulting in collisions with other parts of the vehicle. In such cases, collision classification becomes essential to safeguard the system. In instances of moderate deviations, the aforementioned methods may prove unsuitable, and it becomes necessary to employ a localization approach that involves determining the relative collision position between the charging gun and the charging port, to compensate for deviations in the plug-in process.
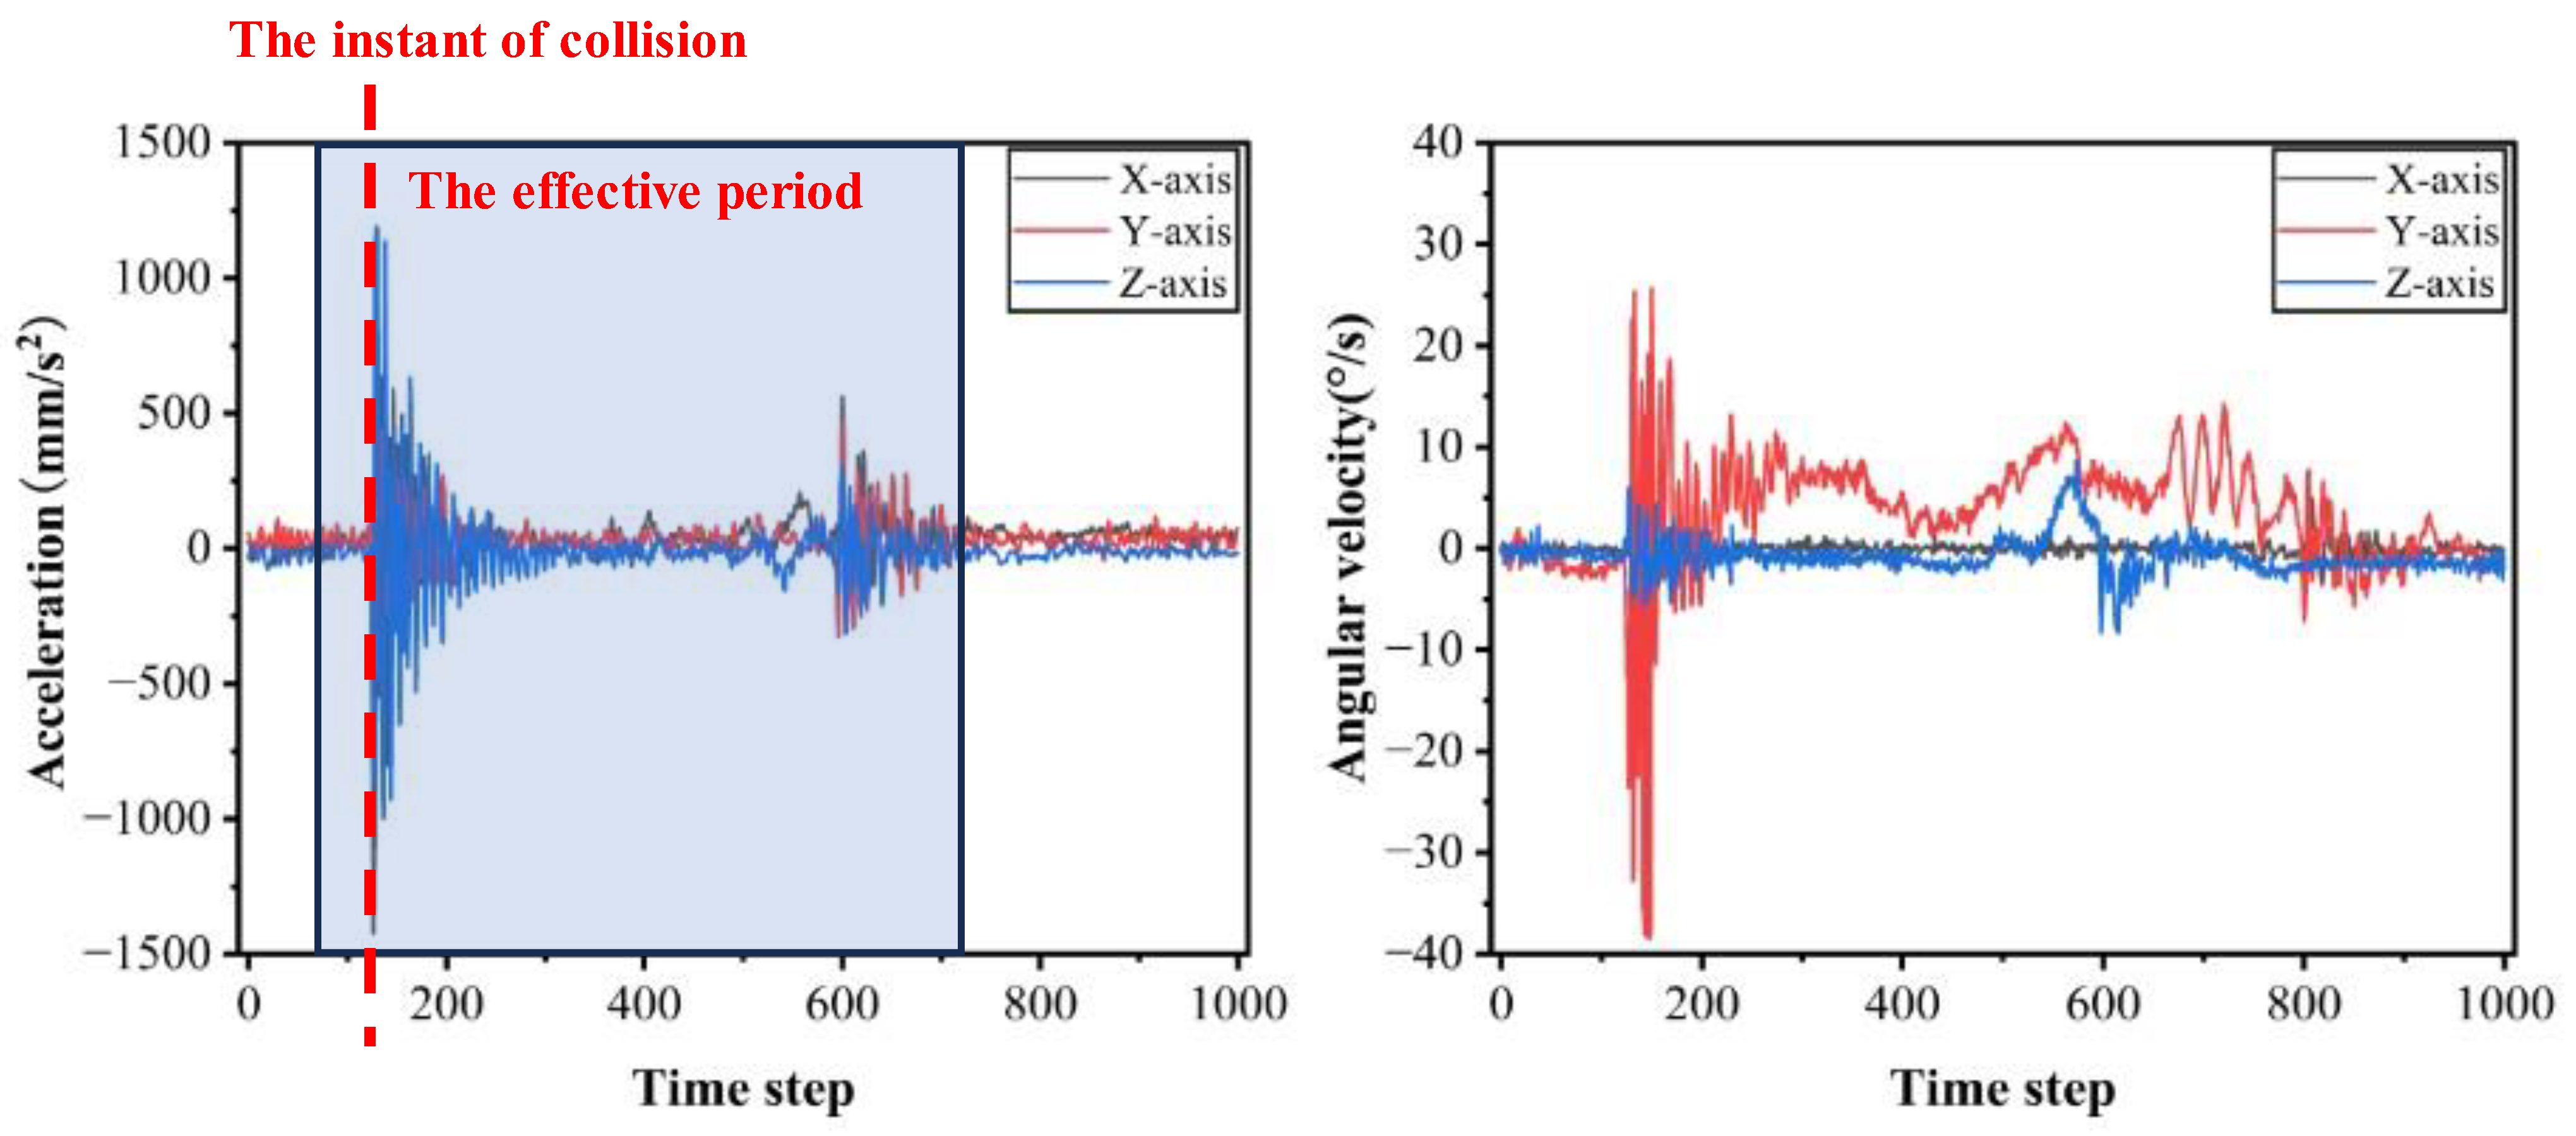
In our previous research, we leveraged the vibration signals generated at the end of a robotic arm during collisions, employing a data-driven approach to achieve a preliminary estimation of the collision area [9]. However, we observed that this estimation was too broad and lacked effectiveness in addressing the compensation challenges associated with actual collision deviations. To overcome this issue, this paper builds upon our previous work by introducing the concept of template matching from the field of computer vision. We propose a method that utilizes vibration information corresponding to collision point positions to construct a collision point matrix template. By integrating this template with a data-driven approach, we establish a more refined collision localization strategy. This approach aims to achieve a finer localization of the collision position between the robotic arm end effector and the charging port, addressing the limitations of relying solely on rough estimates of the collision area.
The rest of the paper is organized as follows: Section 2 reviews related works on collision localization. Section 3 describes the methodology for collision localization. Section 4 provides and discusses the experimental results, and Section 5 provides the conclusions.

2. Related Work

Automated charging for electric vehicles represents an emerging field, and there is currently limited research on collision localization issues within this domain. In contrast, research on collision handling primarily focuses on collaborative robots. This section reviews the literature on the collision localization of collaborative robots. In [10], the collision event processing workflow is divided into five components: collision detection, collision localization, collision identification, collision classification, and collision reaction. Among these, collision localization primarily serves to localize the contact point or contact link during a collision. Classical collision localization methods are predominantly based on physical models, and primarily involve constructing system observers to detect abnormal behaviors deviating from the normal operational state. The signals generated during abnormal behaviors are analyzed to estimate the contact position. Currently, the most effective observer for collision localization is the momentum observer, which was initially introduced in the study of De Luca et al. [11]. Through the implementation of a system momentum observer, Ref. [10] deduces the specific link that experienced a collision in a two-link system. The fundamental concept behind this design is to treat collisions as fault behaviors in the robot’s actuating system [12]. By considering collisions as simulated fault events, the decoupling properties of the robot’s generalized momentum can be leveraged to devise effective observers [13]. Ref. [14] combines a force–torque sensor mounted at the robot base with a virtual sensor based on a momentum observer, to estimate the magnitude and location of external wrenches along the structure of a robot arm. Ref. [15] introduces a nonlinear model-based momentum observer for the collision position and force estimation of humanoid robots. This method relies solely on joint position, velocity, and joint torque information, eliminating the need for additional sensors for collision analysis. A sensor redundancy approach was proposed by [16], extending the classical momentum-based disturbance observer to handle redundancy in force–torque measurements. This extension allows simultaneous collision localization for multiple contact points on different arm segments. The above model-based approaches are capable of effectively estimating the occurrence of collisions on a specific link, and in some instances, they can simultaneously estimate collisions on multiple links. However, such model-based methods have certain limitations in practical applications, primarily stemming from challenges in identifying the physical model parameters and accurately estimating unknown disturbances. These challenges decrease the ability of these methods to achieve high-precision collision localization on a small region of a single link.
Model-based approaches have garnered significant attention due to their minimal reliance on external sensors. Even with the utilization of the robot’s onboard sensors alone, these methods can achieve satisfactory results in collision localization. It is worth noting that the introduction of additional external sensors can indeed further enhance the performance of collision localization strategies. Furthermore, for those seeking the greatest dependence on external sensors, an exceptionally effective solution is the adoption of tactile sensors. These sensors leverage diverse transduction methods, smart materials, engineered structures, intricate electronics, and advanced data processing [17]. Drawing inspiration from the human somatosensory system, Ref. [18] mounts tactile sensors on the phalanges of underactuated fingers to collect local information about objects during in-hand manipulation. With the gathered information, the study utilizes machine learning methods to estimate the pose (orientation) of objects when being manipulated by a hand. Ref. [19] develops a large-scale tactile sensing system for a robotic link, named TacLINK, which features an elongated structure comprising a rigid transparent core enveloped by continuous artificial soft skin. The advantage of this artificial skin lies in its ability to provide tactile force feedback and to alter its form and stiffness through inflation at a low pressure. Ref. [20] introduces SonicSkin, a system that localizes on-robot human touch and estimates touch pressure using a single pair of piezoelectric transducers (one transmitter and one receiver) attached to the robot. In the contact test, SonicSkin achieves a localization error of less than 2 cm for 96.4% of touches. Ref. [21] introduces a tactile sensor that comprises overlapping air chambers, each constructed from soft material and sealed with an embedded barometer. These interconnected air chambers emulate the adaptive receptors found in human skin. Barometers within these chambers acquire a global receptive field of the contact surface through pressure propagation in the hyperelastic seal, enabling the skin to achieve a spatial resolution of 0.1 mm under optimal conditions on a 38 × 26 mm2 surface. Although employing tactile sensors often enhances the precision of collision or contact localization, these complex sensors are typically difficult to install in practical applications. Moreover, their lifespan is constrained by material properties and external load conditions, rendering them unsuitable for high-load and frequently contacted applications.
In addition to methods that use external tactile sensors for collision localization, there is another category of methods that are compatible with both external sensors and onboard sensors. Moreover, these methods typically employ sensors that are commonly available on the market, eliminating the need for complicated designs and manufacturing processes associated with tactile sensors. These methods place a greater emphasis on the analysis of collision data, hence being referred to as data-driven collision localization methods. Ref. [22] utilizes random forests (RFs) and multilayer perceptrons (MLPs) as machine learning models, combined with a generalized momentum-based approach, to achieve the detection and localization of external contacts. This study, by making assumptions about the form of collision forces, the direction of collision forces, and the collision contact scenarios, constructs a collision dataset that aligns with the real-world collision detection and localization requirements. Ref. [23] constructs a robot collision localization strategy based on collision vibration signals. The collision vibration data were collected by affixing four accelerometers to the external surface of the upper arm of a robot. Subsequently, a multiclass support vector machine (SVM) was trained to estimate the location of detected contact events based on the recorded vibration measurements. The experimental analysis results reveal that the root mean square error distance between the predicted and actual classification locations for this method is 82 mm. Similarly, Ref. [24] gathers collision vibration information by installing a one-dimensional accelerometer at the base joint and a three-dimensional accelerometer on the end effector. The estimation of which arm segment the collision occurred on is achieved through training an artificial neural network (ANN) classifier. These data-driven methods can be employed to not only estimate which arm segment a collision occurred on but also to determine the specific location of the collision within a local region on one link. However, in practical applications, the effectiveness of such methods depends on the design of appropriate data acquisition rules tailored to specific needs and requirements.
In the process of automatic charging for electric vehicles, situations arise where moderate plug-in offset compensation is needed due to visual failures. Relying solely on model-based collision localization methods often struggles to meet the accuracy demands for plug-in compensation in the cases of moderate offsets. Meanwhile, methods based on tactile skin create challenges in maintaining a high service life in scenarios characterized by high contact loads, frequent friction, and impact. In our previous work, we developed a data-driven approach combined with well-defined regional rules [9]. By analyzing collision vibration data at the end effector of the manipulator, we achieved estimates of the circumferential and radial regions of collision between the end effector and the charging port during the automatic charging plug-in process for electric vehicles. However, in practical applications, such relatively coarse estimates may not entirely meet the demands for the plug-in compensation caused by visual deviations. In this paper, we enhance the precision of robotic end effector collision localization by introducing more reasonable data collection rules tailored to the charging port. We also propose a data-driven model that aligns with the data collection rules to achieve higher collision localization accuracy. The primary contributions of this paper are as follows:
  • A collision point matrix template is introduced for the first time in the context of automatic charging scenarios for electric vehicles. By utilizing the collision point matrix template, the problem of estimating collision positions between the end effector of the robot and the charging port at different locations is effectively transformed into a problem of estimating collision positions at various points on the collision point matrix template. This transformation enables the high-precision collision localization of the end effector of the robot with respect to the charging port.
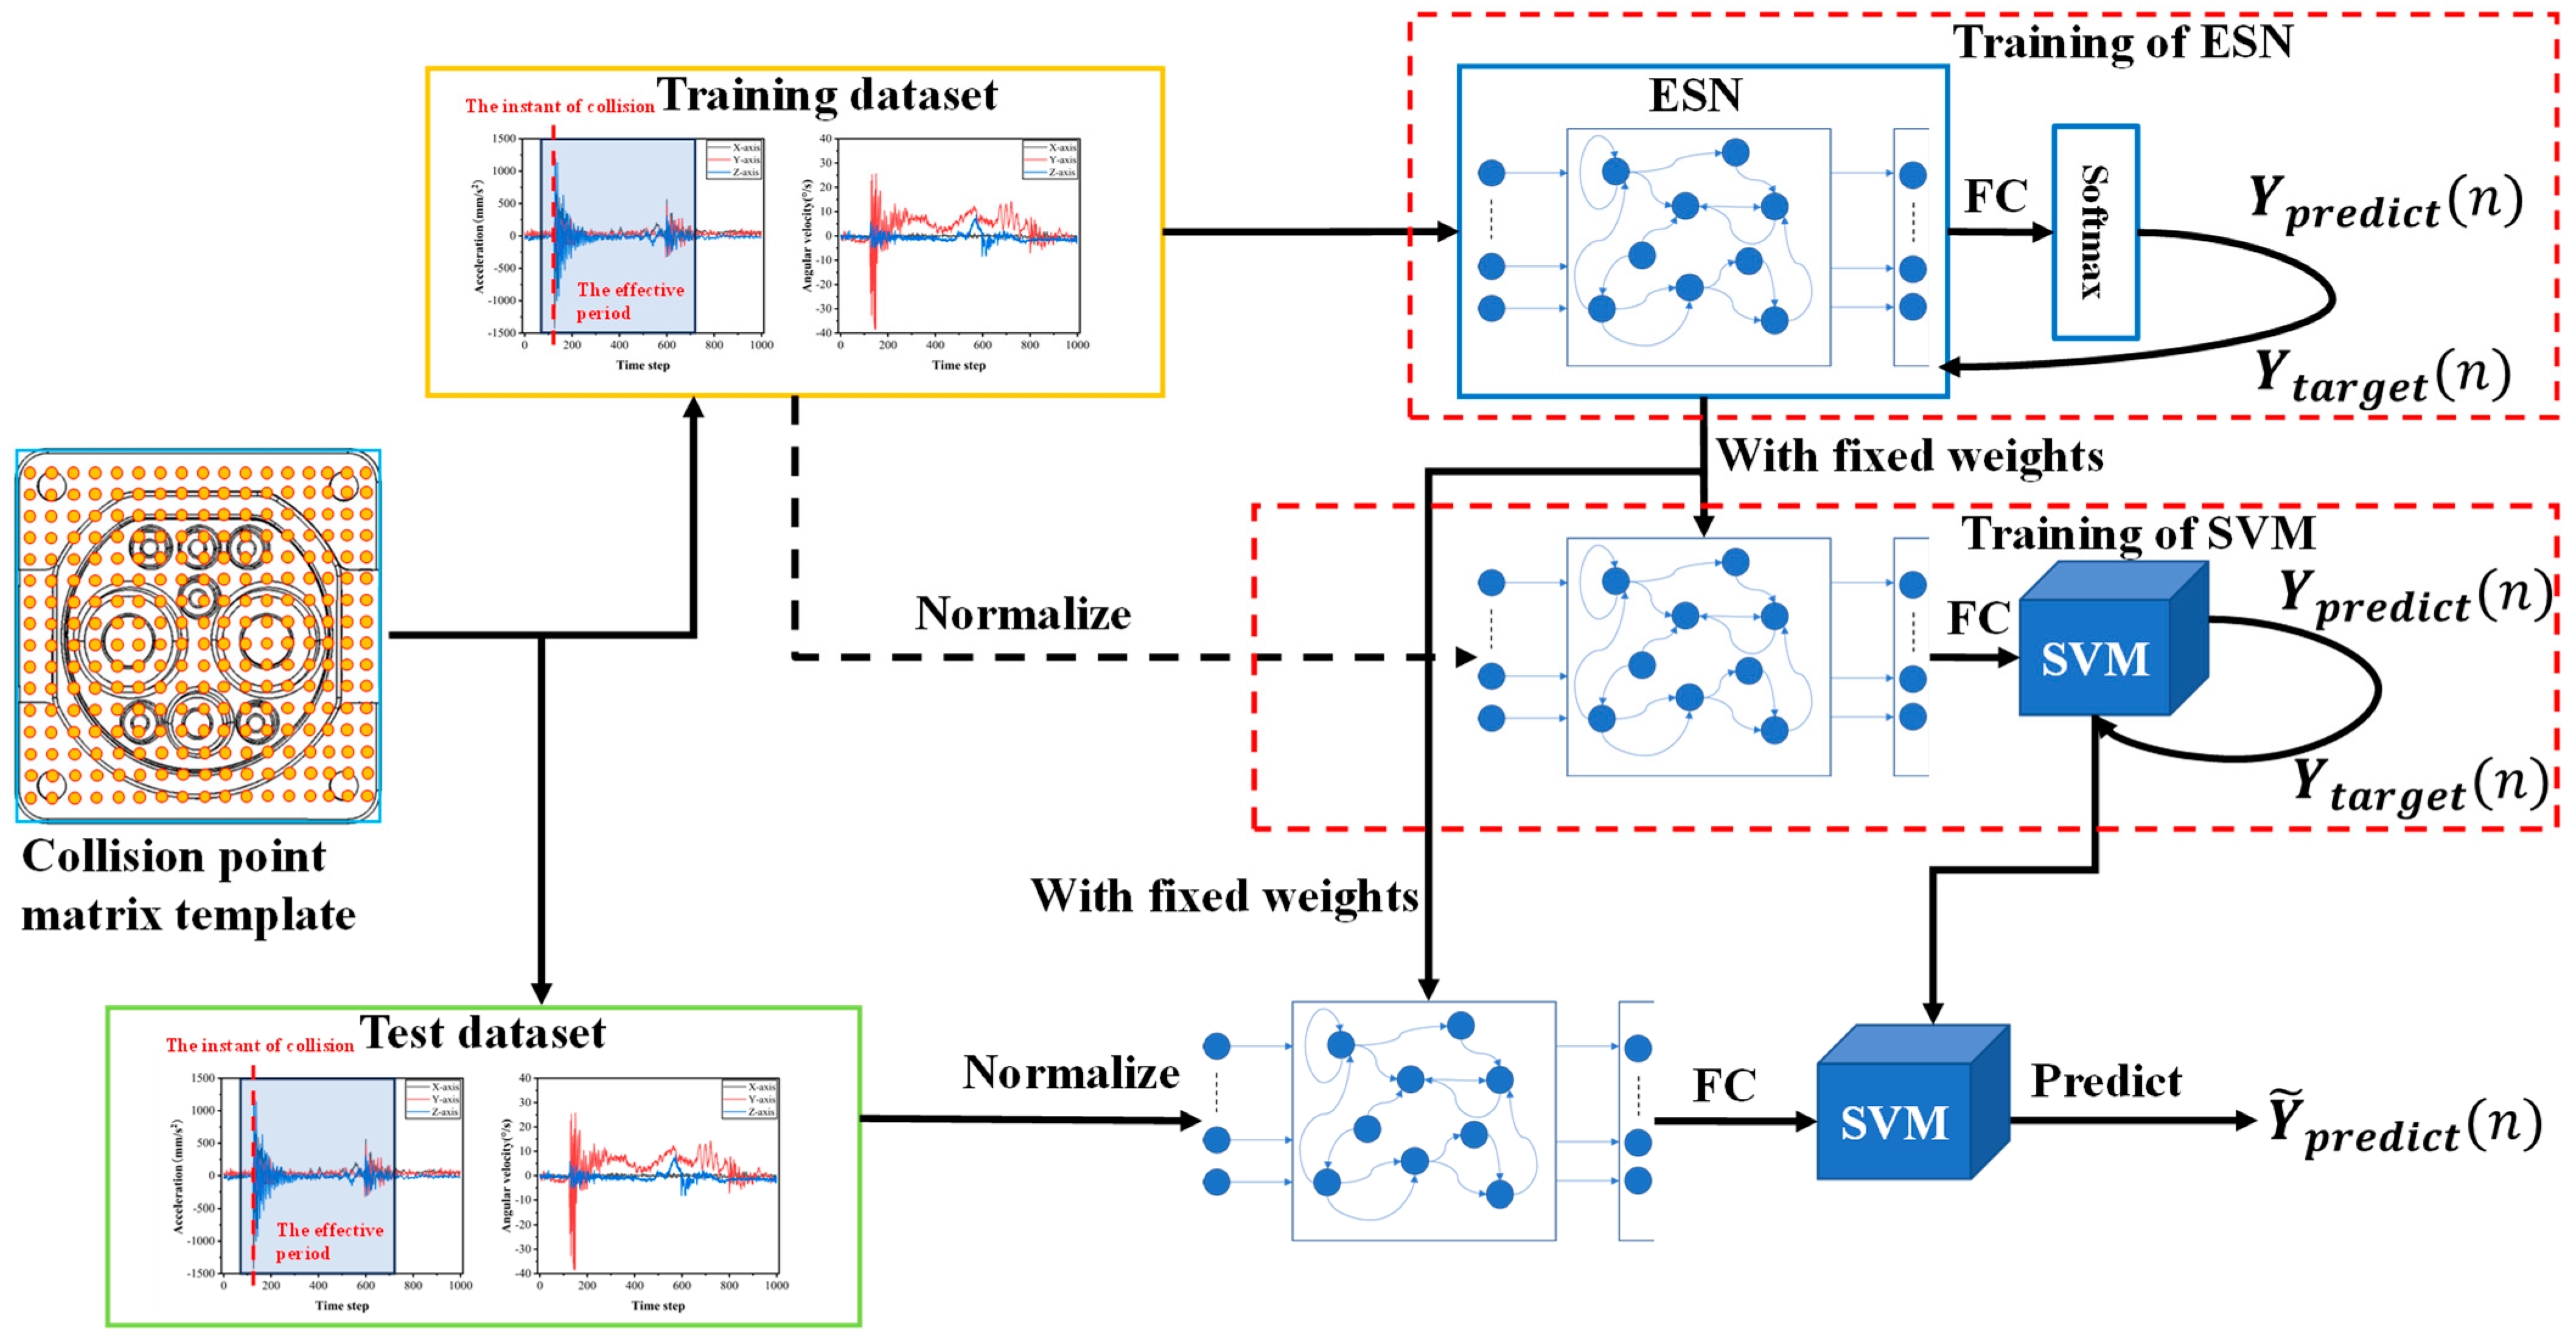
  • A collision localization model matching the collision point matrix template is proposed. The presented collision localization model integrates echo state network (ESN) and support vector machine (SVM) methods. The proposed method fully leverages the outstanding capability of the ESN in extracting features from time-series signals, while imparting desirable sparsity to the extracted features. By combining this with the SVM, which exhibits a strong affinity for sparse features, the model maintains an excellent classification performance. For the first time, this paper introduces the fusion of the integrated model with a collision point matrix template, achieving high-precision collision localization in the context of automatic charging for electric vehicles.

3. Materials and Methods

3.1. Collision Point Matrix Template

In this paper, we elucidate the design principles of the collision point matrix template by constructing an automatic charging simulation platform, as illustrated in Figure 1 (left). We simulate an automatic charging robot using the AUBO-i5 robotic arm, with a charger attached to the robot’s end effector through a flexible wrist. An IMU is mounted on the top of the charger to gather the vibration signal caused by collision. A test bench with rotating capability is employed to mimic an electric vehicle, and a charging port is installed on the top of the platform. During the plug-in process, the robot’s end effector typically moves in a linear manner to connect the charger with the charging port. In instances where there is a deviation in the precise localization using the visual system, a collision occurs between the face of the charger and the face of the charging port. The collision contact mode is approximately depicted in the form of contact in Figure 1 (right). From the figure, it can be observed that with varying deviations, the collision position, contact shape, and contact area between the face of the charger and the face of the charging port differ. These factors all influence the collision vibration signal and must be considered during the data collection process. Hence, in the data collection phase, defining a collision position description that encompasses these factors becomes essential.
While different deviations result in a diversity in collision position, and contact surface shape and area, the latter two have specific functional relationships with the relative position of the center of the charger and the plane of the face of the charging port. To precisely describe the contact situation and provide a unified data collection standard, we define the intersection of the central axis of the charger with the plane of the face of the charging port as the collision point, as shown in Figure 2. This description effectively expresses the collision position between the charger and the charging port, while implicitly conveying the shape and area of the contact surface. Based on this description, by virtually deploying collision points on the face of the charging port, forming a collision point matrix template, the collision localization problem can be transformed into a classification problem of the vibration information generated by different collision points. With a sufficiently dense distribution of collision points, it is possible to achieve high-precision localization of collision contact positions. Considering the inherent positioning accuracy of the robotic arm, a margin of 1 mm is set between adjacent points in this paper. To thoroughly explore the effectiveness of the proposed collision localization strategy, we ensure that the collision point matrix template fully covers the face of the charging port. Specifically, the designed collision point matrix template consists of 17 rows and 17 columns of collision points. With a total of 289 collision points in the template, we assign category labels to the collision points, ranging from 0 to 288 in the sample set. These labels are referred to as the location IDs of the collision points in this paper. The predictions for these labels will serve as the outputs for the classification models.

3.2. Dataset Description

In this study, all the data were collected using the IMU mounted on the top of the charger, with a sampling frequency of 1500 Hz. The charger was connected to the manipulator using a flexible wrist. Due to the very small deformation of the charger after collision, the collected data mainly included the vibration information from the flexible wrist and the manipulator. In the collision simulation experiment, the end effector of the manipulator moved in a straight line at a speed of 15 mm/s. To explore the upper limit of accuracy of the proposed method, we made the assumption that the collision occurs when the face of the charger is parallel to the face of the charging port. Based on this assumption, collisions are initiated at all collision points on the collision point matrix template with the same spatial pose, and the collision-induced vibration signals are collected. The typical form of collision-induced vibration signals is illustrated in Figure 3, where the number of sampling points is used as the x-axis, for ease of observation. Here, the “effective period” represents the actual data length used for training the model, which is defined as e p . An excessively long e p introduces more post-collision contact information, which may hinder the generalization ability of the proposed method. Conversely, an overly short e p contains insufficient contact process information, resulting in an inadequate localization capability. Based on the findings in [9], an e p of around 300 sampling points contains sufficient collision information for addressing collision localization problems. In this study, to reduce the impact of random factors, effective periods of lengths 290, 320, and 350 were used for training and testing the localization model. Additionally, it is worth noting that, to capture the signal changes from non-contact motion to the occurrence of collision, the effective period needs to include data from a period before the instant of collision. In this work, the length of pre-collision data is set to 50 sample points.
Although the flexible wrist can amplify vibration signals at the mechanical structure level, compared to rigid structures, the joint configuration of the manipulator may still affect collision analysis [9,24]. Therefore, we considered collecting the collision data of the manipulator under different joint configurations based on the collision template to create isolated training and testing datasets. To assess the portability of the proposed method in real-world application scenarios, we used encoders of the manipulator to determine joint configurations and the end effector’s pose. By adjusting the height of the lifting platform, we achieved nine different positions of the charging port, with each height interval being 20 mm. At each height, the collision point matrix template contained 289 collision points. This resulted in 289 different joint configurations for a single height, without considering the manipulator’s trajectory. However, recording these configurations directly became cumbersome with increasing height variations. Therefore, in this study, we chose to record the joint configurations when the charger coincided with the center of the charging port. The specific configurations are shown in Table 1. The joint configurations are measured by the joint encoders of the AUBO-i5 robot. Here, “height” refers to the vertical height of the end effector relative to the manipulator’s base. We defined the data obtained at each set of three adjacent heights as a dataset and named these datasets D1, D2, and D3. In addition, to enhance the reliability of single-point collision data in the template, each point in the template at different heights needs to undergo five collision experiments. As a result, D1, D2, and D3 each contain 4335 samples.

3.3. Framework of Collision Localization Method

In [24,25], artificial feature extraction methods are employed to extract features from vibration data. However, in relatively small regions, achieving effective classification of vibration information for very close collision locations is challenging due to the insufficient representational capacity of manually extracted features. To enhance the representational capacity of the extracted features and enable the proposed method to achieve collision localization within millimeter-level regions based on collision vibration signals, we propose a fusion method of echo state network (ESN) [25] and support vector machine (SVM) [26]. In this method, ESN is utilized for adaptive feature extraction from vibration signals. Due to the feedback process during feature extraction, this significantly improves the representational capacity of the extracted features for handling relevant issues. Additionally, we depart from the traditional approach of using Softmax as the output activation function at the network’s end, and instead employ the features extracted by ESN as an input for training SVM. This leads to the formation of a more powerful classifier.

3.3.1. Echo State Network (ESN)

The design inspiration for the echo state network (ESN) comes from the “echo state” phenomenon observed in biological neural networks, wherein past state information produces “echo” or “feedback” effects in the future, within dynamic systems. ESNs share a certain lineage with recurrent neural networks (RNNs), with a key difference lying in the ESN’s use of a dynamic reservoir to replace the explicit recursive structure in traditional RNNs, thereby enhancing the network’s ability to process medium- to long-term temporal information. The dynamic reservoir consists of numerous sparsely and randomly connected neurons, processing input signals through nonlinear transformations. This transformation induces the dynamic evolution of the reservoir, where the complete information transfer occurs through sparse connections between the information at each time step and the reservoir state from the previous time step. During the training process of the ESN, the reservoir weights are randomly initialized and remain unchanged throughout, avoiding the use of gradient descent for weight updates. This, to some extent, mitigates the issues of gradient vanishing and exploding. Additionally, the sparse connectivity enhances the model’s generalization capability. The general structure of the ESN is illustrated in Figure 4.
As illustrated in Figure 3, a typical model of an ESN can be represented as
h ( t ) = σ G ( W i n x ( t + 1 ) + W r e s h ( t ) + W o u t y ( t ) ) ,
where G ( · ) represents the non-linear activation function of the reservoir, and tanh ( · ) is commonly used; σ ( 0 ,   1 ] is the leakage rate; W i n , W r e s , and W o u t denote the weight matrix of the connections between the input layer and the reservoir, the weight matrix of the reservoir, and the weight matrix of the connections between the output layer and the reservoir, respectively; and x ( t ) , h ( t ) , and y ( t ) denote the input vector, the state vector of the reservoir, and the output vector, respectively, and when each of them is defined with dimensions N i , N r , and N o , these three variables can be expressed as
x ( t ) = ( x 1 ( t ) ,   x 2 ( t ) , , x N i ( t ) ) h ( t ) = ( h 1 ( t ) ,   h 2 ( t ) , , h N r ( t ) ) y ( t ) = ( y 1 ( t ) ,   y 2 ( t ) , , y N o ( t ) )
Unlike conventional neural networks, in an echo state network (ESN), not all elements are updated during the training process. W i n and W r e s are randomly initialized and remain unchanged throughout training. Only the W o u t from the reservoir layer to the output layer require updates in the ESN training process. Therefore, fundamentally, the training process of an ESN can be considered as a linear regression process, which, to some extent, reduces the risk of becoming stuck in local optima during parameter updates.

3.3.2. ESN–SVM Architecture

The framework of our proposed method is illustrated in Figure 5. Initially, the collision point matrix template is employed to acquire the robotic end effector collision vibration data, forming the training and test datasets. To ensure complete isolation between the test and training data, they should be obtained during different dynamic states of the robot. The specific data used for model construction consist of three-axis acceleration and three-axis angular velocity data collected by the inertial measurement unit (IMU). To eliminate scale differences between the different types of vibration signals, normalization is applied to the collision signals of each channel. The specific input data length is equal to the length of the e p mentioned in Section 3.2. In the training phase, we employ a stepwise optimization process to train the ESN–SVM model, involving two workflows: the automatic optimization of ESN weights and the training of the SVM classifier.
During the phase of the automatic optimization of ESN weights, we first initialize the relevant weights of the ESN, including the connection weights from the input layer to the reservoir and the internal connection weights within the reservoir. Next, we input the training samples one by one into the ESN, allowing them to pass through the input layer into the reservoir. Using the connection weights and the reservoir’s state transition function, we calculate the next time step’s state of the reservoir. Then, the state is used as a feature vector input to the output layer of the ESN and undergoes one fully connected (FC) layer for feature dimension reduction. We use the Softmax function to estimate the probability distribution of each point’s position, thereby obtaining the latent distribution information of the positions in the feature space. By comparing this probability distribution with the actual labels, we can evaluate the ESN weights. The evaluation results guide the automatic adjustment of ESN weights to more accurately capture useful information in the vibration signals. This automatic optimization process is an iterative one, gradually adapting the ESN to the task requirements and enhancing its capability for feature extraction and representation through repeated training and adjustments.
In the training process of the SVM model, the weights optimized automatically by ESN will be fixed. To maintain the overall consistency of the weights, the structure and parameters of the FC layer connected after ESN should be consistent with the relevant structure and parameters in the first workflow. This ensures a seamless integration between the ESN feature extraction process and the SVM model. The second workflow differs from the first one, primarily in replacing Softmax with SVM as the final classifier. This change allows us to fully leverage the classification capability of SVM, combining the high-quality features extracted by ESN with the decision boundary of SVM, thereby improving the overall model’s localization performance to some extent. More details about different components in trained ESN–SVM are shown in Table 2. Specific values for the representations in the table will be further discussed in the subsequent section.
In the evaluation process, to ensure that the test information does not leak during training, it is preferable to use test samples that are completely independent of the training data for a comprehensive assessment of the trained ESN–SVM model. This approach helps to avoid the influence of training data on the evaluation results, ensuring the objectivity of the assessment.

4. Experimental Results and Discussion

Before validating the collision localization method, the setting of the hyperparameters is crucial, as it directly affects the performance and training process of the model. We shuffled D1 and utilized 80% of the shuffled D1 data as the training set and 20% for testing to select reasonable hyperparameters. The objective of hyperparameter tuning is to optimize the model’s performance, which involves achieving the best trade-off between localization accuracy and parameter scale. The proposed collision localization method consists of two parts: one part is the ESN used for adaptive feature extraction, and the other part is the SVM used for predicting the final results. Since the collision vibration signal, after passing through the ESN, results in initially high-dimensional features, directly inputting such high-dimensional features into the SVM for analysis would lead to an extremely slow processing speed. Therefore, after the ESN layer, the model introduces an FC network to better adapt the feature dimensions extracted by ESN to the requirements of SVM. In addition, to compare and validate the adaptability of the proposed model with the collision point matrix template, this work adopts common recurrent neural networks (RNNs), including long short-term memory (LSTM) networks and gated recurrent units (GRUs) [27], as feature extractors for comparison. Both of these use the same single-layer structure as the ESN during usage, and the parameters of the FC network attached afterward are also the same. When setting the model’s hyperparameters, it is common to construct a reasonable hyperparameter search space, which helps limit the search range and improve search efficiency. In the hyperparameter tuning process, we initially optimized parameters for ESN, LSTM, and GRU combined with Softmax, respectively. Subsequently, we fixed the parameters of the aforementioned networks and focused on the selection of optimal parameters for SVM. To maintain a certain degree of fairness in the comparison, we utilized the average localization accuracy of ESN, LSTM, and GRU combined with SVM as metrics to guide the selection of optimal SVM parameters. During the practical implementation, we explored different values for hyperparameters based on the hyperparameter search space, testing from lower to higher parameter scales. To compare the performance of different parameter combinations, we conducted training on the dataset with five shuffles, obtaining average accuracy for comparison. If the average accuracy of a new parameter combination exceeded the previous one by more than 0.25%, we retained the new parameter combination, continuing this process until the entire screening was complete. The final specific hyperparameter settings are presented in Table 3.
In [24], the accuracy and the deviation of collision localization are utilized to evaluate the effectiveness of collision localization methods. This paper follows the same approach to assess the proposed collision localization method. In this section, 80% of the shuffled D1 is used as the training set, and 20% is used as the validation set. The proposed model and comparative models are trained using a five-fold cross-validation. For testing, two separate datasets, D2 and D3, isolated from D1, are used to evaluate the effectiveness of the proposed method. The results of the average accuracy of collision localization are shown in Figure 6. From the graph, it is evident that the fusion methods with SVM outperform the non-fusion methods in terms of localization accuracy for different e p s. The proposed ESN–SVM method achieves a collision localization accuracy exceeding 90% on both the D2 and D3 test sets, outperforming the LSTM–SVM and GRU–SVM methods. Additionally, a comparison between D2 and D3 reveals that models trained on a certain joint configuration exhibit some differences in collision localization performance under different joint configurations. It is noticeable that the collision localization model trained on D1 performs significantly better in D2 than in D3, mainly due to the smaller differences in joint configurations between D1 and D2 compared to D1 and D3. Moreover, there are notable differences in collision localization accuracy between the proposed method and the comparison methods across different testing sets: the maximum difference in collision localization accuracy exhibited by ESN–SVM, LSTM–SVM, and GRU–SVM on D2 and D3 test sets, for different e p s, is 3.39%, 6.76%, and 6.26%, respectively, and the average difference in collision localization accuracy is 3.29%, 6.31%, and 5.25%, respectively. This suggests that ESN–SVM performs consistently better than LSTM–SVM and GRU–SVM on both D2 and D3 test sets. It indicates that in collision localization datasets with certain distribution differences, ESN–SVM exhibits stronger robustness and generalization capabilities compared to other fusion methods. From another perspective, it highlights that ESN–SVM, along with the proposed collision point matrix template, demonstrates better adaptability to collision localization in electric vehicle charging scenarios.
Furthermore, a qualitative analysis of collision localization deviations for the fusion methods is conducted. Since the size of the traditional confusion matrix will grow squarely as the number of categories increases, in the collision localization problem, due to the large number of individual categories, the traditional confusion matrix will become very large, making it difficult to visually display the performance of the model in relation to different individual categories. The proposed variant of the confusion matrix utilizes a three-dimensional bar heatmap to represent non-diagonal confusion in the traditional confusion matrix. This approach provides a clear and intuitive visualization of collision localization deviations. Figure 7 shows the variant confusion matrix obtained by testing the fusion methods on D2 and D3. The figure illustrates that, for the proposed method and the compared fusion methods, confusion is primarily concentrated near the diagonal, indicating that collision localization deviations mainly occur between individual locations and their adjacent locations. This is attributed to the higher similarity in vibration signals caused by collisions in neighboring locations, posing a greater challenge for fusion collision localization methods in these scenarios. Additionally, the overall confusion level for the fusion model on D2 is weaker compared to D3, further confirming that variations in joint configurations do indeed impact collision localization.
Although the qualitative analysis of collision localization deviation helps one to understand the overall distribution of confusion among predicted locations, in practical applications, specific quantification of localization deviations and understanding the magnitude of these deviations are essential for guiding the use of collision localization strategies. In our work, quantitative analysis of localization deviations focuses on the fusion methods. Here, we selected the same models as in the qualitative analysis. The detailed results are presented in Table 4, which primarily displays the maximum deviation and root mean square error (RMSE) of collision localization. When comparing the three methods, it is evident that ESN–SVM outperforms LSTM–SVM and GRU–SVM overall, in terms of RMSE and maximum deviation in collision localization. This result indicates that the features extracted based on the ESN method have the best compatibility with SVM, making them more suitable for collision localization scenarios based on the collision vibration signals. Additionally, it is important to note that when using the ESN–SVM method, the minimum value of the maximum deviation is 13.6 mm. This implies that even with deviations, the proposed method may still lead to instances of charging failure. Therefore, to ensure safety, the proposed collision localization method should be used in conjunction with appropriate collision protection methods.

5. Conclusions

In this study, we propose a novel data-driven collision localization method for the end effector of a manipulator using ESN and SVM. During the data collection process, we design a collision point matrix template suitable for automatic charging plug-in, transforming the problem of collision localization during the charging plug-in process into a classification task of collision vibration signals corresponding to different collision points. By utilizing the data collected through the collision point matrix template, which contains collision position information, we train the proposed ESN–SVM collision localization model. This model demonstrates an ability to effectively estimate collision contact positions under the different geometric characteristics of the manipulator, without requiring manual intervention in the feature extraction process. Simulated experimental results show promising value in locating collision positions during the charging plug-in process.
Generally, the method proposed in this paper achieves high-precision collision localization based on contact. In terms of collision localization accuracy, the proposed method achieves an average accuracy of 95.85%, significantly higher than non-fusion methods, indicating that the fusion approach contributes to enhancing the localization performance. In comparison with other fusion models, it is also evident that the collision localization accuracy varies less under different joint configurations, demonstrating that the ESN combined with SVM exhibits better generalization capabilities and stronger robustness compared to other fusion methods. Regarding localization deviation, the proposed ESN–SVM method demonstrates a minimal localization RMSE of only 0.83 mm, presenting a significant advantage over other fusion methods in terms of localization deviation. This suggests that the ESN-SVM model, in conjunction with the collision point matrix template, is more suitable for the charging plug-in collision localization problem.
It should be noted that, although the proposed method, on average, achieves an accurate estimation of collision location, there are instances where the method may fail to provide effective compensation for system deviations, as indicated by the maximum estimated deviation. Therefore, in future work, we will conduct targeted research on collision protection strategies tailored to the proposed collision localization method, aiming to enhance the safety of the charging plug-in process.

Author Contributions

H.L. developed the methodology; H.L. and Y.L. conceived and designed the experiment; P.Q. and Z.L. conducted the data curation and collection; H.L. wrote the original draft of the paper; S.D. and D.W. reviewed and edited the paper. All authors have read and agreed to the published version of the manuscript.

Funding

This research received no external funding.

Institutional Review Board Statement

Not applicable.

Informed Consent Statement

Not applicable.

Data Availability Statement

The data mentioned in this paper are provided.

Conflicts of Interest

The authors declare no conflicts of interest.

References

  1. Lou, Y.; Di, S. Design of a Cable-Driven Auto-Charging Robot for Electric Vehicles. IEEE Access 2020, 8, 15640–15655. [Google Scholar] [CrossRef]
  2. Bdiwi, M.; Suchy, J.; Jockesch, M.; Winkler, A. Improved Peg-in-Hole (5-Pin Plug) Task: Intended for Charging Electric Vehicles by Robot System Automatically. In Proceedings of the 2015 IEEE 12th International Multi-Conference on Systems, Signals & Devices (SSD15), Mahdia, Tunisia, 1–5 March 2015. [Google Scholar]
  3. Doumbia, M.; Cheng, X.; Havyarimana, V. An Auto-Recharging System Design and Implementation Based on Infrared Signal for Autonomous Robots. In Proceedings of the 2019 5th International Conference on Control, Automation and Robotics (ICCAR), Beijing, China, 19–22 April 2019; pp. 894–900. [Google Scholar]
  4. Quan, P.; Lou, Y.; Lin, H.; Liang, Z.; Di, S. Research on Fast Identification and Location of Contour Features of Electric Vehicle Charging Port in Complex Scenes. IEEE Access 2022, 10, 26702–26714. [Google Scholar] [CrossRef]
  5. Pan, M.; Sun, C.; Liu, J.; Wang, Y. Automatic Recognition and Location System for Electric Vehicle Charging Port in Complex Environment. IET Image Process 2020, 14, 2263–2272. [Google Scholar] [CrossRef]
  6. Quan, P.; Lou, Y.; Lin, H.; Liang, Z.; Wei, D.; Di, S. Research on Fast Recognition and Localization of an Electric Vehicle Charging Port Based on a Cluster Template Matching Algorithm. Sensors 2022, 22, 3599. [Google Scholar] [CrossRef] [PubMed]
  7. Sun, C.; Pan, M.; Wang, Y.; Liu, J.; Huang, H.; Sun, L. Method for Electric Vehicle Charging Port Recognition in Complicated Environment Based on CNN. In Proceedings of the 2018 15th International Conference on Control, Automation, Robotics and Vision (ICARCV), Singapore, 18–21 November 2018; pp. 597–602. [Google Scholar]
  8. Zhang, H.; Zhu, W.; Huang, Y. A Research on the Control Strategy of Automatic Charging Robot for Electric Vehicles Based on Impedance Control. J. Phys. Conf. Ser. 2022, 2303, 012085. [Google Scholar] [CrossRef]
  9. Lin, H.; Quan, P.; Liang, Z.; Lou, Y.; Wei, D.; Di, S. Collision Localization and Classification on the End-Effector of a Cable-Driven Manipulator Applied to EV Auto-Charging Based on DCNN–SVM. Sensors 2022, 22, 3439. [Google Scholar] [CrossRef]
  10. Haddadin, S.; De Luca, A.; Albu-Schaffer, A. Robot Collisions: A Survey on Detection, Isolation, and Identification. IEEE Trans. Robot. 2017, 33, 1292–1312. [Google Scholar] [CrossRef]
  11. de Luca, A.; Mattone, R. Sensorless Robot Collision Detection and Hybrid Force/Motion Control. In Proceedings of the 2005 IEEE International Conference on Robotics and Automation, Barcelona, Spain, 18–22 April 2005; pp. 999–1004. [Google Scholar]
  12. De Luca, A.; Albu-Schaffer, A.; Haddadin, S.; Hirzinger, G. Collision Detection and Safe Reaction with the DLR-III Lightweight Manipulator Arm. In Proceedings of the 2006 IEEE/RSJ International Conference on Intelligent Robots and Systems, Beijing, China, 9–15 October 2006; pp. 1623–1630. [Google Scholar]
  13. De Luca, A.; Mattone, R. Actuator Failure Detection and Isolation Using Generalized Momenta. In Proceedings of the 2003 IEEE International Conference on Robotics and Automation (Cat. No.03CH37422), Taipei, Taiwan, 14–19 September 2003; Volume 1, pp. 634–639. [Google Scholar]
  14. Buondonno, G.; De Luca, A. Combining Real and Virtual Sensors for Measuring Interaction Forces and Moments Acting on a Robot. In Proceedings of the 2016 IEEE/RSJ International Conference on Intelligent Robots and Systems (IROS), Daejeon, Republic of Korea, 9–14 October 2016; pp. 794–800. [Google Scholar]
  15. Vorndamme, J.; Schappler, M.; Haddadin, S. Collision Detection, Isolation and Identification for Humanoids. In Proceedings of the 2017 IEEE International Conference on Robotics and Automation (ICRA), Singapore, 29 May–3 June 2017; IEEE: Singapore, 2017; pp. 4754–4761. [Google Scholar]
  16. Iskandar, M.; Eiberger, O.; Albu-Schaffer, A.; Luca, A.D.; Dietrich, A. Collision Detection, Identification, and Localization on the DLR SARA Robot with Sensing Redundancy. In Proceedings of the 2021 IEEE International Conference on Robotics and Automation (ICRA), Xi’an, China, 30 May–5 June 2021. [Google Scholar]
  17. Dahiya, R.S.; Mittendorfer, P.; Valle, M.; Cheng, G.; Lumelsky, V.J. Directions Toward Effective Utilization of Tactile Skin: A Review. IEEE Sens. J. 2013, 13, 4121–4138. [Google Scholar] [CrossRef]
  18. Prado Da Fonseca, V.; Alves De Oliveira, T.E.; Petriu, E.M. Estimating the Orientation of Objects from Tactile Sensing Data Using Machine Learning Methods and Visual Frames of Reference. Sensors 2019, 19, 2285. [Google Scholar] [CrossRef] [PubMed]
  19. Van Duong, L.; Ho, V.A. Large-Scale Vision-Based Tactile Sensing for Robot Links: Design, Modeling, and Evaluation. IEEE Trans. Robot. 2021, 37, 390–403. [Google Scholar] [CrossRef]
  20. Fan, X.; Lee, D.; Jackel, L.; Howard, R.; Lee, D.; Isler, V. Enabling Low-Cost Full Surface Tactile Skin for Human Robot Interaction. IEEE Robot. Autom. Lett. 2022, 7, 1800–1807. [Google Scholar] [CrossRef]
  21. Li, X.; Zhang, Y.; Xie, X.; Li, J.; Shi, G. Improving Robotic Tactile Localization Super-Resolution via Spatiotemporal Continuity Learning and Overlapping Air Chambers. In Proceedings of the AAAI Conference on Artificial Intelligence, Washington, DC, USA, 7–14 February 2023; Volume 37, pp. 6192–6199. [Google Scholar] [CrossRef]
  22. Zwiener, A.; Geckeler, C.; Zell, A. Contact Point Localization for Articulated Manipulators with Proprioceptive Sensors and Machine Learning. In Proceedings of the 2018 IEEE International Conference on Robotics and Automation (ICRA), Brisbane, Australia, 21–25 May 2018; pp. 323–329. [Google Scholar]
  23. McMahan, W.; Romano, J.M.; Kuchenbecker, K.J. Using Accelerometers to Localize Tactile Contact Events on a Robot Arm. In Proceedings of the Workshop on Advances in Tactile Sensing and Touch-Based Human-Robot Interaction, ACM/IEEE International Conference on Human-Robot Interaction, Boston, MA, USA, 5–8 March 2012. [Google Scholar]
  24. Min, F.; Wang, G.; Liu, N. Collision Detection and Identification on Robot Manipulators Based on Vibration Analysis. Sensors 2019, 19, 1080. [Google Scholar] [CrossRef] [PubMed]
  25. Jaeger, H. Adaptive Nonlinear System Identification with Echo State Networks. In Advances in Neural Information Processing Systems 15; MIT Press: Cambridge, MA, USA, 2003; pp. 593–600. [Google Scholar]
  26. Cortes, C.; Vapnik, V. Support-Vector Networks. Mach. Learn. 1995, 20, 273–297. [Google Scholar] [CrossRef]
  27. Mahjoub, S.; Chrifi-Alaoui, L.; Marhic, B.; Delahoche, L. Predicting Energy Consumption Using LSTM, Multi-Layer GRU and Drop-GRU Neural Networks. Sensors 2022, 22, 4062. [Google Scholar] [CrossRef]
Figure 1. Contact form of collisions during the charging plug-in process.
Electronics 13 00638 g001
Figure 2. Illustration of the collision point matrix template.
Electronics 13 00638 g002
Figure 3. Waveform of a typical collision point.
Electronics 13 00638 g003
Figure 4. ESN architecture flowchart.
Electronics 13 00638 g004
Figure 5. Framework of the proposed collision localization method.
Electronics 13 00638 g005
Figure 6. Collision localization accuracy of the proposed method and comparison methods. (a) ep is 290; (b) ep is 320; (c) ep is 350.
Electronics 13 00638 g006
Figure 7. Variant confusion matrix for collision localization. (a) Test on D2 using ESN–SVM; (b) Test on D3 using ESN–SVM; (c) Test on D2 using LSTM–SVM; (d) Test on D3 using LSTM–SVM; (e) Test on D2 using GRU–SVM; (f) Test on D3 using GRU–SVM.
Electronics 13 00638 g007
Table 1. Joint configuration of the datasets.
DatasetJoint 1 (°)Joint 2 (°)Joint 3 (°)Joint 4 (°)Joint 5 (°)Joint 6 (°)Height (mm)
−73.56−14.395.9109.2473.84−1.371047
D1−73.62−15.397.88112.2273.9−1.371027
−73.68−16.4499.72115.273.95−1.381007
−73.73−17.72101.41118.1874.01−1.38987
D2−73.79−19.15102.97121.1674.07−1.38967
−73.85−20.7104.38124.1274.13−1.38947
−73.91−22.39105.64127.0774.19−1.38927
D3−73.97−24.22106.75130.0174.24−1.38907
−74.03−26.16107.71132.9274.3−1.38887
Table 2. Details about different components in trained ESN–SVM.
ComponentParametersRepresentations
Input layerInput shape( e p , 6)
ESNReservoir neurons N r
Spectral ρ
Leakage rate σ
Flatten--
FC layerHidden units1024
SVMRegularization parameterC
Kernel function-
Table 3. Hyperparameters of the models.
ModelHyperparameterParameter Search SpaceOptimum Parameter
Reservoir neurons N r 25, 26, 27, 2826
ESNSpectral ρ 0.5, 0.6, …, 11
Leakage rate σ 0.1, 0.2, …, 0.50.5
LSTMHidden units N l 25, 26, 27, 2827
GRUHidden units N g 25, 26, 27, 2827
SVMRegularization parameter C1, 10, 100, 1000100
Kernel function“linear”, “rbf”, “sigmoid”“rbf”
Table 4. Predicted offset: proposed method vs. comparison method (mm).
ModelMetricD2–290D2–320D2–350D3–290D3–320D3–350
ESN–SVMMaximum13.6015.5213.0416.4014.4216.55
RMSE0.880.830.881.151.121.40
LSTM–SVMMaximum14.4216.9716.9716.1215.6216.16
RMSE1.271.121.081.641.421.66
GRU–SVMMaximum15.5217.0317.6916.2817.6917.69
RMSE1.161.811.702.022.112.15
Disclaimer/Publisher’s Note: The statements, opinions and data contained in all publications are solely those of the individual author(s) and contributor(s) and not of MDPI and/or the editor(s). MDPI and/or the editor(s) disclaim responsibility for any injury to people or property resulting from any ideas, methods, instructions or products referred to in the content.

