Article

RFID-Based Localization System for Monitoring the Dispersal of Oak Acorns

by
Maciej Ciężkowski
1,*,
Piotr Jankowski-Mihułowicz
2,* and
Kacper Skrobacz
2
1
Automatic Control and Robotics Department, Faculty of Electrical Engineering, Bialystok University of Technology, Wiejska St. 45C, 15-351 Bialystok, Poland
2
Department of Electronic and Telecommunications Systems, Rzeszów University of Technology, ul. Wincentego Pola 2, 35-959 Rzeszów, Poland
*
Authors to whom correspondence should be addressed.
Electronics 2024, 13(3), 567; https://doi.org/10.3390/electronics13030567
Submission received: 28 December 2023 / Revised: 27 January 2024 / Accepted: 29 January 2024 / Published: 30 January 2024
(This article belongs to the Special Issue RF/Microwave Device and Circuit Integration Technology)

Abstract

:
Radio techniques are widely used in wildlife tracking. Currently, the most common tracking methods include radio tracking (operating on Very high frequency (VHF) and Ultra high frequency (UHF)), satellite tracking (e.g., Argos satellite Doppler-based positioning system), and Global Navigation Satellite System (GNSS) tracking. One of the radio tracking systems is the Radio-Frequency Identification (RFID) system, characterized by small dimensions and a long operational period due to energy-efficient features. The advantages of RFID make it possible to apply this technique to track oak acorns in the process of zoochoric dispersal. In our study, we explored the potential applications of RFID systems for monitoring the dispersal of oak acorns. We developed a tracking system based on a semi-passive RFID tag, which we tested under laboratory and quasi-realistic conditions. The obtained results confirm the feasibility of using our system in radio tracking small objects such as oak acorns.

1. Introduction

A very valuable source of information on the behavior of animals is the observation of their movements in everyday life or the monitoring of their migratory processes. A well-known method of tracking animals is the so-called ringing method, which has made it possible to observe individuals tagged in this way. The ringing technique, however, requires physical contact with the animal at least at two times: when the ring is applied and when it is read, which can be awkward and stressful for both the observer and the animal. Developments in RF techniques have made it possible to track animals much more effectively. These techniques use RF transmitters placed on animals, which are then tracked using antenna systems (usually directional). The first radiolocation system was used in 1963 to monitor the behavior of rabbits, skunks and raccoons where a transistor transmitter with a dipole antenna and a military BC-453 radio receiver were used [1]. Currently, the most common tracking methods include radio tracking (operating on VHF and UHF frequencies), satellite tracking (e.g., Argos satellite Doppler-based positioning system) and Global Navigation Satellite System (GNSS) tracking [2,3,4]. The wildlife radio tracking system consists of two devices: transmitter and receiver. The tracked object has a radio transmitter that sends a signal. This signal is received by a second device—a VHF/UHF receiver. The receiver can be stationary or mobile (moved in a car, airplane/drone or handheld). Satellite tracking involves sending data to satellites via a transmitter mounted on the object being tracked. The data collected by the satellite system is made available to the user for a fee [5]. GNSS tracking, on the other hand, uses commonly used satellite navigation receivers.
The development of autonomous vehicles (especially unmanned aircraft systems) has improved the radio tracking process because it allows the VHF/UHF receiver to be placed right on the autonomous drone [6]. Thus, for example, Mesquitaa et al. [7] proposed a user-friendly system combining drones, smartphones and tags using Bluetooth and UWB (Ultra-Wideband) signals, which could be used for wildlife tracking. In their research, they used very small and lightweight AirTags that were tracked using an autonomous drone and a user with a smartphone independently. Another example of the use of drones can be found in the work of Desrochers et al. [8], which examined the use of drones to determine the position of tracked objects in hard-to-reach areas (hilly and dense boreal forest in southern Québec, Canada).
Most wildlife tracking studies use commercial tracking systems. The abundance of these systems makes it possible to purchase one that is suitable for specific purposes (appropriate weight, range and operating time related to battery life). There are also designs for lightweight low-cost tracking systems. One of these is an automatic and open-source radio-tracking system for small animals, which can track objects up to about 190 m away [9].

1.1. RFID Techniques in Wildlife Tracking

An increasingly common technique in VHF/UHF radio tracking wildlife is the RFID (Radio-Frequency Identification) technique. RFID systems consist of transponders (so-called tags) that transmit their own unique identification code to readers called RWD (Read Write Device) [10,11]. An important classification of RFID tags is the distinction according to the power supply of the transponder. A distinction is made between passive and active transponders. Passive transponders have no power source of their own. They use the energy emitted by the reader in the form of an electromagnetic wave both to power their own microchip and to transmit data back to the reader. Active transponders, on the other hand, have their own power supply (usually in the form of a battery). The electromagnetic field emitted by the reader is no longer needed to power the chip, so the EM field can be much weaker than that required to operate a passive tag. There is also a subtype of passive tag, the so-called semi-passive transponder. Semi-passive tags, also known as battery-assisted passive tags (BAP) or battery-assisted tags (BAT), have their own power supply to power the chip only. However, like a passive tag, they have no active transmitter. This means that they still need energy emitted by the reader to communicate with the reader (they use so-called backscattering). The use of a semi-passive tag therefore allows the transmitter to increase its operating range because it is more sensitive (i.e., it needs less energy from the reader than a passive tag to activate). The unquestionable advantage of using RFID tags in tracking is their very small size and long operating time (in the case of passive tags we can even talk about infinite time; in the case of semi-passive tags it is months or years).The disadvantage, however, may be a shorter tracking range than classic radio transmitters.
RFID tracking techniques are used to track farm animals such as cows, horses, pigs, etc., as well as for wildlife, such as deer lions, beavers, etc. There are also RFID techniques for tracking fish, especially salmon [12]. An example of wildlife tracking where limitations to the size of the transmitter are of huge importance is mouse tracking using RFID techniques both in laboratory conditions [13] as well as in the natural environment in the wild [14]. In both examples the RFID passive tags were implanted subcutaneously in the neck region of the mouse. An example of long-term wildlife RFID tracking is the monitoring of beavers tagged with passive tag implants during the period from June 2018 to July 2019 where the stationary reader has been installed in beaver lodges [15]. Due to the limited range of the RFID system, a network of RWD readers can be used instead of a single reader. An example of such a network is a system for tracking badgers equipped with RFID collars over an area of about 1.2 km 2 [16]. In addition to commercial RFID systems, there are also open-source low-cast solutions. One of them is the WildWID system consisting of active tags placed on wild animals (lions and koalas) that send data to a logger equipped with a GSM module for data transmission [17].

1.2. Radio-Tracking Techniques in Acorn Dispersal

An interesting phenomenon in nature is the zoochoric spread of oak acorns [18]. Acorns can be spread by gravity, water and wind, but it turns out in most cases they are spread by animals—this process is called zoochory [19,20]. In the case of oak, the animals that spread acorns are jays. Because of their small size, bird-dispersed seeds are difficult to track, especially when spread over long distances.
As it turns out, the radio tracking techniques have also been applied in this wildlife research area. An example of research using radio-tracking of oak acorns is a study conducted in 2004 in Spain [21]. In this experiment, the TW-4 Biotrack VHF radio transmitters (weight: 2.2 g, battery life: approximately three months) with the antenna coiled inside were implanted into selected acorns. The acorns were then closed and sealed with superglue. The location of the acorns (previously placed in feeders, from where they were spread by jays) was carried out using a ‘Mariner 57’ portable radio receiver. During testing, it was found that signal detection was lower (typically tens of metres) than transmitter specifications (hundreds of metres) due to the fact that the transmitter antenna was coiled inside the acorn. The average range of acorn dispersal by jays was 68.6 m (90% of acorns were within 149.60 m of the feeder), so that the reduced detection range (caused by antenna coiling) was not a major handicap. Other seed tracking experiments used TXA-001G radio transmitters produced by Telenax™, Queretaro, Mexico (small 0.5 g devices equipped with a 13 cm flexible antenna) [22,23]. The transmitters broadcast a signal in the VHF band on several different frequencies ranging from 150 to 151 MHz. This time the antenna was left unfurled outside the acorn, which, it turned out, did not arouse the jays suspicions. This study confirmed that the average range of acorn dispersal by jays is less than 100 m.

1.3. Our Motivations and Contributions

Taking into account the results of the acorn radio tracking experiments (in particular the average spread range of about 100 metres), we decided to investigate the possibility of using the RFID technique in the acorn radio tracking. The advantage of using RFID technology can be the uniqueness of each tag being tracked (provided by a unique ID number) rather than a finite number of transmit frequencies in a specific band. Another advantage in favour of RFID is the battery life, which can be counted in years (and practically unlimited in the case of passive tags). The last important issue is the legal conditions for the use of the frequency band in the 150 to 151 MHz range in European Union countries: according to EU telecommunications law, this band is not available for radio tracking purposes, while the 865–868 MHz frequency band can be used for RFID purposes with a transmission power of up to 2 Watts [24].
To verify the feasibility of using the RFID system for tracking, we selected and constructed RFID tags, which we then tested in an anechoic chamber. On the basis of the tests in the chamber, we selected one RFID tag, which we equipped with a sound indicator and then tested under quasi-real conditions. The results obtained confirmed the applicability of the RFID technology in acorn dispersal tracking.
The paper is organised as follows: Section 2 describes the method to determine the range of the RFID system, presents the tags used in the experiment and describes the conditions under which the experiments were carried out; Section 3 presents the experimental results obtained under laboratory conditions (anechoic chamber) and results from experiments under quasi-real conditions; the final Section 4 contains a discussion of the presented results, as well as the conclusions drawn from these results.

2. Materials and Methods

This chapter provides information on the methodology used to determine the operating range of the RFID system. It also describes the experimental methods used to test the selected RFID tags.

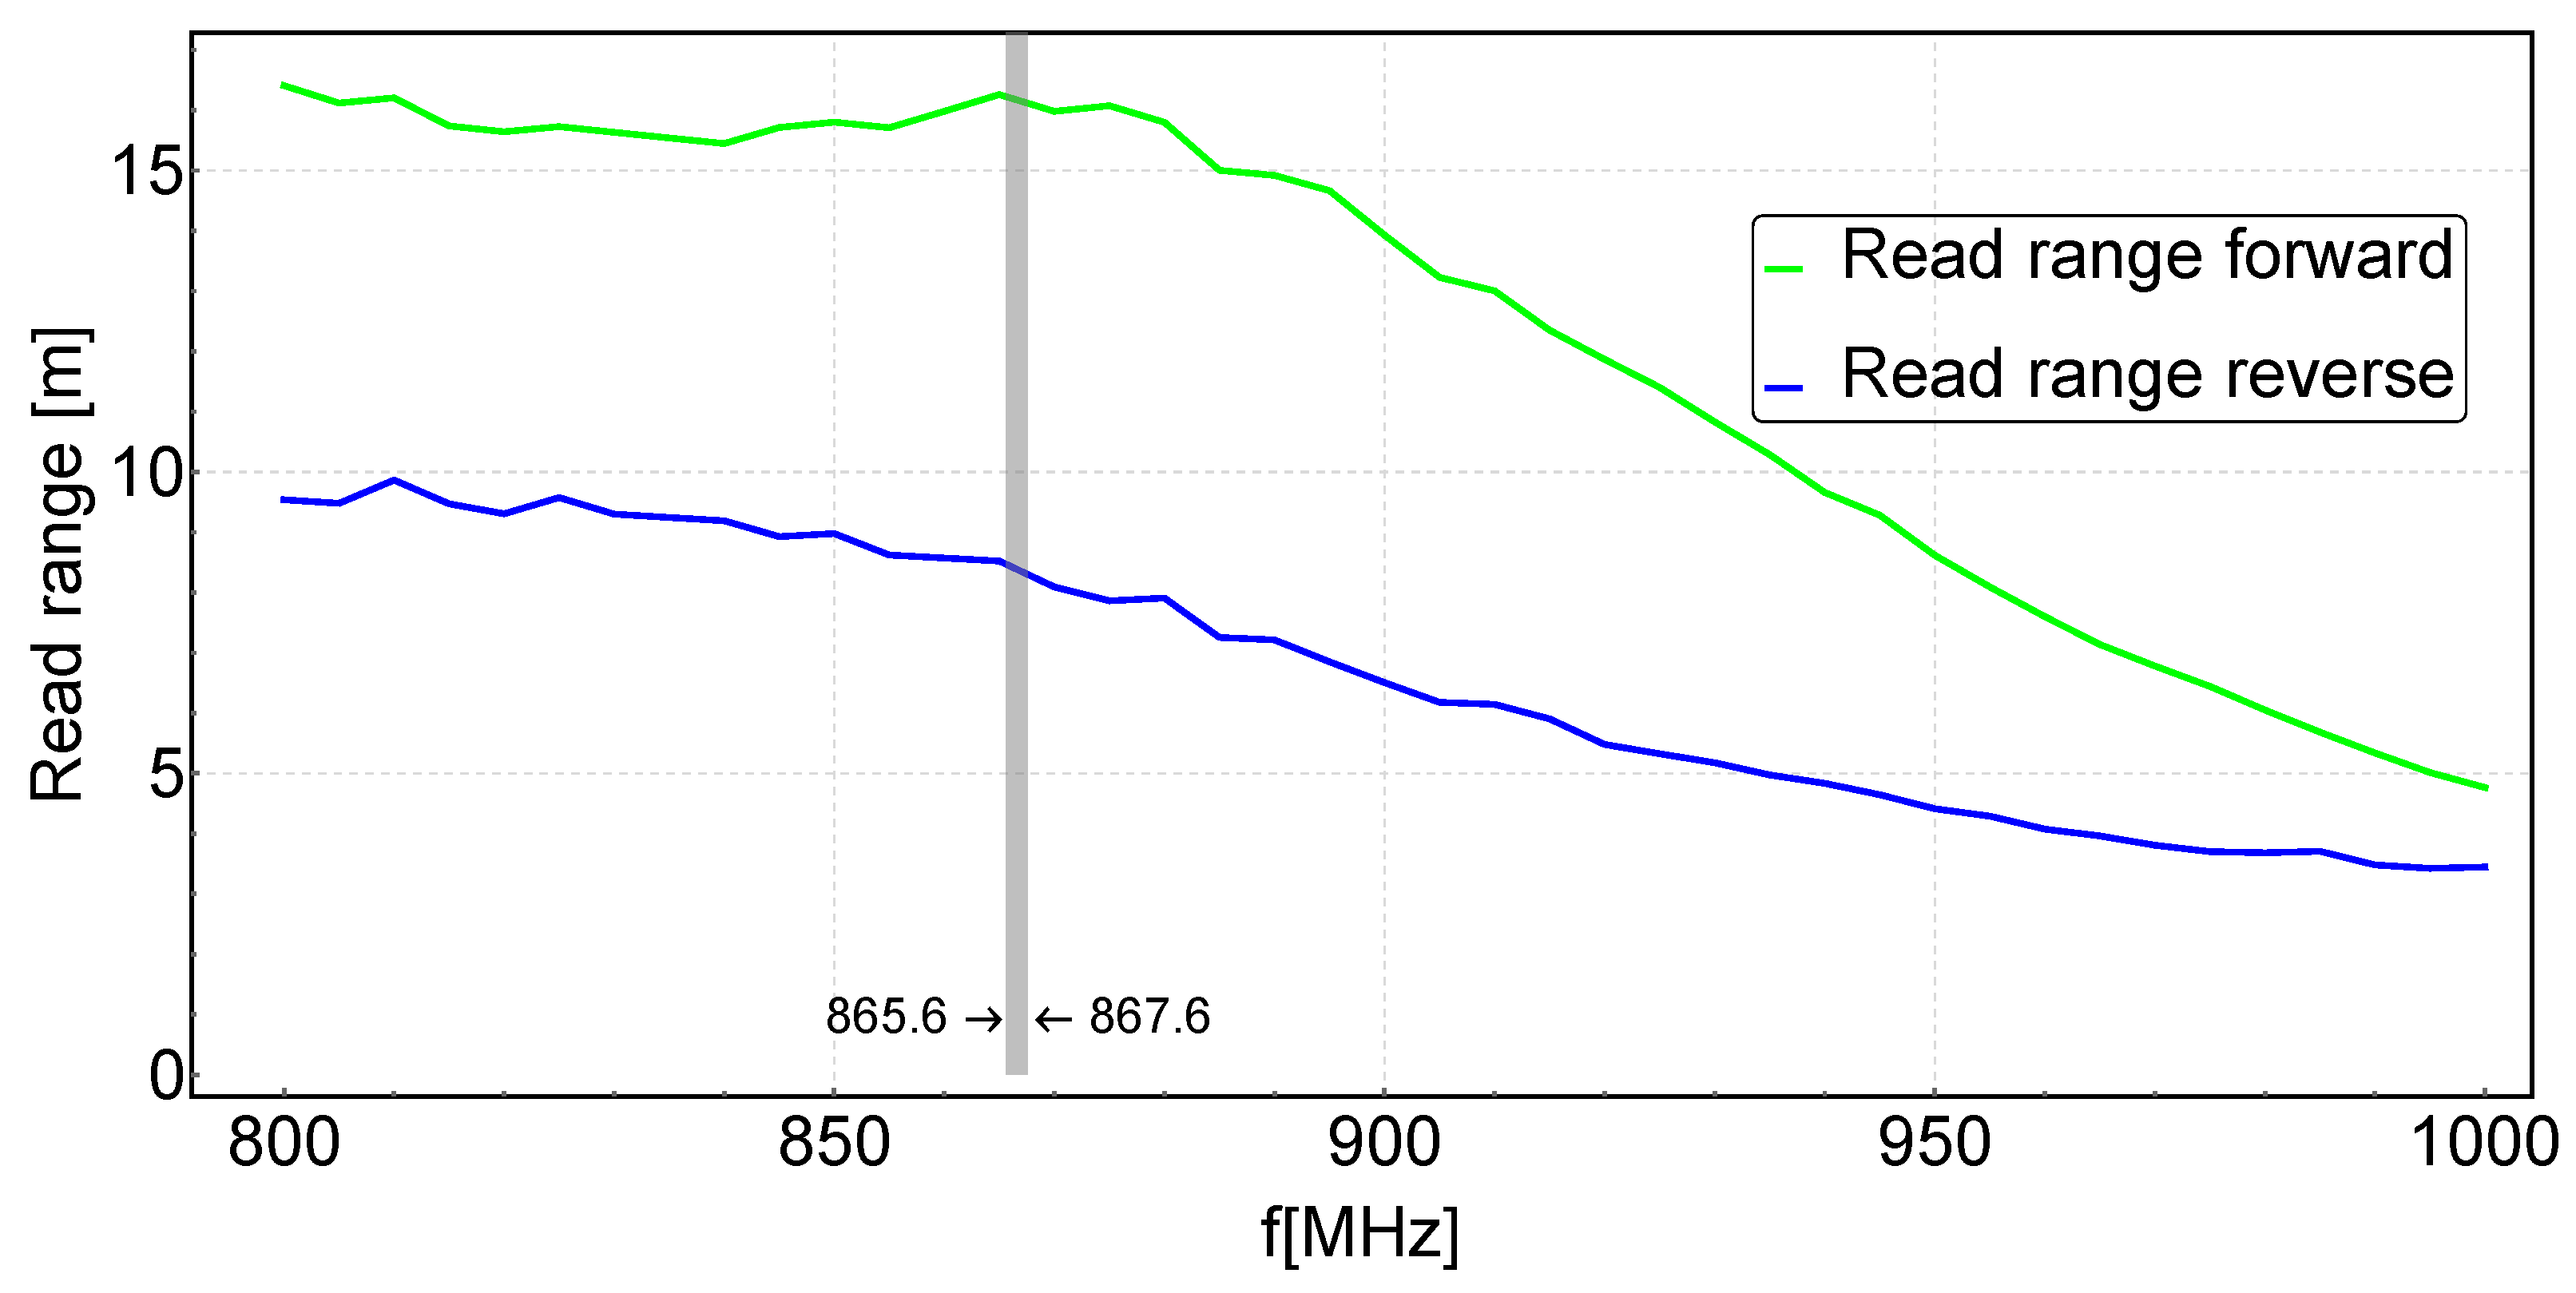
2.1. Determining the Operation Range of the RFID System

One of the most important parameters determining the quality of an RFID system is the so-called read range. It is determined by two parameters: read range forward and read range reverse. Read range forward r P w r M a x is the maximum range, at which the RWD reader is able to deliver the minimum power P t a g , m i n to properly activate the RFID tag [25]. Read range reverse r B t r M a x is the maximum distance at which the backscatter transmit power (power backscattered by tags) P t a g , B S is sufficient for the RWD reader to be able to read the RFID tag. The relationship between reading ranges and delivered/backscattered powers is described by the Friis transmission equation [26]. The value of the power delivered to the chip is determined using the following equation:
P T = P R W D G T G R c 2 τ χ ( 4 π r f ) 2
where c is speed of light in a vacuum, f—frequency, P R W D —power delivered to RWD antenna terminals, G R —gain of impedance-matched RWD antenna, G T —gain of impedance-matched tag antenna, χ —polarization matching factor of antennas, τ —power transfer coefficient, r—distance between the RWD and the transponder.
The value of the power transfer coefficient depends on the impedance parameters of the RFID chip and the antenna attached to it, as described by the equation [25]:
τ = 4 R e ( Z T A ) R e ( Z T C ) R e ( Z T A + Z T C ) 2 + I m ( Z T A + Z T C ) 2
where Z T C is the chip impedance and Z T A is the antenna impedance.
The maximum value of the power transfer coefficient is 1 and is obtained in the case of impedance matching of the antenna and the chip, when Z T A = * Z T C . The value of Z T A ≈ * Z T C should be obtained for the operating frequency of the RFID system (for Europe about 865 MHz), so that it is possible to power the chip from the maximum distance. The maximum distance to properly power the chip can be determined from the following equation:
r P w r M a x = c 4 π f P R W D G T G R τ χ P T m i n
where P T m i n is the minimum power that must be delivered to the chip for it to function properly.
In practice, determining the distance directly using Equation (3) is very difficult. Therefore, for this purpose, it will be easier to use the value of the power P t a g , m i n , delivered to the transponder antenna. In terms of theoretical relationships, the P t a g , m i n power is the P T m i n power with additional consideration of the influence of the transponder antenna parameters and can be described by the following equation:
P t a g , m i n = P T m i n G T τ χ
In addition, it is also possible to determine G R antenna gain and P R W D power as P E I R P radiated power, according to the following equation (given in Watts):
P E I R P = P R W D G R
The maximum value of power that can be radiated, P m a x , E I R P , is limited by the regulatory standards in force in the region (e.g., ETSI standards [27]). The largest distance r P w r M a x will be achieved at P E I R P = P m a x , E I R P , according to the Equation [28]:
r P w r M a x = c 4 π f P m a x , E I R P P t a g , m i n
In the case of r B t r M a x distance, the factor that causes the limitation of the range of proper functioning of the RFID system is the value of reflected power P R , received with the RWD antenna. One of the basic parameters of any RWD is sensitivity, that is, the minimum recordable value of P R power ( P R m i n ). For communication to take place between the transponder and the RWD, it is necessary to meet the condition that P R > P R m i n . The value of the received reflected power depends on the radiated power, losses in the transmission path and the ability of the transponder to reflect a wave of a given frequency (defined as the effective reflection area σ T ). However, for simplicity, it is possible to determine the distance r B t r M a x based on an analysis of the received P R reflected power, using the Equation [28]:
r B t r M a x = c 4 π f P t a g , B S P R m i n
The value of P t a g , B S can be determined by analyzing the received power value P R and the transmission path losses, according to the following equation (values given in decibel scale):
P t a g , B S = P R G R + L c a b l e + F S P L
where L c a b l e is cable losses and F S P L is the free space loss.
In a similar way, it is possible to determine the power P t a g , m i n , using the following equation (values given in decibel scale):
P t a g , m i n = P R W D , m i n + G R L c a b l e F S P L
where P R W D , m i n is the minimum value of P R W D power at which the transponder feedback will be obtained.
In summary, in order to properly carry out communication between the RWD and the transponder, it is necessary to obtain an adequate value of both P t a g power and P R power, which is possible only at a certain distance (the smaller of r P w r M a x and r B t r M a x ). An analysis of the power transmitted/received by the RWD, taking into account the transmission path losses, will enable a preliminary determination of the maximum theoretical reading distance of a given RFID system. However, it should be borne in mind that in real conditions, the obtained distances r P w r M a x and r B t r M a x may be smaller, due to the presence of interference and the possibility of antenna jitter, caused, for example, by contact with the ground, temperature or other atmospheric conditions. Therefore, it seems that it will be necessary to measure the distance of the correct reading, both under ideal conditions (maximum possible range) and real conditions (practical application). It should also be remembered that the gain value of antennas changes depending on the polarization coordinates. In RFID systems, the largest range of proper operation will be obtained for coaxial alignment of RWD and transponder antennas.

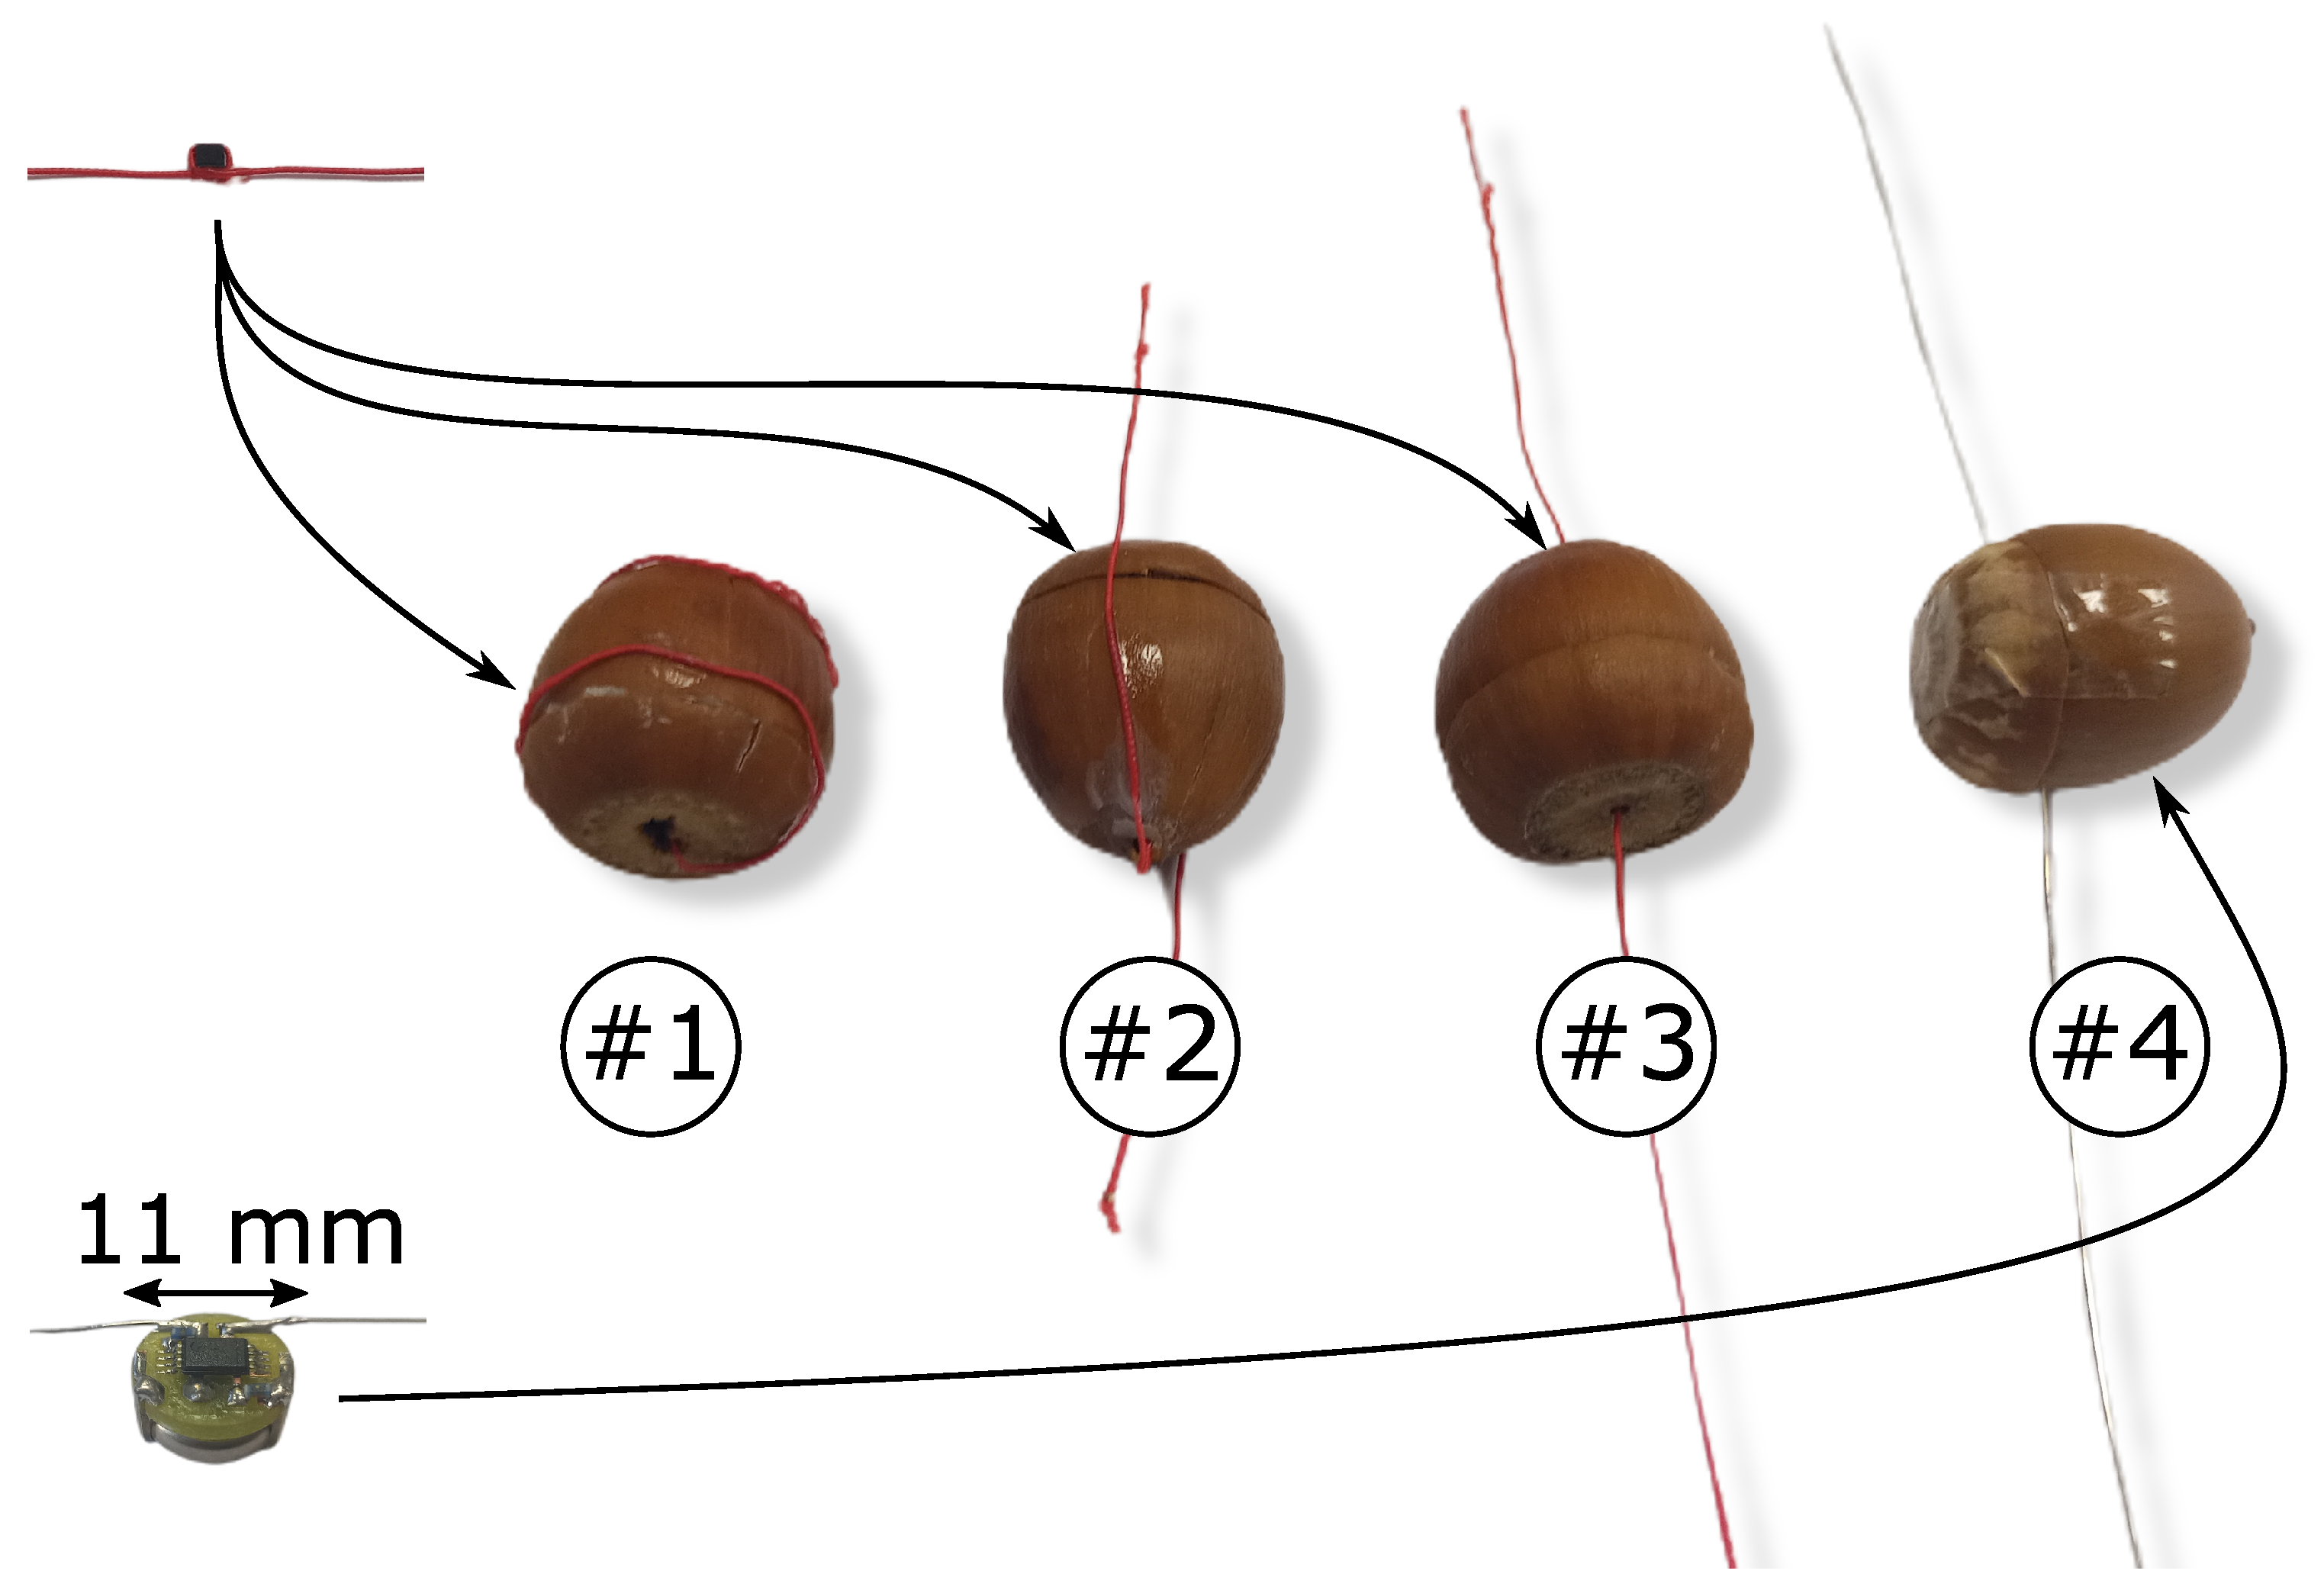
2.2. Selection of RFID Tags for Experimental Studies

For the acorn prototypes, we used two types of RFID tags: a passive tag with industry-leading read sensitivity of up to 22.1 dBm MONZA R6-P [29] and a semi-passive tag (otherwise called battery assisted passive (BAP)) with configurable sensitivity set to 31 dBm EM4325 [30]. The passive tag MONZA R6-P was inductively coupled to a flexible dipole antenna (see red wire in Figure 1). The dipole antenna and tag are connected with coupled inductive circuits, and the impedance matching problem between the inductive elements is solved by using a so-called parasitic loop. The galvanic separation of the antenna and IC circuits has made the circuit much less sensitive to the parameters of external objects in terms of impedance matching. The semi-passive tag EM4325, together with the power supply, was placed on a dedicated PCB (bottom left corner of Figure 1). Both tags were tuned to 868 MHz (for RFID purposes with a transmission power of up to 2 W in the European Union). The use of a flexible dipole antenna seems to be the optimal choice when considering the use of acorn tags to be spread by jays. It was decided to test three antenna configurations for the passive tag: the spiral configuration (see # 1 in Figure 1), the s-shaped configuration # 2 and the straight line configuration # 3 , and one straight line configuration for the semi-passive tag # 4 .
The semi-passive tag was powered by a 3 Volt CR927 battery (produced by Vinnic Power, Yau Tong, Hongkong) with a capacity of 30 mAh. According to the manufacturer’s documentation, the EM4325 tag consumes an average battery current in sleep mode of a maximum of 2.6 μ A; therefore, the CR927 battery should power the chip for approximately 16 months.

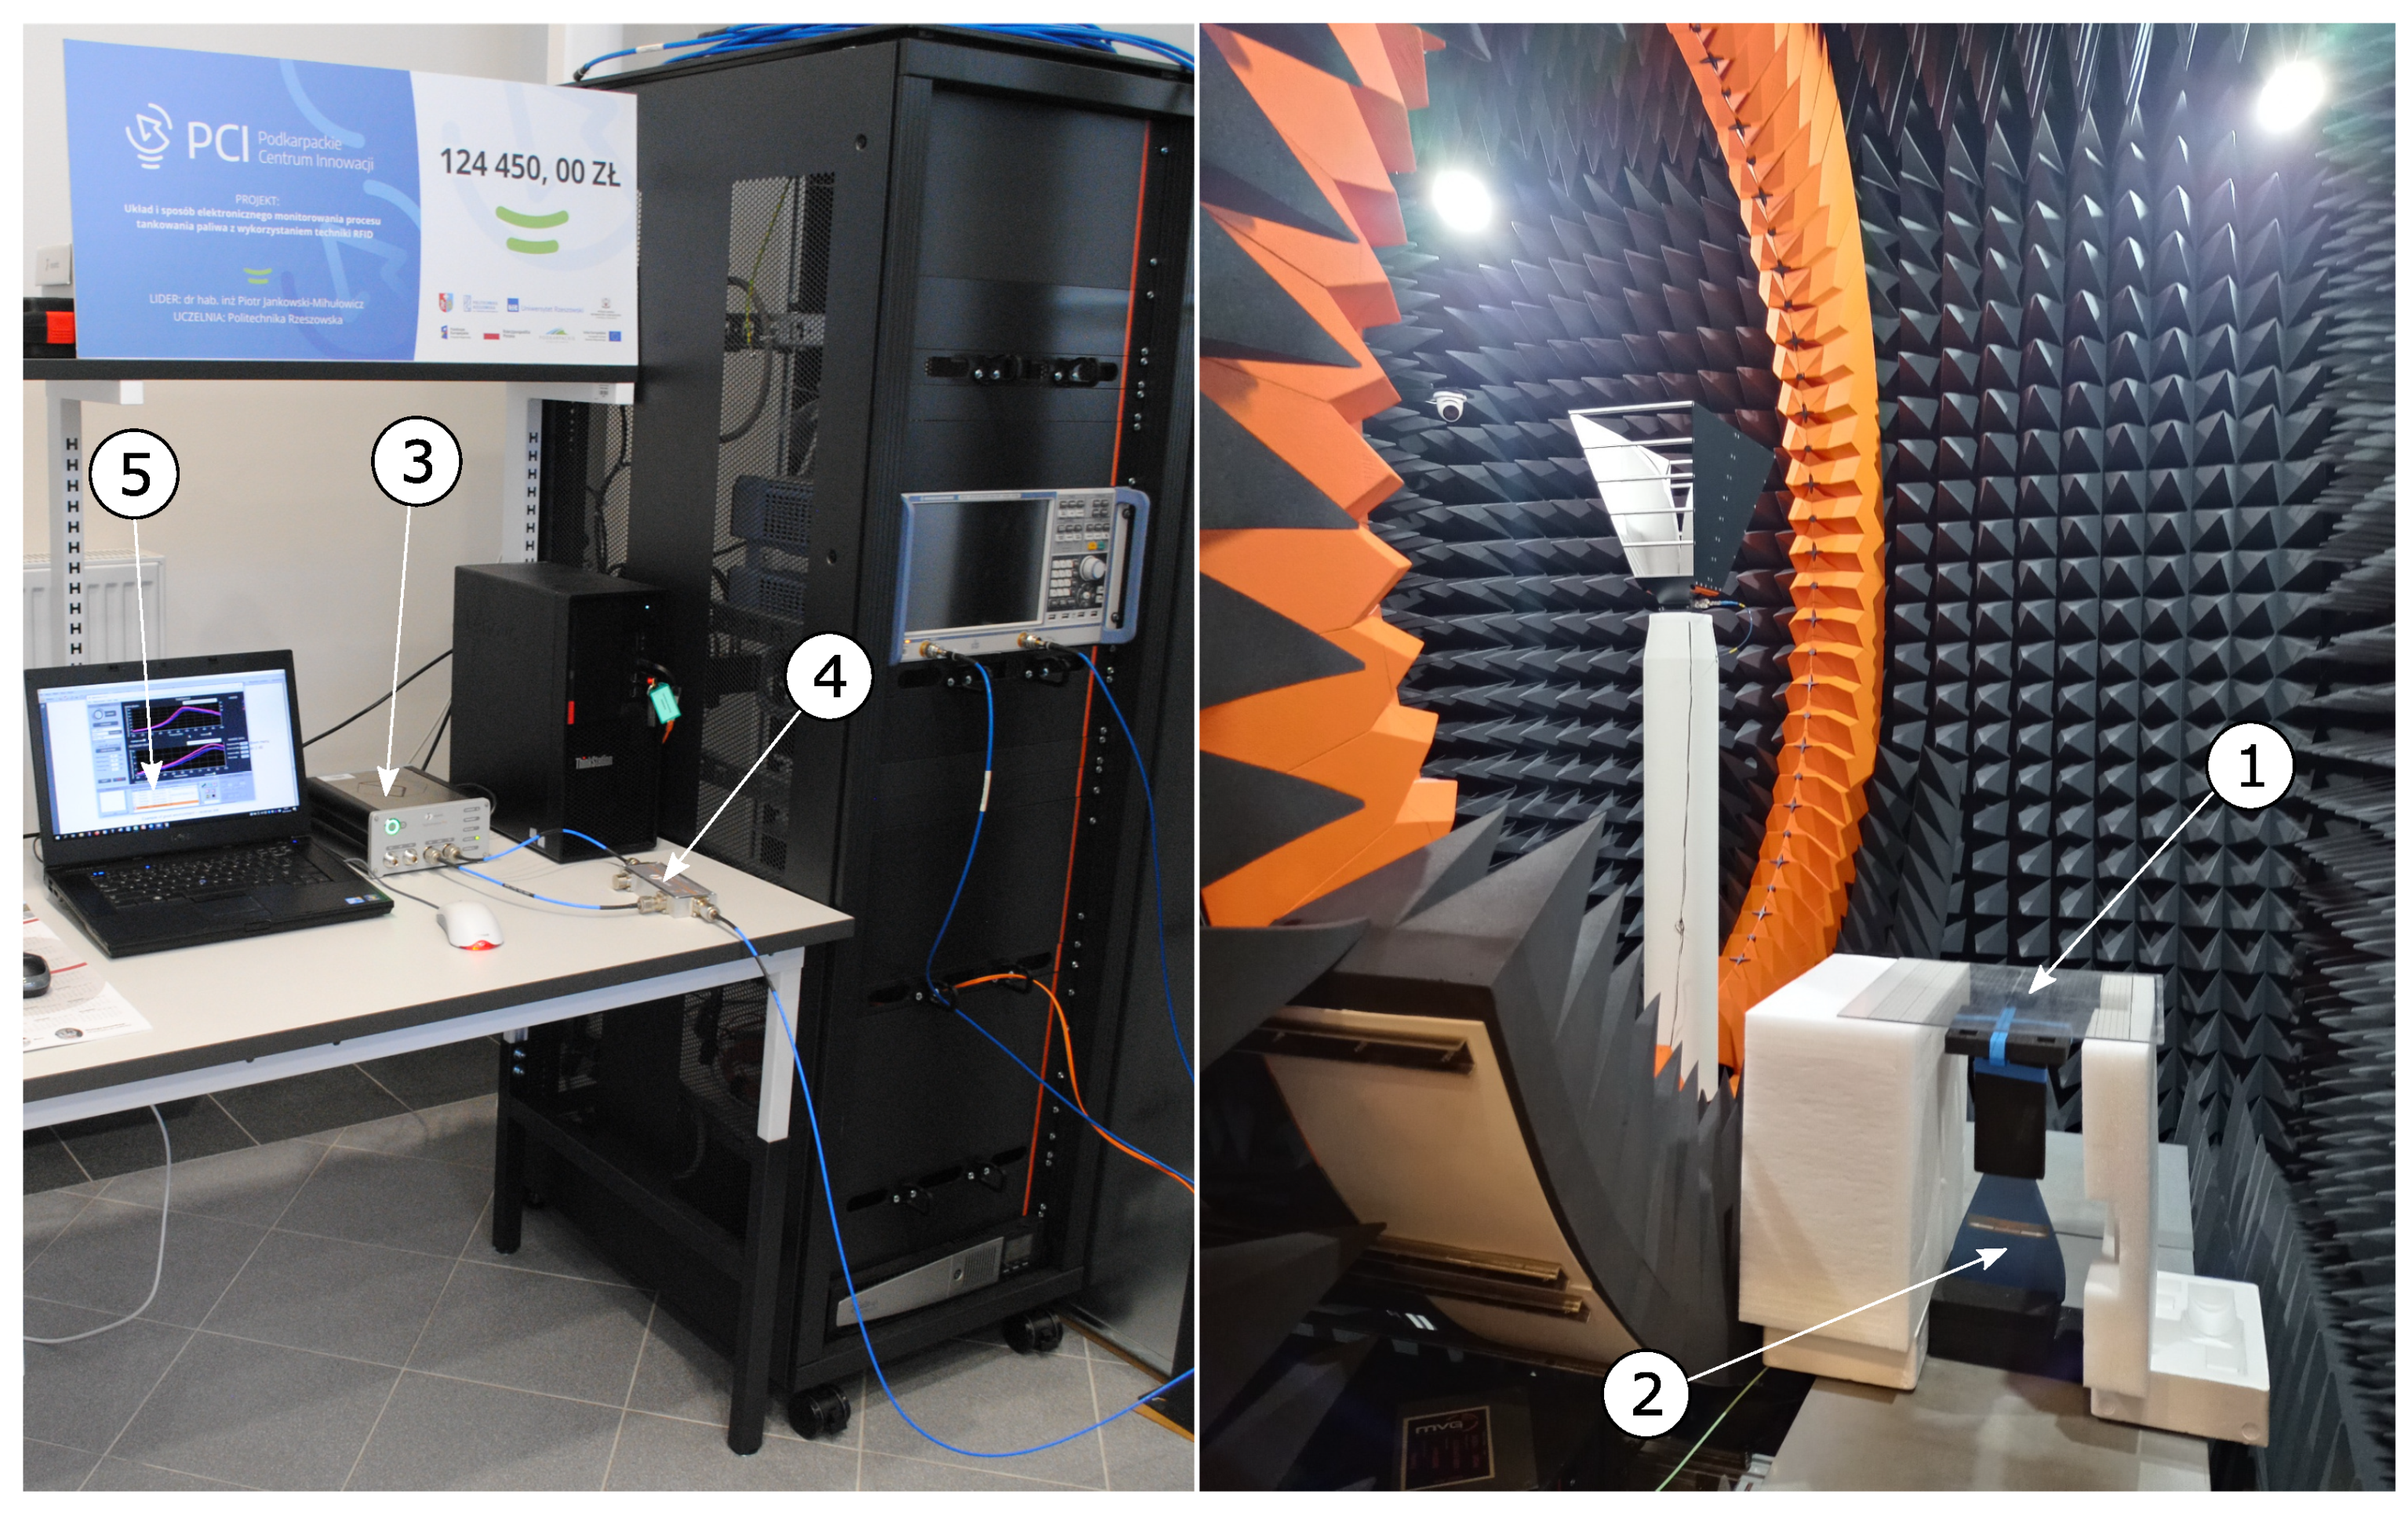
2.3. Laboratory Experimental Set-Up

Laboratory experiments were performed in the Microwave Vision Group anechoic chamber, which is shown in Figure 2. For the measurements, the Voyantic Tagformance Pro system was used [28] (see ③ in Figure 2) together with Tagformance UHF v.13.2.3 software ⑤. The AARONIA HyperLOG 7025 broadband logarithmic-periodic antenna ② [31] was coupled with a directional coupler (frequency band: 600–1300 MHz, TX-ANT insertion loss: 1.2 dB, ANTRX insertion loss: 6.5 dB, maximum input power: 250 W) ④. A measuring top ① was mounted in the chamber, on which the RFID acorns under test were placed. The quantities measured by the Voyantic Tagformance Pro system were the minimum power P t a g , m i n to power up the RFID tag (so-called power on tag forward) and the backscatter transmit power P t a g , B S (so-called power on tag reverse) for data transmission performed in the 800–1000 MHz band. Based on the measured powers, the read ranges were calculated according to Equations (6) and (7).
Many leading RFID reader models have a sensitivity of −84 dBm (e.g., readers: UR1A, FR900, IMPINJ Speedway Revolution R420, YRI1 or UR4), which combined with an antenna gain of −4 dBm gives a reader system with a sensitivity of −88 dBm = 1.58 pW. According to Equation (7), the read range reverse r B t r M a x depends on the sensitivity of the RWD reader P R m i n . The read range reverse for the experiments in the anechoic chamber were determined for a reader sensitivity just equal to P R m i n = 1.58 pW. The read range forward r P w r M a x described by the Equation (6), on the other hand, depends on the maximal reader power P m a x , E I R P , whose value for data from an anechoic chamber was assumed to be P m a x , E I R P = 2 W (the maximum allowed for RFID in the European Union).
The prototype acorn tags were pre-tested in an air environment, as indicated by ① in Figure 3, and then the selected tag with the best performance was tested in a quasi-real environment. The quasi-real environment was a piece of soil (arranged in order: antenna-tag-soil), which can be seen in Figure 3 ②.

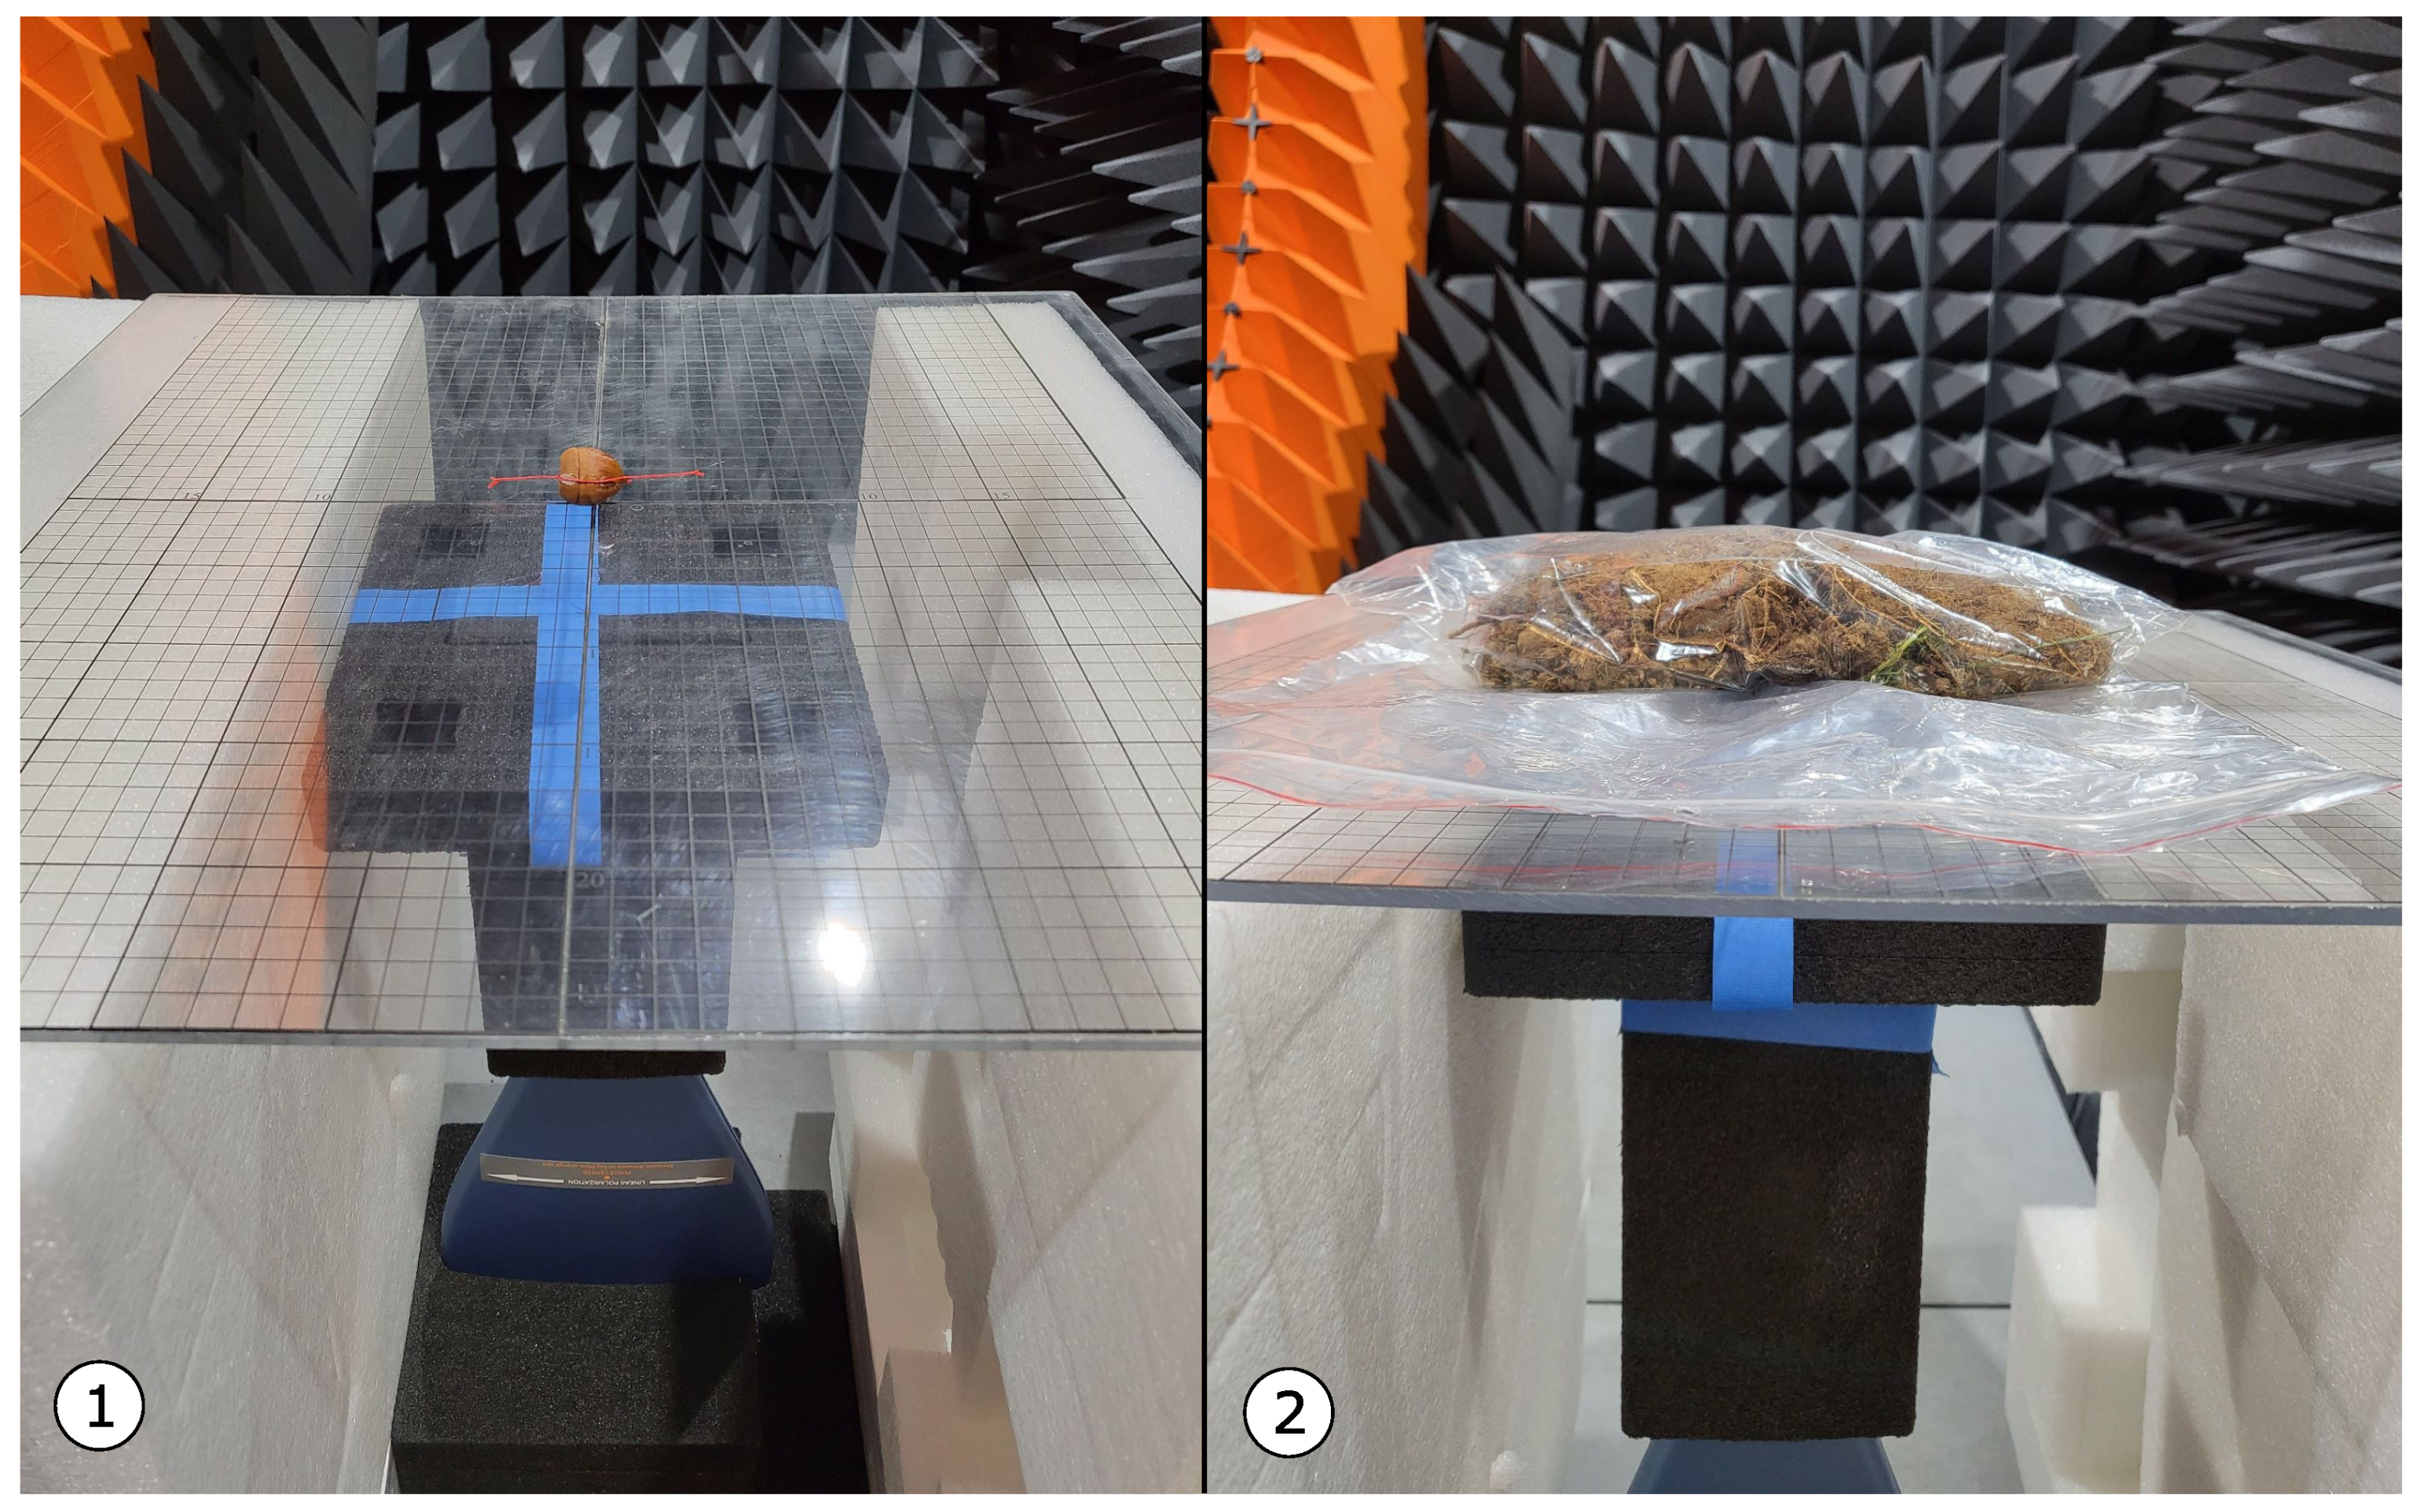
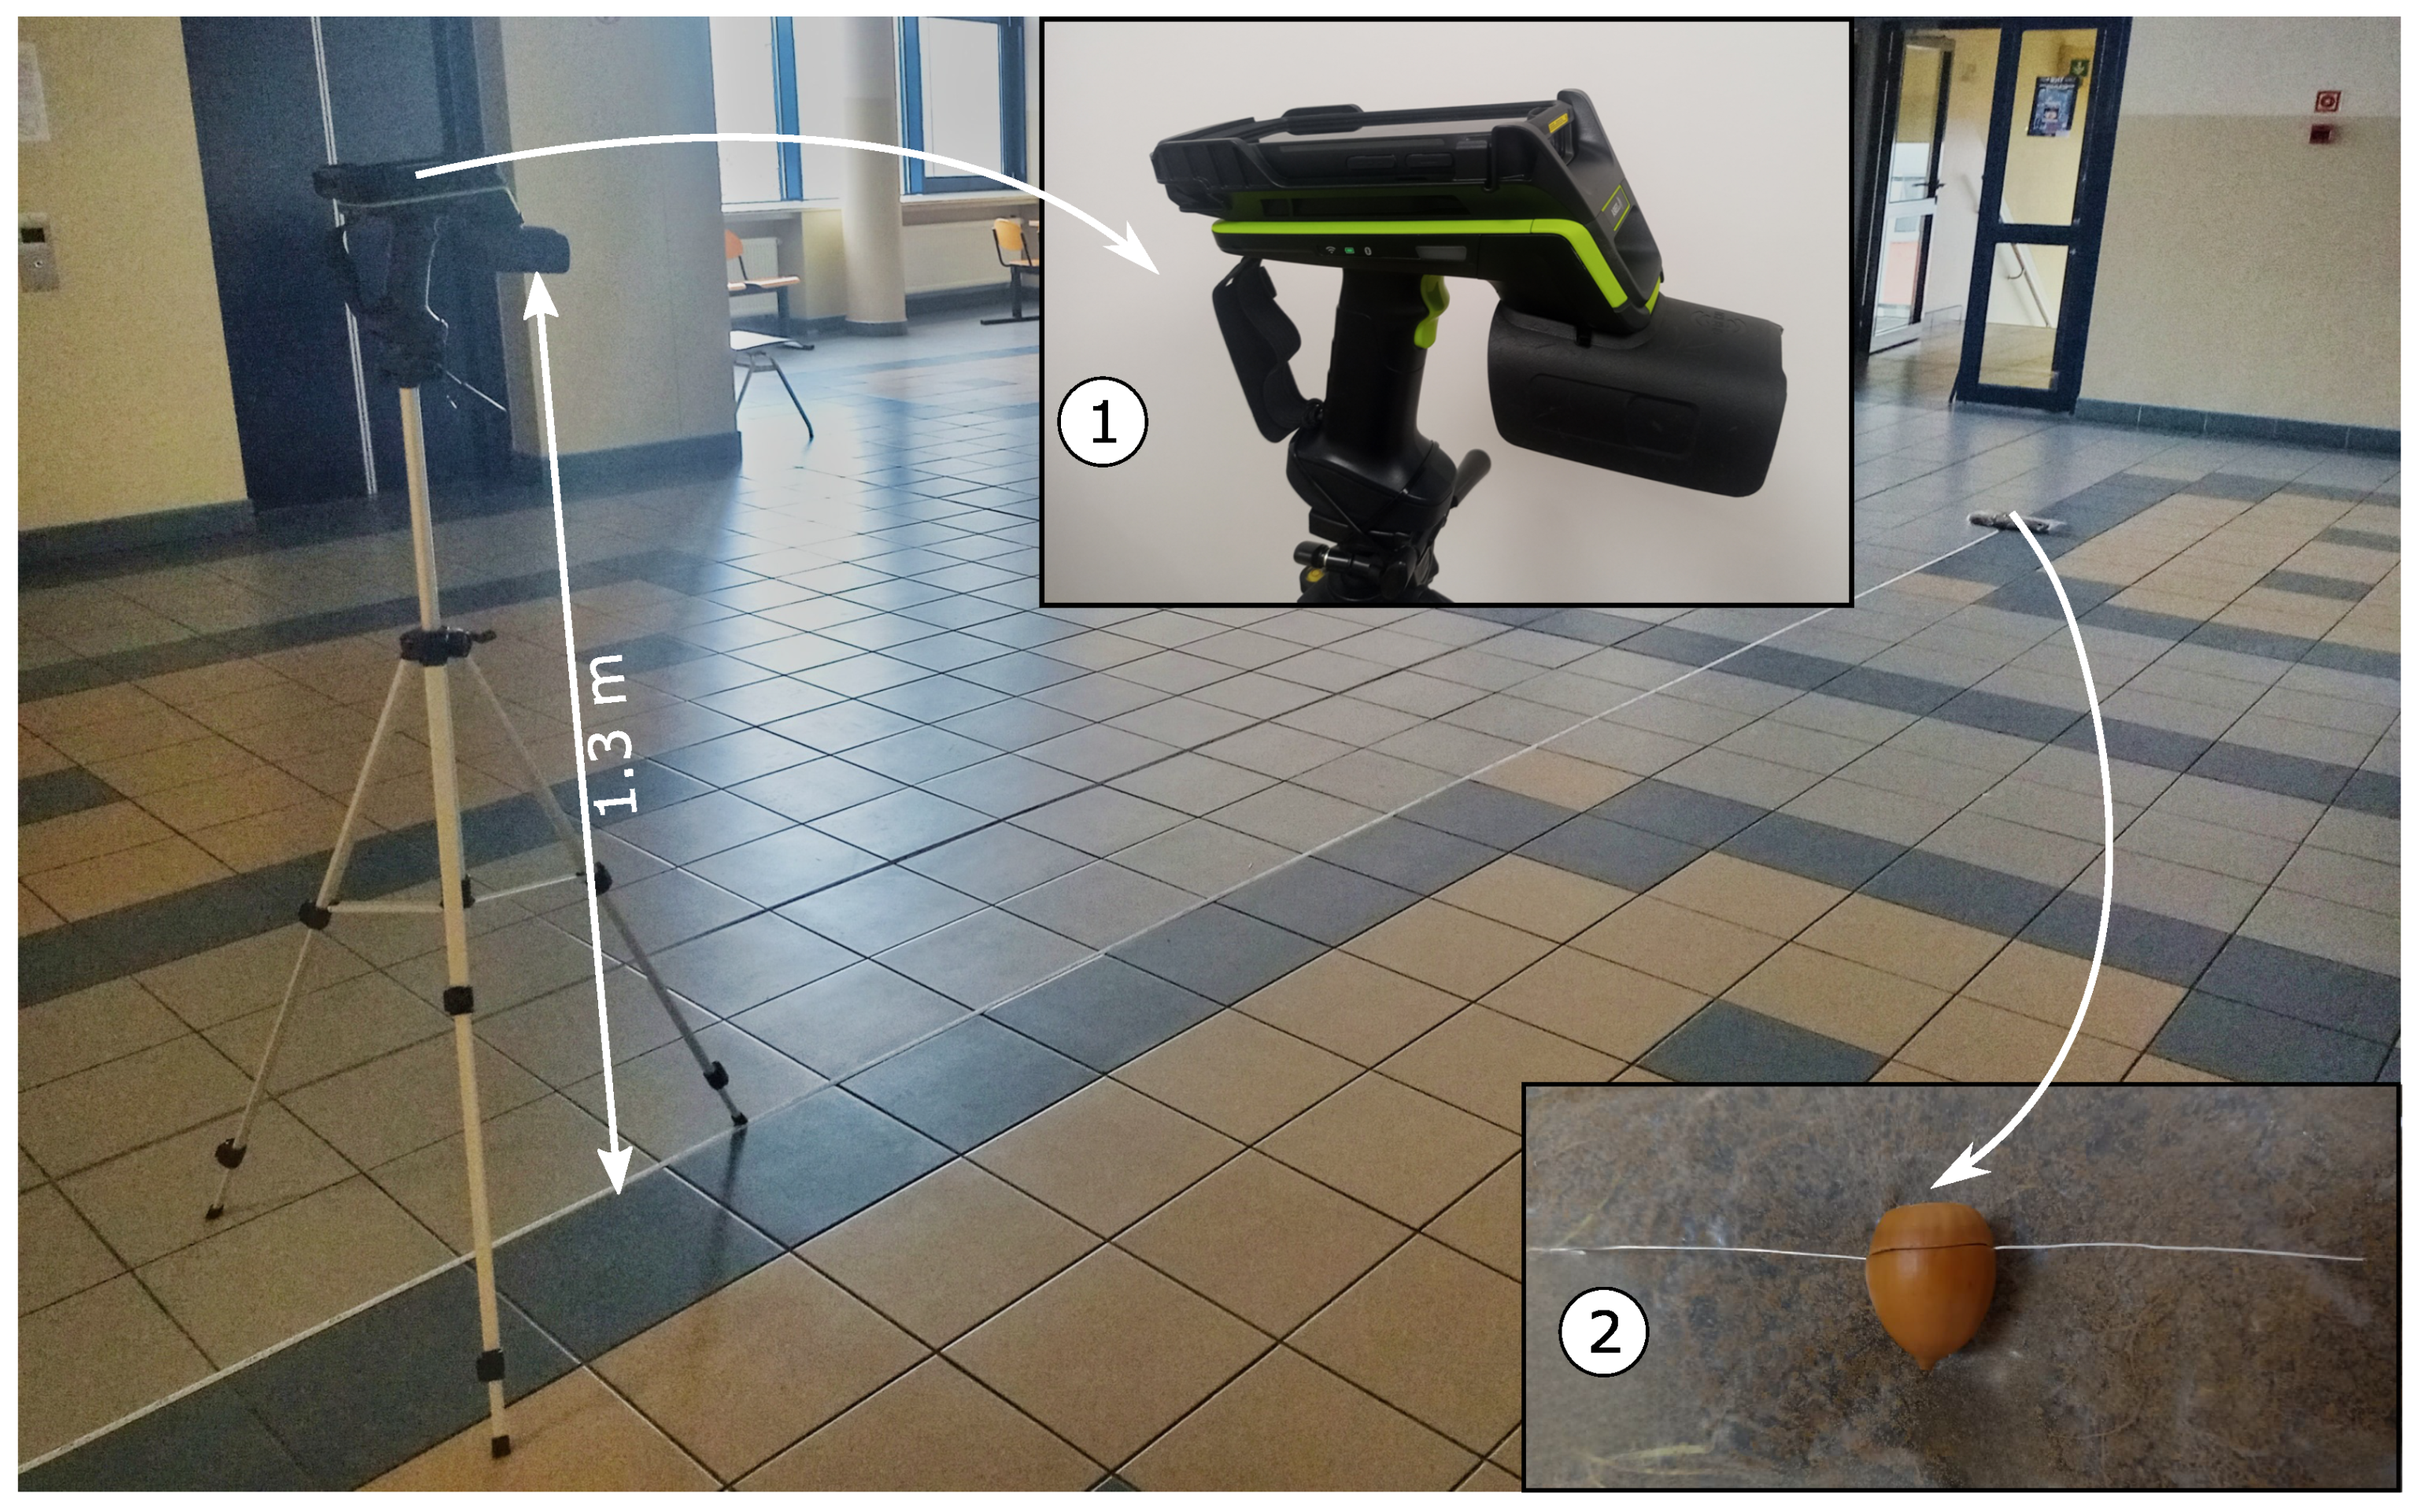
2.4. Experimental Set-Up under Quasi-Real Conditions

The quasi-real experiments were conducted in a large area hall, as shown in Figure 4. An oak acorn equipped with a sound indicator (see ② in Figure 4) was placed on a piece of soil (as in the anechoic chamber during the laboratory tests). The measurements were taken using an industry-leading RFD9090 long-range handheld RFID reader ① operating in the 865–868 MHz band [32]. During the experiment, the read range of the acorn tag dependents on the reader-tag antennas relative orientation was measured: the read range indicated by the RFD9090 reader (Reader indication range in Table 1) and the read range indicated by sound indicator (Sound indication range in Table 1) located inside the acorn.

3. Results

This section describes and discusses the results of the experimental studies.

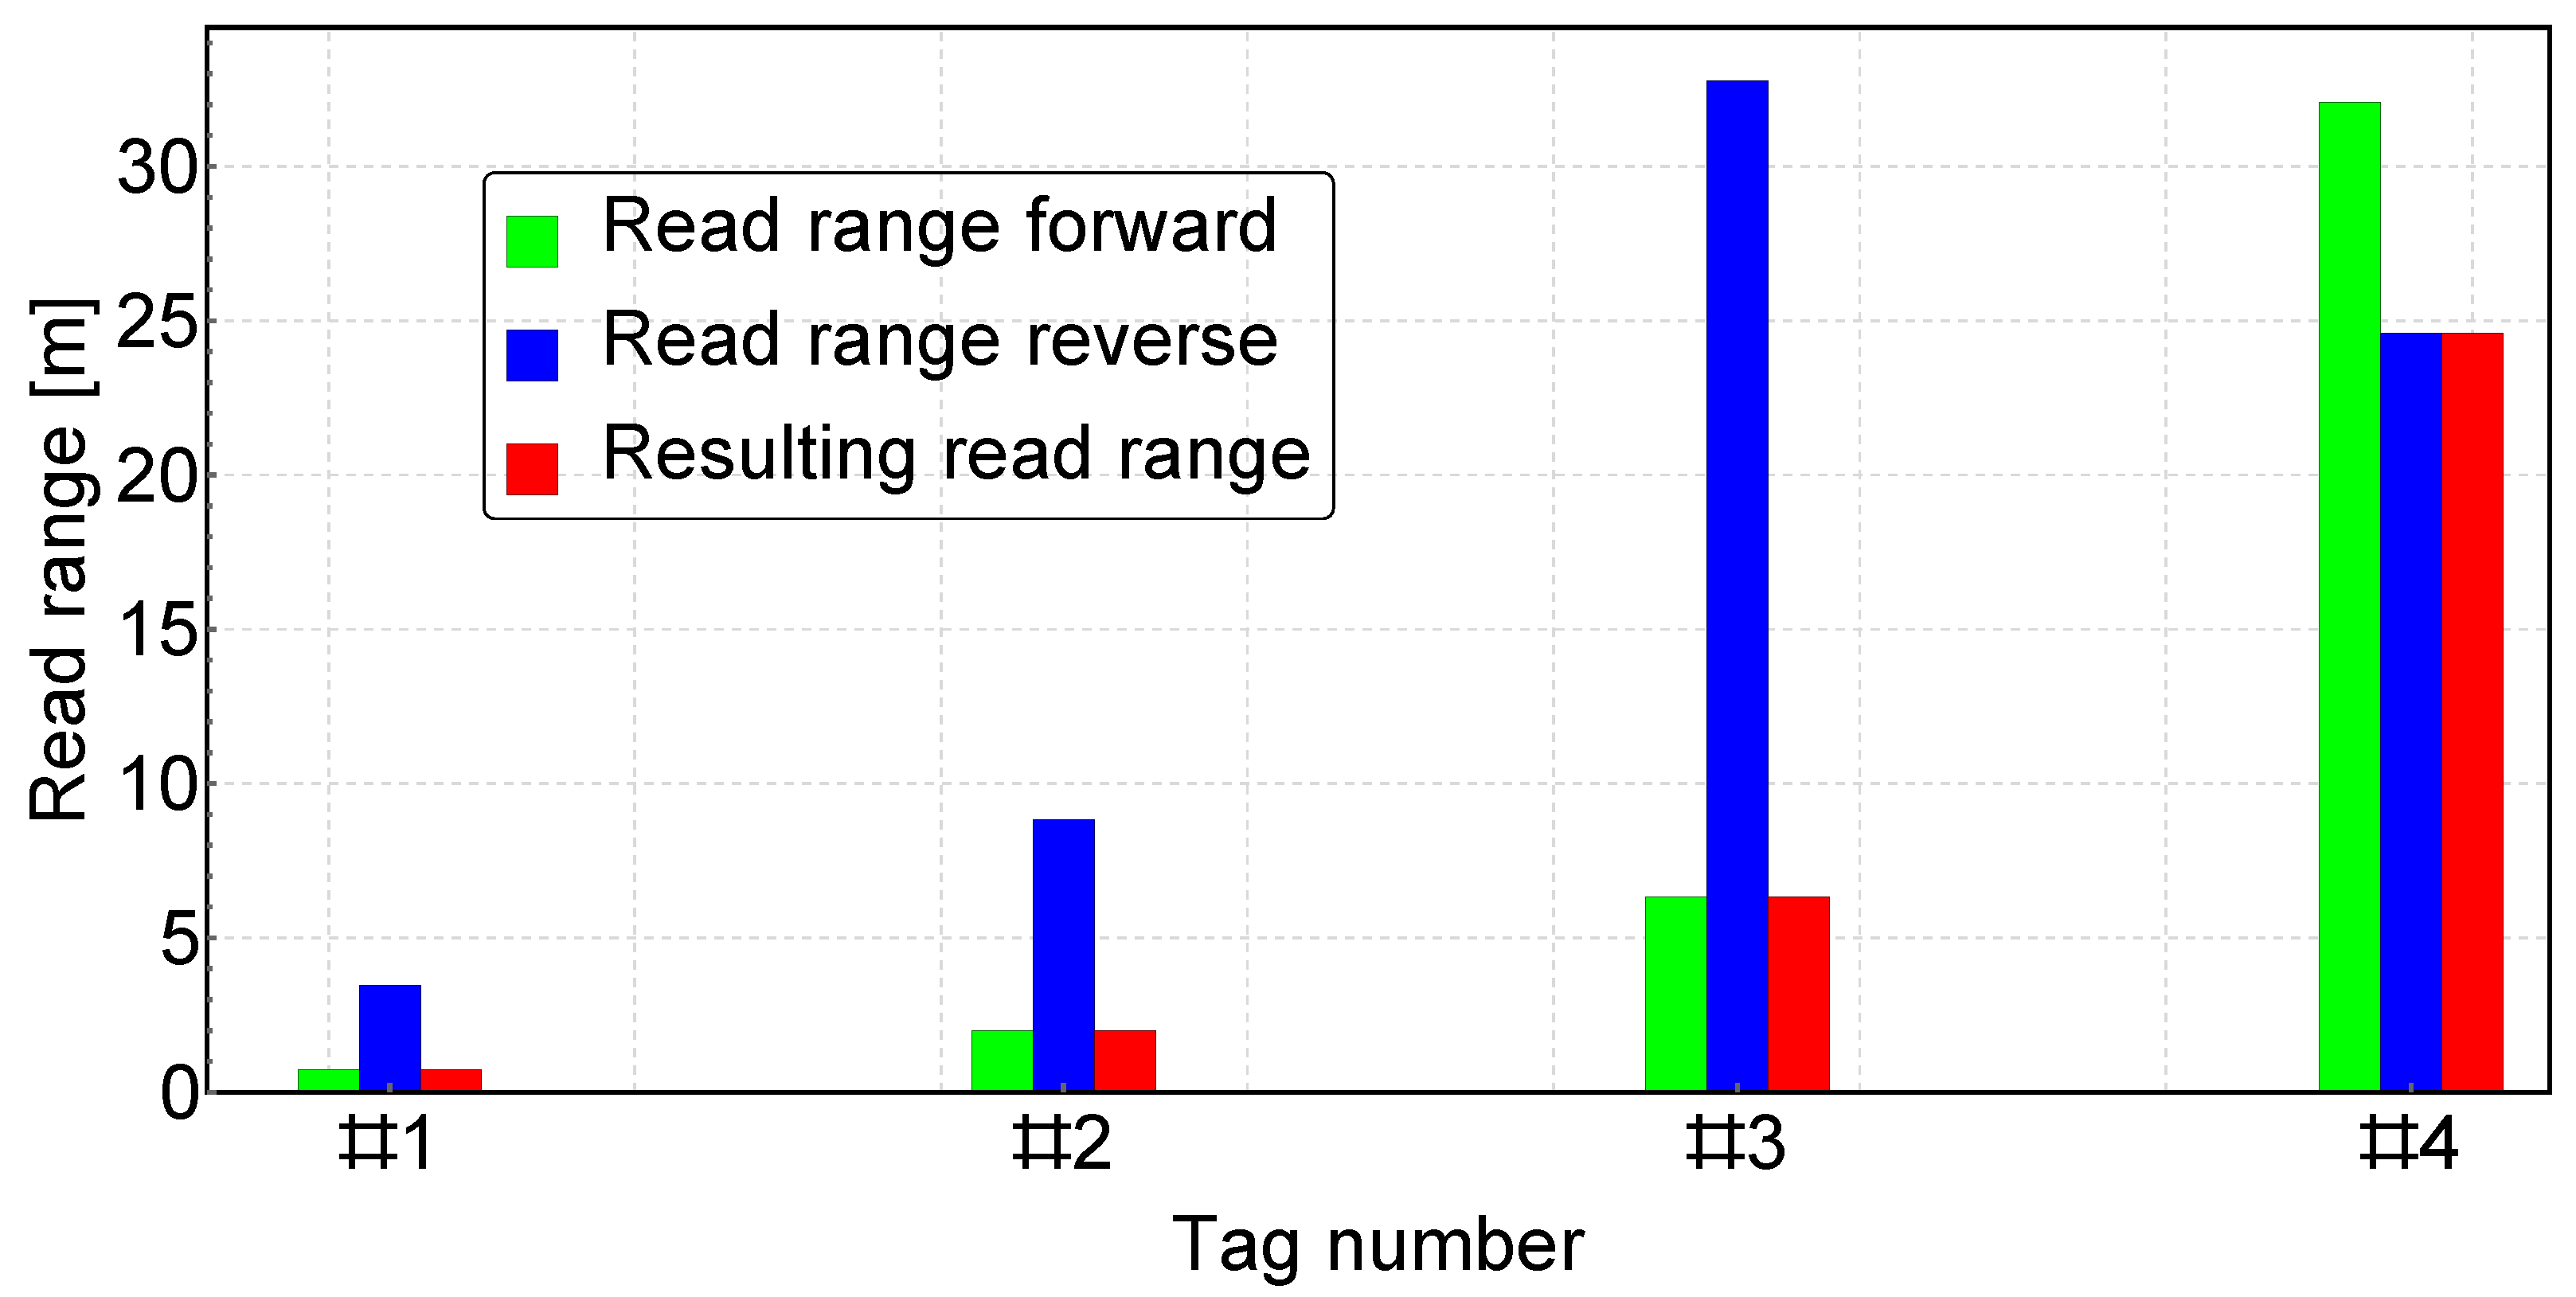
3.1. Laboratory Experimental Results

The first laboratory experiment consisted of determining the read range of the four RFID tags described in Section 2.2 in the air environment. Figure 5 shows the read ranges for data transmission 868 MHz. The resulting read range shown in Figure 5 is the minimum value from among the two ranges: Read range forward and Read range reverse. It is clear from laboratory experiments that twisting the antenna drastically reduces the range of the RFID tag (a result that is not surprising). Configurations # 1 and # 2 can therefore be immediately ruled out as useless. Configuration # 3 , i.e., a passive tag with a straight line antenna gives a good result for Read range reverse, but the result for Read range forward is poor (the chip can be sufficiently powered up from a distance of no more than about 7 m). The best results were obtained for sample # 4 with a semi-passive RFID tag, for which the Resulting read range was 24.6 m. Given the results obtained in the first laboratory test, it was decided that further tests would only be carried out on the RFID acorn sample # 4 .
A further laboratory test examined the read range of acorn # 4 in a quasi-real environment, i.e., a soil environment (see ② in Figure 3). The response of the chip was investigated for data transmission performed in the 800–1000 MHz band. The performed study showed that the read range of the RFID acorn in the soil decreased. Furthermore, the RFID antenna system became untuned due to the presence of the soil in close neighbourhood of the tag. As can be seen in Figure 6, a 15 cm long antenna tuned to 868 MHz appeared to be untuned in the soil environment, whereas a 13 cm long antenna appeared to be tuned. The phenomenon of performance degradation of UHF RFID tags in the neighbourhood of a material surface is well known and has been described, for example, in papers [33,34].
The read range characteristics of the tuned semi-passive tag # 4 to the soil environment are shown in Figure 7. It can be seen here that the value of Read range forward is greater than Read range reverse. It can therefore be said that the semi-passive tag (with greater sensitivity than a passive one) ‘hears’ the RWD reader’s query from further away than it is able to respond to the query. The same results were shown in paper [35] where the read range of a semi-passive RFID tag was investigated. This fact can be used to improve the localization range of the RFID acorn, as will be shown in the next section.

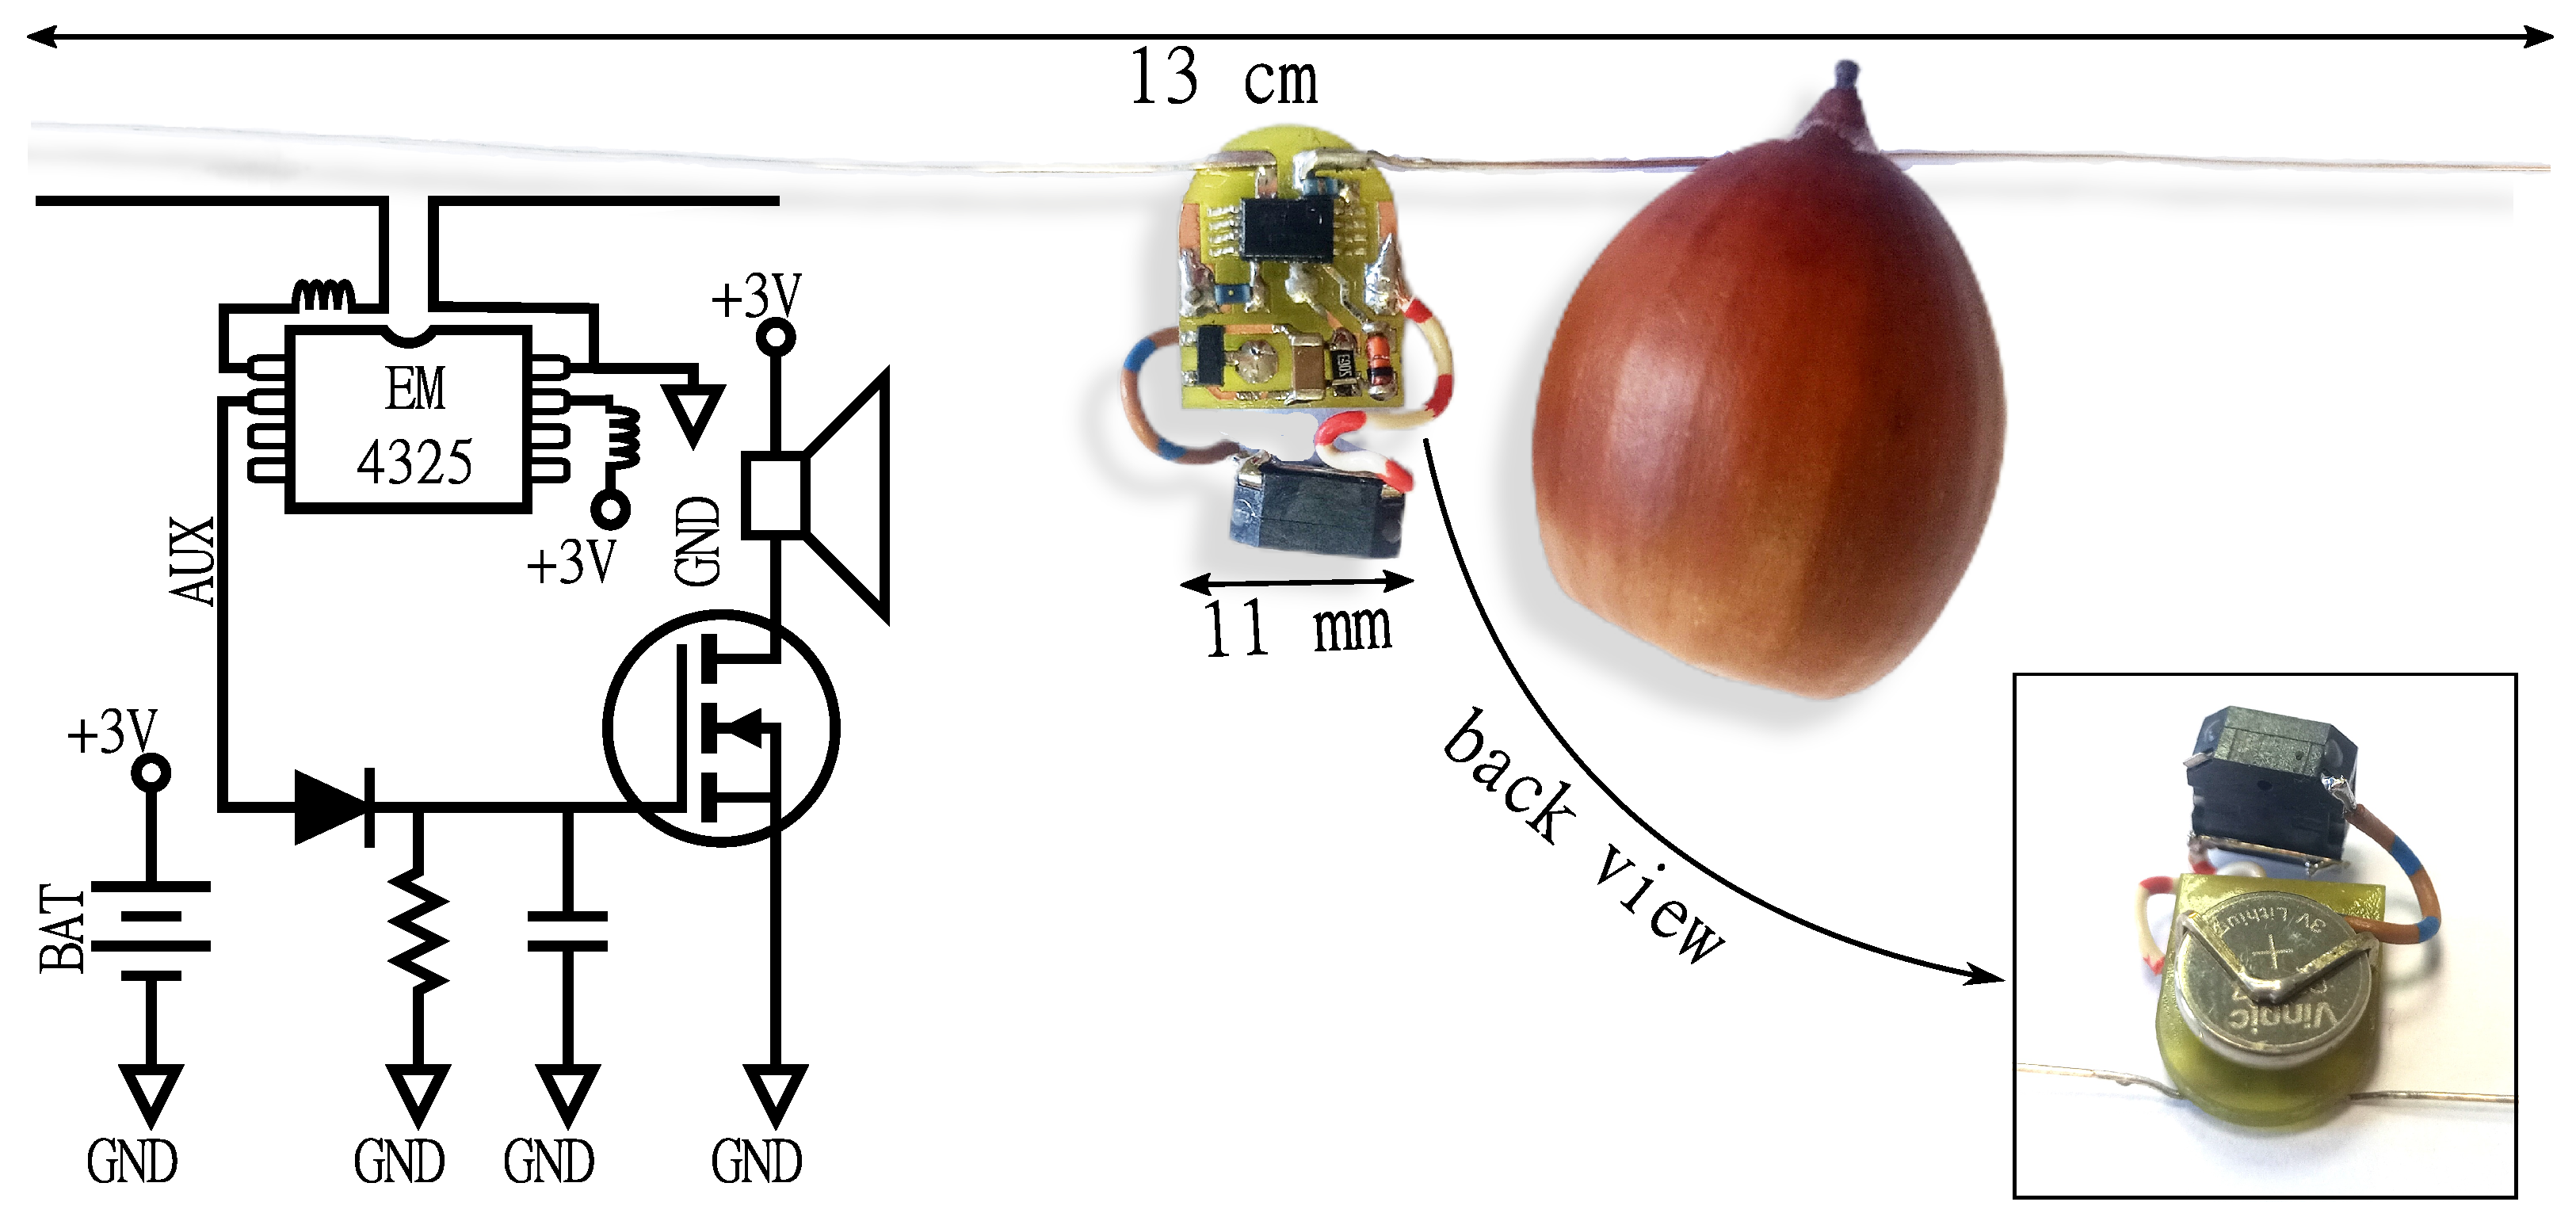
Conclusions from Laboratory Experiments—RFID Tag Concept with Sound Indicator

Previous experimental results have shown that the semi-passive tag ‘hears’ the reader’s query from a greater distance than it can respond to. Therefore, it is possible to design the RFID tag circuit in such a way that it responds to the reader’s query, but not via the RFID channel. Rather, it can only respond via another communication channel; for example, it could be a sound channel. The use of the EM4325 tag actually provides such an opportunity because this chip contains configurable digital ports. The auxiliary I/O port of the EM4325 RFID tag can be configured as an output for RF event notifications (i.e., detection of Gen2/6C commands). Its operation is as follows: upon detecting a request sent by the RWD reader, the RFID tag sets a high logic state on the AUX port for about 3 ms. By maintaining this trigger for an extended time period (with a properly selected resistor and capacitor), it is possible to activate a sound signal, which will be heard even if the RDW reader does not receive a response.The electronic circuit of the tag including the sound system and its physical implementation are shown in Figure 8. The circuit uses a miniature buzzer with a sound frequency of 2.7 KHz and an intensity of 85 dB at 10 cm, which, despite being enclosed in an acorn, is easily audible from a distance of more than 20 m.
This RFID chip with a sound indicator was placed in the acorn and then tested under quasi-real conditions.

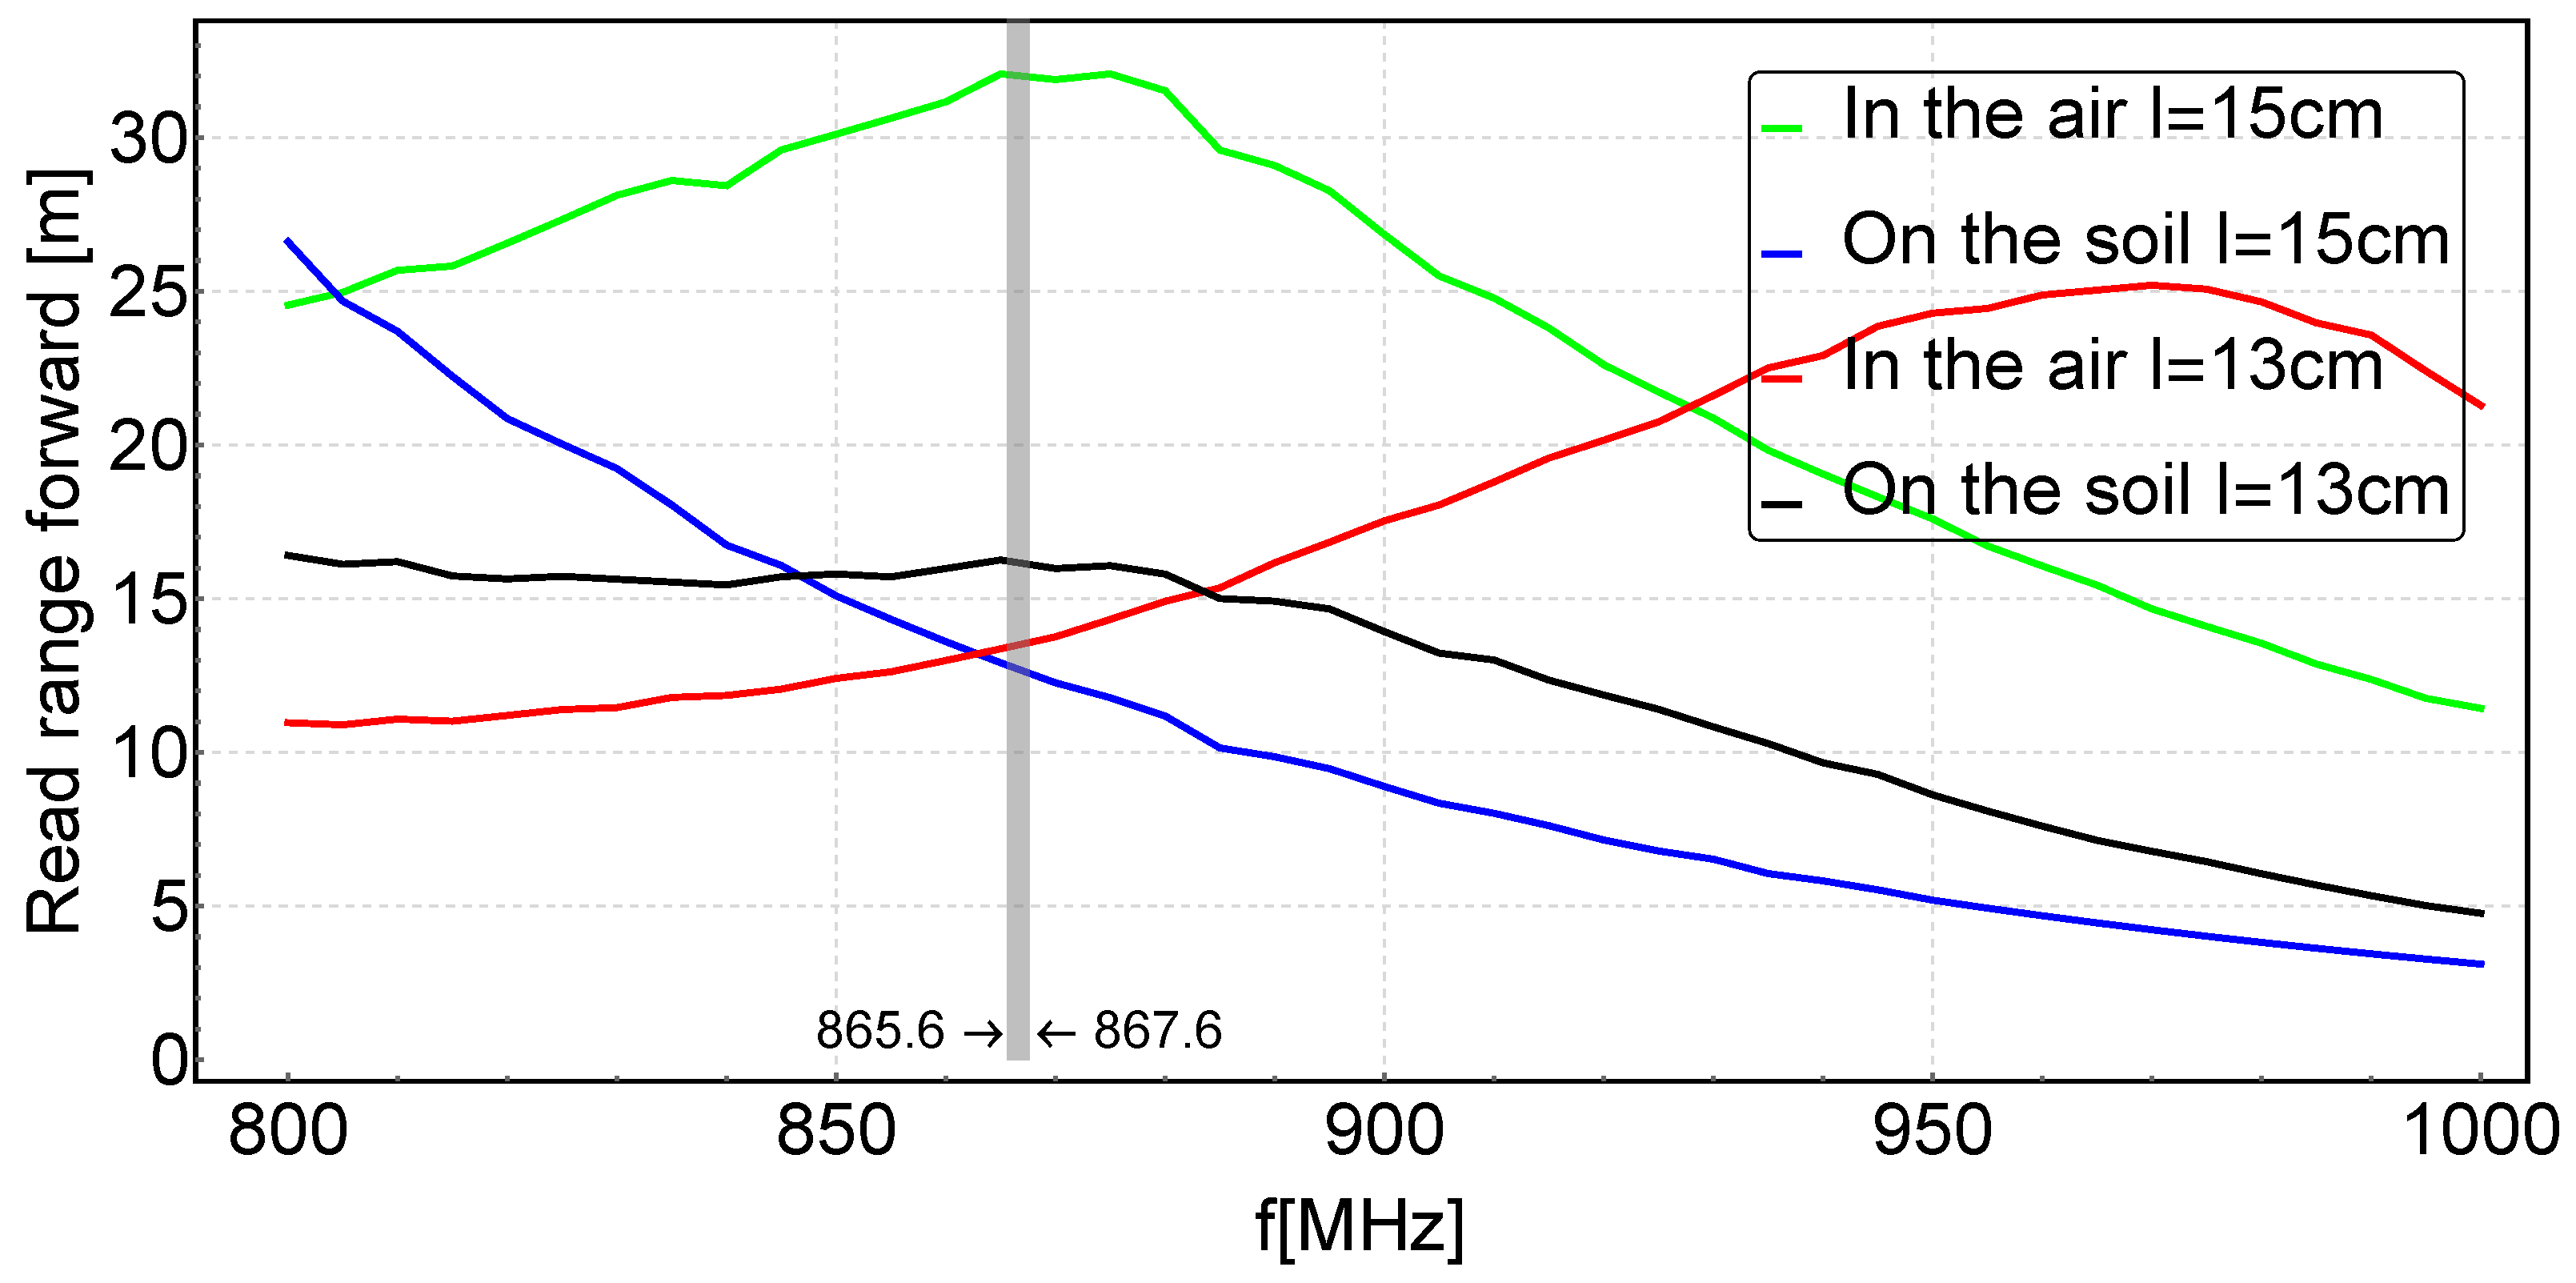
3.2. Experimental Results under Quasi-Real Conditions

The quasi-real conditions experiment described in Section 2.4 measured acorn tag response ranges dependent on the relative orientation of the reader-tag antennas (in the angular range 0°–90°). The read range indicated by the handheld RFID reader and the sound range indicated by the sound indicator placed inside the acorn were measured. The results of this experiment are shown in Table 1 and Figure 9.
According to the data presented in Table 1 and Figure 9, the Sound indication range of the RFID acorn tag is almost double compared to the Reader indication range. In the most favourable orientation, the Sound indication and Reader indication ranges were 13.86 m and 7.77 m, respectively. In the worst case, the ranges dropped to 4.30 m and 1.07 m, respectively.

4. Discussion

In this paper, we have shown that there is a potential opportunity to use the RFID technique to track oak acorns. This method can also be used to track other small objects but rather in cases where their position distribution is measured in tens or eventually in a few hundred metres. To demonstrate this possibility, we have prepared several samples of RFID tags, both passive and semi-passive, in various antenna configurations. The tags we prepared were initially tested under laboratory conditions in an anechoic chamber in order to select the best case. It turned out that the winning solution, due to the maximum read range, was a semi-passive RFID tag.
In a further laboratory study, already on a selected semi-passive tag, it was found that the read range strongly depends on the close environment of the tag—it has decreased significantly in the soil environment. In addition, the antenna parameters changed and the tag antenna had to be re-tuned in the soil environment by shortening its length. Laboratory experimental results have shown that the semi-passive tag ’hears’ the reader’s query from a greater distance than it is able to respond to, which introduces the possibility of using an acoustic indication channel to determine the RFID tag’s location. To investigate this option, an additional semi-passive RFID tag with a sound indicator was constructed and then tested under quasi-real conditions. The results obtained in the quasi-real experiment confirmed a significant increase in the range of acorn localization using the acoustic communication channel. The use of the sound indicator in acorn tracking results in lower hardware requirements for the RWD reader, as the sensitivity of the reader to the backscattered signal is no longer relevant. Therefore, the RWD reader does not need to be state-of-the-art, it just needs to have high signal transmitting power so that it can be ‘heard’ by an RFID tag equipped with a sound indicator. It should be emphasised that the conditions of the quasi-real experiment do not fully correspond to real conditions and further research under natural scenery is needed. The winter season of research, unfortunately, did not allow us to carry out tests under real conditions. We intend to carry out additional tests (influence of antenna geometry, soil type and its humidity) as soon as spring arrives.

Author Contributions

Conceptualization, M.C. and P.J.-M.; methodology, M.C. and P.J.-M.; software, M.C., P.J.-M. and K.S.; validation, M.C., P.J.-M. and K.S.; investigation, M.C., P.J.-M. and K.S.; data curation, M.C.; writing—original draft preparation, M.C., P.J.-M. and K.S.; writing—review and editing, M.C., P.J.-M. and K.S.; visualization, M.C.; supervision, P.J.-M. All authors have read and agreed to the published version of the manuscript.

Funding

The research leading to these results has received funding from the commissioned task entitled “VIA CARPATIA Universities of Technology Network named after the President of the Republic of Poland Lech Kaczyński” contract no. MEiN/2022/DPI/2577 action entitled “In the neighborhood—inter-university research internships and study visits”. The laboratory stands built under the programs were used in the research experiments: (a) “EMC-LabNet—Polish Network of EMC Laboratories”, Smart Growth Operational Programme 2014–2020; Priority Axis IV: Increasing the Research Potential; Measure 4.2: Development of Modern Research Infrastructure of the Science Sector (Project No. POIR.04.02.00-02-A007/16), (b) “Regional Initiative of Excellence” program for years 2019–2023, financed by the Minister of Education and Science of the Republic of Poland (Project No. 027/RID/2018/19).

Institutional Review Board Statement

Not applicable.

Informed Consent Statement

Not applicable.

Data Availability Statement

The data can be shared up on request.

Conflicts of Interest

The authors declare no conflict of interest.

References

  1. Cochran, W.W.; Lord, R.D., Jr. A radio-tracking system for wild animals. J. Wildl. Manag. 1963, 27, 9–24. [Google Scholar] [CrossRef]
  2. Lahoz-Monfort, J.J.; Magrath, M.J. A comprehensive overview of technologies for species and habitat monitoring and conservation. BioScience 2021, 71, 1038–1062. [Google Scholar] [CrossRef]
  3. Thomas, B.; Holland, J.D.; Minot, E.O. Wildlife tracking technology options and cost considerations. Wildl. Res. 2011, 38, 653–663. [Google Scholar] [CrossRef]
  4. Singh, J.; Bais, B. Wildlife tracking with latest electronic technology. Int. J. Avian Wildl. Biol. 2018, 3, 238–240. [Google Scholar]
  5. Hofman, M.P.; Hayward, M.W.; Heim, M.; Marchand, P.; Rolandsen, C.M.; Mattisson, J.; Urbano, F.; Heurich, M.; Mysterud, A.; Melzheimer, J.; et al. Right on track? Performance of satellite telemetry in terrestrial wildlife research. PLoS ONE 2019, 14, e0216223. [Google Scholar] [CrossRef] [PubMed]
  6. Chabot, D.; Bird, D.M. Wildlife research and management methods in the 21st century: Where do unmanned aircraft fit in? J. Unmanned Veh. Syst. 2015, 3, 137–155. [Google Scholar] [CrossRef]
  7. Mesquita, G.P.; Mulero-Pázmány, M.; Wich, S.A.; Rodríguez-Teijeiro, J.D. A practical approach with drones, smartphones, and tracking tags for potential real-time animal tracking. Curr. Zool. 2023, 69, 208–214. [Google Scholar] [CrossRef] [PubMed]
  8. Desrochers, A.; Tremblay, J.A.; Aubry, Y.; Chabot, D.; Pace, P.; Bird, D.M. Estimating wildlife tag location errors from a VHF receiver mounted on a drone. Drones 2018, 2, 44. [Google Scholar] [CrossRef]
  9. Gottwald, J.; Zeidler, R.; Friess, N.; Ludwig, M.; Reudenbach, C.; Nauss, T. Introduction of an automatic and open-source radio-tracking system for small animals. Methods Ecol. Evol. 2019, 10, 2163–2172. [Google Scholar] [CrossRef]
  10. Finkenzeller, K. RFID Handbook: Fundamentals and Applications in Contactless Smart Cards, Radio Frequency Identification and Near-Field Communication; John wiley & Sons: New York, NY, USA, 2010. [Google Scholar]
  11. Chetouane, F. An overview on RFID technology instruction and application. IFAC-PapersOnLine 2015, 48, 382–387. [Google Scholar] [CrossRef]
  12. Floyd, R.E. RFID in animal-tracking applications. IEEE Potentials 2015, 34, 32–33. [Google Scholar] [CrossRef]
  13. Habedank, A.; Urmersbach, B.; Kahnau, P.; Lewejohann, L. O mouse, where art thou? The Mouse Position Surveillance System (MoPSS)—An RFID-based tracking system. Behav. Res. Methods 2022, 54, 676–689. [Google Scholar] [CrossRef]
  14. Ross, R.; Anderson, B.; Bienvenu, B.; Scicluna, E.L.; Robert, K.A. WildTrack: An IoT System for Tracking Passive-RFID Microchipped Wildlife for Ecology Research. Automation 2022, 3, 426–438. [Google Scholar] [CrossRef]
  15. Briggs, A.J.; Robstad, C.A.; Rosell, F. Using radio-frequency identification technology to monitor Eurasian beavers. Wildl. Soc. Bull. 2021, 45, 154–161. [Google Scholar] [CrossRef]
  16. Dyo, V.; Ellwood, S.A.; Macdonald, D.W.; Markham, A.; Trigoni, N.; Wohlers, R.; Mascolo, C.; Pásztor, B.; Scellato, S.; Yousef, K. WILDSENSING: Design and deployment of a sustainable sensor network for wildlife monitoring. ACM Trans. Sens. Netw. (TOSN) 2012, 8, 1–33. [Google Scholar] [CrossRef]
  17. Rafiq, K.; Appleby, R.G.; Edgar, J.P.; Radford, C.; Smith, B.P.; Jordan, N.R.; Dexter, C.E.; Jones, D.N.; Blacker, A.R.; Cochrane, M. WildWID: An open-source active RFID system for wildlife research. Methods Ecol. Evol. 2021, 12, 1580–1587. [Google Scholar] [CrossRef]
  18. Gómez, J.M.; Schupp, E.W.; Jordano, P. Synzoochory: The ecological and evolutionary relevance of a dual interaction. Biol. Rev. 2019, 94, 874–902. [Google Scholar] [CrossRef] [PubMed]
  19. Bossema, I. Jays and oaks: An eco-ethological study of a symbiosis. Behaviour 1979, 70, 1–116. [Google Scholar] [CrossRef]
  20. Bobiec, A.; Reif, A.; Öllerer, K. Seeing the oakscape beyond the forest: A landscape approach to the oak regeneration in Europe. Landsc. Ecol. 2018, 33, 513–528. [Google Scholar] [CrossRef]
  21. Pons, J.; Pausas, J.G. Acorn dispersal estimated by radio-tracking. Oecologia 2007, 153, 903–911. [Google Scholar] [CrossRef]
  22. Kurek, P.; Dobrowolska, D.; Wiatrowska, B. Dispersal distance and burial mode of acorns in Eurasian Jays Garrulus glandarius in European temperate forests. Acta Ornithol. 2019, 53, 155–162. [Google Scholar] [CrossRef]
  23. Wróbel, A.; Kurek, P.; Bogdziewicz, M.; Dobrowolska, D.; Zwolak, R. Avian dispersal of an invasive oak is modulated by acorn traits and the presence of a native oak. For. Ecol. Manag. 2022, 505, 119866. [Google Scholar] [CrossRef]
  24. Commission Implementing Decision (EU) 2019/1345 of 2 August 2019 Amending Decision 2006/771/EC Updating Harmonised Technical Conditions in the Area of Radio Spectrum Use for Short-Range Devices (Notified under Document C (2019) 5660) (Text with EEA Relevance). 2019. Available online: http://data.europa.eu/eli/dec_impl/2019/1345/oj (accessed on 8 December 2023).
  25. Jankowski-Mihułowicz, P.; Węglarski, M.; Chamera, M.; Pyt, P. Textronic UHF RFID Transponder. Sensors 2021, 21, 1093. [Google Scholar] [CrossRef] [PubMed]
  26. Balanis, C.A. Antenna Theory: Analysis and Design; John Wiley & Sons: New York, NY, USA, 2016. [Google Scholar]
  27. European Telecommunications Standards Institute. Radio Frequency Identification Equipment Operating in the Band 865 MHz to 868 MHz with Power Levels up to 2 W and in the Band 915 MHz to 921 MHz with Power Levels up to 4 W; Harmonised Standard for Access to Radio Spectrum; European Telecommunications Standards Institute: Valbonne, France, 2020. [Google Scholar]
  28. Voyantic. Tagformance, RAIN RFID and NFC Testing and Measurement System for Research & Development; Ver.Q3; Voyantic: Helsinki, Finland, 2023. [Google Scholar]
  29. Impinj, Inc. IMPINJ MONZA R6-P; Ver.7.0; Impinj, Inc.: Seattle, WA, USA, 2021. [Google Scholar]
  30. EM Microelectronic-Marin SA. EM4325; Ver.9.0; EM Microelectronic: Marin, Switzerland, 2017. [Google Scholar]
  31. Aaronia AG. Hyperlog®. Logper Antennas. 70 Series; Ver.6.0; Aaronia AG: Strickscheid, Germany, 2023. [Google Scholar]
  32. Zebra Technologies Corp. RFD90 Ultra-Rugged Uhf Rfid Sleds; Zebra Technologies Corp: Lincolnshire, IL, USA, 2022. [Google Scholar]
  33. Mohammed, N.A.; Sivakumar, M.; Deavours, D.D. An RFID tag capable of free-space and on-metal operation. In Proceedings of the 2009 IEEE Radio and Wireless Symposium, San Diego, CA, USA, 18–22 January 2009; pp. 63–66. [Google Scholar]
  34. Sidén, J.; Nilsson, H.E. RFID Antennas–Possibilities and Limitations. Radio Freq. Identif. Fundam. Appl. Des. Methods Solut. 2010, 5, 324. [Google Scholar]
  35. Solar, H.; Beriain, A.; Rezola, A.; Del Rio, D.; Berenguer, R. A 22-m Operation Range Semi-Passive UHF RFID Sensor Tag with Flexible Thermoelectric Energy Harvester. IEEE Sens. J. 2022, 22, 19797–19808. [Google Scholar] [CrossRef]
Figure 1. Selected RFID tags inside an oak acorn for anechoic chamber testing.
Electronics 13 00567 g001
Figure 2. Laboratory experimental set-up.
Electronics 13 00567 g002
Figure 3. RFID tags in the anechoic measurement chamber: ①—in the air environment, ②—in the soil environment.
Electronics 13 00567 g003
Figure 4. Quasi-real conditions experiment setup: ①—RFD9090 reader, ②—oak acorn with RFID sound tag in the soil environment.
Electronics 13 00567 g004
Figure 5. Read range of selected tags measured in the anechoic chamber.
Electronics 13 00567 g005
Figure 6. Read range of tag # 4 depends on the length of the antenna and the environment measured in the anechoic chamber.
Electronics 13 00567 g006
Figure 7. Read range vs. reader frequency for tag # 4 on the soil measured in the chamber.
Electronics 13 00567 g007
Figure 8. RFID tag with sound indication.
Electronics 13 00567 g008
Figure 9. Quasi-real conditions experiment result.
Electronics 13 00567 g009
Table 1. Quasi-real conditions experiment results.
Reader-Tag Orientation AngleSound Indication RangeReader Indication Range
[°][m][m]
9013.867.77
8012.637.70
7012.507.63
6011.577.52
509.506.66
408.706.52
307.904.23
205.253.21
104.302.16
04.301.07
Disclaimer/Publisher’s Note: The statements, opinions and data contained in all publications are solely those of the individual author(s) and contributor(s) and not of MDPI and/or the editor(s). MDPI and/or the editor(s) disclaim responsibility for any injury to people or property resulting from any ideas, methods, instructions or products referred to in the content.

