Article

Modeling and Operating Characteristics of Excitation System for Variable Speed Pumped Storage Unit with Full-Size Converter

1
State Grid Sichuan Electrical Power Research Institute, Chengdu 610041, China
2
School of Electrical Engineering and Automation, Wuhan University, Wuhan 430072, China
*
Author to whom correspondence should be addressed.
Electronics 2024, 13(3), 505; https://doi.org/10.3390/electronics13030505
Submission received: 2 December 2023 / Revised: 1 January 2024 / Accepted: 16 January 2024 / Published: 25 January 2024
(This article belongs to the Topic Distributed Generation and Storage in Power Systems)

Abstract

:
The variable speed pumped storage unit with a full-size converter (FSC-VSPSU) can provide fast and flexible regulation capacity for the power grid, assisting the rapid development of the new energy-dominated power systems, and its application is gradually becoming widespread. The excitation system of FSC-VSPSU is crucial for maintaining the motor-port voltage and further supports the stable operation of the entire unit. However, there is currently no research on excitation system modeling, and their essential operating characteristics have not been discussed in detail, which needs further study. With this aim, this paper firstly establishes a detailed transfer function model for FSC-VSPSU, which is then used to study the influence rules of FSC-VSPSU parameters on the operating characteristics. In addition, based on the summarized operating characteristics, the excitation system can be optimized, and its complexity is greatly reduced while ensuring the original performance of the unit. Finally, the results of the simulation can verify the correctness of the established model and the explored operating characteristics.

1. Introduction

Nowadays, renewable clean energy such as wind/photovoltaic power generation has developed rapidly to cope with the energy crisis and protect the natural environment [1,2,3]. However, these types of power generators have strong volatility, intermittency, and randomness, which require the power grid to possess more power regulation capacities to suppress these shortcomings. In order to improve the flexible regulation capacities of the power grid, it is important to develop energy storage [4,5], especially pumped storage units since they have a large adjustable capacity [6,7,8]. Among them, the variable speed pumped storage unit (VSPSU) based on power electronic technology has excellent regulation speed, which attracts much attention [9,10,11,12].
Further, in terms of VSPSU, depending on the role and power share of its converter, it can be divided into two types: VSPSU with a full-size converter (FSC-VSPSU) and VSPSU with a doubly fed induction machine (DFIM-VSPSU). These two types of units have their own unique advantages. In detail, FSC-VSPSU has a wider adjustment range and simpler startup and shutdown processes. DFIM-VSPSU has a converter with a lower capacity, resulting in lower costs. Under the premise of a converter with the same capacity, the overall output power of DFIM-VSPSU is higher, while the overall output power of FSC-VSPSU is lower. Therefore, for applications requiring low capacity, FSC-VSPSU is more suitable, while for large-capacity systems, DFIM-VSPSU has more advantages. This article focuses on FSC-VSPSU.
FSC-VSPSU is mainly composed of upper/lower reservoirs, a pump turbine, power electronic converters, an excitation system, and a speed regulator, etc. [13,14]. It has two working modes: a power generation mode and a pumping mode. The former mode drives the pump turbine to rotate and generate electricity by discharging the water from the upper reservoir to the lower reservoir. The latter mode takes energy from the power grid and then drives the pump turbine to pump water from the lower reservoir to the upper reservoir [12,15,16]. In order to ensure the stable operation of the entire working process, a stable and excellent motor-port voltage is extremely important. To achieve it, an excitation system that performs well is one of the crucial parts.
In order to evaluate the performance of the excitation system, it is particularly important to accurately model it. However, the existing modeling method often focuses on simulation models, and the operating characteristics of the unit can be summarized by the simulation analysis. For example, ref. [13] studies the simulation modeling of FSC-VSPSU based on MATLAB/SIMULINK, including the complete unit links (speed regulator, hydraulic system, water hammer effect, DC excitation system, full-size power converter, et al.) and multiple operation modes. To reduce the total harmonic distortion, a cascaded H-bridge-based structure is adopted in [17], and the corresponding simulation model verifies the correctness of the method. Further, a neutral point clamped structure proposed in [18] provides a larger output voltage than a conventional structure, and the corresponding simulation model also verifies its correctness. Moreover, a disturbance-rejection-based AC excitation controller is proposed in [19], and the built simulation model verifies its effectiveness. In addition, the simulation models built in [14,20,21] also conduct their corresponding validation with the simulation methods.
The above simulation-based models only rely on simulation analyses to find the operating rules and verify their corresponding conclusions and cannot explore the essential operating characteristics. It is crucial to establish the mathematical model for a more comprehensive and in-depth analysis of operational characteristics. As for the mathematical model of the excitation system, a deduced third-order model of the excitation system is helpful in designing the MIMO nonlinear control strategy of the power system [22]. However, this study is conducted at the level of a large-scale system, and it is not suitable for single-machine system analysis. Moreover, a linearization model based on the nonlinear partial feedback linearization technique is proposed in [23] to design the excitation controller. Ref. [24] gives an excitation system state evaluation model to fully grasp the state of the excitation system. These models are established to analyze the performance of the certain aspect of the machine and cannot be directly used to comprehensively analyze the operating characteristics of the excitation system of the FSC-VSPSU. In addition, there is currently no detailed research in the literature on the modeling and operational characteristics of the excitation system of the FSC-VSPSU.
To achieve this aim, this paper proposes a transfer-function-based mathematical model for the excitation system of FSC-VSPSU, and the corresponding operating characteristics can be obtained by through Bode diagram analysis. The main contributions are listed as follows.
(1) The detailed parameter influence rules of the excitation system on the FSC-VSPSU are obtained for the first time, which can be applied to guide the debugging of actual units in engineering sites.
(2) By studying the operating characteristics, a simplified excitation system structure is proposed, which can greatly reduce the complexity of the excitation system while ensuring the overall operational performance of the unit.
The rest of the paper is organized as follows. Section 2 gives the structure of the FSC-VSPSU. Further, the mathematical models of the excitation system are introduced in Section 3. Section 4 presents the corresponding operating characteristics of the excitation system for the FSC-VSPSU. Afterwards, Section 5 shows the simulation validation. Finally, Section 6 concludes this paper.

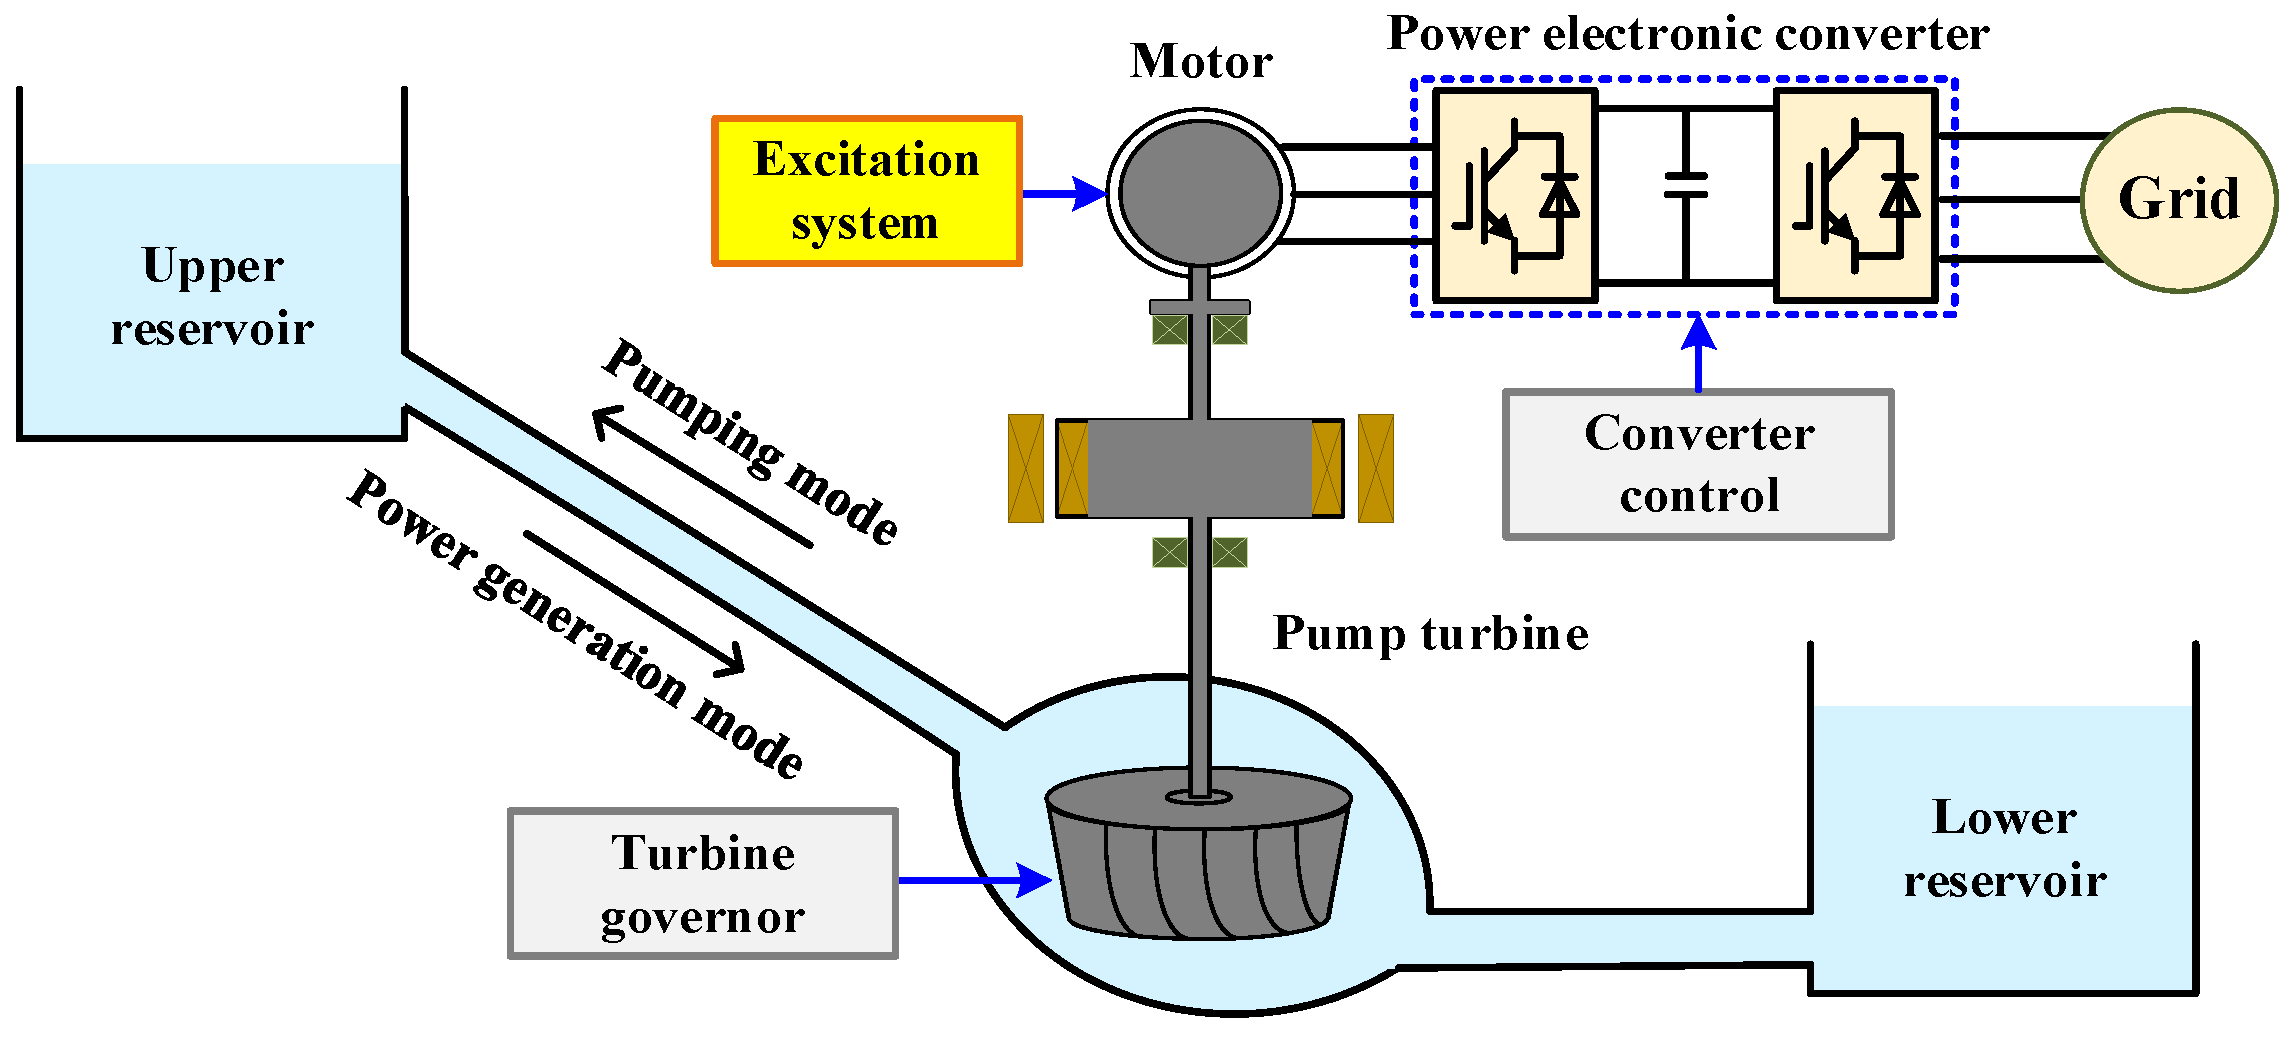
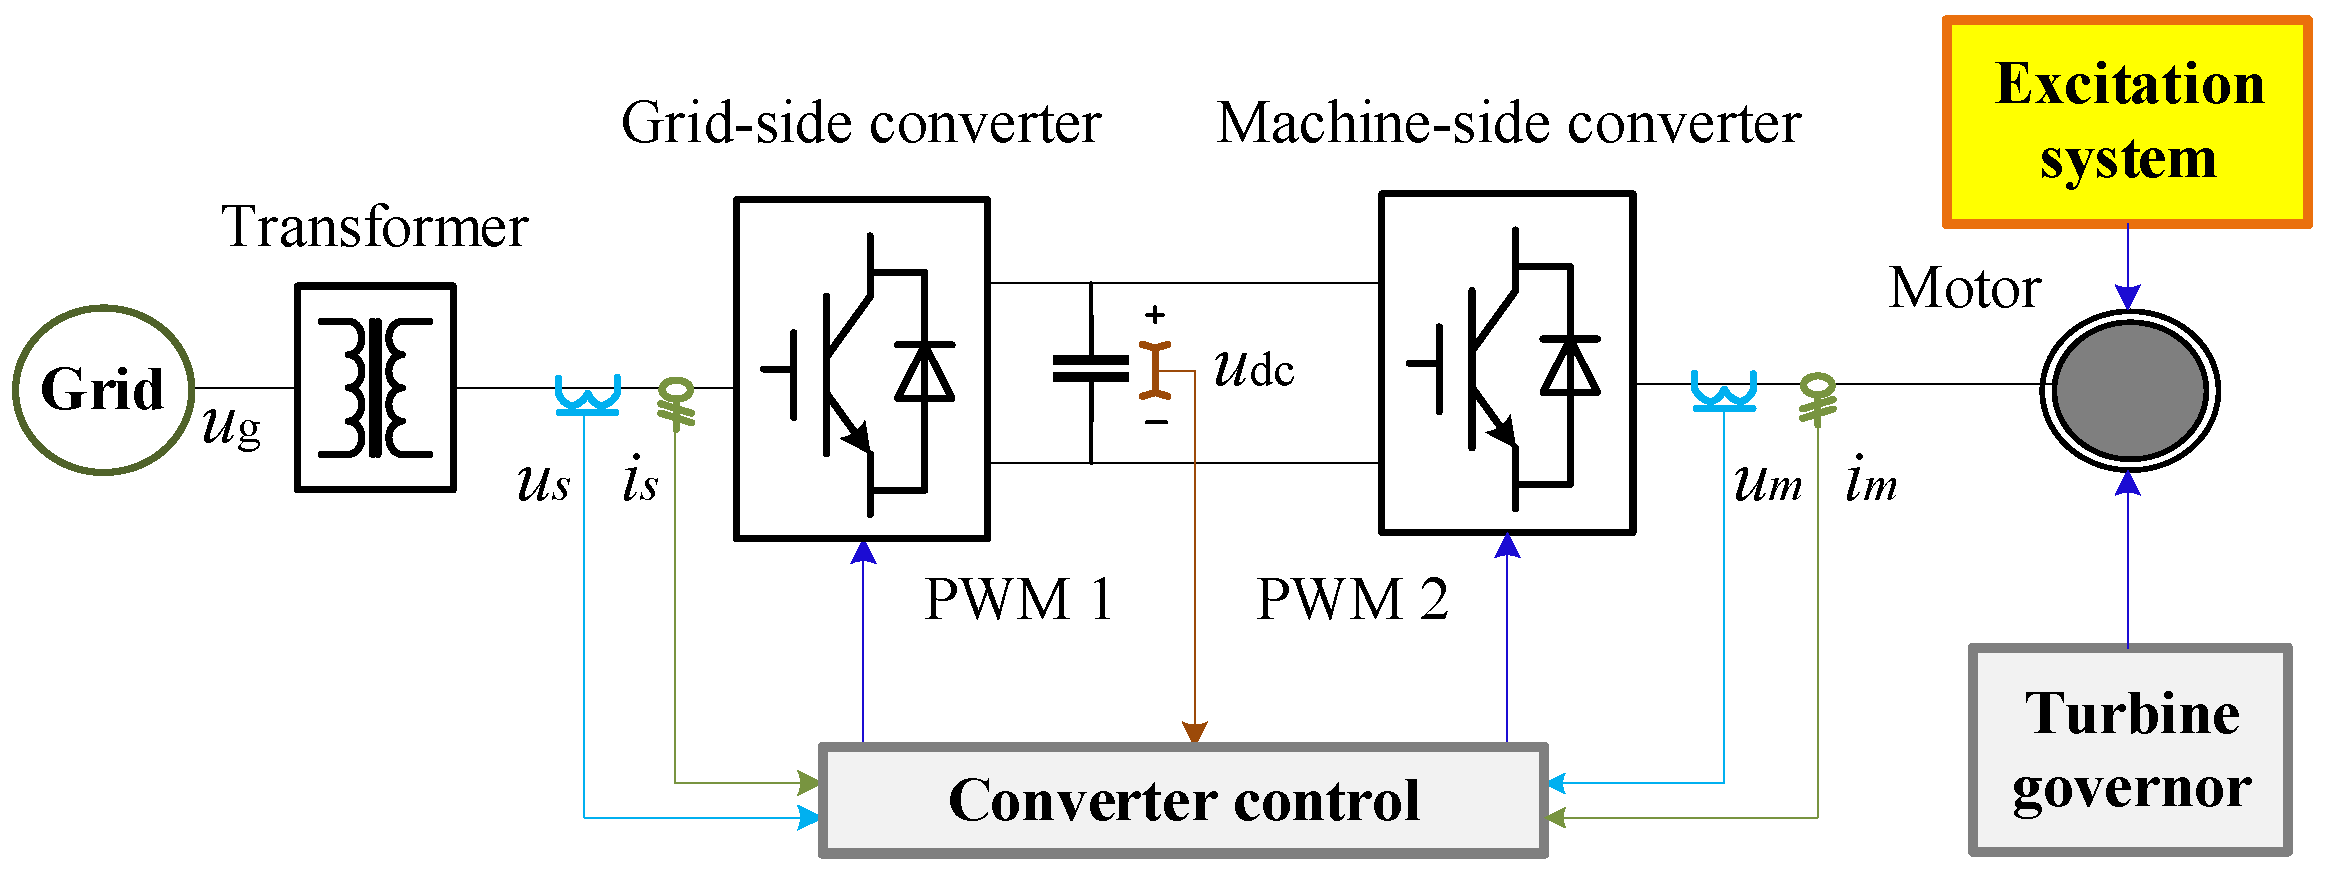
2. Structure of the FSC-VSPSU

The structural diagram of the FSC-VSPSU is shown in Figure 1, which mainly consists of upper/lower reservoirs, a pump turbine, a power electronic converter, a turbine governor, an excitation system, and converter control. The upper and lower reservoirs mainly serve as water storage, and the pump turbine is a mechanical transmission part. These two parts can work together to achieve the mutual conversion of potential energy and mechanical kinetic energy. The power electronic converter can achieve rapid and controllable power conversion between the motor and the power grid. By coordinating the turbine governor, excitation system, and converter control, the FSC-VSPSU can operate reliably and efficiently.
According to the operating status of the connected power grid, the FSC-VSPSU can operate in two modes: (1) power generation mode and (2) pumping mode. When there is surplus electric energy in the power grid, the FSC-VSPSU is in the pumping mode. Further, when the electric energy of the power grid is insufficient, the FSC-VSPSU is in the power generation mode.
(1) Power generation mode: The water stored in the upper reservoir flows to the lower reservoir under the action of gravity, which drives the pump turbine to rotate for power generation. The generated electric energy can be transformed and connected to the grid through the power electronic converters.
(2) Pumping mode: The electrical energy of the power grid is transformed by the power electronic converter to drive the motor to rotate. Thereby, the pump turbine can be driven to rotate and pump water from the lower reservoir to the upper reservoir for storage.
Importantly, the energy of the power generation mode flows from the unit to the grid, while the energy of the pumping mode flows from the grid to the unit, and there are some challenges here. It is necessary to use a four-quadrant converter to achieve bidirectional energy flow. In addition, apart from the converter, the pump turbine is different from the turbine used in ordinary hydropower plants as it can rotate in both directions to achieve bidirectional energy flow.
By switching between these above two operating modes, the fluctuation of electricity in the power grid can be quickly suppressed. The research objective of this paper is the excitation system of the FSC-VSPSU, and the next section will introduce the corresponding method for establishing mathematical models of the excitation system.

3. Mathematical Models of the Excitation System

The excitation system of the FSC-VSPSU controls the motor-port voltage, and it further determines the operating performance of the FSC-VSPSU. This article only studies the impact of the excitation system on the motor-port voltage, which falls within the scope of single-input and single-output (SISO) research. Thus, transfer function analysis is used in this section instead of establishing a more complex state space model. In the following content, Section 3.1 will introduce the detailed structure of the excitation system and Section 3.2 will establish the transfer-function-based mathematical model.

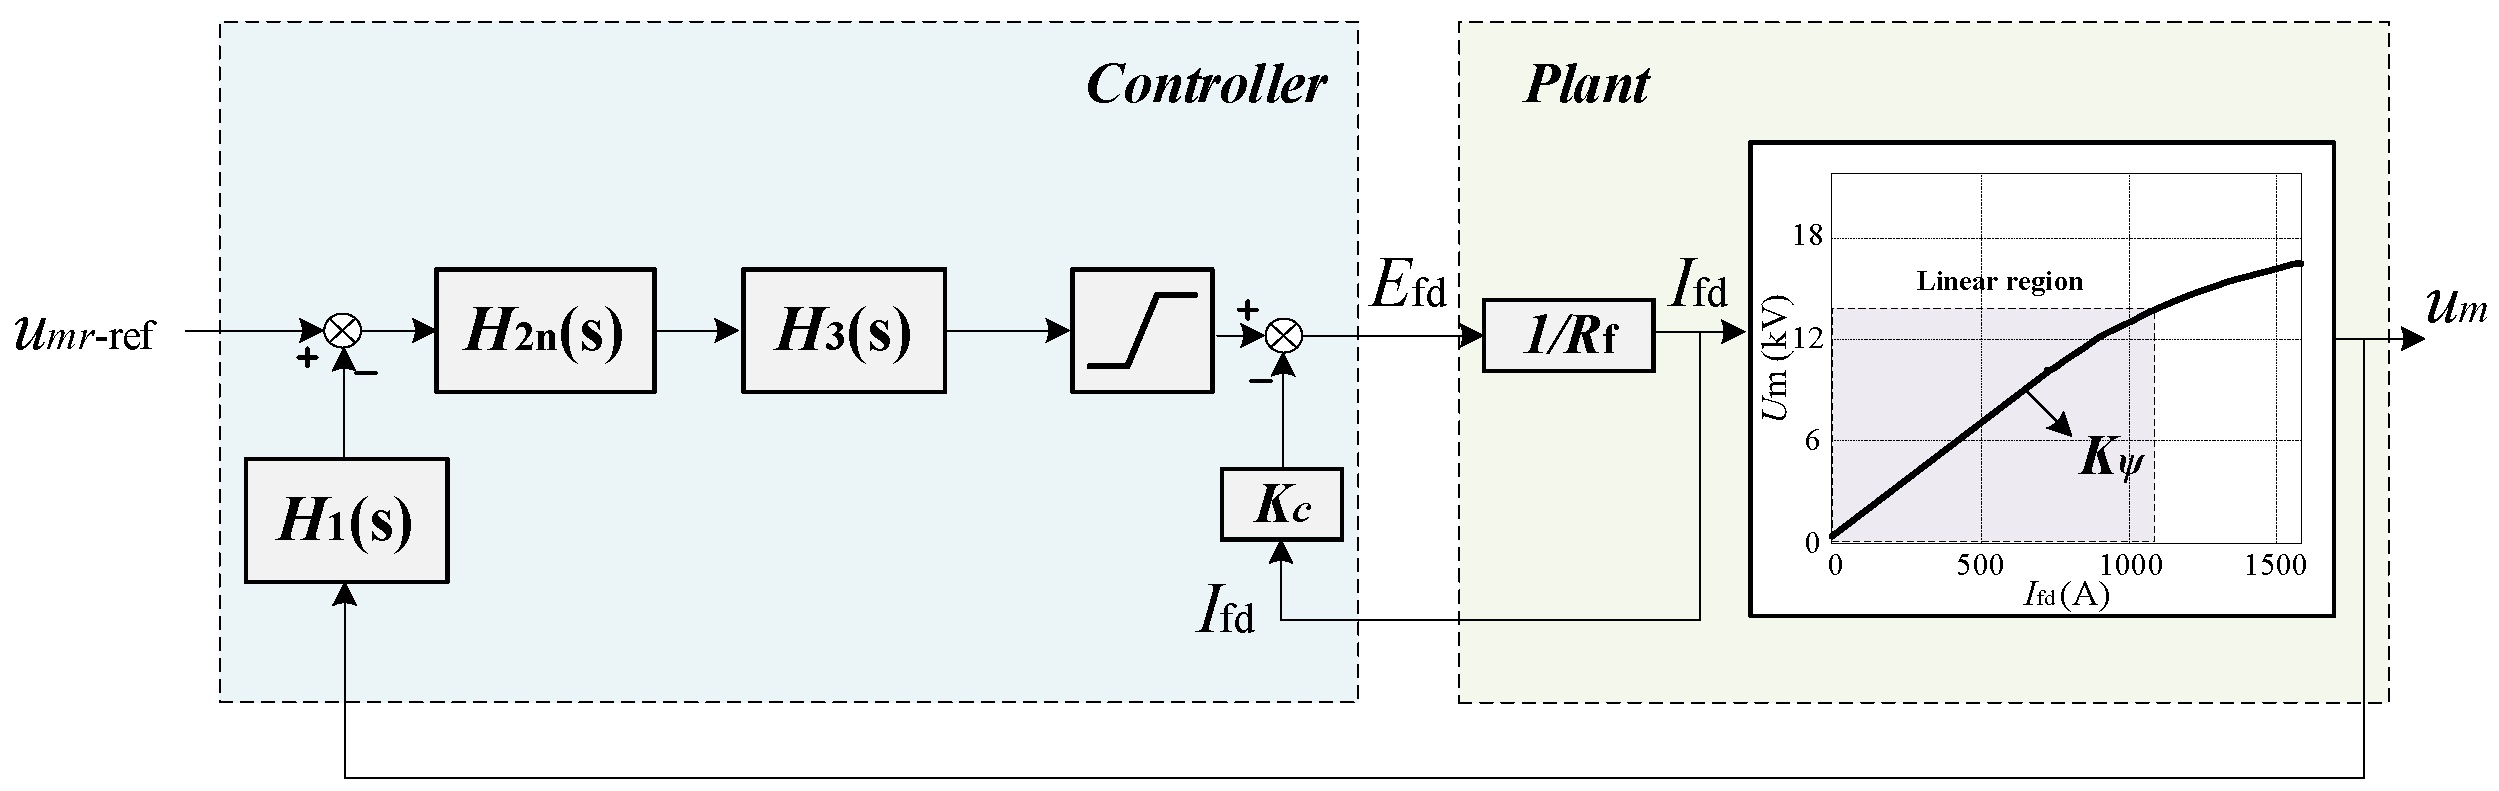
3.1. Structure of the Excitation System

The structure diagram of the excitation system is shown in Figure 2. H1(s) is the sampling link, which can describe the delay characteristics caused by sampling. H2(s) is the series compensation link, which can be used to adjust the phase margin of the system and improve its stability. H3(s) is the power amplification link, with which the tracking error of the output voltage can be reduced. H4(s) is the parallel correction link, which can eliminate the impact of some original system parameters to make the system more controllable. Finally, the limiter can constrain the phenomena of over-excitation and under-excitation, and prevent unstable operation caused by over-excitation and under-excitation. Furthermore, more detailed descriptions can be found in [13].
Among them, the expressions for H1(s), H2(s), H3(s), and H4(s) can be expressed as
H 1 ( s ) = 1 1 + s T c H 2 ( s ) = K 1 + s T 1 K v + s T 2 · 1 + s T 3 1 + s T 4 H 3 ( s ) = K a 1 + s T a H 4 ( s ) = s K f 1 + s T f
where Tc is the time constant of the sampling link; T1, T2, T3, and T4 are the time constants of the series compensation link; K is the DC gain of the series correction link; KV is the integration correction selection factor; Ka is the gain of the power amplification link; Ta is the time constant of the power amplification link; Kf is the gain of the parallel correction link; and Tf is the time constant of the parallel correction link.

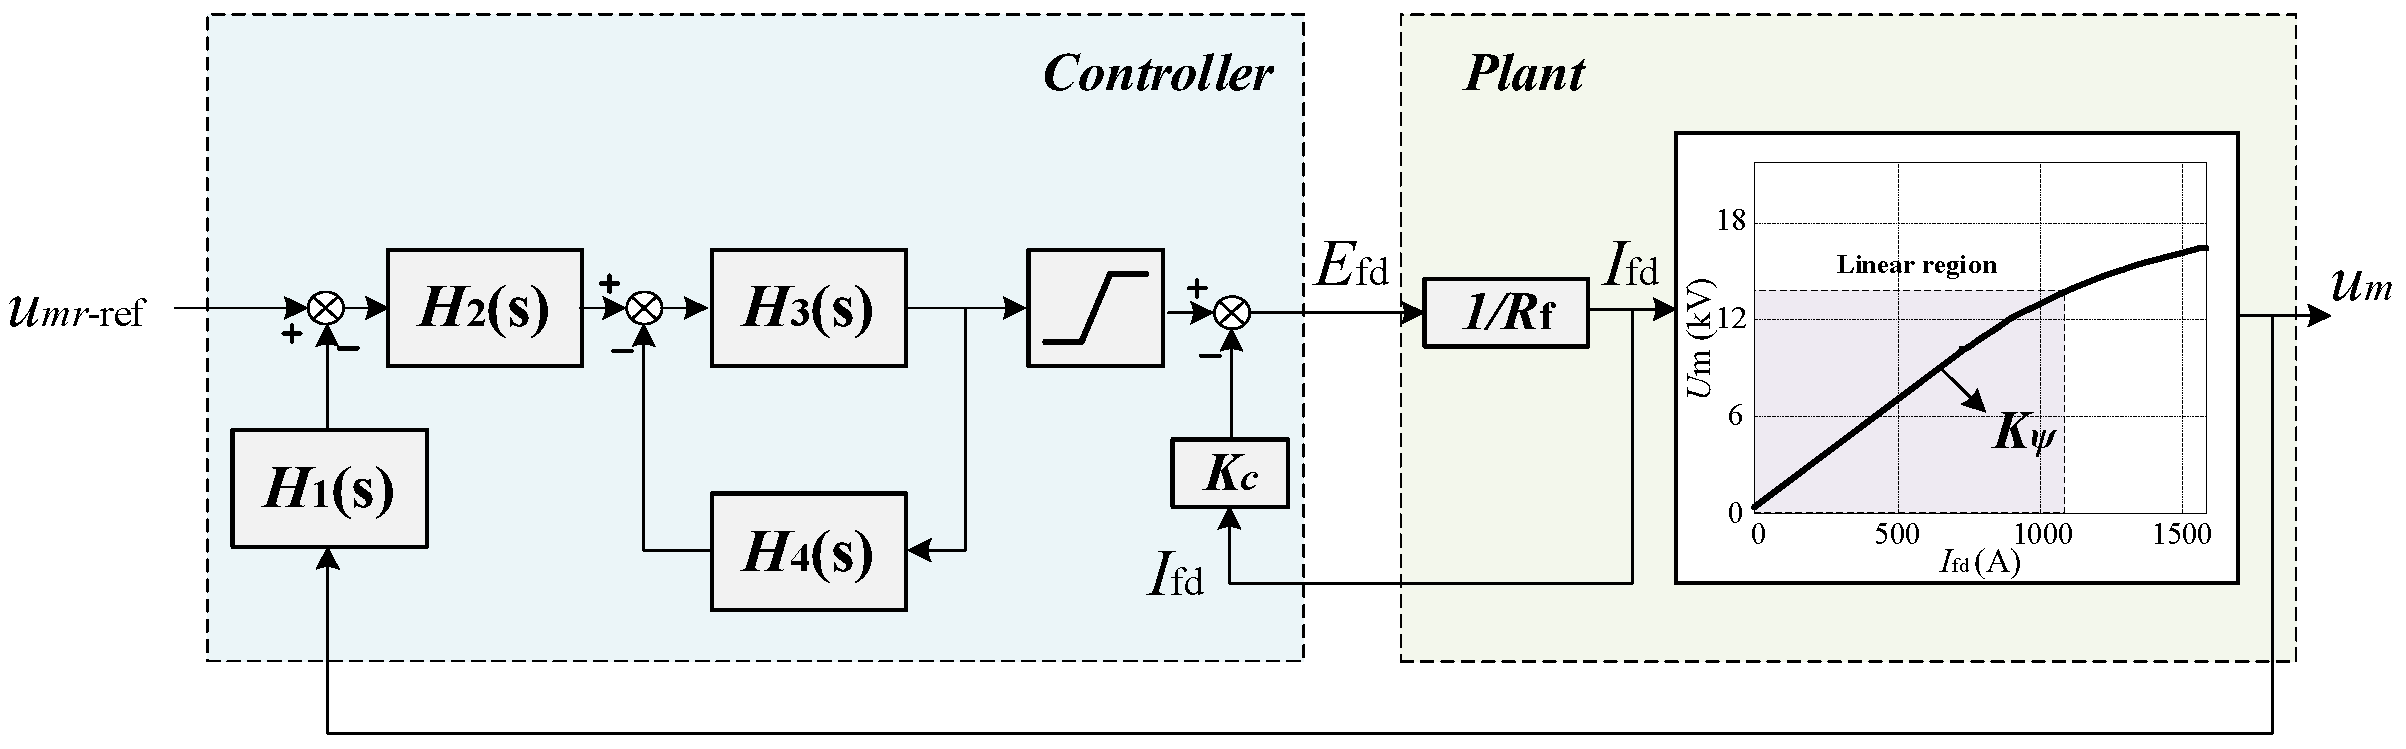
3.2. The Transfer-Function-Based Mathematical Model

In order to establish the relationship between the excitation system and the motor-port voltage, this section will use the excitation system model shown in Section 3.1 combined with the circuit model for derivation. Using the closed-loop control of the motor-port voltage, the corresponding excitation voltage Efd can be generated, and then the excitation current Ifd can be further calculated. Combined with the excitation characteristic curve, the motor-port voltage can be obtained. The corresponding circuit model can be expressed in (2).
I fd = E fd / R f u m = I fd × K ψ
where Rf is the resistance value of the excitation winding and Kψ is the mapping relationship between the excitation current and motor-port voltage, which can be obtained from the excitation characteristic curve of the motor. The corresponding block diagram of the excitation system is shown in Figure 3.
Further, the open-loop transfer function of the entire excitation system can be obtained, as shown in (3).
T o _ e ( s ) = K ψ H 1 ( s ) H 2 ( s ) H 3 ( s ) 1 + H 3 ( s ) H 4 ( s ) ( K c + R f )
Substituting (1) into (3) yields
T o _ e ( s ) = K ψ K a K · ( A s 3 + B s 2 + C s + D ) ( K c + R f ) ( E s 5 + F s 4 + G s 3 + H s 2 + I s + K v )
Among them, the coefficients are shown in (5). Further, according to (5), the Bode diagram of the excitation system can be obtained, as shown in Figure 4. The basic parameters are listed in Table 1.
A = T 1 T 3 T f B = T 1 T f + T 1 T 3 + T 3 T f C = T 1 + T 3 + T f D = 1 E = T 2 T 4 T a T c T f F = T 2 T 4 T c ( T a + T f + K a K f ) + T a T f ( T 2 T c + T 2 T 4 + K v T 4 T c ) G = T 2 T 4 T c + ( T a + T f + K a K f ) ( T 2 T c + T 2 T 4 + K v T 4 T c ) + T a T f ( T 2 + K v T c + K v T 4 ) H = T 2 T c + T 2 T 4 + K v T 4 T c + ( T a + T f + K a K f ) ( T 2 + K v T c + K v T 4 ) I = T 2 + K v T c + K v T 4 + K v T f + K v T a + K v K a K f
In Figure 4, due to the direct control of the effective value of the motor-port voltage by the excitation system, the amplitude gain at the low-frequency band is maximized, which can accurately control the DC voltage. Meanwhile, as the frequency band increases, in the higher frequency region, the amplitude gain decays quickly, which can effectively avoid the interference of higher-order harmonics in the excitation system. Furthermore, when the low-frequency gain of the transfer function is larger, the tracking performance of the system output is better. Since the crossover frequency is similar to the bandwidth, the higher the crossover frequency, the faster the system response speed. The phase margin reflects the stability of the system, and a larger phase margin will bring stronger stability.

4. Operating Characteristics of the Excitation System for the FSC-VSPSU

This section analyzes the influence rules of excitation system parameters on the operating characteristics of the FSC-VSPSU, including the time constants of the series compensation link (T1, T2, T3, and T4), DC gain of the series correction link K, integral correction selection factor KV, power amplification gain Ka, time constant of the power amplification link Ta, and gain of the parallel correction link Kf. Further, by studying the operating characteristics, a simplified excitation system structure is proposed.

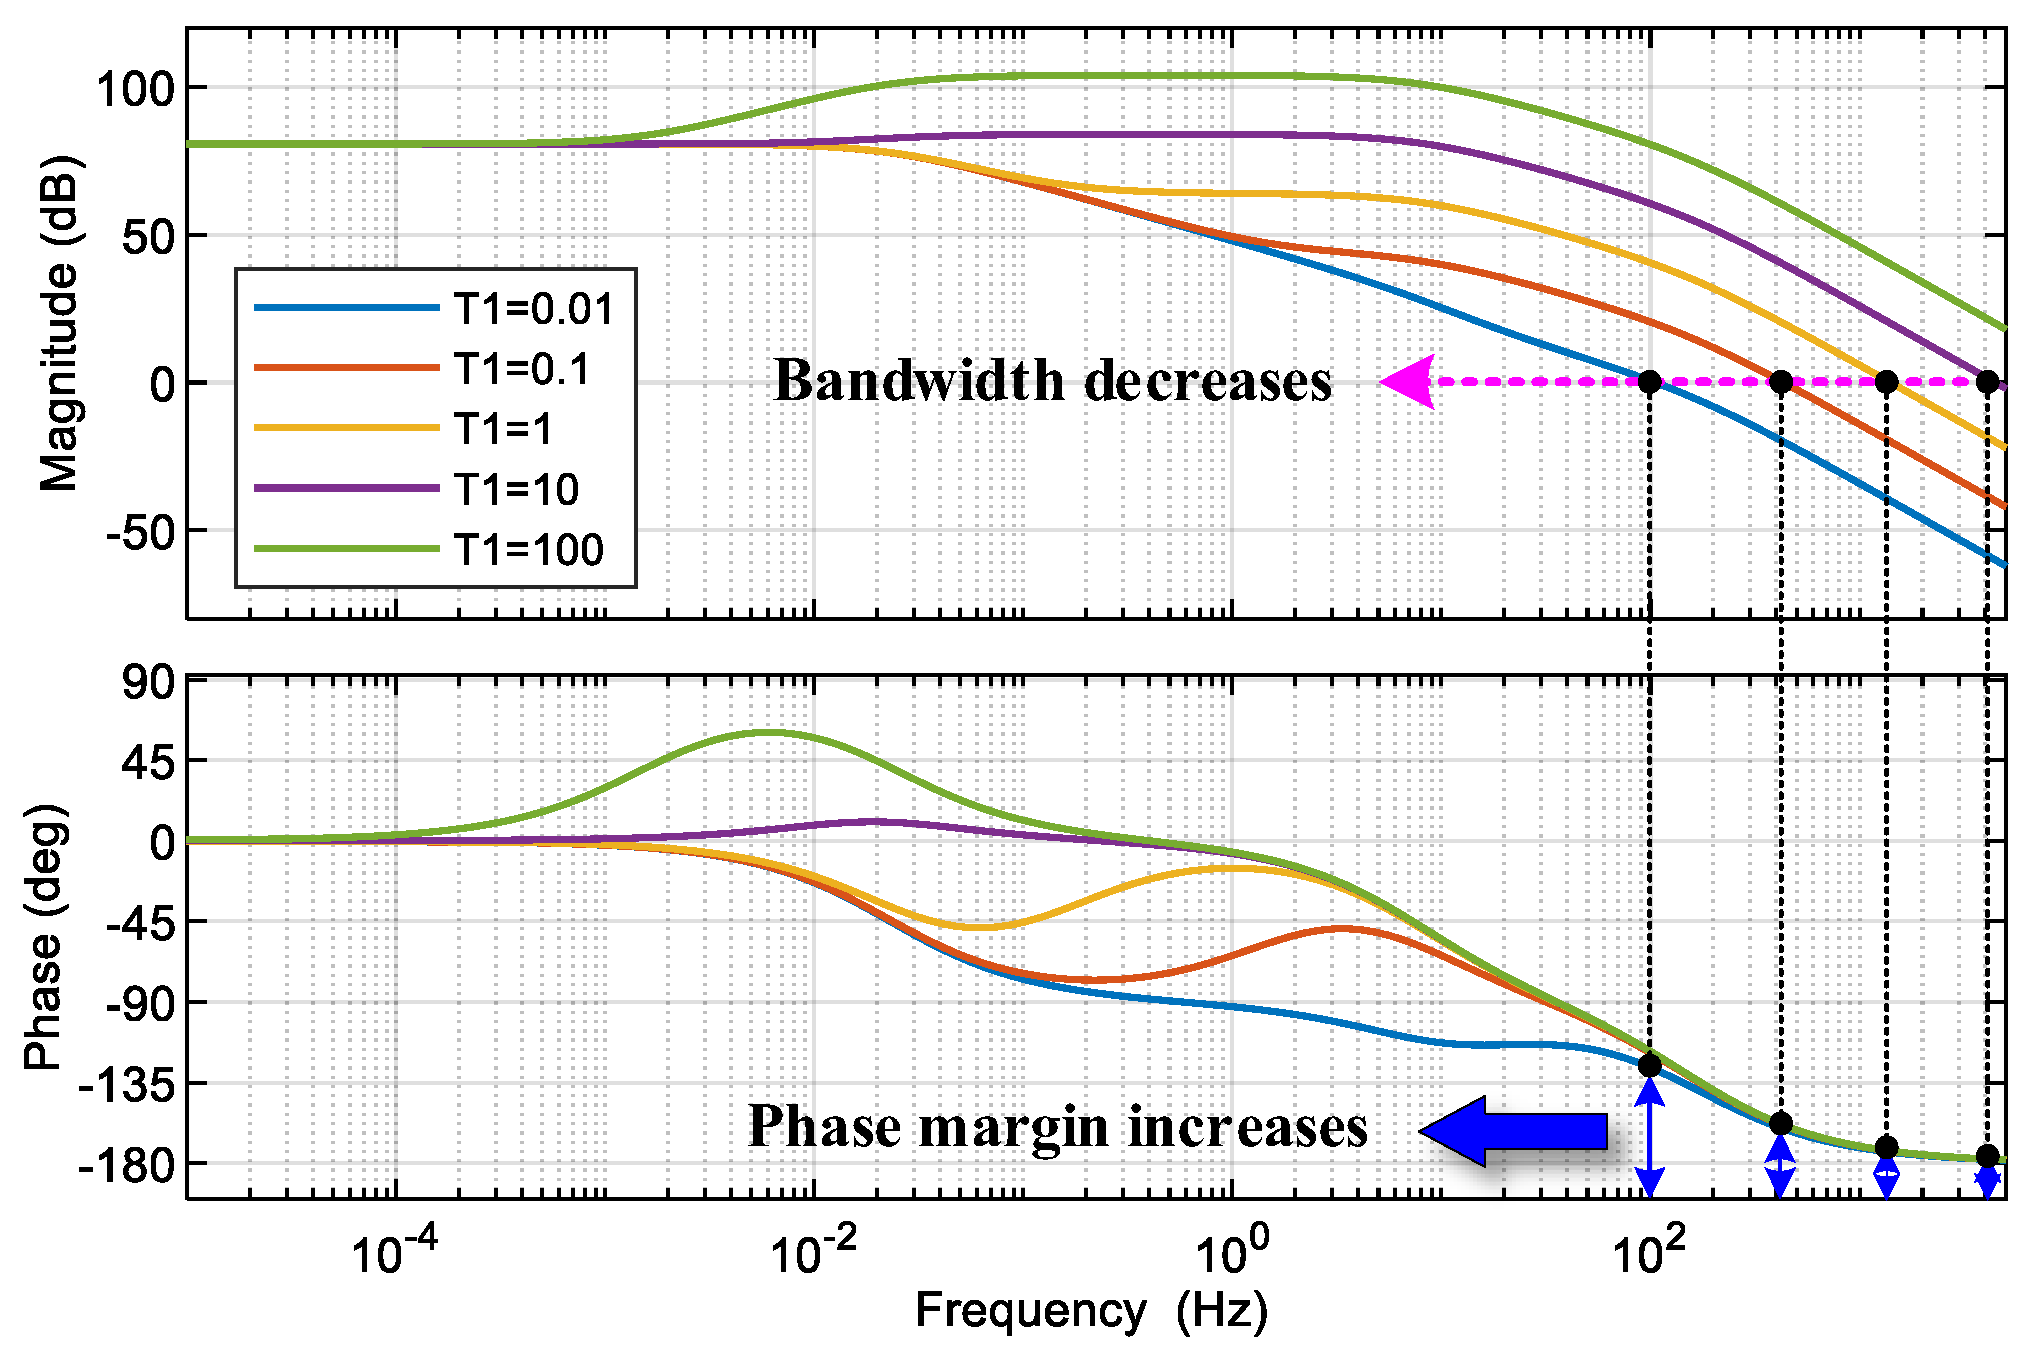
4.1. The Influence Rule of Time Constant T1

When the time constant T1 of the series compensation link is set as 0.01, 0.1, 1, 10, and 100 sequentially, the corresponding Bode diagram is shown in Figure 5. As can be seen, a smaller T1 will bring a greater phase margin to the system, thus the system stability will be strengthened. However, a smaller T1 also produces a smaller bandwidth, and the system response time will be longer. Noteworthily, since the influence rule of T3 is consistent with that of T1 (T1 and T3 exchange positions, and the transfer function remains the same), the following content will not elaborate on the influence rule of T3.

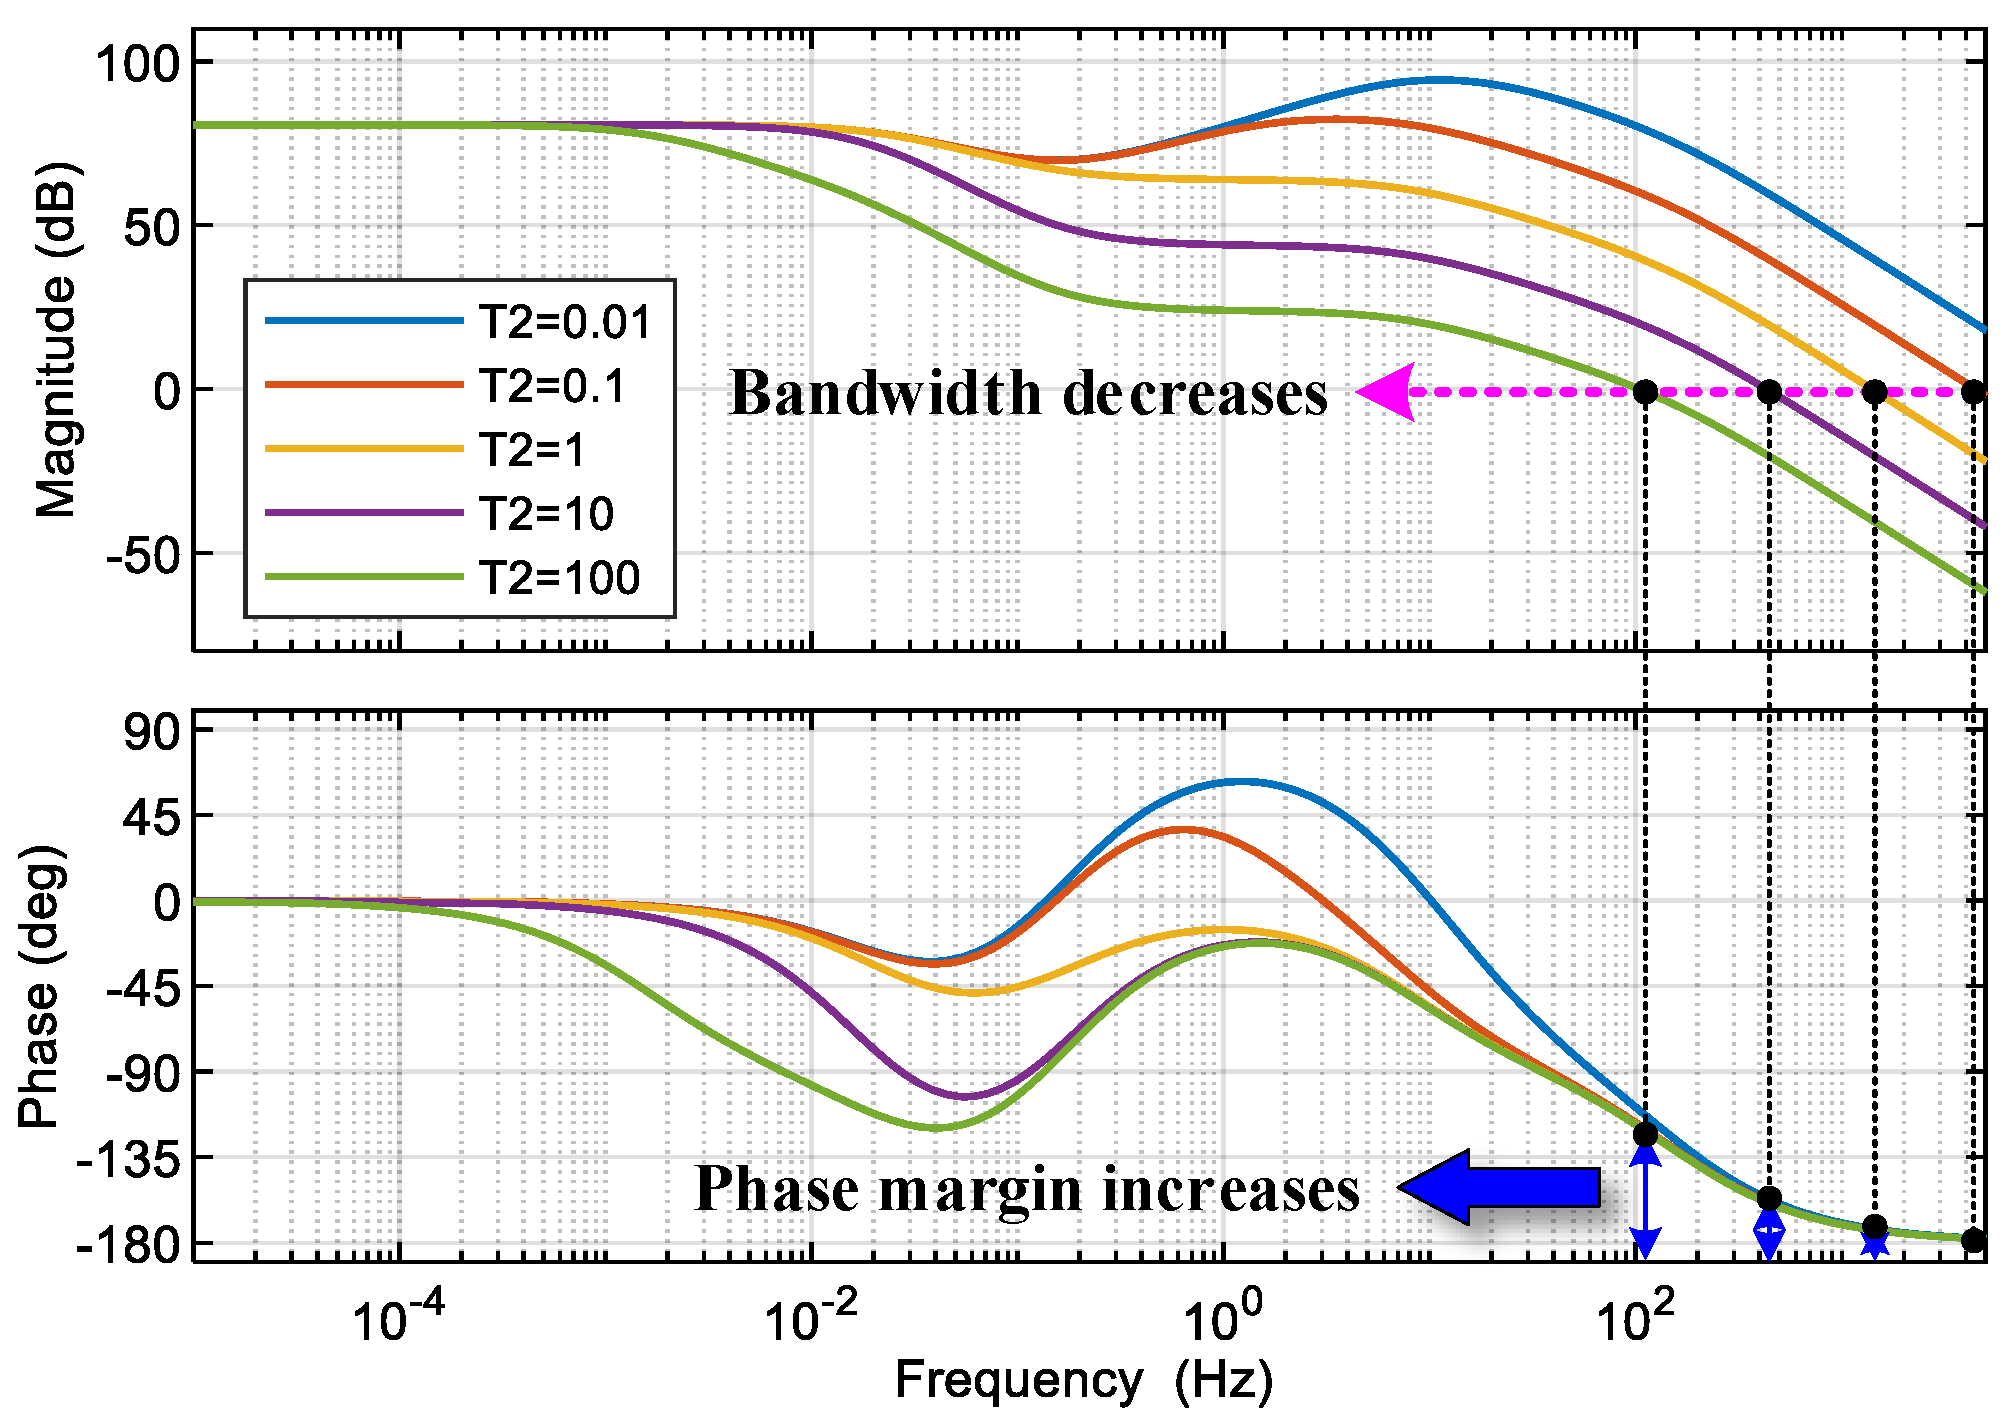
4.2. The Influence Rule of Time Constant T2

When the time constant T2 of the series compensation link is set as 0.01, 0.1, 1, 10, and 100 sequentially, the corresponding Bode diagram is shown in Figure 6. Contrary to the influence rule of T1, a larger T2 will bring a greater phase margin to the system, thus the system’s stability is stronger. In addition, the larger T2 is, the smaller the system bandwidth, and the response time will be worse. Noteworthily, the influence rules of Ta and T4 are consistent with T2, so the following content will not elaborate on the influence rules of Ta and T4.

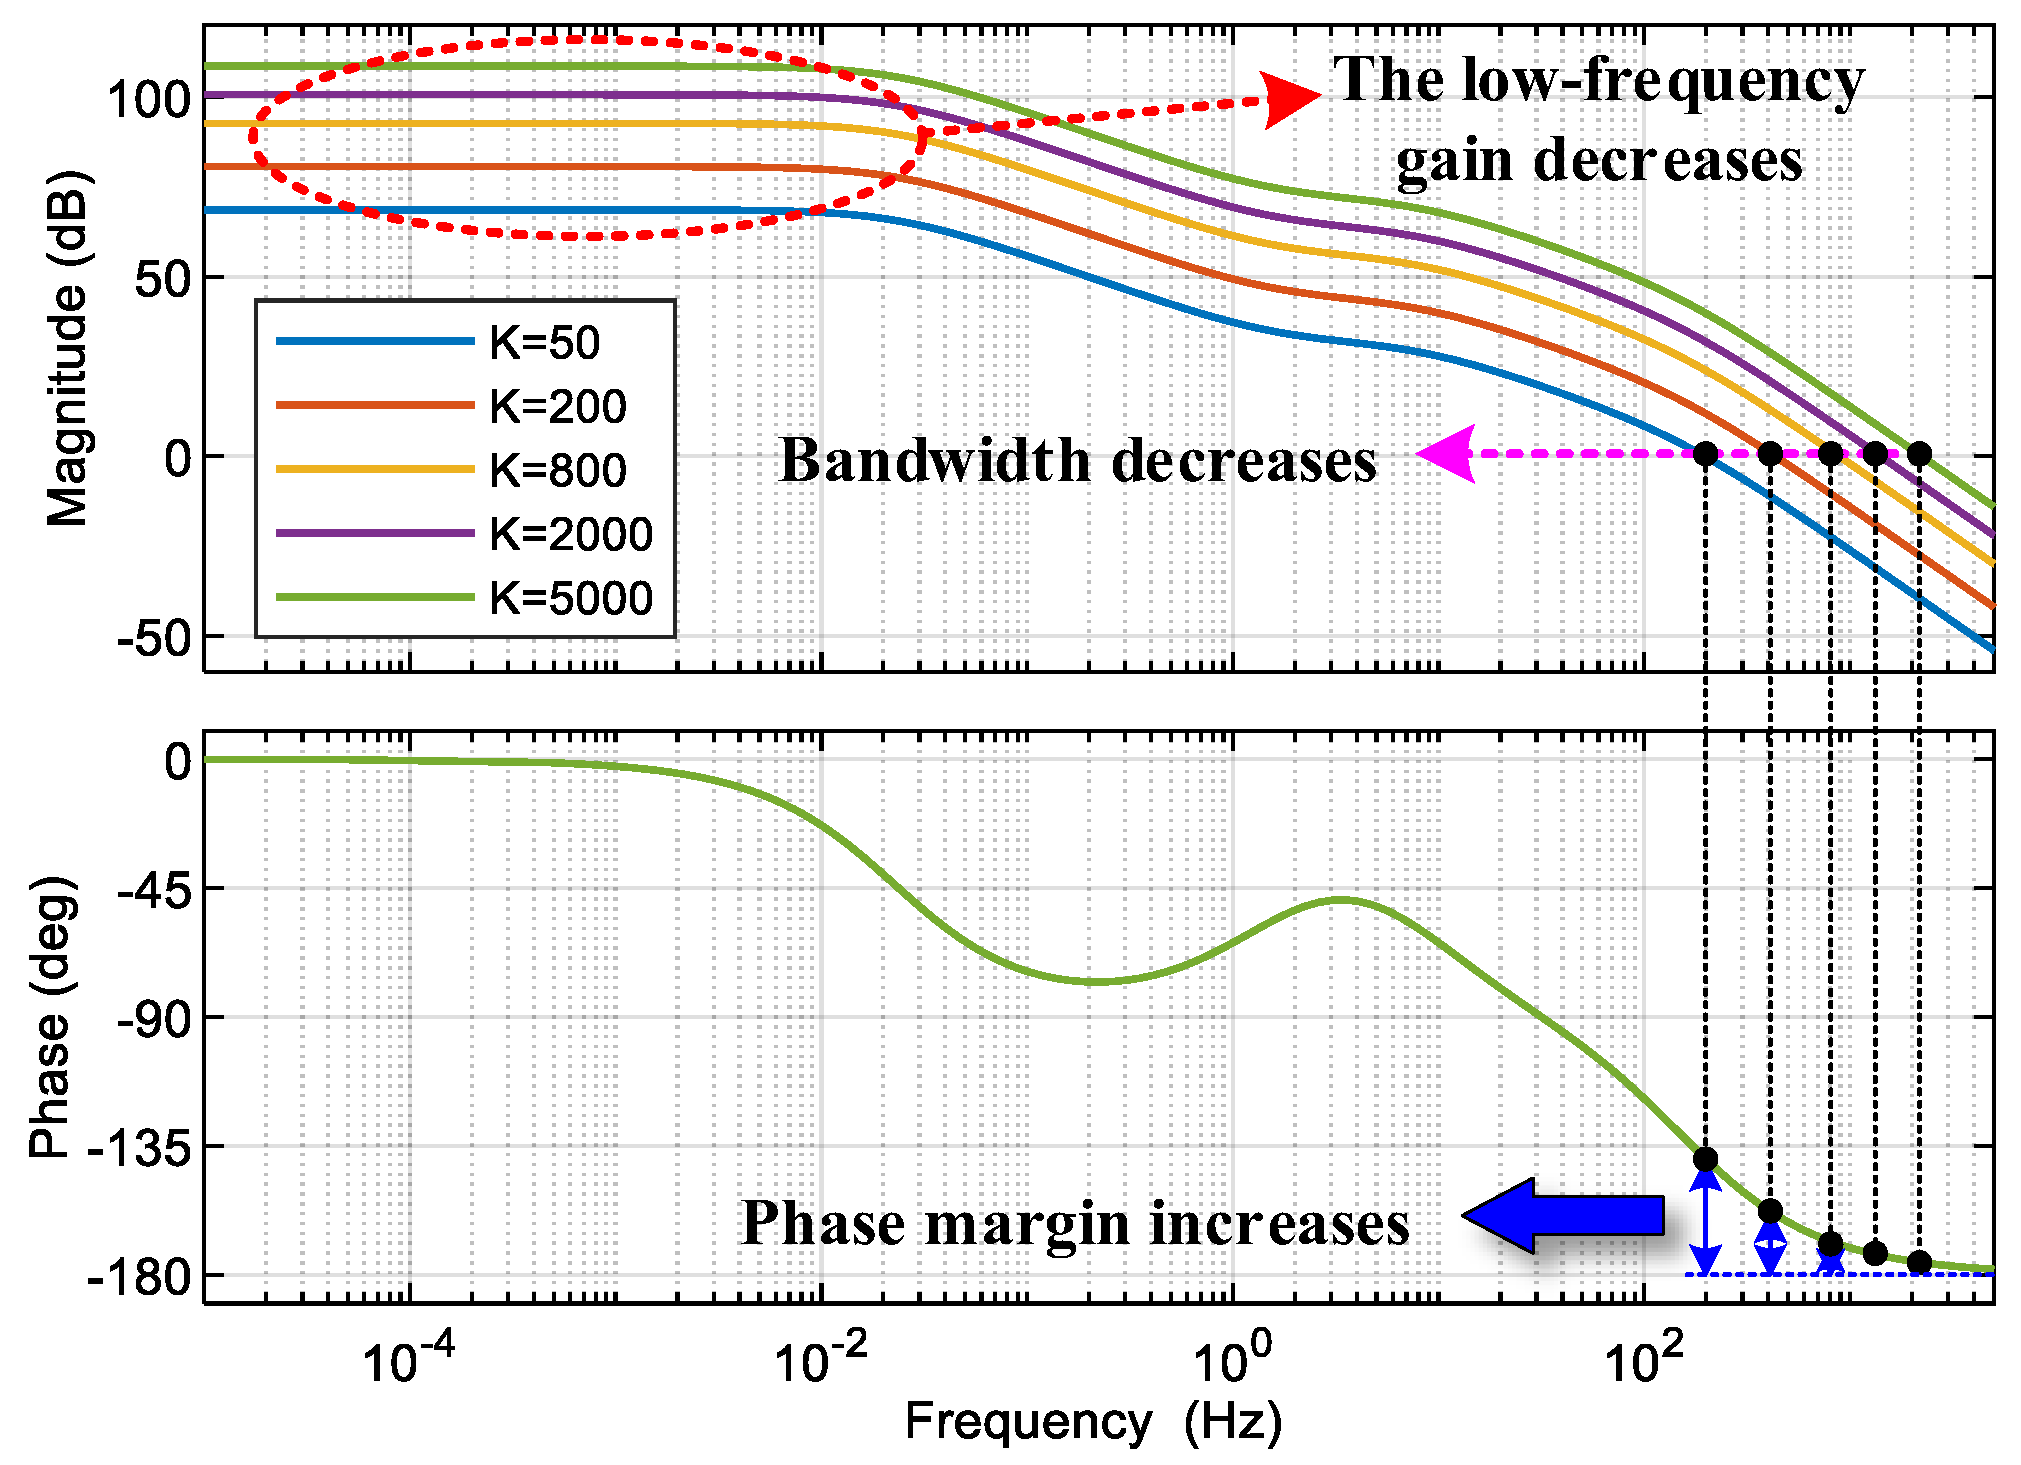
4.3. The Influence Rule of DC Gain K

When the DC gain K of the series correction link is set as 50, 200, 800, 2000, and 5000 sequentially, the corresponding Bode diagram is shown in Figure 7. As can be seen, K only affects the amplitude gain of the system with no effect on the phase-frequency characteristics. A smaller K will make the phase margin greater, and the corresponding stability of the system will be stronger. In addition, a smaller K also brings a smaller bandwidth, thus making the response time longer. Noteworthily, unlike the influence rules of time constants T1~T4, (the low-frequency gain does not change with the time constants), the low-frequency gain of the system will be smaller as K decreases, which results in the poor tracking performance of the motor-port voltage. Furthermore, the influence rule of Ka in the power amplification link is consistent with K and will not be repeated below.

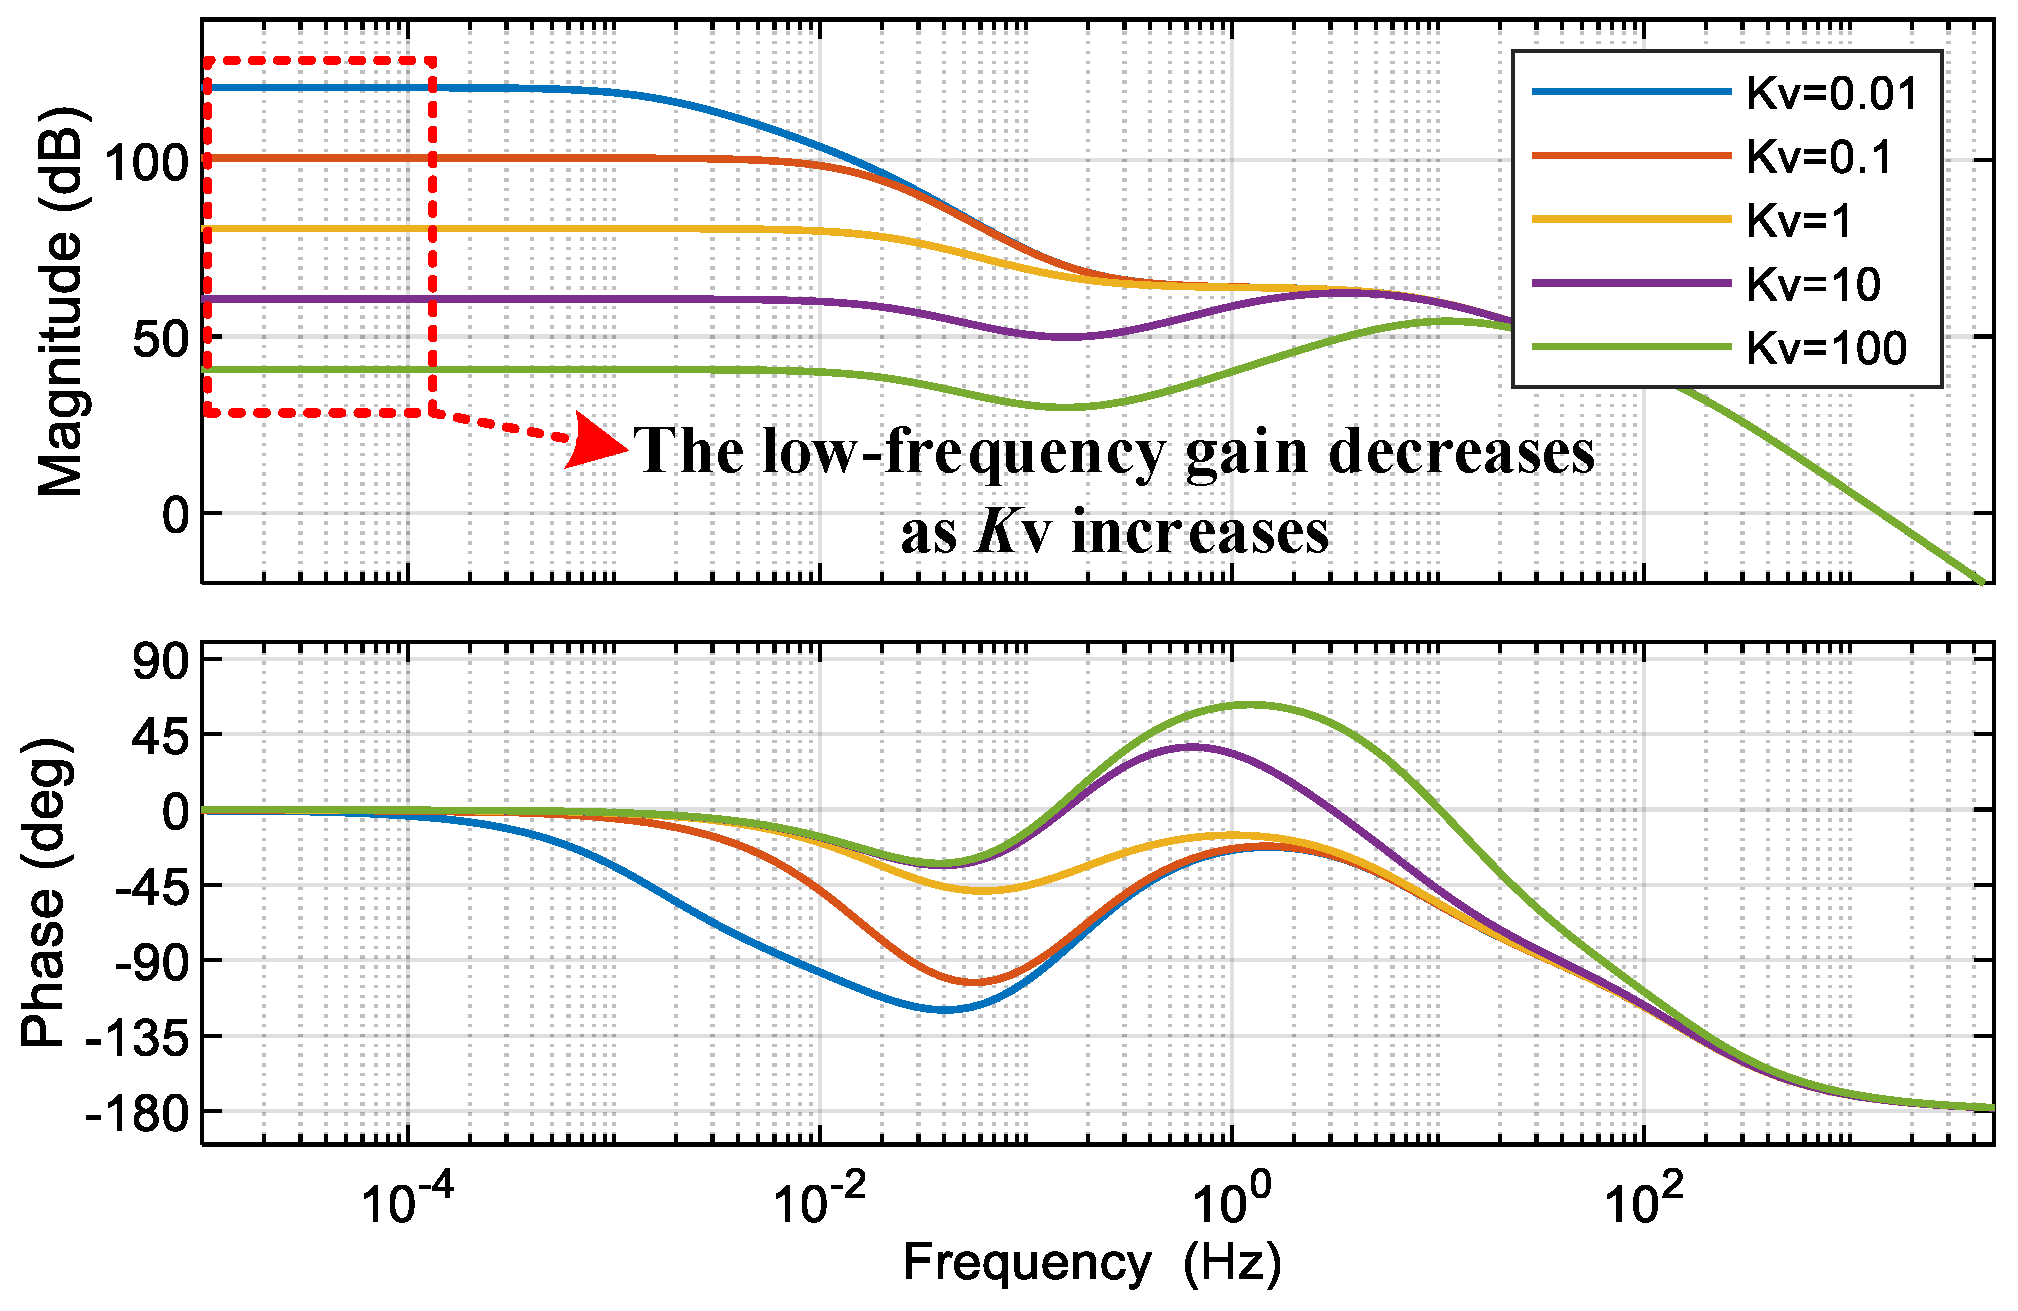
4.4. The Influence Rule of Integral Correction Selection Factor KV

When the integration correction selection factor KV is set as 0.01, 0.1, 1, 10, and 100 sequentially, the corresponding Bode diagram is shown in Figure 8. As can be seen, the low-frequency gain will increase as KV decreases, thus improving the tracking performance of the motor-port voltage. Referring to the obtained results in Section 4.3, the motor-port voltage deviation can be reduced by increasing the DC gain K of the series correction link. However, when the motor-port voltage deviation needs to be further reduced, it can be achieved by reducing KV.

4.5. The Influence Rule of Gain Kf of the Parallel Correction Link

When the gain Kf of the parallel correction link is set as 0, 1, 10, and 100 sequentially, the corresponding Bode diagram is shown in Figure 9. As can be seen, when Kf increases, the bandwidth of the excitation system will decrease accordingly, which results in a longer response time of the motor port output voltage.

4.6. Simplification of the Excitation System Structure

When the complexity of the excitation system structure is lower, the corresponding debugging process of the control parameter is simpler. Based on the influence rules explored above, when the gain Kf of the parallel correction link is smaller, the corresponding response time of the system is faster. Therefore, Kf can be set to 0 directly. In addition, to further simplify the excitation system, by setting “T1 = T2 = KV = 1”, the series compensation link H2(s) can be simplified to “H2n(s) = K(1 + sT3)/(1 + sT4)”. At this time, the series compensation link can be adjusted only through K, T3, and T4. The simplified excitation system structure diagram is shown in Figure 10.

5. Simulation Validation

To validate the effectiveness of the proposed modeling method and the correctness of the explored operating characteristics, an FSC-VSPSU simulation model with a detailed excitation system is built in MATLAB/SIMULINK. Figure 11 gives the corresponding simulation model structure diagram, and Table 2 lists its basic simulation parameters. Further, the operating characteristics summarized in Section 4.1, Section 4.2, Section 4.3, Section 4.4 and Section 4.5 will be verified separately in Section 5.1, Section 5.2, Section 5.3, Section 5.4 and Section 5.5, and Section 5.6 will verify the simplified excitation system structure proposed in Section 4.6.

5.1. Verification of the Influence Rule of Time Constant T1

In Section 4.1, it can be seen that a smaller T1 will bring about a greater phase margin in the system, thus the system’s stability will be strengthened. The actual stability performance of the system is shown in Figure 12. As can be seen, when T1 decreases from 100 to 1, the system changes its operation state from oscillation to stability, and the stability of the system is enhanced. Furthermore, a smaller T1 also produces a smaller bandwidth, and the system response time will be longer. The actual output response of the system is shown in Figure 13. As can be seen, when T1 decreases from 1 to 0.5, the response time is longer. Thus, the influence rules of time constant T1 can be verified.

5.2. Verification of the Influence Rule of Time Constant T2

In Section 4.2, the obtained rule is that a larger T2 will produce a greater phase margin in the system, thus its stability is stronger. The actual stability performance of the system is shown in Figure 14. As can be seen, when T2 increases from 0.001 to 0.01, the system transitions from oscillation to stable operation, which strengthens the stability. Furthermore, the larger T2 is, the smaller the system bandwidth, and the response time will be worse. The actual output response of the system is shown in Figure 15. As can be seen, when T2 increases from 1 to 2, the response time is longer. Thus, these simulation results verify the influence rules of time constant T2.

5.3. Verification of the Influence Rule of DC Gain K

In Section 4.3, the rule is that a smaller K will make the phase margin greater, and the corresponding stability of the system will be stronger. The actual stability performance of the system is shown in Figure 16. As can be seen, when K decreases from 5000 to 200, the oscillating system becomes stable. Furthermore, a smaller K also results in a smaller bandwidth, thus making the response time longer. The actual output response of the system is shown in Figure 17. As can be seen, when K decreases from 200 to 50, the response time is longer. Meanwhile, the low-frequency gain of the system will be smaller as K decreases, which results in the poor tracking performance of the motor-port voltage. As can be seen from Figure 17, when K decreases from 200 to 50, the tracking performance is weaker (the reference is 1000 V). Thus, the influence rules of DC gain K can be verified.

5.4. Verification of the Influence Rule of Integral Correction Selection Factor KV

In Section 4.4, it can be seen that the low-frequency gain will increase as KV decreases, thus improving the tracking performance of the motor-port voltage. The actual output response of the system is shown in Figure 18. As can be seen, when KV decreases from 2 to 0.1, the tracking performance is strengthened. Thus, the influence rule of integral correction selection factor KV can be verified.

5.5. Verification of the Influence Rule of the Parallel Correction Link Gain Kf

In Section 4.5, the operating rule is that the bandwidth of the excitation system will increase as Kf decreases, which results in a faster response speed of the motor-port output voltage. The actual output response of the system is shown in Figure 19. As can be seen, when Kf decreases from 1 to 0, the response time is shortened. Thus, the influence rules of the parallel correction link gain Kf can be verified.

5.6. Verification of the Simplification of the Excitation System Structure

Based on the simplified excitation system proposed in Section 4.6, a corresponding simulation model is built in MATLAB/SIMULINK. Consistent with the simulation parameters above, the reference value of the motor-port voltage is also set to 1000 V, and the corresponding simulation results are shown in Figure 20. As can be seen, the performance of the motor-port voltage is almost the same as that of the original excitation method, which verifies the effectiveness of the proposed simplified excitation system.
The fast tracking ability of output power is the most important function of the FSC-VSPSU. To further verify the effectiveness of the proposed simplified excitation system, more simulation cases are as follows. Firstly, when the active power initial value of the FSC-VSPSU is set to 1 MW and steps down to 0.5 MW at 4 s, the actual output is shown in Figure 21a. As can be seen, the actual active power output can quickly track the set value. Furthermore, the reactive power tracking with a constant reference value of 0 is shown in Figure 21b. As can be seen, the actual reactive power output can always track the reference.
Further, when the active power initial value of the FSC-VSPSU is set to 1 MW and steps up to 1.5 MW at 4 s, the actual output is shown in Figure 22a. As can be seen, the actual active power output can also quickly track the set value. Furthermore, the reactive power tracking reference is always 0, and the simulation result is shown in Figure 22b. As can be seen, the actual reactive power output can also track the reference.

6. Conclusions

To maintain the effective performance operation of the FSC-VSPSU, one of the crucial points is to grasp the operating characteristics of its excitation system. Thus, this paper establishes a transfer function model for the excitation system, and based on it, the corresponding operating characteristics are analyzed. Some conclusions are as follows. It is worth noting that the following parameter influence rules only apply to the influence of the excitation system on motor-port voltage, which can be used to guide parameter tests in practical engineering.
(1) The phase margin is strengthened by increasing the parameters T2, T4, and Ta, or decreasing T1, T3, K, and Ka;
(2) The bandwidth is larger as the parameters T1, T3, K, and Ka increase, or as T2, T4, Ta, and Kf decrease;
(3) The low-frequency gain can be strengthened by increasing the parameters K and Ka or by decreasing KV.

Author Contributions

Conceptualization, P.P.; Data curation, X.Z.; Methodology, P.P.; Resources, Y.Z.; Software, G.C.; Validation, H.S.; Writing—original draft, P.P.; Writing—review & editing, L.D. All authors have read and agreed to the published version of the manuscript.

Funding

This research was funded in part by Science and Technology Project of State Grid Sichuan Electric Power Company under Grant 521997230002, and China Postdoctoral Science Foundation Project under Grant 2023MD734166.

Data Availability Statement

Data are contained within the article.

Conflicts of Interest

The authors declare no conflict of interest.

References

  1. Chen, W.; Yang, W.; Qi, H.; Shi, Z.; Geng, H. Coordinated power reserve control of wind farm for frequency regulation. IEEE Access 2023, 11, 55465–55473. [Google Scholar] [CrossRef]
  2. Fu, Y.; Liu, Y.; Huang, L.; Ying, F.; Li, F. Collection system topology for deep-sea offshore wind farms considering wind characteristics. IEEE Trans. Energy Convers. 2022, 37, 631–642. [Google Scholar]
  3. Hara, S.; Douzono, H.; Imamura, M.; Yoshioka, T. Estimation of photovoltaic cell parameters using measurement data of photovoltaic module string currents and voltages. IEEE J. Photovolt. 2022, 12, 540–545. [Google Scholar]
  4. Chen, J.; Zhao, Y.; Lin, H.; Wei, Y.; Liu, W.; Guo, Q.; Li, Y.; Mantooth, H.A. Analysis and Control of Cascaded Energy Storage System for Energy Efficiency and Power Quality Improvement in Electrified Railways. IEEE Trans. Transp. Electrif. 2023. [Google Scholar] [CrossRef]
  5. Chen, J.; Ge, Y.; Wang, K.; Hu, H.; He, Z.; Tian, Z.; Li, Y. Integrated Regenerative Braking Energy Utilization System for Multi-Substations in Electrified Railways. IEEE Trans. Ind. Electron. 2023, 70, 298–310. [Google Scholar]
  6. Zhao, Z.; Yang, J.; Yang, W.; Luo, H.; Peng, Y. Coordinated multi-objective optimization for multiple trade-offs in pumped outage condition of pumped storage system. IEEE Access 2019, 7, 161394–161411. [Google Scholar] [CrossRef]
  7. Liu, D.; Pan, J.; Zhang, H.; Wang, K.; Pan, F.; Zhu, J. A quantification method of promoting variable renewable energy accommodation by pumped storage power plant. In Proceedings of the 2022 IEEE 5th International Electrical and Energy Conference (CIEEC), Nanjing, China, 27–29 May 2022; pp. 2407–2411. [Google Scholar]
  8. Luo, Y.; Shao, D.; Zhao, J.; Huang, K.; Li, X. Stability analysis of Tianchi pumped storage power station connected to central China Power Grid. In Proceedings of the 2022 7th Asia Conference on Power and Electrical Engineering (ACPEE), Virtual, 16–17 April 2022; pp. 606–612. [Google Scholar]
  9. Zhang, S.; Xiang, Y.; Liu, J.; Liu, J.; Yang, J.; Zhao, X.; Jawad, S.; Wang, J. A regulating capacity determination method for pumped storage hydropower to restrain PV generation fluctuations. CSEE J. Power Energy Syst. 2022, 8, 304–316. [Google Scholar]
  10. Tiwari, R.; Nilsen, R.; Mo, O. Control strategies for variable speed operation of pumped storage plants with full-size converter fed synchronous machines. In Proceedings of the 2021 IEEE Energy Conversion Congress and Exposition (ECCE), Vancouver, BC, Canada, 10–14 October 2021; pp. 61–68. [Google Scholar]
  11. Xin, C.; Minxiao, H.; Chao, Z. Power control analysis for variable speed pumped storage with full-size converter. In Proceedings of the IECON 2015-41st Annual Conference of the IEEE Industrial Electronics Society, Yokohama, Japan, 9–12 November 2015; pp. 001327–001332. [Google Scholar]
  12. Wang, W.; Wang, Z.; Yang, Z.; Ma, W.; Tang, F.; Wu, X.; Xiao, M. Methods of smoothing active power fluctuations of photovoltaic plants using the full-size converter based variable speed pumped storage unit. In Proceedings of the 2020 IEEE Power & Energy Society General Meeting (PESGM), Montreal, QC, Canada, 2–6 August 2020; pp. 1–5. [Google Scholar]
  13. Pan, P.; Ding, L.; Shi, H.; Chen, G. Multi-mode simulation modeling of full-size variable speed pumped storage system including the complete unit links. In Proceedings of the 2023 Panda Forum on Power and Energy (PandaFPE), Chengdu, China, 27–30 April 2023; pp. 13–17. [Google Scholar]
  14. Holzer, T.; Muetze, A.; Traxler-Samek, G.; Lecker, M.; Zerobin, F. Generator design possibilities for full-size converter operation of large pumped storage power plants. IEEE Trans. Ind. Appl. 2020, 56, 3644–3655. [Google Scholar]
  15. Chazarra, M.; Pérez-Díaz, J.I.; García-González, J. Optimal joint energy and secondary regulation reserve hourly scheduling of variable speed pumped storage hydropower plants. IEEE Trans. Power Syst. 2018, 33, 103–115. [Google Scholar] [CrossRef]
  16. Jian, Y.; Zhong, L.; Yi, F.; Guo, H.; Yang, H.; Xu, W.; Hu, J.; Wu, Y. Feasibility analysis of full power variable speed operation of pumped storage power station based on M3C converter. In Proceedings of the 2022 12th International Conference on Power and Energy Systems (ICPES), Guangzhou, China, 23–25 December 2022; pp. 440–444. [Google Scholar]
  17. Abdalla, O.H.; Han, M. Variable speed pumped storage based on the use of H-bridge cascaded multilevel converter. In Proceedings of the 7th International Power Electronics and Motion Control Conference, Harbin, China, 2–5 June 2012; pp. 402–405. [Google Scholar]
  18. Joseph, A.; Kim, S.; Lee, S.S.; Dominic, A.; Lee, K. Boost multi-level NPC-fed VS large rated asynchronous pumped storage hydro-generating unit. IET Electr. Power Appl. 2019, 13, 1488–1496. [Google Scholar]
  19. Ji, L.; Sun, J.; Zhou, M.; Tian, W. AC excitation control strategy of variable speed pumped storage units based on active disturbance rejection control. In Proceedings of the 6th International Conference on Renewable Power Generation (RPG), Wuhan, China, 19–20 October 2017; pp. 1195–1199. [Google Scholar]
  20. Yao, W.; Deng, C.; Peng, P. Optimal sizing of variable-speed seawater pumped storage based on maximum efficiency tracking. In Proceedings of the 2020 IEEE 4th Conference on Energy Internet and Energy System Integration (EI2), Wuhan, China, 30 October–1 November 2020; pp. 374–379. [Google Scholar]
  21. Tiwari, R.; Nilsen, R.; Nysveen, A. Active NPC converter for variable speed operation of pumped storage hydropower plant. In Proceedings of the IECON 2020 the 46th Annual Conference of the IEEE Industrial Electronics Society, Singapore, 18–21 October 2020; pp. 1211–1216. [Google Scholar]
  22. He, J.; Ji, K.; Lin, D.; Mei, G.; Xu, M.; Xia, H. Multivariable feedback linearizaton scheme for new excitation system based on full controlled device. In Proceedings of the 2018 2nd IEEE Conference on Energy Internet and Energy System Integration (EI2), Beijing, China, 20–22 October 2018; pp. 1–5. [Google Scholar]
  23. Pramanik, M.A.H.; Roy, T.K.; Ghosh, S.K.; Anower, M.S.; Mahmud, M.A. An advanced excitation control scheme for a synchronous generator in a single machine infinite bus system based on detailed dynamical models. In Proceedings of the 2020 IEEE International Conference on Power Electronics, Drives and Energy Systems (PEDES), Jaipur, India, 16–19 December 2020; pp. 1–6. [Google Scholar]
  24. Su, X.; Wang, G.; Qu, Z.; Fan, J.; Shang, G.; Bian, C. Research on the state evaluation model of a generator excitation system based on fuzzy comprehensive evaluation theory. In Proceedings of the 2021 IEEE 3rd International Conference on Power Data Science (ICPDS), Harbin, China, 26 December 2021; pp. 17–22. [Google Scholar]
Figure 1. Structural diagram of the FSC-VSPSU.
Electronics 13 00505 g001
Figure 2. Structural diagram of the excitation system.
Electronics 13 00505 g002
Figure 3. Block diagram of the excitation system.
Electronics 13 00505 g003
Figure 4. Bode diagram of the excitation system.
Electronics 13 00505 g004
Figure 5. Bode diagram of the excitation system when changing T1.
Electronics 13 00505 g005
Figure 6. Bode diagram of the excitation system when changing T2.
Electronics 13 00505 g006
Figure 7. Bode diagram of the excitation system when changing K.
Electronics 13 00505 g007
Figure 8. Bode diagram of the excitation system when changing KV.
Electronics 13 00505 g008
Figure 9. Bode diagram of the excitation system when changing Kf.
Electronics 13 00505 g009
Figure 10. Simplified excitation system structure diagram.
Electronics 13 00505 g010
Figure 11. Simulation model structure diagram.
Electronics 13 00505 g011
Figure 12. Motor port voltage waveforms when T1 changes. (a) T1 = 100. (b) T1 = 1.
Electronics 13 00505 g012
Figure 13. Motor port voltage amplitudes when T1 changes. (a) T1 = 1. (b) T1 = 0.5.
Electronics 13 00505 g013aElectronics 13 00505 g013b
Figure 14. Motor port voltage waveforms when T2 changes. (a) T2 = 0.001. (b) T2 = 0.01.
Electronics 13 00505 g014
Figure 15. Motor port voltage amplitudes when T2 changes. (a) T2 = 1. (b) T2 = 2.
Electronics 13 00505 g015aElectronics 13 00505 g015b
Figure 16. Motor port voltage waveforms when K changes. (a) K = 5000. (b) K = 200.
Electronics 13 00505 g016
Figure 17. Motor port voltage amplitudes when K changes. (a) K = 200. (b) K = 50.
Electronics 13 00505 g017aElectronics 13 00505 g017b
Figure 18. Motor port voltage amplitudes when KV changes. (a) KV = 2. (b) KV = 0.1.
Electronics 13 00505 g018
Figure 19. Motor port voltage amplitudes when Kf changes. (a) Kf = 1. (b) Kf = 0.
Electronics 13 00505 g019
Figure 20. Motor port voltage amplitude after simplifying the excitation system.
Electronics 13 00505 g020
Figure 21. Fast tracking of output power when the reference steps down. (a) Active power. (b) Reactive power.
Electronics 13 00505 g021
Figure 22. Fast tracking of output power when the reference steps up. (a) Active power. (b) Reactive power.
Electronics 13 00505 g022
Table 1. Parameters of the excitation system.
SymbolParameterValue
TcTime constant of the sampling linkTc = 0.001
KDC gain of the series correction linkK = 200
KVIntegration correction selection factorKV = 1
T1Time constant of the series compensation linkT1 = 0.01
T2T2 = 1
T3T3 = 1
T4T4 = 6.86
KaGain of the power amplification linkKa = 1
TaTime constant of the power amplification linkTa = 0.02
KfGain of the parallel correction linkKf = 0
TfTime constant of the parallel correction linkTf = 1
RfResistance of the excitation windingRf = 0.1576
KψMapping relationship between excitation current and motor-port voltageKψ = 0.02
TcTime constant of the sampling linkTc = 0.001
KDC gain of the series correction linkK = 200
KVIntegration correction selection factorKV = 1
Table 2. Basic parameters of the simulation system.
SymbolParameterValue
ugPower grid voltageug = 35 kV
fgPower grid frequencyfg = 50 Hz
rtTransformer ratiort = 35 kV:3.3 kV
udcDC voltageudc = 5.2 kV
umMotor-port voltageum = 1 kV
nMechanical speedn = 1500 r/min
PmActive powerPm = 1 MW
QfReactive powerQf = 0 Var
Disclaimer/Publisher’s Note: The statements, opinions and data contained in all publications are solely those of the individual author(s) and contributor(s) and not of MDPI and/or the editor(s). MDPI and/or the editor(s) disclaim responsibility for any injury to people or property resulting from any ideas, methods, instructions or products referred to in the content.

