
Visual Analysis Method for Traffic Trajectory with Dynamic Topic Movement Patterns Based on the Improved Markov Decision Process
 ,
, 
Abstract
1. Introduction
- A trajectory dynamic topic model is proposed. This model considers the topic evolution and is used to process traffic trajectory data. This model helps to obtain trajectory dynamic topics and capture their evolution. The topic entropy is calculated to represent the volume of information in trajectory topics and is utilized to analyze the evolution of the topic.
- The improved Markov Decision Process is proposed to generate representative trajectory sequences of a topic. This method aims to overcome the problem of probabilistic models which often lose word sequence information.
- The visual models, featured with the parallel and regular arrangement, are designed to help users explore the trajectory dynamic topics and related indicators.
- Experimental studies based on the publicly available dataset demonstrate the effectiveness of this method in trajectory dynamic topic exploration.
2. Related Works
2.1. Trajectory Topic Modeling
2.2. Visual Analysis of Trajectory Topic
3. Methods
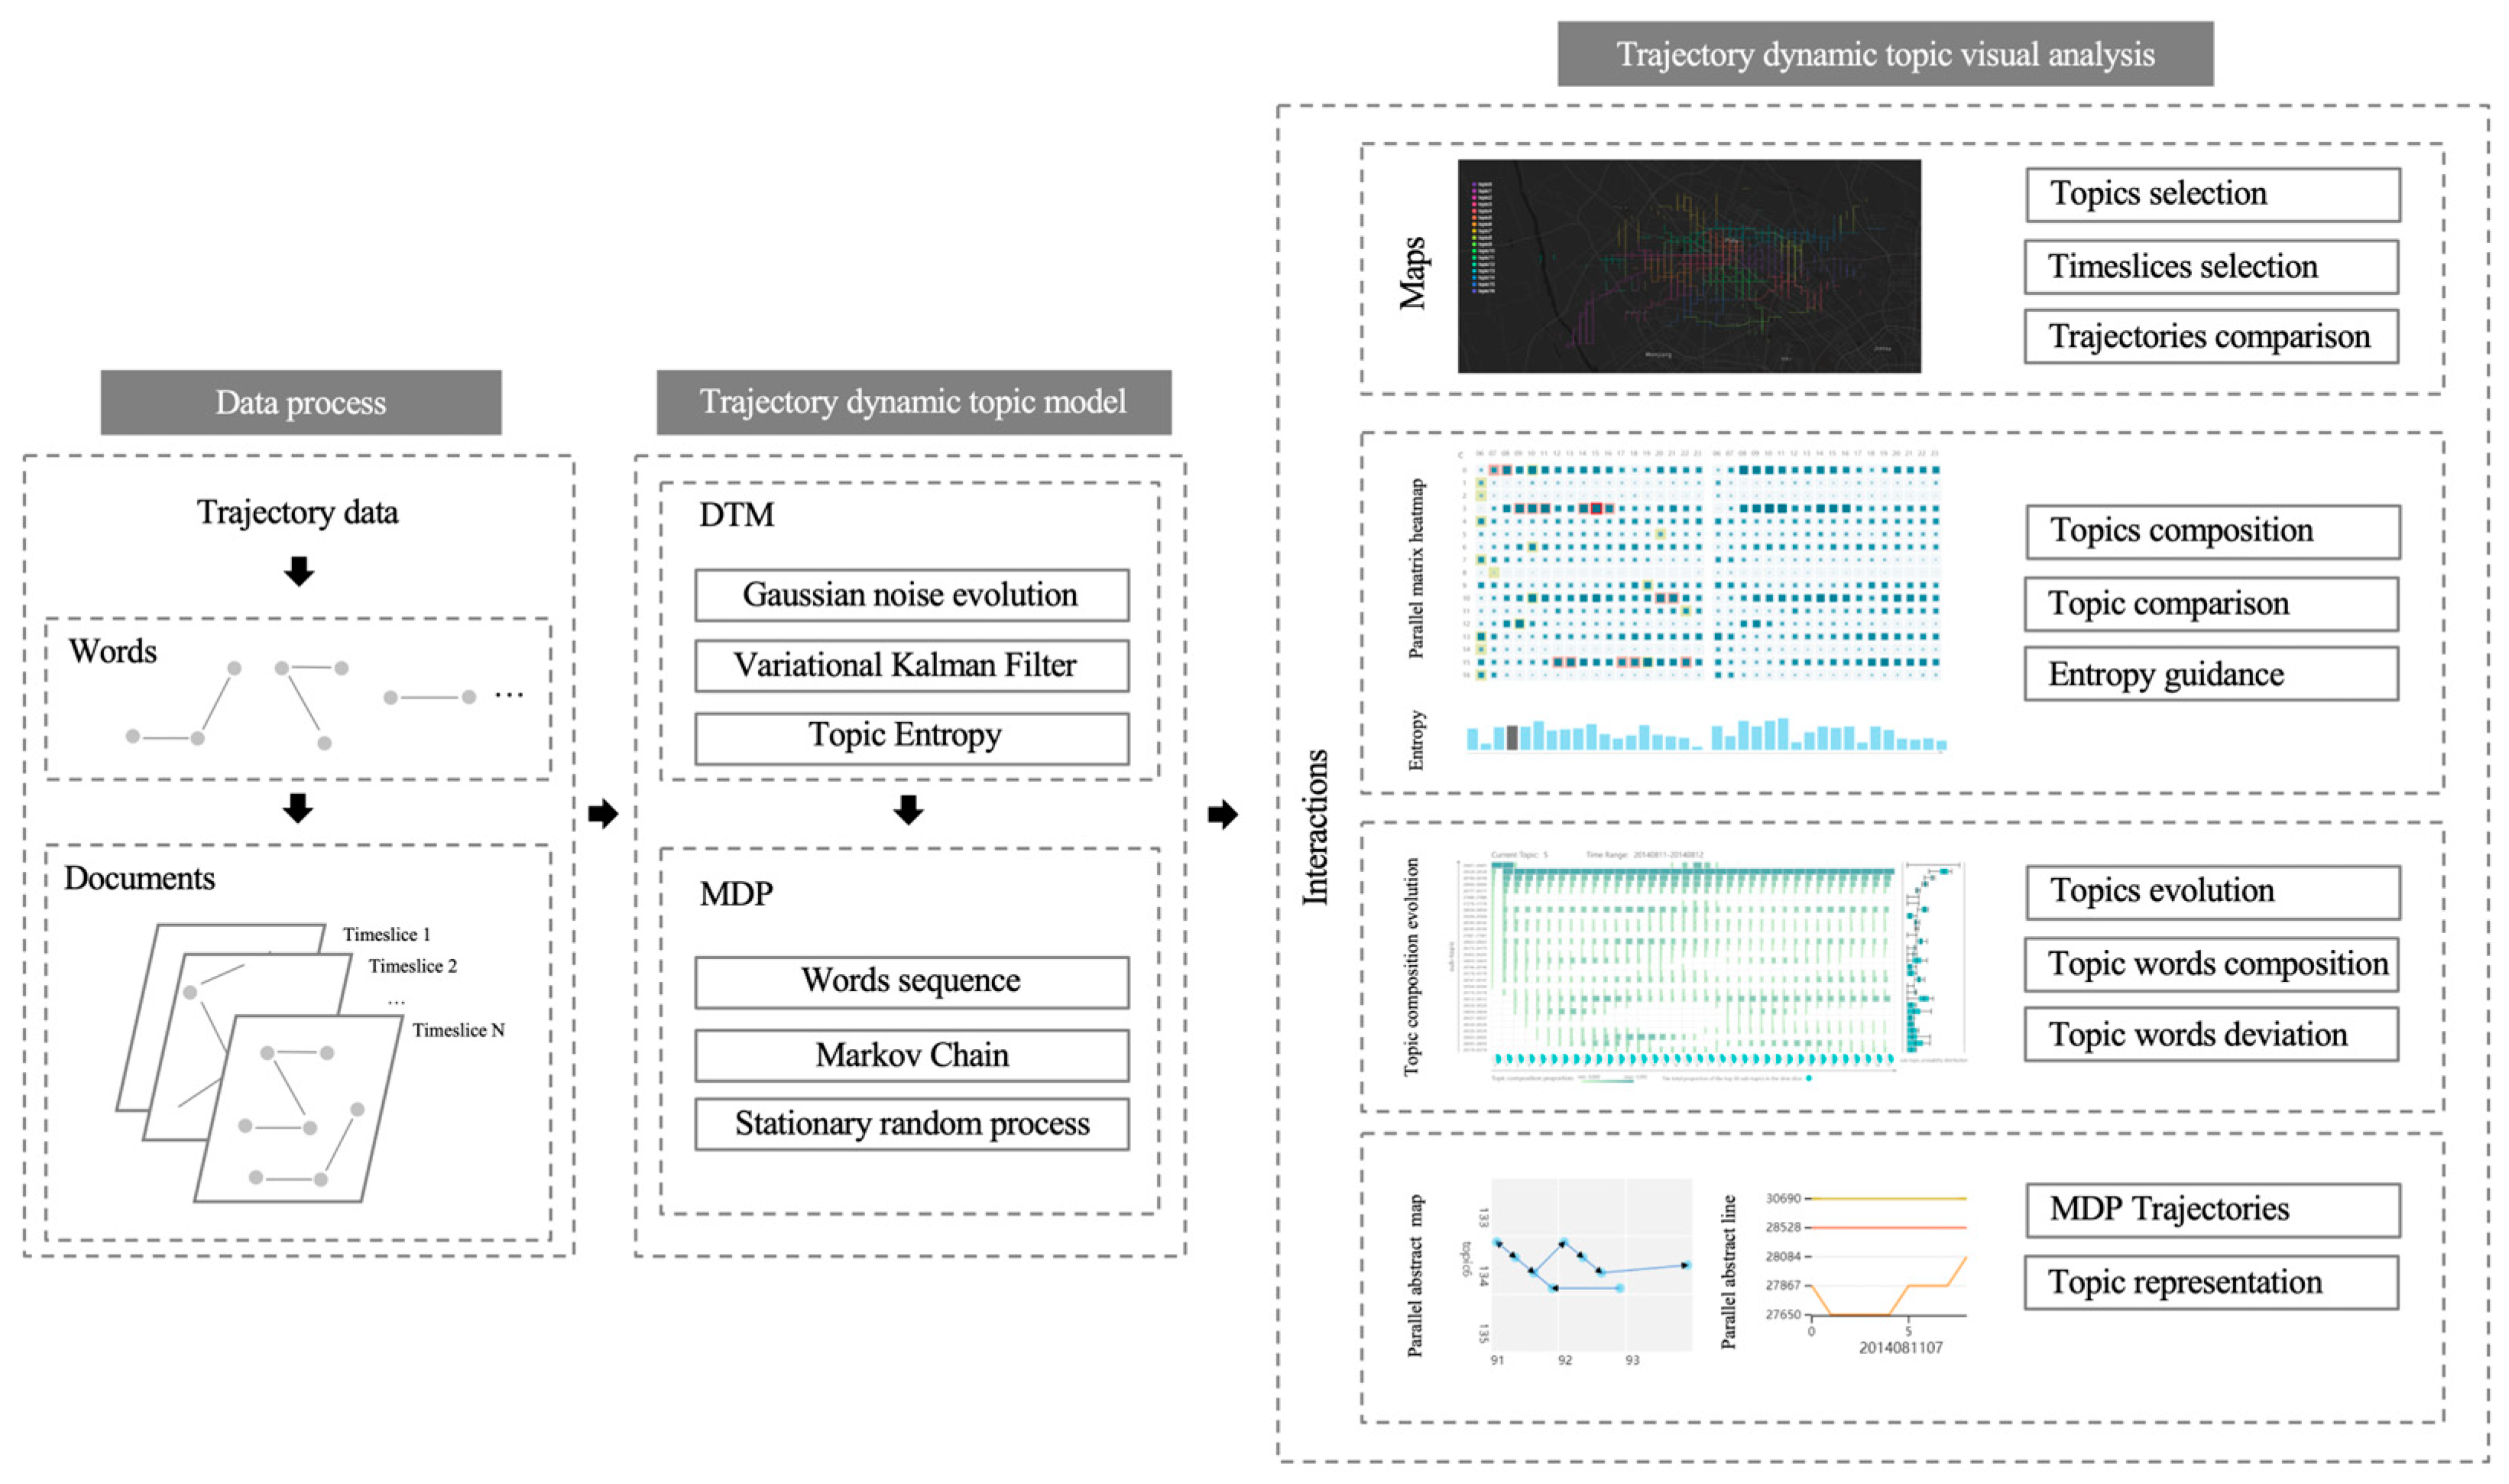
3.1. Overview
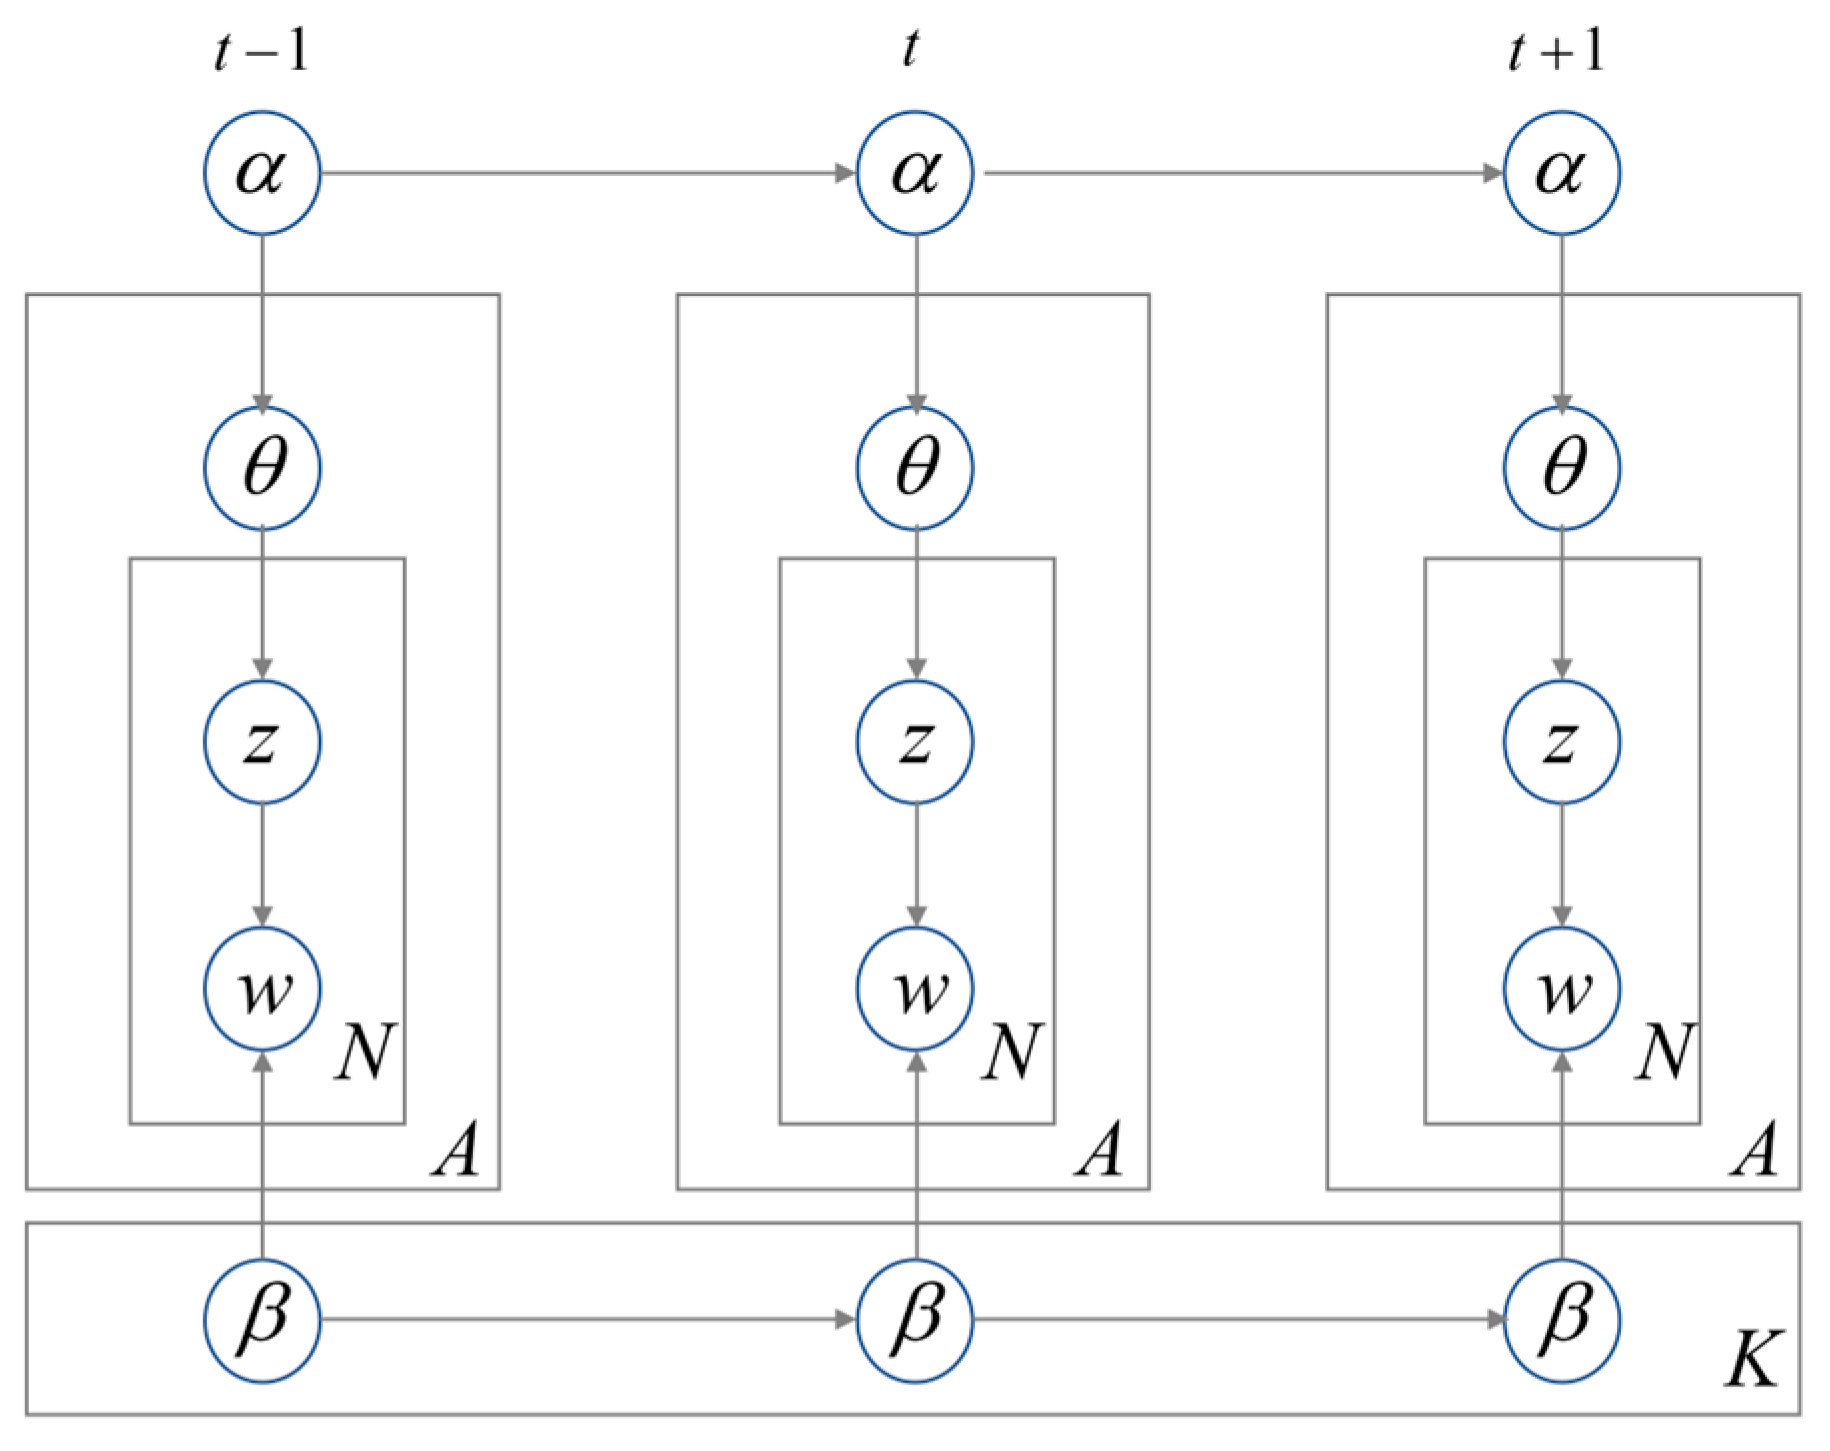
3.2. Trajectory Dynamic Topic Modeling
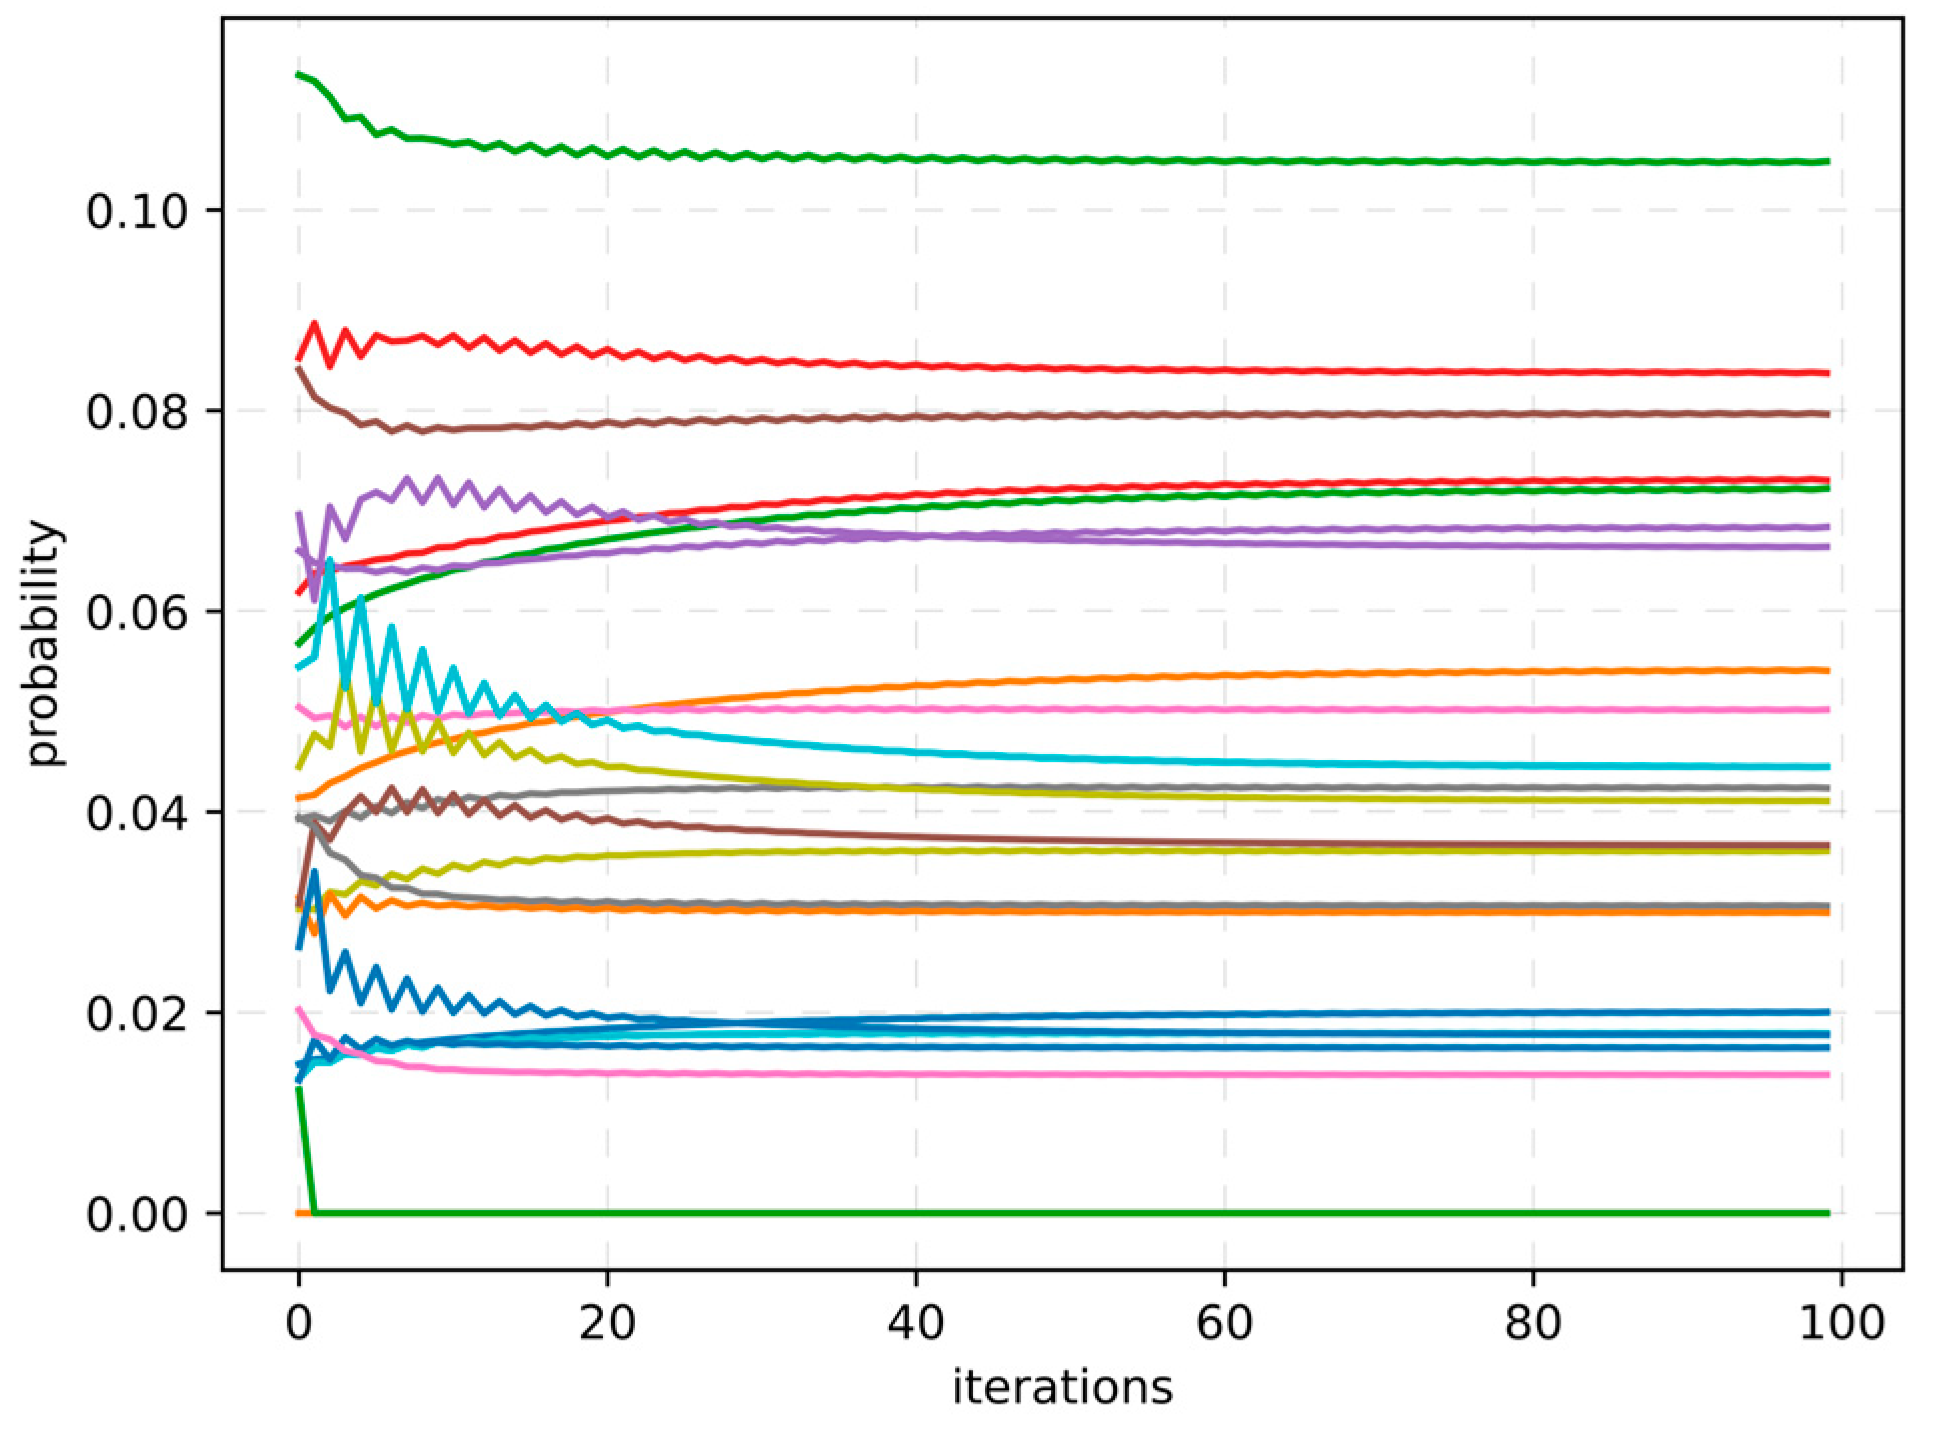
3.3. Trajectory Dynamic Topic Generating
3.3.1. Sub-Trajectory Modeling
3.3.2. Trajectory Sequence Generating
3.4. Data Set and Hyperparameter Settings
4. Visual Design
4.1. Trajectory Dynamic Topic Time Evolution Analysis
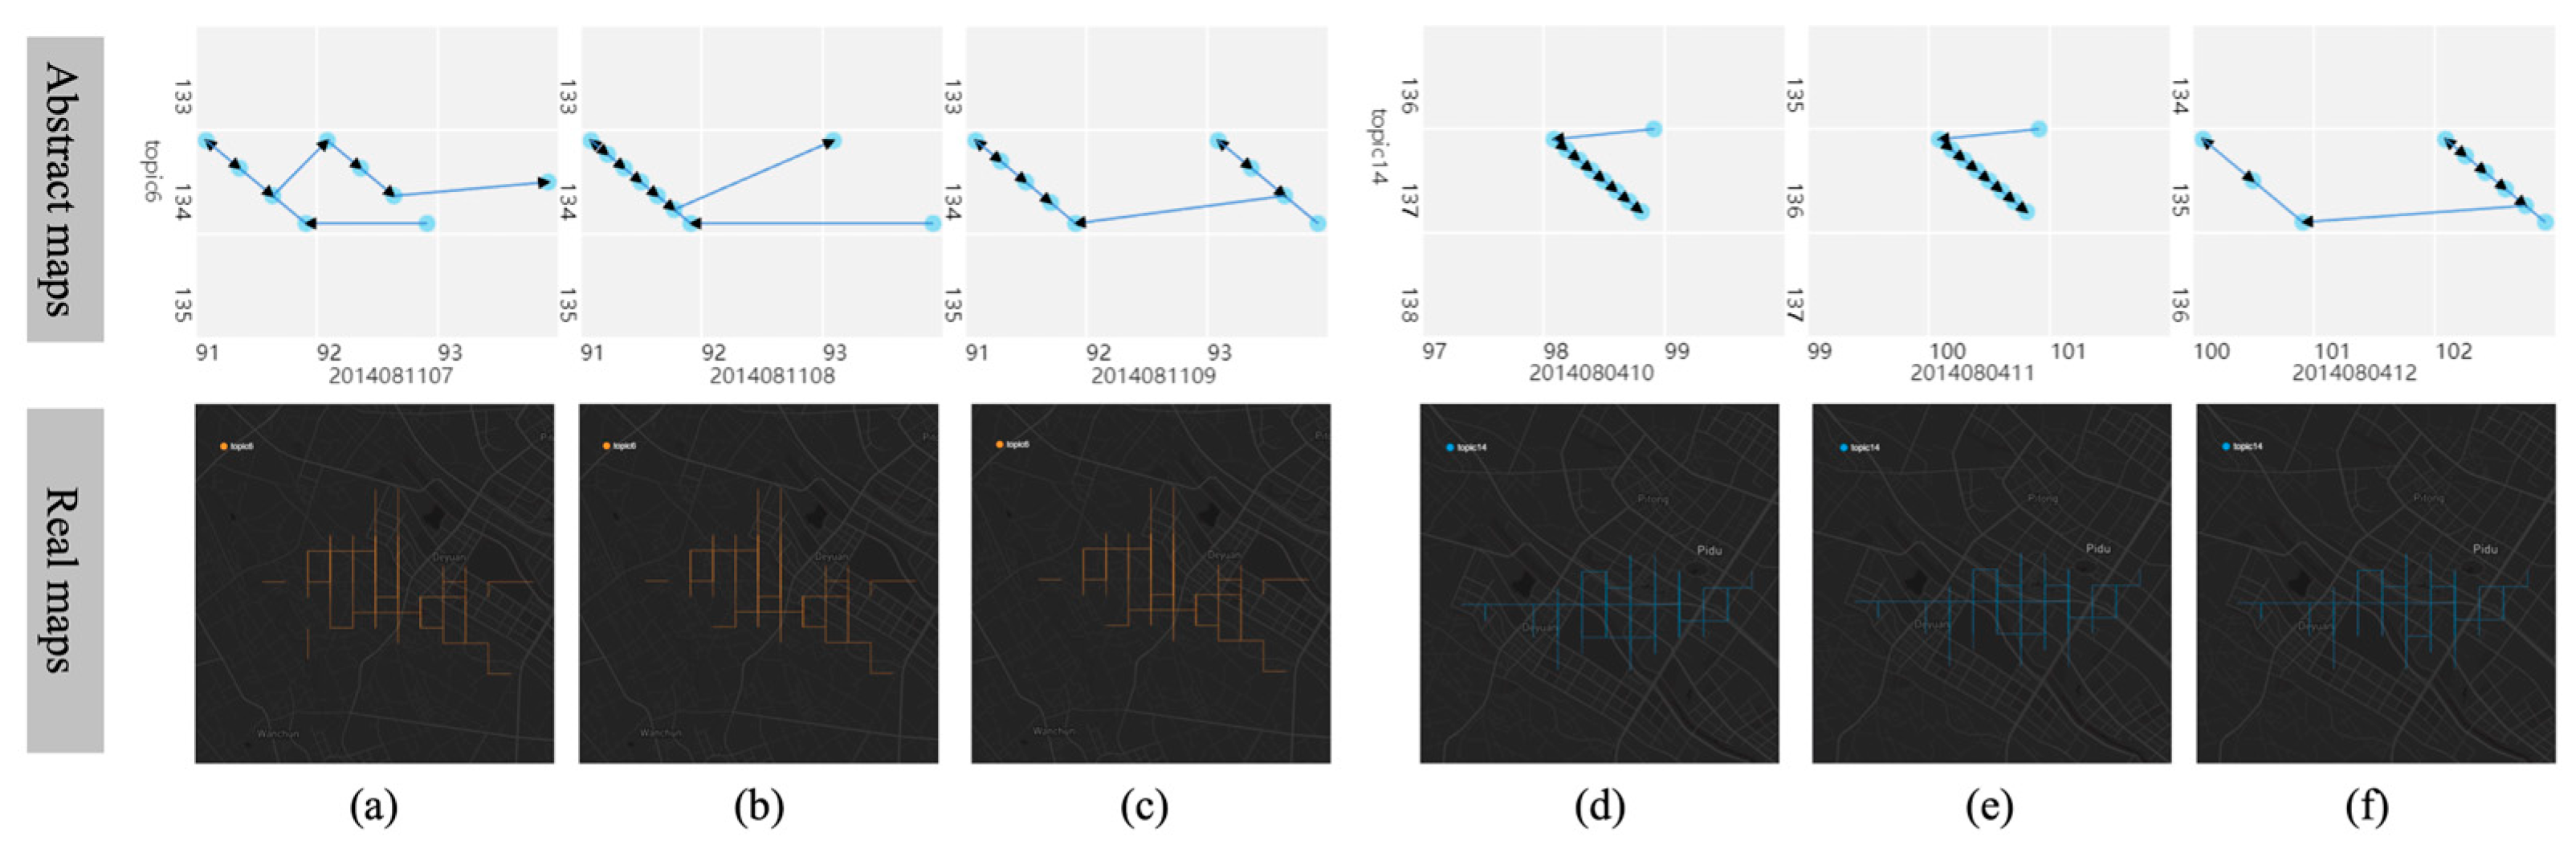
4.2. Spatial Evolution Analysis of Trajectory Dynamic Topic
5. Case Study
5.1. Trajectory Topic Evolution Analysis
5.1.1. Spatial Evolution of Trajectory Topics
5.1.2. Trajectories Topic Time Evolution
5.2. Trajectory Topic Sequence Analysis
6. Discussion
7. Conclusions
Author Contributions
Funding
Data Availability Statement
Conflicts of Interest
Abbreviations
References
- Liu, L.; Zhang, H.; Liu, J.; Liu, S.; Chen, W.; Man, J. Visual exploration of urban functional zones based on augmented nonnegative tensor factorization. J. Vis. 2021, 24, 331–347. [Google Scholar] [CrossRef]
- Liu, D.; Xu, P.; Ren, L. TPFlow: Progressive Partition and Multidimensional Pattern Extraction for Large-Scale Spatio-Temporal Data Analysis. IEEE Trans. Vis. Comput. Graph. 2019, 25, 1–11. [Google Scholar] [CrossRef] [PubMed]
- Zhou, Z.; Meng, L.; Tang, C.; Zhao, Y.; Guo, Z.; Hu, M.; Chen, W. Visual Abstraction of Large Scale Geospatial Origin-Destination Movement Data. IEEE Trans. Vis. Comput. Graph. 2019, 25, 43–53. [Google Scholar] [CrossRef] [PubMed]
- Deng, Z.; Weng, D.; Liang, Y.; Bao, J.; Zheng, Y.; Schreck, T.; Xu, M.; Wu, Y. Visual cascade analytics of large-scale spatiotemporal data. IEEE Trans. Vis. Comput. Graph. 2021, 28, 2486–2499. [Google Scholar] [CrossRef] [PubMed]
- Andrienko, G.; Andrienko, N.; Fuchs, G.; Wood, J. Revealing Patterns and Trends of Mass Mobility Through Spatial and Temporal Abstraction of Origin-Destination Movement Data. IEEE Trans. Vis. Comput. Graph. 2017, 23, 2120–2136. [Google Scholar] [CrossRef] [PubMed]
- Blei, D.M.; Ng, A.Y.; Jordan, M.I. Latent dirichlet allocation. J. Mach. Learn. Res. 2003, 3, 993–1022. [Google Scholar]
- Lee, D.; Seung, H.S. Algorithms for non-negative matrix factorization. Adv. Neural Inf. Process. Syst. 2000, 13, 535–541. [Google Scholar]
- Chu, D.; Sheets, D.A.; Zhao, Y.; Wu, Y.; Yang, J.; Zheng, M.; Chen, G. Visualizing Hidden Themes of Taxi Movement with Semantic Transformation. In Proceedings of the 2014 IEEE Pacific Visualization Symposium, Yokohama, Japan, 4–7 March 2014; pp. 137–144. [Google Scholar]
- Liu, L.; Zhan, H.; Liu, J.; Man, J. Visual analysis of traffic data via spatio-temporal graphs and interactive topic modeling. J. Vis. 2019, 22, 141–160. [Google Scholar] [CrossRef]
- Liu, H.; Jin, S.; Yan, Y.; Tao, Y.; Lin, H. Visual analytics of taxi trajectory data via topical sub-trajectories. Vis. Inform. 2019, 3, 140–149. [Google Scholar] [CrossRef]
- Tao, Y.; Tang, Y. Progressive visual analysis of traffic data based on hierarchical topic refinement and detail analysis. J. Vis. 2023, 26, 367–384. [Google Scholar] [CrossRef]
- Chen, C.; Liu, Q.; Wang, X.; Liao, C.; Zhang, D. semi-Traj2Graph Identifying Fine-Grained Driving Style With GPS Trajectory Data via Multi-Task Learning. IEEE Trans. Big Data 2021, 8, 1550–1565. [Google Scholar] [CrossRef]
- Blei, D.M.; Lafferty, J.D. Dynamic topic models. In Proceedings of the 23rd International Conference on Machine Learning, Pittsburgh, PA, USA, 25–29 June 2006; pp. 113–120. [Google Scholar]
- Liao, L.; Wu, J.; Zou, F.; Pan, J.; Li, T. Trajectory topic modelling to characterize driving behaviors with GPS-based trajectory data. J. Internet Technol. 2018, 19, 815–824. [Google Scholar]
- Huang, L.; Wen, Y.; Guo, W.; Zhu, X.; Zhou, C.; Zhang, F.; Zhu, M. Mobility pattern analysis of ship trajectories based on semantic transformation and topic model. Ocean Eng. 2020, 201, 107092. [Google Scholar] [CrossRef]
- Wallach, H.M. Topic modeling: Beyond bag-of-words. In Proceedings of the 23rd International Conference on Machine Learning, Pittsburgh, PA, USA, 25–29 June 2006. [Google Scholar]
- Mohammadiha, N.; Smaragdis, P.; Panahandeh, G.; Doclo, S. A state-space approach to dynamic nonnegative matrix factorization. IEEE Trans. Signal Process. 2014, 63, 949–959. [Google Scholar] [CrossRef]
- Yao, F.; Wang, Y. Tracking urban geo-topics based on dynamic topic model. Comput. Environ. Urban Syst. 2020, 79, 101419. [Google Scholar] [CrossRef]
- Chen, W.; Huang, Z.; Wu, F.; Zhu, M.; Guan, H.; Maciejewski, R. VAUD: A visual analysis approach for exploring spatio-temporal urban data. IEEE Trans. Vis. Comput. Graph. 2017, 24, 2636–2648. [Google Scholar] [CrossRef]
- Liao, C.; Chen, C.; Zhang, Z.; Xie, H. Understanding and visualizing passengers’ travel behaviours: A device-free sensing way leveraging taxi trajectory data. Pers. Ubiquitous Comput. 2019, 26, 491–503. [Google Scholar] [CrossRef]
- Havre, S.L.; Hetzler, E.G.; Nowell, L.T. ThemeRiver: Visualizing theme changes over time. In Proceedings of the IEEE Symposium on Information Visualization 2000. INFOVIS 2000. Proceedings, Salt Lake City, UT, USA, 9–10 October 2000; pp. 115–123. [Google Scholar]
- He, J.; Chen, C. Spatiotemporal analytics of topic trajectory. In Proceedings of the 9th International Symposium on Visual Information Communication and Interaction, Dallas, TX, USA, 24–26 September 2016; pp. 112–116. [Google Scholar]
- Gao, X.; Liao, C.; Chen, C.; Li, R. Visual Exploration of Cycling Semantics with GPS Trajectory Data. Appl. Sci. 2023, 13, 2748. [Google Scholar] [CrossRef]
- Al-Dohuki, S.; Wu, Y.; Kamw, F.; Yang, J.; Li, X.; Zhao, Y.; Ye, X.; Chen, W.; Ma, C.; Wang, F. Semantictraj: A new approach to interacting with massive taxi trajectories. IEEE Trans. Vis. Comput. Graph. 2016, 23, 11–20. [Google Scholar] [CrossRef]
- Ali, F.; Kwak, D.; Khan, P.; El-Sappagh, S.; Ali, A.; Ullah, S.; Kim, K.H.; Kwak, K.-S. Transportation sentiment analysis using word embedding and ontology-based topic modeling. Knowl.-Based Syst. 2019, 174, 27–42. [Google Scholar] [CrossRef]
- Yan, Y. Visual Analytics Based on Topic Models. Ph.D. Thesis, Zhejiang University, Hangzhou, China, 2019. [Google Scholar]
- Zhou, Z.; Zhang, X.; Yang, Z.; Chen, Y.; Liu, Y.; Wen, J.; Chen, B.; Zhao, Y.; Chen, W. Visual Abstraction of Geographical Point Data with Spatial Autocorrelations. In Proceedings of the 2020 IEEE Conference on Visual Analytics Science and Technology (VAST), Salt Lake City, UT, USA, 25–30 October 2020; pp. 60–71. [Google Scholar]
- Wang, H.; Ni, Y.; Sun, L.; Chen, Y.; Xu, T.; Chen, X.; Su, W.; Zhou, Z. Hierarchical visualization of geographical areal data with spatial attribute association. Vis. Inform. 2021, 5, 82–91. [Google Scholar] [CrossRef]
- Chengdu Taxi GPS Data. Available online: https://www.pkbigdata.com/common/zhzgbCmptDetails.html (accessed on 21 January 2024).
- Newman, D.; Lau, J.H.; Grieser, K.; Baldwin, T. Automatic evaluation of topic coherence. In Proceedings of the Human Language Technologies: The 2010 Annual Conference of the North American Chapter of the Association for Computational Linguistics, Los Angeles, CA, USA, 2–4 June 2010; pp. 100–108. [Google Scholar]
- Mimno, D.; Wallach, H.; Talley, E.; Leenders, M.; McCallum, A. Optimizing semantic coherence in topic models. In Proceedings of the 2011 Conference on Empirical Methods in Natural Language Processing, Edinburgh, UK, 27–31 July 2011; pp. 262–272. [Google Scholar]
- Aletras, N.; Stevenson, M. Evaluating topic coherence using distributional semantics. In Proceedings of the 10th International Conference on Computational Semantics (IWCS 2013)–Long Papers, Potsdam, Germany, 19–22 March 2013; pp. 13–22. [Google Scholar]


Disclaimer/Publisher’s Note: The statements, opinions and data contained in all publications are solely those of the individual author(s) and contributor(s) and not of MDPI and/or the editor(s). MDPI and/or the editor(s) disclaim responsibility for any injury to people or property resulting from any ideas, methods, instructions or products referred to in the content. |
© 2024 by the authors. Licensee MDPI, Basel, Switzerland. This article is an open access article distributed under the terms and conditions of the Creative Commons Attribution (CC BY) license (https://creativecommons.org/licenses/by/4.0/).
Share and Cite
Chen, H.; Wu, Y.; Tang, H.; Lei, J.; Wang, G.; Zhao, W.; Liao, J.; Wang, F.; Wang, Z. Visual Analysis Method for Traffic Trajectory with Dynamic Topic Movement Patterns Based on the Improved Markov Decision Process. Electronics 2024, 13, 467. https://doi.org/10.3390/electronics13030467
Chen H, Wu Y, Tang H, Lei J, Wang G, Zhao W, Liao J, Wang F, Wang Z. Visual Analysis Method for Traffic Trajectory with Dynamic Topic Movement Patterns Based on the Improved Markov Decision Process. Electronics. 2024; 13(3):467. https://doi.org/10.3390/electronics13030467
Chicago/Turabian StyleChen, Huarong, Yadong Wu, Huaquan Tang, Jing Lei, Guijuan Wang, Weixin Zhao, Jing Liao, Fupan Wang, and Zhong Wang. 2024. "Visual Analysis Method for Traffic Trajectory with Dynamic Topic Movement Patterns Based on the Improved Markov Decision Process" Electronics 13, no. 3: 467. https://doi.org/10.3390/electronics13030467
APA StyleChen, H., Wu, Y., Tang, H., Lei, J., Wang, G., Zhao, W., Liao, J., Wang, F., & Wang, Z. (2024). Visual Analysis Method for Traffic Trajectory with Dynamic Topic Movement Patterns Based on the Improved Markov Decision Process. Electronics, 13(3), 467. https://doi.org/10.3390/electronics13030467