Article

Multi-Objective Topology Optimization of Thin-Plate Structures Based on the Stiffener Size and Layout

1
School of Mechanical Engineering, Chongqing University of Technology, Chongqing 400054, China
2
School of Advanced Manufacturing Engineering, Chongqing University of Posts and Telecommunications, Chongqing 400065, China
*
Author to whom correspondence should be addressed.
Electronics 2024, 13(24), 4968; https://doi.org/10.3390/electronics13244968
Submission received: 30 October 2024 / Revised: 29 November 2024 / Accepted: 16 December 2024 / Published: 17 December 2024

Abstract

:
To address the limitations of existing optimization methods that focus on single objectives or neglect stiffener features, a multi-objective topology optimization (MOTO) method is proposed based on the stiffener size and layout. By constraining the initial structural performance parameters, the optimal stiffener height is determined through size optimization. Based on the stiffener height, single-objective topology optimization is used to achieve the best material distribution. The stiffener width is treated as a design variable, while MOTO is performed on the load point displacement, first natural frequency, and mass, thereby yielding an optimal stiffener width and performance. Finally, a multi-dimensional analysis of the stiffener height, width, and dynamic and static characteristics of the stiffened thin-plate structure is conducted. The results indicate that the optimized stiffener layout is considerably improved. Compared to the initial structure, the maximum and average displacements of the load point are reduced by 23.26% and 8.62%, respectively. The first natural frequency increases by 3.81%, while the maximum resonance amplitude and overall structural mass decrease by 39.97% and 1.99%, respectively. The results indicate that the optimized structure achieves a lightweight design while maintaining better stiffness and low-frequency vibration resistance. The feasibility and effectiveness of the proposed method are validated.

1. Introduction

Stiffened thin-plate structures (STPSs) generally comprise stiffeners and thin-walled structures (TWSs) that offer a high specific stiffness and an excellent load-bearing capacity [1,2]. They are widely used in marine, automotive, and aerospace applications [3]. From a mechanical perspective, the dynamic response of the STPS differs considerably from that of the TWS. The layout and size characteristics of the stiffeners significantly influence the dynamic and static performances, including the stiffness, frequency, and buckling load. In complex engineering environments, conventional layouts primarily feature a cruciform stiffener design, with the stiffener sizes generally derived from existing designs or empirical data. This approach results in minimal performance improvements in the optimized structures, thereby leading to unreliability and inaccuracy in the analysis, design, and optimization processes [4]. Hence, there is a need for a multi-objective topology optimization (MOTO) method that comprehensively considers the characteristics of stiffener structures, including the overall performance of the STPS, to enhance the dynamic and static properties while optimizing the stiffener sizes and layouts.
Current research on STPS optimization primarily focuses on the stiffener characteristics and overall performance, with particular emphasis on the layout, shape, and size of the stiffeners. Liu et al. [5] proposed a layout optimization method for stiffened plates by optimizing the structure through pre-modeling, particularly focusing on the thicknesses of individual stiffeners. Feng et al. [6] introduced a stiffener layout optimization method for shell structures using B-spline parameterization, which avoided the checkerboard phenomenon by defining the stiffener height using B-spline control parameters. Liu et al. [7] presented a layout and shape optimization method for stiffened plates using a multivariable cutting level set approach, which adjusted the layout and shape by modifying the upper and lower limits of the design variables. Gao et al. [8] proposed a novel method based on the series expansion of anisotropic material fields, thereby determining the number, position, and size of the stiffeners according to specific problems and optimization processes. Moskaleva et al. [9] developed an efficient and stable algorithm for designing composite freeform shell structures, thereby enhancing their buckling resistance by optimizing the stiffener layout using topology optimization. Li et al. [10] proposed a multi-scale parallel topology optimization method for TWSs to optimize stiffener arrangements and cross-sections, thereby improving the structural performance compared to using the single-scale layout or section optimization.
While these studies investigated the layout, shape, and size of the stiffeners, their size parameters were primarily based on empirical values, thereby lacking robust computational foundations. Furthermore, they failed to comprehensively consider multiple structural characteristics, thereby affecting the optimization of mechanical characteristics. Zhang et al. [11] aimed to maximize the sum of the modal loss factors and conducted topology optimization on bolted thin plates, thereby enhancing the vibration reduction effectiveness. Cao et al. [12] treated the control point height as a variable, thereby targeting the structural strain energy, geometric complexity index, and ultimate load capacity in their MOTO of freeform stiffened grid shells. Xu et al. [13] used the cross-sectional shape as a variable, thereby targeting the structural strain energy, buckling load, and mass in their MOTO of freeform stiffened grid shells. Jiang et al. [14] performed shape optimization on freeform stiffened grid shells or thin plates under various loading conditions, with constraints based on the presence or absence of natural frequencies, thereby improving the static and dynamic performances of the freeform stiffened grid shells. Meng et al. [15] introduced a shape–thickness–topology coupled optimization method for shell structures, which significantly reduced the displacement and von Mises stress, thereby enabling the efficient design of the freeform stiffened grid shells. Although the aforementioned studies have improved the mechanical properties of the TWS, they primarily focused on single-objective optimization and neither comprehensively investigated the dynamic and static characteristics of the structures nor established a systematic optimization method.
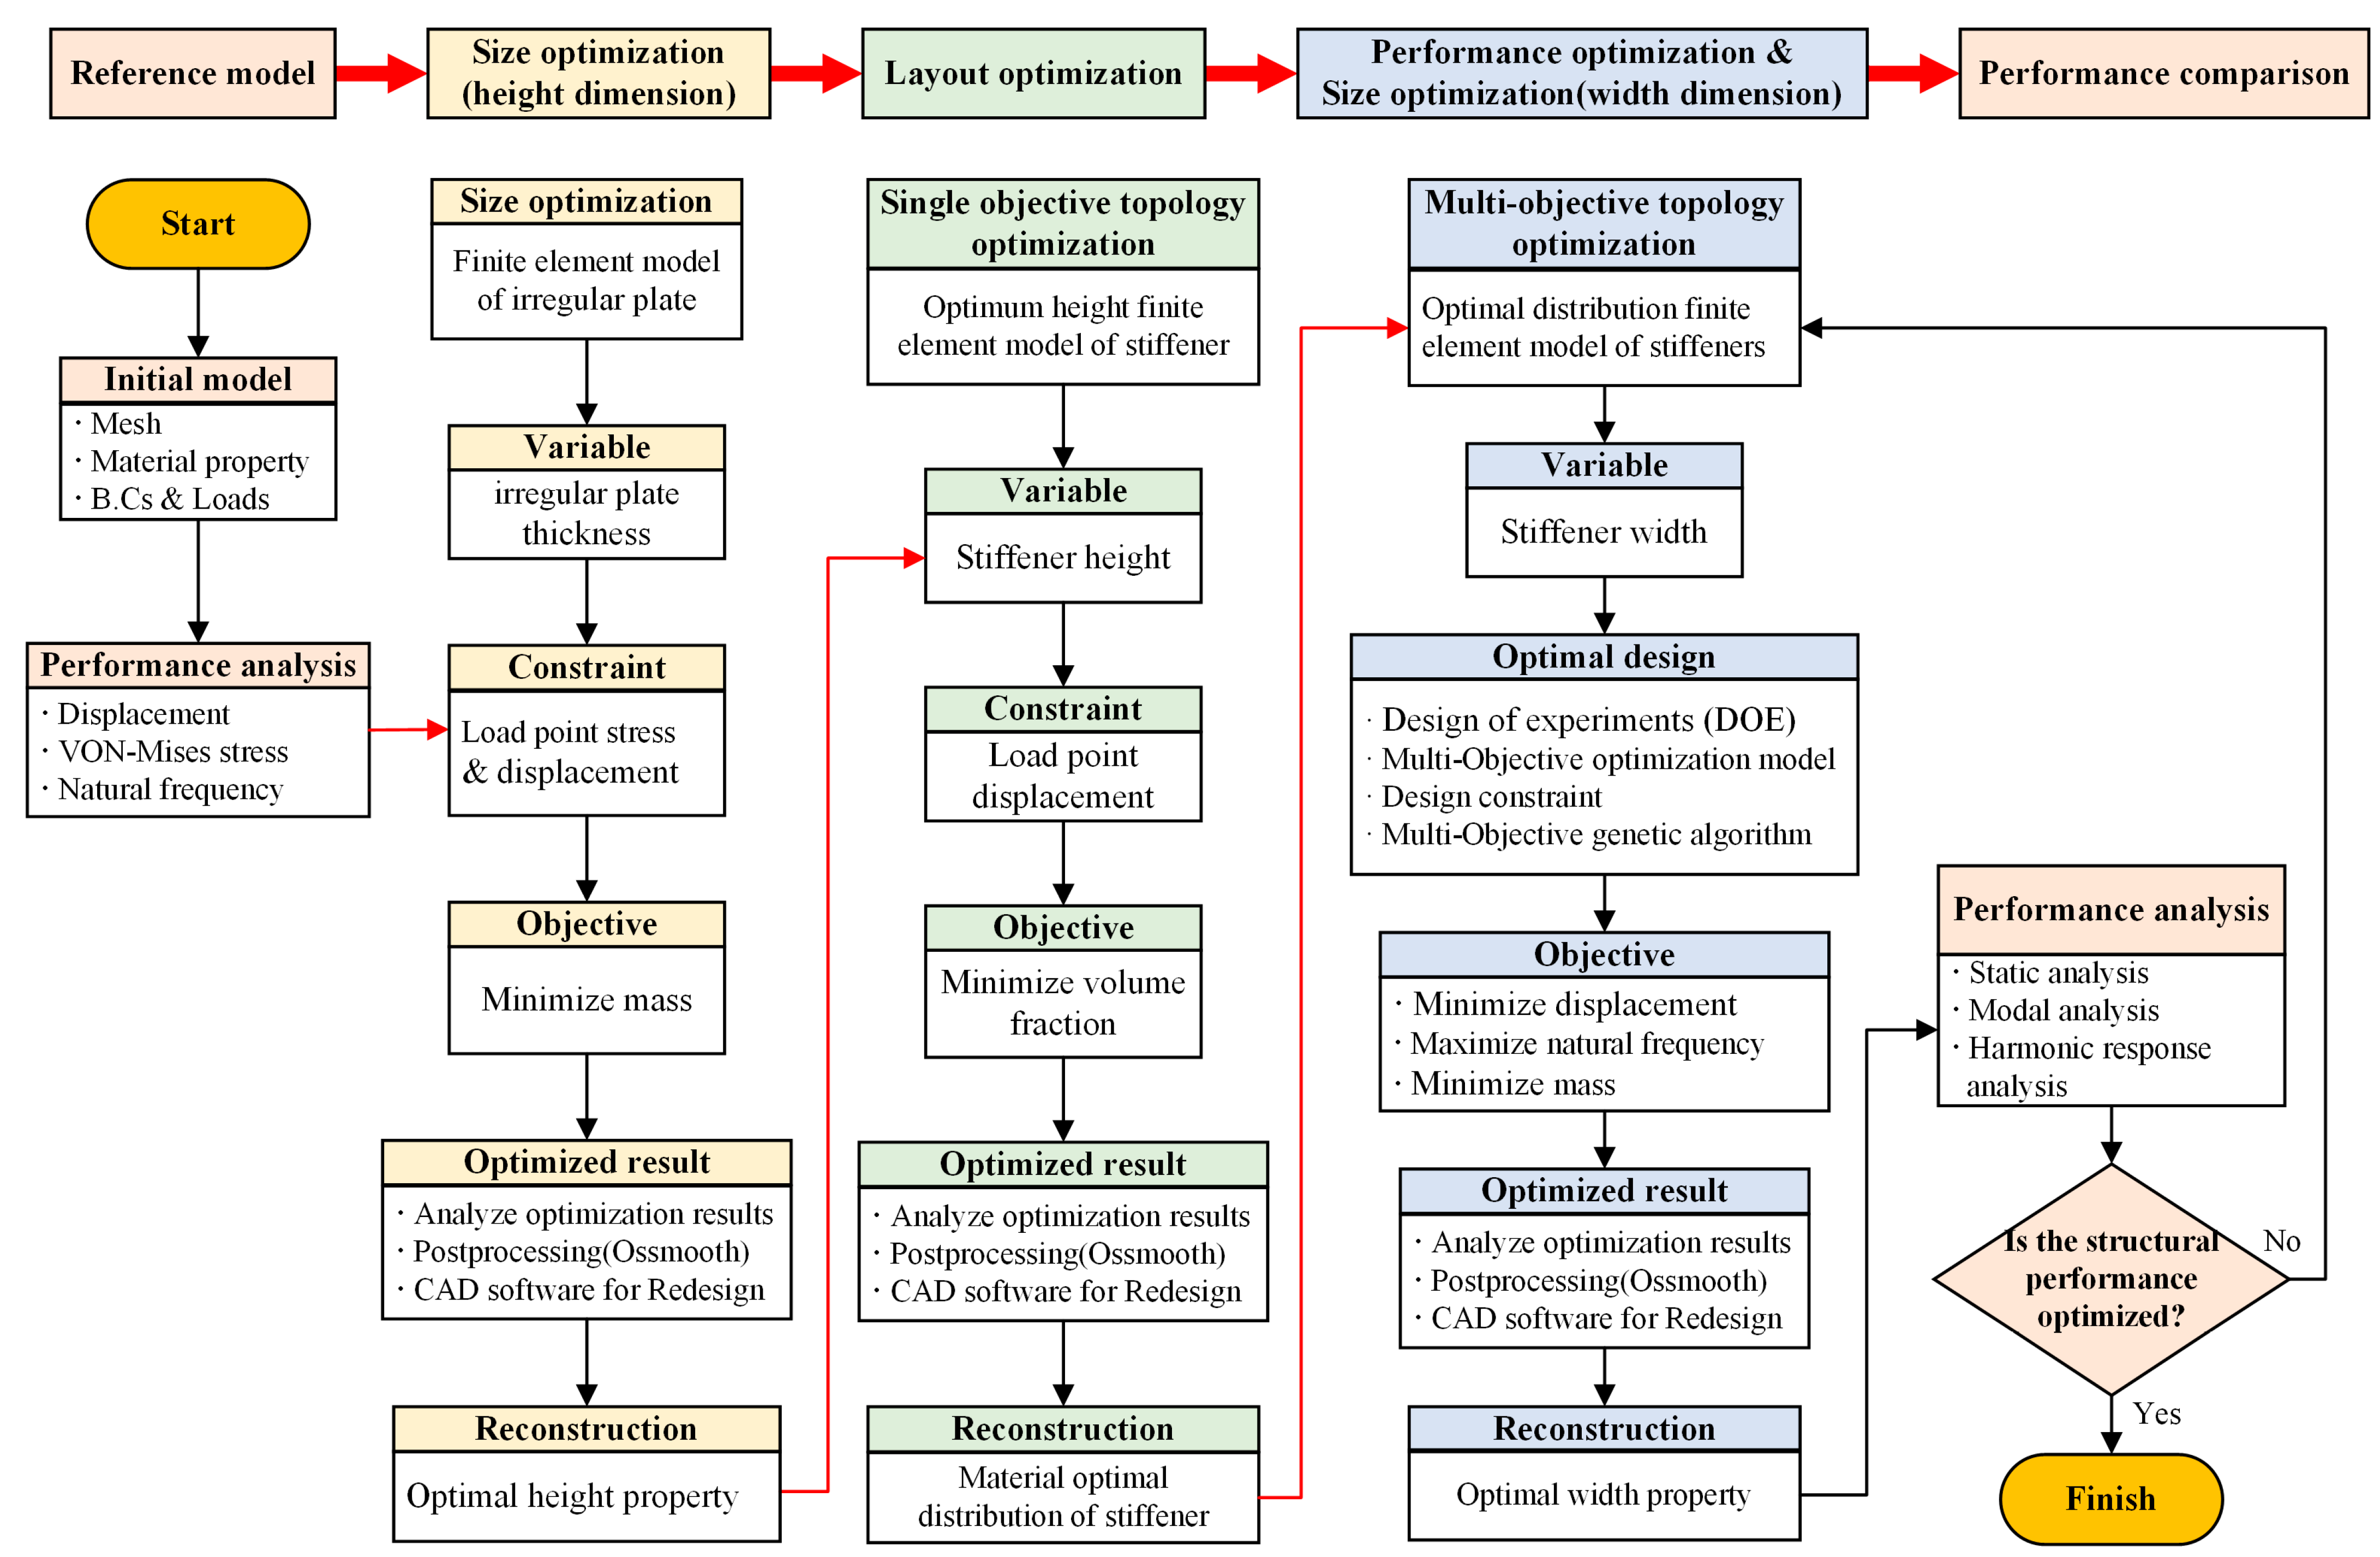
This study presents a MOTO method that considers the stiffener height and width as design variables, thereby optimizing the stiffener size and layout while comprehensively addressing the dynamic and static characteristics of the STPS. Using the thickness of the irregular plate (IP) as a variable, the load point displacement and stress of the initial STPS are constrained to minimize the mass, thereby determining the optimal stiffener height using size optimization. With the objective of minimizing the volume fraction, the stiffener height is treated as a design variable and load point displacement as a constraint. The optimal material distribution of the stiffeners is achieved using single-objective topology optimization. Furthermore, the stiffener width is considered as a design variable, while a MOTO is conducted with the load point displacement, first natural frequency, and mass as objectives. The dynamic and static characteristics are enhanced while determining the optimal stiffener width. Finally, a multi-dimensional comparison of the stiffeners and STPSs before and after optimization is conducted using a finite element simulation. The optimal dimensions and distribution of the stiffeners are clearly identified, thereby optimizing and enhancing the dynamic and static characteristics of the STPS.

2. Initial Structural Performance

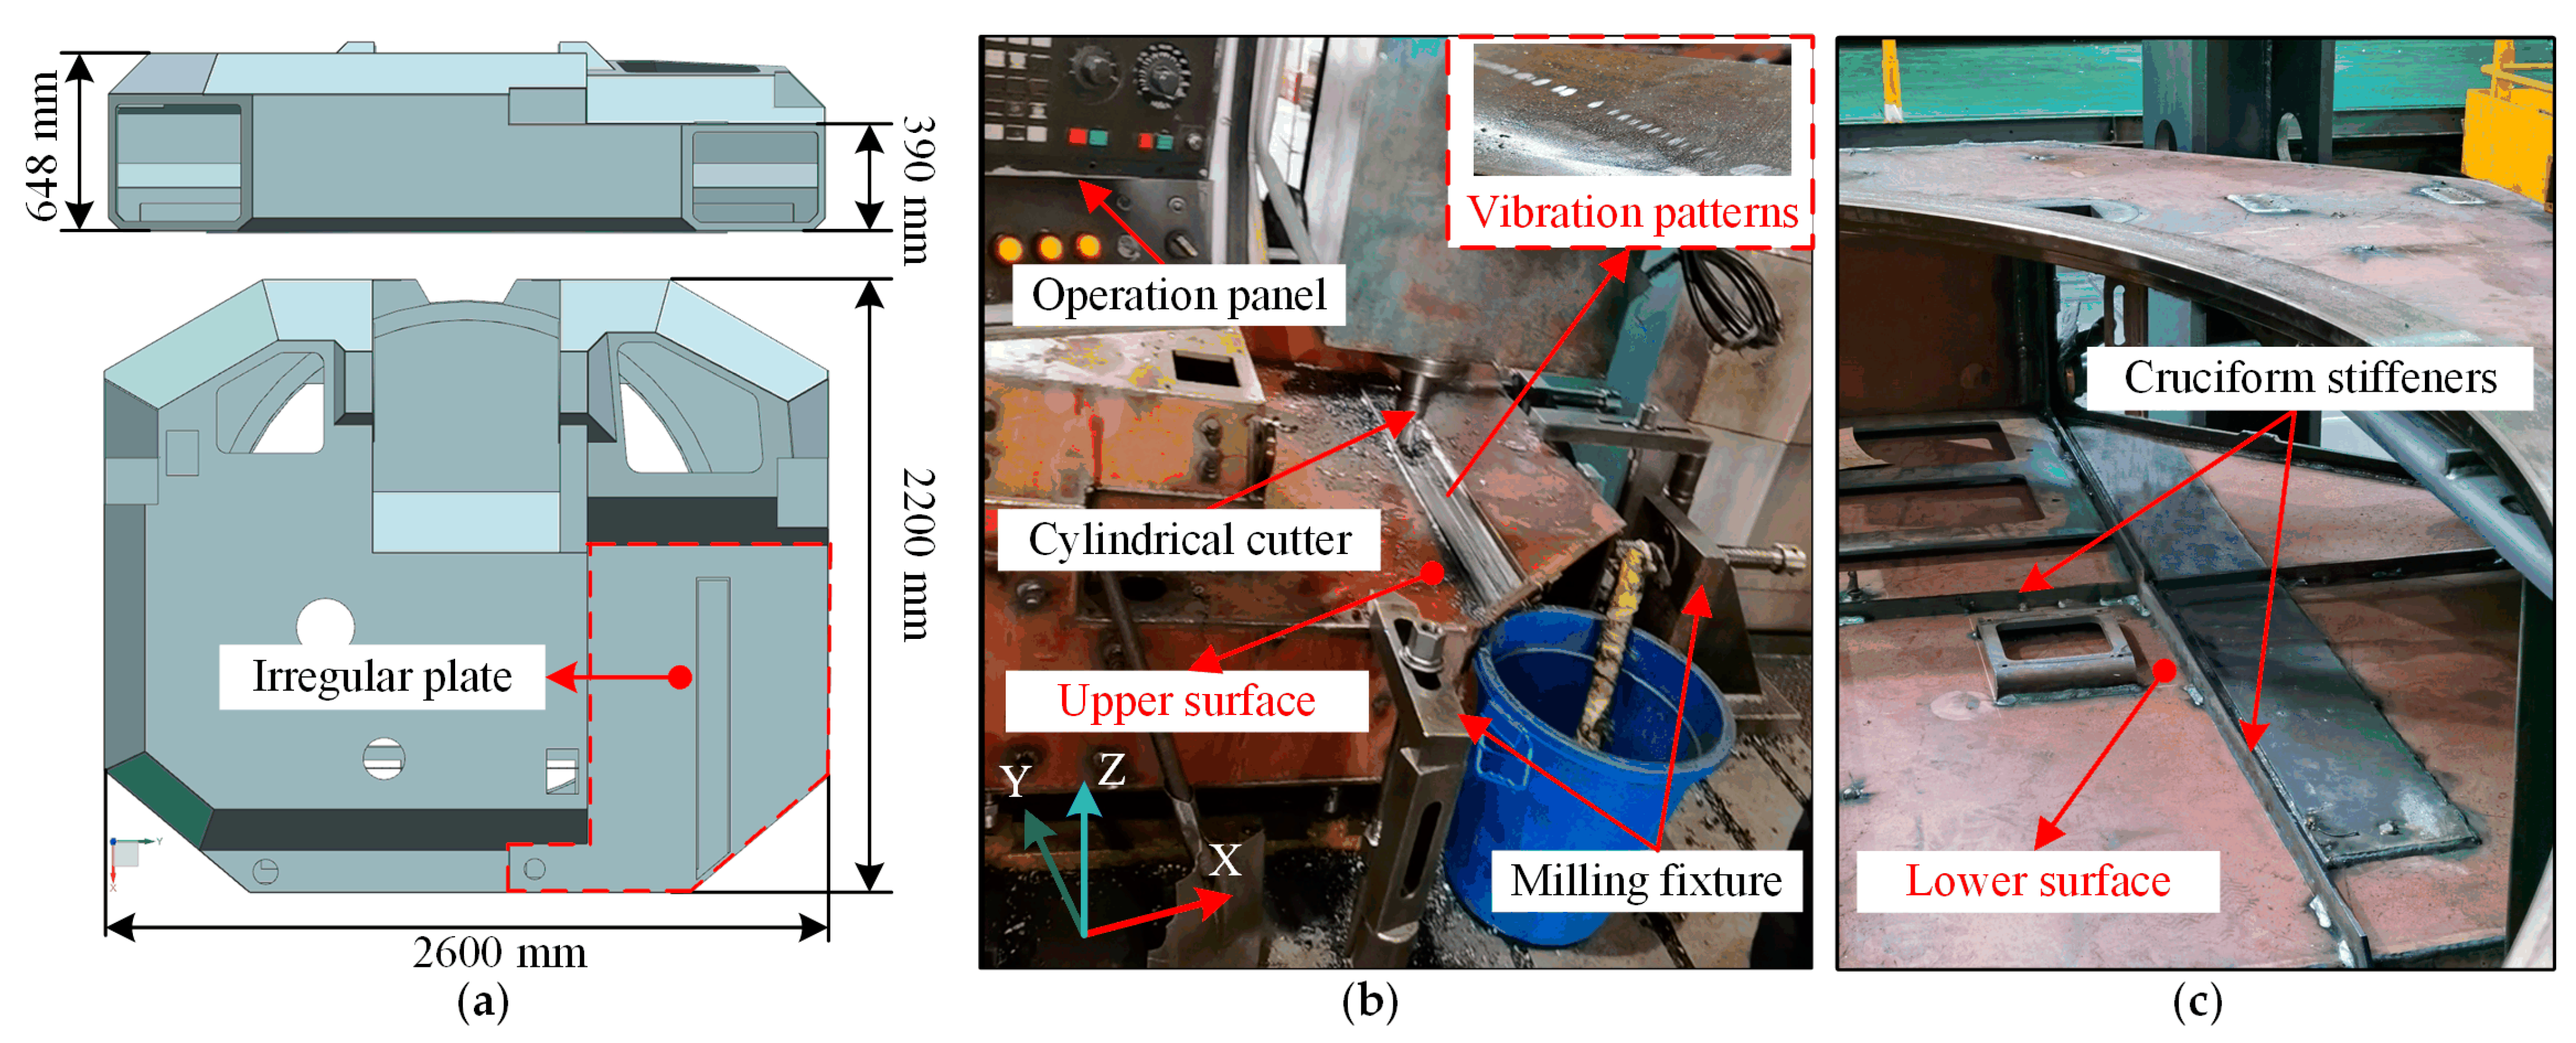
This study focuses on the IP within a large welded shell structure (WSS) in actual production, as shown in Figure 1a. During the milling process, the IP exhibits significant vibrations, thereby affecting its surface quality, as shown in Figure 1b. To enhance stiffness, cruciform stiffeners are added to the lower surface of the IP, thereby forming an STPS, as shown in Figure 1c. However, the improvement in vibration resistance remains limited, with surface ripples and high machining amplitude still present. Hence, the STPSs were analyzed as initial structures to identify the key performance parameters and provide baseline data for further optimization.

2.1. Research Subject

The STPS comprised an IP welded with stiffeners, with a cruciform layout of stiffeners on the lower surface, as shown in Figure 2. The material properties of each component are presented in Table 1. The thickness of the IP was 4.5 mm. The width of stiffeners 1 and stiffeners 2 is 5 mm, and their height is 30 mm. The width and height of stiffeners 3 are 5 mm and 25 mm, respectively. The non-design domain comprised three rectangular plates, each with a width and height of 5 and 20 mm, respectively. Based on the materials and dimensions, the initial mass of the STPS was calculated as 0.0402 t. This value was used as an economic indicator for structural optimization, with the mass being one of the optimization objectives.

2.2. Static Analysis

To determine the constraints and evaluation criteria for the optimized design of the STPS, finite element analysis software was used to conduct dynamic and static analyses. Parameters such as the load point displacement, stress, and natural frequencies were obtained for the initial STPS. Prior to the analysis, the boundary conditions, constraints, and loads were defined based on the actual stress state and connection methods of the structure.

2.2.1. Setting Boundary Conditions

The IP in the STPS was welded to the WSS. The WSS had a large overall size and was held in place by fixtures, thereby ensuring high stability. Hence, the boundary conditions for the STPS were set as fixed constraints.

2.2.2. Applying External Loads

During milling, the primary external load on the STPS was the milling force perpendicular to the IP plane. Hence, only the force exerted by the cylindrical milling cutter in this direction was considered to be the external load. Based on the parameters of the cylindrical milling cutter and milling process, the cutter had a diameter of 60 mm, a cutting width of 40 mm, eight teeth, a rake angle of 10°, a cutting depth of 2 mm, a spindle speed ranging from 300 to 600 rpm, and a feed rate of 300 mm/min. The perpendicular force component was calculated using the milling force calculation formula, with the maximum value FZ = 1299 N used as the input load.

2.2.3. Finite Element Model Construction

The stiffeners and IP are discretized using 10 mm shell elements (QUAD4) to develop the finite element model of the STPS, which employs a continuum modeling approach [16,17,18,19]. The meshes of the stiffeners and IP are connected using a shared node approach, thereby forming a continuous structure. The displacement compatibility at the connection is achieved by coupling the degrees of freedom at the nodes while also satisfying the requirements of multi-objective topology optimization software for continuum structures.
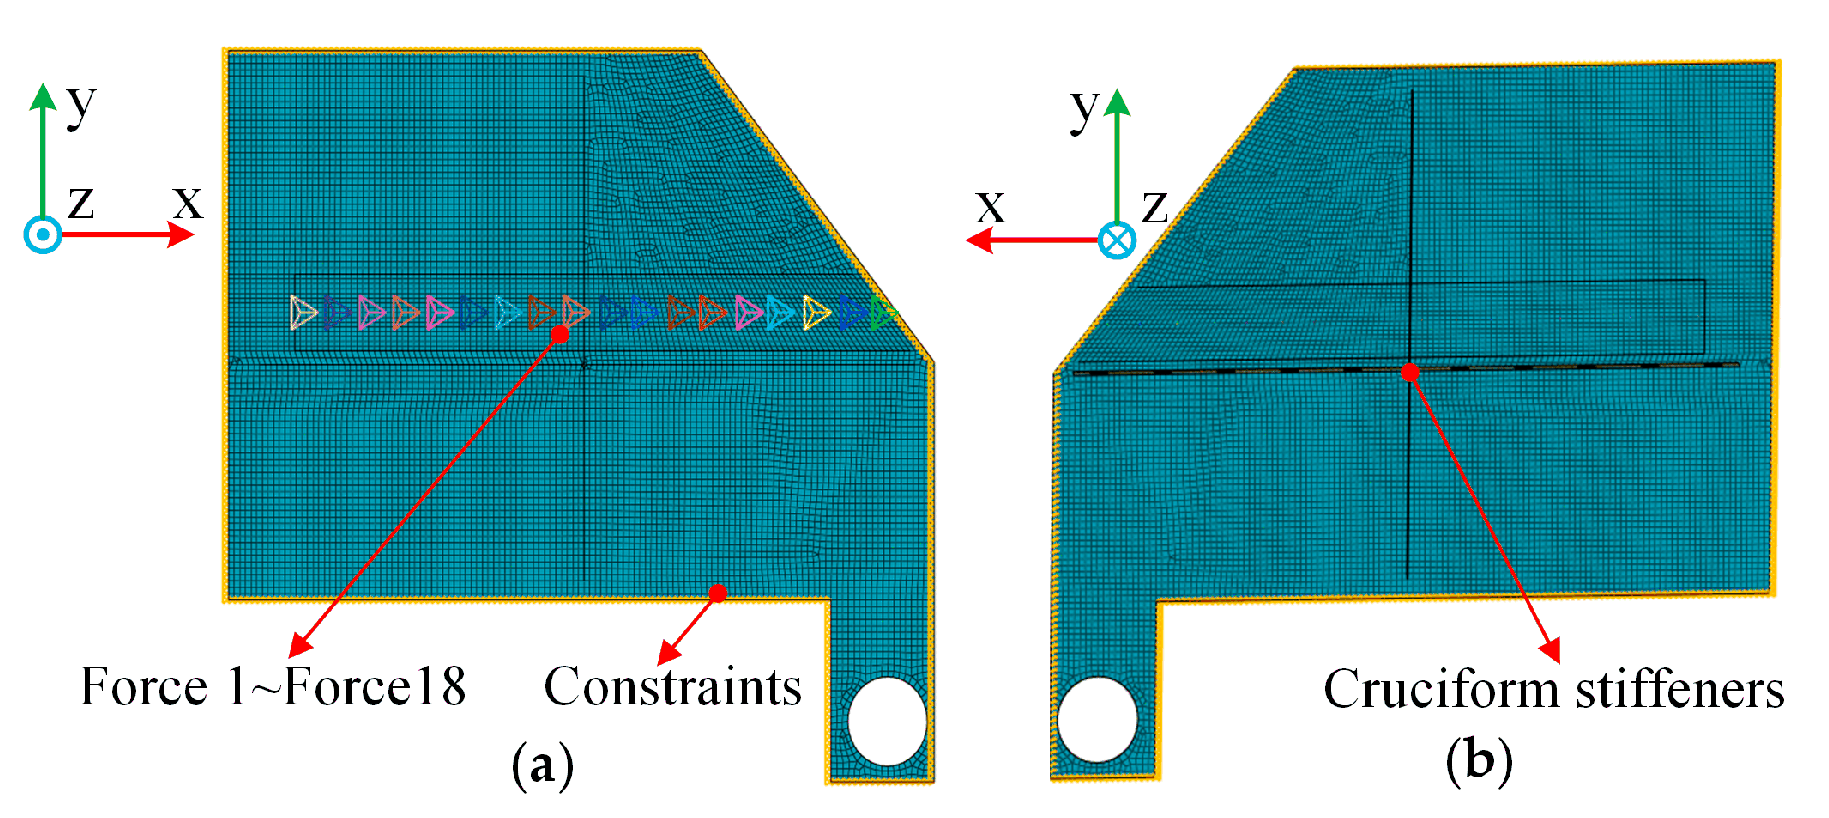
The model boundaries were defined as fixed constraints to simulate the actual stress conditions of the IP within the WSS. A 60 mm (milling cutter diameter) spacing was set, with 18 load points evenly distributed across the machined surface, arranged from right to left. Each load point was subjected to a 1299 N load, which was applied perpendicular to the IP in the negative Z-axis, thereby creating 18 load steps. The weight coefficient for each load step was set to one to simulate the excitation conditions during the milling process. Finally, a finite element model of the initial STPS was established, as shown in Figure 3.

2.2.4. Performance Analysis Results

A static analysis was conducted on the STPS, thereby yielding stress values and maximum negative Z-axis displacements for the 18 load points, as presented in Table 2. The results show that among the 18 load points, load point 11 had the largest displacement of 1.376 mm, whereas load point 1 had the smallest displacement of 0.034 mm. The lowest stress was observed at load point 1, with a value of 43.846 MPa, while the highest stress at load point 13 was 108.896 MPa, which was significantly below the tensile strength of the IP (1000 MPa) and satisfied the design requirements. Hence, the maximum negative Z-axis displacement was used as an optimization objective. Additionally, the minimum displacement (0.034 mm) and minimum stress (43.846 MPa) served as design constraints for further stiffener size optimization. The maximum displacement (1.376 mm) was used as a benchmark to evaluate the static performance optimization of the STPS.

2.3. Modal Analysis

A modal analysis was conducted on the initial STPS under static boundary conditions, thereby yielding the first six natural frequencies, as presented in Table 3. The external excitation frequency during the milling process is influenced by the spindle speed and number of tool teeth. Under typical machining conditions with a spindle speed ranging from 300 to 400 rpm and eight tool teeth, the external excitation frequency during actual cutting is calculated to be between 40 and 53 Hz.
The analysis results indicate that the first natural frequency was 58.56 Hz, which was close to the range of the external excitation frequencies, whereas the remaining frequencies were >121 Hz. This suggests that the first natural frequency was more susceptible to external excitation than other frequency bands. Consequently, improving the first natural frequency was chosen as an optimization objective for the STPS.

3. MOTO Method of Thin-Plate Structures Based on Stiffener Size and Layout

Based on the performance analysis results, three optimization objectives and relevant constraints were identified. The next involved the MOTO of the STPS based on the optimization of the stiffener size and layout. The optimization process comprised three steps. First, the height of the stiffeners was determined using size optimization; second, the layout of the stiffeners was established using single-objective topology optimization; and third, MOTO was used to improve the dynamic and static performances of the STPS while determining the width of the stiffeners. The technical roadmap is shown in Figure 4.

3.1. Size Optimization

The height of the stiffeners is primarily based on the initial production parameters or empirical data, which lacks a reliable design basis and often leads to material waste. To address this, the IP thickness was set as a design variable, with the minimum negative Z-axis displacement (0.034 mm) and minimum stress (43.846 MPa) from the 18 load points used as the constraints. The optimization objective was to minimize the mass. The optimal IP thickness and stiffener height were determined, as shown in Figure 5.
As shown in Figure 5a, the iteration curve stabilized between the fifth and sixth iterations. Hence, the model from the fifth iteration was selected as the optimization result, as shown in Figure 5b. The model revealed that the optimal IP thickness was 21.9 mm, which was rounded to 22 mm. The base thickness of the IP was 4.5 mm, which was determined based on the actual structural dimensions. Using this as a reference, the optimal height of the stiffener was calculated to be 17.5 mm.

3.2. Layout Optimization

3.2.1. Optimization Design Scheme

With the IP base thickness of 4.5 mm and optimal stiffener height of 17.5 mm used as the design variable, two optimization schemes were used to determine the optimal material distribution for the stiffener layout. Scheme 1 used the displacement constraint method, wherein the negative Z-axis displacement of the 18 load points was constrained. The optimization objective was to minimize the IP volume fraction. The results are shown in Figure 6a. Scheme 2 used the volume fraction constraint method, wherein the volume fraction was constrained, while the optimization objective was to minimize the weighted compliance of the IP. The results are shown in Figure 6b.
The aforementioned optimization solutions employ two distinct single-objective topology optimization methods. By applying different design constraints and optimization goals, these methods optimize the structural stiffness to determine the optimal material distribution. In the volume constraint method, the volume fraction is based on the engineering experience, while the weighted coefficient of flexibility reflects the influence of external conditions on the optimization object. These factors limit optimization effectiveness. Conversely, the displacement constraint method minimizes material usage by satisfying displacement constraints. It ensures structural stiffness and achieves a lightweight design, thereby making it suitable for industries, such as aerospace, automotive, and defense, wherein high stiffness and lightweight design are critical.
A comparison of the optimization results shows that the material distribution obtained using Scheme 1 was more dispersed, with a higher material density, which is beneficial for stiffener placement. Contrarily, the material distribution resulting from Scheme 2 was more concentrated, thereby leading to material waste. Hence, Scheme 1, which constrains the negative Z-axis displacement of the 18 load points and minimizes the volume fraction of the IP, was selected as the optimal approach.
To further optimize the material distribution, the displacement constraints of the 18 load points were simultaneously set to −1.35, −1, −0.9, −0.8, and −0.7 mm, with the results shown in Figure 7. Based on the principles of minimizing the load point displacement and volume and considering the material dispersion and density, the optimization result with a displacement constraint of −0.8 mm was selected as the best material distribution scheme for the stiffeners. The STPSs were reconstructed using the post-processing module of the finite element analysis software, as shown in Figure 8. The 15 stiffener segments were labeled as L1–L15, with an optimal height of 17.5 mm and an initial width of 5 mm.

3.2.2. Layout Optimization Results

A static analysis was conducted on the STPS after the layout optimization. The maximum Z-axis negative displacement at the 18 load points was obtained and compared to those of the initial STPS, as presented in Table 4. The comparison showed that after the layout optimization, the maximum displacement at the load points was 1.132 mm, which represents a 15.8% reduction compared to the initial STPS. The average displacement was 0.811 mm, thereby reflecting an 8.9% decrease and a significant reduction in the IP deformation. These results demonstrate that the stiffener layout had a substantial impact on the static performance of the IP, while optimizing the layout can significantly improve the static characteristics of the STPS.
The stiffener width (5 mm) was determined based on the initial STPS parameters, although its direct impact on the STPS performance was overlooked. Additionally, the single-objective optimization approach did not fully address the complexities of the manufacturing environment, thereby limiting the stiffener layout optimization. Hence, it was necessary to incorporate the stiffener width into the analysis and perform MOTO to further enhance the overall mechanical performance of the STPS.

3.3. Multi-Objective Topology Optimization

This study adopted an optimization method that transformed the multi-objective optimization problem into a Pareto front problem. This approach involved updating the Pareto front with the optimal values from the best-performing group in the single-objective optimization results at each iteration, thereby determining a new set of optimization variables for the next generation. The mathematical model [20,21] is as follows:
find x = x 1 , x 2 , , x n min f ( x ) = ( f 1 ( x ) , f 2 ( x ) , , f s ( x ) ) T subject   to : g j ( x ) 0                     j = 1 , 2 , m x i L x i x i U                   i = 1 , 2 , n
where x represents the design variable; n is the number of design variables; f ( x ) is the optimization objective; f s ( x ) is the s-th optimization objective; g j ( x ) is the j-th constraint condition; m is the number of constraints; and x i L and x i U are the lower and upper bounds of x i , respectively.
In this optimization design, the design variables were the widths of 15 stiffeners, with an initial value of 5 mm, and the upper and lower limits of 10 and 3 mm, respectively. The number of design variables was determined using a design of experiment (DOE) analysis. The three optimization objectives included the load point displacement (maximum negative Z-axis displacement at load point 9), first natural frequency, and overall mass, which were mutually constrained. A multi-objective genetic algorithm [22,23] was applied to solve the iterative model and obtain the Pareto solution.

3.3.1. Design of Experiments Analysis

DOE analysis was used to select the stiffener widths with the highest response to the optimization objectives as the final design variables [24,25,26], thereby ensuring the efficient solving of the multi-objective genetic algorithm. The widths of 15 stiffeners were used as inputs, while a fractional factorial method was applied to filter the design variables based on their responses to the optimization objectives. The calculation accuracy was set to level IV, with the number of calculations set to 32. The results of this analysis are shown in Figure 9. In the bar chart, the height represents the response degree of each design variable to the objective. The upward-sloping dashed line indicates a positive effect of the variable on the objective, whereas a downward slope indicates a negative effect. The blue curve represents the cumulative effects of multiple design variables on the optimization objectives.
The results show that design variables L11, L14, L6, L8, L9, L3, L4, and L1 had the highest responses to the mass, with a cumulative effect of approximately 66%. Variables L9, L10, L4, L3, L12, L8, L1, and L7 exhibited the highest responses to the feature point displacement, with a cumulative effect of approximately 85%. Variables L1, L3, L4, L2, L12, L6, L8, and L15 showed the greatest responses to the first natural frequency, with a cumulative effect of approximately 87%. The design variables that appeared in at least two-thirds of the optimization objectives were considered to have a significant impact on the MOTO results. Hence, seven stiffener widths (L1, L3, L4, L6, L8, L9, and L12) were selected as the design variables for the subsequent MOTO.

3.3.2. Iterative Optimization Model

Seven stiffener widths identified using the DOE analysis were selected as the final design variables to develop an iterative model for MOTO. The objectives were the load point displacement, first natural frequency, and mass, while the optimal solution was obtained using a multi-objective genetic algorithm [27,28]. The maximum and minimum iteration counts were set to 50 and 25, respectively, while the population size was set to 100. After 4510 iterations, the Pareto solution set and its two-dimensional projection of the optimization results were obtained, as shown in Figure 10.

3.3.3. Optimization Results

Based on the Pareto 3D scatter plot, three schemes were identified to achieve the optimal performance for individual objectives. Scheme W1 minimized the mass, W2 the negative Z-axis displacement at the load point, and W3 the first natural frequency. The MOTO results for the three schemes are presented in Table 5.
The aforementioned three single-objective optimization solutions are subsets of the Pareto optimal set and can be directly obtained using iterative multi-objective optimization models. Consequently, the computation time for the three single-objective optimizations corresponds with the iteration time of the multi-objective optimization. By analyzing the three solutions, the priority of the optimization objectives for this study can be established, while the optimal solution can be derived using a comprehensive approach. Although this introduces additional factors to the multi-objective optimization, increasing the computational effort, the overall computation time remains similar to that of the single-objective optimization. Consequently, it enhances the computational efficiency per unit of time and yields better outcomes.
As presented in Table 5, Scheme W1 resulted in the lowest mass, highest negative Z-axis displacement at the load point, and lowest natural frequency, thereby making it the most cost-effective choice for the structural design. Scheme W2 minimized the negative Z-axis displacement at the load point and achieved a relatively high natural frequency, although it had the highest mass, thereby offering the best structural stiffness. Scheme W3 produced the highest natural frequency, with a higher mass and load point displacement, thereby offering the best low-frequency vibration resistance. Given that STPS production requirements emphasize machining quality and process stability, particularly structural stiffness and natural frequency, the priority for the optimization objectives was set as follows: load point displacement > first natural frequency > mass.
Based on the analysis results and prioritization of the optimization objectives, the 3418th iteration was selected as the Pareto optimal solution to satisfy the performance requirements of the STPS in a complex machining environment, as indicated by the red point in Figure 10. The optimal solution corresponded with the following optimization results: a mass of 0.0394 t, a load point displacement of −1.011 mm, and a first natural frequency of 60.79 Hz. The design variable values obtained to determine the optimal stiffener widths are presented in Table 6.

4. Analysis of the Results

To validate the feasibility of the MOTO method, a comparative analysis of the structural features was conducted across two dimensions: the stiffener height and width. Additionally, the dynamic and static characteristics of the STPS before and after optimization were compared. Finally, the stiffener size and layout were analyzed, thereby confirming the optimization effects on the dynamic and static performances of the STPS.

4.1. Comparison and Analysis of Stiffener Size Characteristics

4.1.1. Height

Using the stiffener height as the variable, with the stiffener width fixed at 5 mm, and constraining the displacement at 18 load points, three topology optimization schemes were designed to minimize the volume fraction. Scheme H1 had a design region thickness, stiffener height, and IP thickness of 22, 17.5, and 4.5 mm, respectively. Scheme H2 had a design region thickness, stiffener height, and IP thickness of 29.5, 25, and 4.5 mm, respectively. Scheme H3 had a design region thickness, stiffener height, and IP thickness of 34.5, 30, and 4.5 mm, respectively. Scheme H1 represented the optimal stiffener height, whereas the stiffener heights in the other schemes were based on the initial STPS parameters, as shown in Figure 2. Topology optimization was performed for all three schemes to determine the optimal material distribution for the stiffeners. The optimization results and reconstructed models for each scheme are shown in Figure 11, while the optimized structural parameters are presented in Table 7.
The optimization results indicate that under similar constraints, all three schemes exhibited good convergence in their iteration curves, with an ideal level of material distribution discreteness. Among these schemes, H1 exhibited the highest material density. As presented in Table 7, H1 had the lowest material distribution mass for the stiffeners compared to the other designs.
In summary, under similar design constraints and optimization objectives, all three schemes achieved topology optimization with good convergence. Scheme H1 had the best material discreteness, highest material density, and smallest model reconstruction mass, thereby making it the most cost-effective scheme for the structural design. Hence, a stiffener height of 17.5 mm from Scheme H1 was selected as the design variable for the optimization scheme. This also demonstrates the feasibility of achieving optimal stiffener height characteristics using size optimization.

4.1.2. Width

Five optimization schemes were developed using the stiffener width as the variable while fixing the stiffener height at 17.5 mm. The first scheme (W0) was based on the stiffener layout optimization results from Section 3.2, whereas the remaining four schemes represented the three single-objective optimal solutions from the MOTO results in Section 3.3 (W1, W2, and W3) and Pareto optimal solution (W4). The optimization results for the five schemes are presented in Table 8, while the stiffener widths for each scheme are presented in Table 9.
Compared to Scheme W0 (Table 8), W1 reduced the mass by 2.27%, load point displacement by 1.99%, and natural frequency by 2.06%. Scheme W2 maintained a similar (W0), reduced the load point displacement by 20.45%, and increased the natural frequency by 2.11%. Scheme W3 reduced the mass and load point displacement by 0.51% and 18.46%, respectively, and increased the natural frequency by 2.77%. Scheme W4 reduced the mass and load point displacement by 0.51% and 19.57%, respectively, and increased the natural frequency by 2.60%. Based on the actual machining requirements and prioritization of the optimization objectives, Schemes W3 and W4 showed relatively better overall optimization results. However, because both schemes demonstrated similar levels in terms of the mass and natural frequency optimization, Scheme W4 stood out owing to its superior optimization of the load point displacement. This indicates that optimizing a single objective is insufficient for complex machining environments, thereby further validating the feasibility and effectiveness of the MOTO method.

4.2. Performance Comparison and Analysis of the STPS

The STPS determined in Section 3.3 was used as the optimal scheme, while the structure from Section 2.2 served as the initial scheme. Dynamic and static analyses were conducted on the reconstructed models. Based on the analysis results, static performance comparisons were performed using the mass of the stiffened structure and maximum negative Z-axis displacement at the load point. Dynamic performance comparisons were performed using the first natural frequency and acceleration amplitude of the frequency response curve for the STPS.

4.2.1. Static Performance Comparison and Analysis

The mass of the initial scheme was 0.0402 t, whereas that of the optimal scheme was 0.0394 t, which represents a 1.99% reduction from the initial design, thereby achieving a lightweight structure. Static analyses were performed on the initial and optimal schemes, while the maximum negative Z-axis displacements at 18 load points were obtained. The comparison results are presented in Table 10.
Compared to the initial scheme as presented in Table 10, the number of load points with a negative Z-axis displacement > 1 mm in the optimal scheme was reduced from nine to six, while the displacement at eight load points decreased by over 16%. The maximum displacement in the initial scheme was −1.376 mm, while the optimal scheme reduced this to −1.056 mm, a 23.26% decrease. The average displacement in the initial scheme was −0.890 mm, whereas it was −0.766 mm in the optimal scheme, an 8.62% reduction.
In summary, the optimal scheme showed a significant reduction in the mass and maximum negative Z-axis displacement at the load points compared to the initial scheme, thereby improving the static performance. This demonstrates that the proposed optimization method successfully achieved a lightweight design for the STPS while enhancing its stiffness characteristics.

4.2.2. Dynamic Performance Comparison and Analysis

Modal and harmonic response analyses were conducted for the initial and optimal schemes to determine the first natural frequency of the structure and frequency response function curve at the load point of the maximum negative Z-axis displacement. The resulting frequency response function curves are shown in Figure 12. The first natural frequency and corresponding acceleration amplitudes in the X-, Y-, and Z-axis are presented in Table 11.
From the frequency response function curves, both schemes achieved strong frequency response functions. The optimal scheme exhibited a higher first natural frequency than the initial scheme. As presented in Table 11, the maximum resonance amplitudes in the X- and Y-axis, which correspond with the first natural frequency, were below 9.2 m/s2, which were four orders of magnitude smaller than those in the Z-axis, thereby highlighting the significant impact of the Z-axis load on the dynamic characteristics of the STPS. Given the actual machining conditions, this study considers the Z-axis acceleration optimization as a key evaluation metric for structural dynamics. The Z-axis resonance amplitude in the initial scheme was 29,077.5 m/s2, whereas it decreased to 19,454.1 m/s2 in the optimized scheme, which represents a 39.97% reduction. This indicates that the optimized scheme exhibited a smaller response to external excitation than the initial scheme, with a higher low-order natural frequency, thereby resulting in better vibration resistance during low-speed machining or machine start–stop acceleration and deceleration processes.
In summary, the optimization method proposed in this study significantly improves the dynamic characteristics of the STPS, thereby providing a better low-frequency vibration resistance. This further validates the feasibility and effectiveness of the optimization method.

5. Conclusions

5.1. Current Status

(1)
This study presented a MOTO method that considers the dynamic and static characteristics of the STPS, with the stiffener height and width as the design variables. The optimization integrated the size and layout of the stiffeners. The IP thickness and stiffener height were selected as the design variables for the STPS, with the optimization objective being the minimization of mass and volume fraction. Numerous single-objective topology optimization schemes were developed, thereby resulting in an optimal stiffener height and layout. The stiffener width was used as a design variable, while MOTO was performed to optimize the load point displacement, first natural frequency, and mass. A multi-objective genetic algorithm was applied to achieve the lightweight design and optimization of dynamic and static characteristics while determining the optimal stiffener width. Finally, a multi-dimensional comparison of the stiffener height, width, and dynamic and static performances of the STPS was conducted.
(2)
The results show that after optimization, the maximum and average load point displacements were reduced by 23.26% and 8.62%, respectively, the first natural frequency increased by 3.81%, the Z-direction resonance amplitude decreased by 39.97%, and the mass was reduced by 1.99%. This demonstrates the feasibility and effectiveness of the method in optimizing the stiffener characteristics and dynamic and static performances of the STPS, thereby providing theoretical support and optimization approaches for the large WSS, which has significant engineering application potential. Furthermore, the optimization results from this study can offer theoretical insights for practical rib layout problems and serve as data support for subsequent experimental research.

5.2. Prospects

Future research opportunities include the following:
(1)
Future studies should aim to bridge the gap between numerical simulations and physical testing to improve theoretical methods. Experimental tests must be conducted during cutting processes, followed by the dynamic modal analysis of the complex plate. An M + P vibration testing platform can be established using an exciter to simulate external inputs, with accelerometers capturing responses at multiple points. The frequency response function would later be used to extract the natural frequencies, damping ratios, and mode shapes of the structures. Comparing the experimental results to the numerical simulations will validate the accuracy and effectiveness of the optimization results, thereby providing a comprehensive evaluation of the feasibility and practicality of the theoretical method.
(2)
Continuum topology optimization is an effective structural design method, although it hampers the model reconstruction process. Future research must focus on analyzing the nonlinear dynamic characteristics of the contact surface between the rib and irregular plate to further optimize the model. The theoretical model of the contact interface can be developed using the substructure synthesis method, with optimization algorithms employed to determine its equivalent stiffness and damping parameters. Additionally, more refined analytical methods must be developed to address nonlinear problems in practical engineering, thereby enhancing the engineering applicability of the theoretical methods.

Author Contributions

Conceptualization, Q.Y. and J.G.; methodology, Q.Y. and J.G.; software, Y.K.; validation, Y.K., J.M. and C.D.; formal analysis, Q.Y. and C.D.; investigation, J.G.; resources, Q.Y.; data curation, J.G.; writing—original draft preparation, J.G.; writing—review and editing, J.G.; visualization, Y.K.; supervision, J.M.; project administration, C.D.; funding acquisition, Q.Y., Y.K., J.M. and J.G. All authors have read and agreed to the published version of the manuscript.

Funding

This research was funded by the National Natural Science Foundation of China, grant number 52105245; the Natural Science Foundation Project of Chongqing Science and Technology Commission, grant number cstc2021jcyj-msxmX0303; the National Natural Science Foundation of China, grant number 52205144/52205052; and the Action Plan for Quality Development of Chongqing University of Technology Graduate Education, grant number CYS240674.

Data Availability Statement

The original contributions presented in this study are included in this article. Further inquiries can be directed to the corresponding author.

Conflicts of Interest

The authors declared that they have no conflicts of interests to declare. We declare that we do not have any commercial or associative interest that represent a conflict of interest in connection with the work submitted.

References

  1. Jiang, X.; Liu, C.; Du, Z.; Huo, W.; Zhang, X.; Liu, F.; Guo, X. A unified framework for explicit layout/topology optimization of thin-walled structures based on Moving Morphable Components (MMC) method and adaptive ground structure approach. Comput. Methods Appl. Mech. Eng. 2022, 396, 115047. [Google Scholar] [CrossRef]
  2. Meng, L.; Zhang, J.; Hou, Y.; Breitkopf, P.; Zhu, J.; Zhang, W. Revisiting the Fibonacci spiral pattern for stiffening rib design. Int. J. Mech. Sci. 2023, 246, 108131. [Google Scholar] [CrossRef]
  3. Cai, S.; Zhang, H.; Zhang, W. An integrated design approach for simultaneous shape and topology optimization of shell structures. Comput. Methods Appl. Mech. Eng. 2023, 415, 116218. [Google Scholar] [CrossRef]
  4. Hao, P.; Wang, Y.; Jin, L.; Ma, S.; Wang, B. An isogeometric design-analysis-optimization workflow of stiffened thin-walled structures via multilevel NURBS-based freeform deformations (MNFFD). Comput. Methods Appl. Mech. Eng. 2023, 408, 115936. [Google Scholar] [CrossRef]
  5. Liu, D.; Wang, Y.; Su, Z.; Hao, P.; Liu, X.; Wang, B.; Li, G. A new layout optimization method for stiffened panels based on ground stiffener structure (GSS) and thickness penalty. Thin-Walled Struct. 2022, 176, 109309. [Google Scholar] [CrossRef]
  6. Feng, S.; Zhang, W.; Meng, L.; Xu, Z.; Chen, L. Stiffener layout optimization of shell structures with B-spline parameterization method. Struct. Multidisc. Optim. 2021, 63, 2637–2651. [Google Scholar] [CrossRef]
  7. Liu, H.; Chen, L.; Shi, T.; Xia, Q. M-VCUT level set method for the layout and shape optimization of stiffeners in plate. Compos. Struct. 2022, 293, 115614. [Google Scholar] [CrossRef]
  8. Gao, Z.; Li, Y.; Fu, L.; Yang, K.; Luo, Y. Topology optimization of stiffened revolution shell structures using multi-regional anisotropic MFSE method. Thin-Walled Struct. 2024, 201, 112030. [Google Scholar] [CrossRef]
  9. Moskaleva, A.; Safonov, A.; Sergeichev, I.; Hernandez-Montes, E. Topology optimization of rib patterns for a freeform composite structure. Mater. Today Proc. 2023, 8, 324. [Google Scholar] [CrossRef]
  10. Li, Q.; Qu, Y.; Luo, Y.; Liu, S. Concurrent topology optimization design of stiffener layout and cross-section for thin-walled structures. AMS 2021, 37, 472–481. [Google Scholar] [CrossRef]
  11. Zhang, R.; Sun, W.; Luo, H.; Zhang, H.; Liu, X. Semi-analytical dynamic modeling and vibration reduction topology optimization of the bolted thin plate with partially attached constrained layer damping. Compos. Struct. 2024, 328, 117739. [Google Scholar] [CrossRef]
  12. Cao, Z.; Zhang, Y.; Wang, Z.; Zhao, L. Multi-objective optimization of assembly free-form cable-stiffened reticulated shell considering the influence of initial states. Structures 2024, 62, 106198. [Google Scholar] [CrossRef]
  13. Xu, Y.; Gai, Y.; Li, H.; Han, Q. Multi-objective shape-section optimization of freeform latticed shells using the RBF-NSGA-II algorithm. Thin-Walled Struct. 2024, 200, 111918. [Google Scholar] [CrossRef]
  14. Jiang, B.; Zhang, J.; Ohsaki, M. Shape optimization of free-form shell structures combining static and dynamic behaviors. Structures 2021, 29, 1791–1807. [Google Scholar] [CrossRef]
  15. Meng, X.; Xiong, Y.; Xie, Y.M.; Sun, Y.; Zhao, Z.L. Shape–thickness–topology coupled optimization of free-form shells. Autom. Constr. 2022, 142, 104476. [Google Scholar] [CrossRef]
  16. Li, L.; Liu, C.; Zhang, W.; Du, Z.; Guo, X. Combined model-based topology optimization of stiffened plate structures via MMC approach. Int. J. Mech. Sci. 2021, 208, 106682. [Google Scholar] [CrossRef]
  17. Sun, Z.Y.; Wang, Y.G.; Gao, Z.H.; Luo, Y.J. Topology optimization of thin-walled structures with directional straight stiffeners. Appl. Math. Model. 2023, 113, 640–663. [Google Scholar] [CrossRef]
  18. Ma, X.T.; Wang, F.Y.; Aage, N.; Kuo, T.; Peng, H.; Wang, B. Generative design of stiffened plates based on homogenization method. Struct. Multidiscip. Optim. 2021, 64, 3951–3969. [Google Scholar] [CrossRef]
  19. Yang, Y.; Wei, M.X.; Yu, J.X.; Cui, Y.P.; Gao, R.L.; Dong, Z.W.; Wang, X.Y. Reliability-based design method for marine structures combining topology, shape, and size optimization. Ocean Eng. 2023, 286, 115490. [Google Scholar] [CrossRef]
  20. Alfouneh, M.; Tong, L. Maximizing modal damping in layered structures via multi-objective topology optimization. Eng. Struct. 2017, 132, 637–647. [Google Scholar] [CrossRef]
  21. Rodríguez-Segade, M.; Hernández, S.; Díaz, J. Multi-level and multi-objective structural optimization for hypersonic vehicle design. Aerosp. Sci. Technol. 2024, 152, 109346. [Google Scholar] [CrossRef]
  22. Guo, Y.; Wang, S.; Shen, W. Multi-objective optimization of the pre-swirl system in a twin-web turbine disc cavity. Aerospace 2024, 11, 761. [Google Scholar] [CrossRef]
  23. Kralev, V.; Kraleva, R. Combining Genetic Algorithm with Local Search Method in Solving Optimization Problems. Electronics 2024, 13, 4126. [Google Scholar] [CrossRef]
  24. Zhang, Y.; He, Z.; Xuan, H.; Liu, J.; Guo, X.; Mi, D.; Fang, Z. Study on the optimal design method of the containment ring for an air turbine starter. Aerospace 2023, 10, 624. [Google Scholar] [CrossRef]
  25. Wang, Z.; Feng, Y.; Yang, Y.; Wang, J.; Xu, S.; Qin, J. Multi-objective optimization of rectangular cooling channel design using Design of Experiments (DOE). Appl. Therm. Eng. 2024, 242. [Google Scholar] [CrossRef]
  26. Ramadhan Al-Obaidi, A. Investigation of the hydraulic performance heat improvement in 3D pipe by variable of novel twisted tape configurations based on CFD and DoE analysis methods. Int. J. Heat Fluid Flow 2024, 110, 109581. [Google Scholar] [CrossRef]
  27. Wu, Q.; Wu, H.; Jiang, Z.; Tan, L.; Yang, Y.; Yan, S. Multi-objective optimization and driving mechanism design for controllable wings of underwater gliders. Ocean Eng. 2023, 286, 115534. [Google Scholar] [CrossRef]
  28. Topaloglu, I.; Bektaş, E.; Yiğit, M.E.; Korkmaz, F. Design and experimental implementation of skewed stator structured PM generator using Multi-Objective Genetic Algorithm for gearless direct driven wind system. Ain Shams Eng. J. 2024, 15. [Google Scholar] [CrossRef]
Figure 1. (a) Schematic of a large WSS; (b) milling process; (c) cruciform stiffeners.
Electronics 13 04968 g001
Figure 2. Schematic of the initial STPS: (a) upper surface; (b) lower surface.
Electronics 13 04968 g002
Figure 3. Finite element model of the initial STPS: (a) upper surface; (b) lower surface.
Electronics 13 04968 g003
Figure 4. Technical roadmap of the MOTO method.
Electronics 13 04968 g004
Figure 5. (a) Iteration curve; (b) optimization results of the IP thickness.
Electronics 13 04968 g005
Figure 6. Topology optimization results: (a) Scheme 1; (b) Scheme 2.
Electronics 13 04968 g006
Figure 7. Optimization results with different load point displacement constraints.
Electronics 13 04968 g007
Figure 8. (a) Reconstructed model of the STPS; (b) optimized stiffener layout.
Electronics 13 04968 g008
Figure 9. Response levels of the design variables to the optimization objectives: (a) mass; (b) feature point displacement; (c) first natural frequency.
Electronics 13 04968 g009
Figure 10. MOTO results: (a) all the objectives; (b) feature point displacement and first natural frequency; (c) feature point displacement and mass; (d) first natural frequency and mass.
Electronics 13 04968 g010
Figure 11. Topology optimization results of the three schemes: (a) H1; (b) H2; (c) H3.
Electronics 13 04968 g011
Figure 12. Comparison of the frequency response function curves between the two schemes: (a) X-axis; (b) Y-axis; (c) Z-axis.
Electronics 13 04968 g012
Table 1. Material properties of the STPS components.
ComponentMaterialDensity (kg/m3)Poisson’s RatioElastic Modulus (GPa)Tensile Strength (MPa)
Irregular plate40 Cr79000.282001000
Stiffener35 Steel78500.31212530
Spot weldStainless steel79300.30194520
Table 2. Static analysis results of the initial STPS.
PointDisplacement (mm)Stress
(MPa)
PointDisplacement (mm)Stress (MPa)
1−0.034 43.846 10−1.279 73.367
2−0.178 84.129 11−1.376 104.594
3−0.377 97.231 12−1.375 108.023
4−0.587 103.028 13−1.319 108.896
5−0.762 105.808 14−1.215 108.596
6−0.950 107.561 15−1.064 107.278
7−1.086 107.956 16−0.872 104.654
8−1.210 106.671 17−0.653 98.757
9−1.257 97.525 18−0.418 51.870
Table 3. Natural frequency values of the initial STPS.
OrderFrequency (Hz)OrderFrequency (Hz)
158.564154.92
2121.205198.24
3130.306215.79
Table 4. Displacements of load points before and after layout optimization.
PointDisplacement (mm)PointDisplacement (mm)
Initial LayoutOptimal
Layout
Error (%) Initial LayoutOptimal
Layout
Error (%)
1−0.034−0.035 2.9410−1.279 −1.112 −13.06
2−0.178−0.203 14.0411−1.376 −1.098 −20.20
3−0.377−0.408 8.2212−1.375 −1.053 −23.42
4−0.587−0.617 5.1113−1.319 −1.049 −20.47
5−0.762−0.822 7.8714−1.215 −1.012 −16.71
6−0.950−0.971 2.2115−1.064 −0.922 −13.35
7−1.086 −1.130 4.0516−0.872 −0.798 −8.49
8−1.210 −1.113 −8.0217−0.653 −0.696 6.58
9−1.257 −1.132 −9.9418−0.418 −0.432 3.35
AVG−0.890 −0.811 −4.40
Table 5. Optimization results of the three schemes.
SchemeMass (t)Displacement (mm)Frequency (Hz)
W10.0387−1.23258.03
W20.0396−1.00060.50
W30.0394−1.02560.89
Table 6. Optimal stiffener widths.
StiffenerWidth (mm)StiffenerWidth (mm)StiffenerWidth (mm)
L19.9L64.6L115.0
L25.0L75.0L129.6
L39.9L88.1L135.0
L49.9L99.9L145.0
L55.0L105.0L155.0
Table 7. Structural properties of the three optimization scheme results.
SchemeDesign Region Thickness (mm)Base Thickness (mm)Stiffener Height (mm)Stiffener Width
(mm)
Mass (t)
H122.04.517.55.00.0390
H229.54.525.05.00.0391
H334.54.530.05.00.0394
Table 8. Optimization results of the five schemes.
SchemeMass (t)Displacement (mm)Frequency (Hz)
W00.0396 –1.257 59.25
W10.0387–1.23258.03
W20.0396–1.00060.50
W30.0394–1.02560.89
W40.0394–1.01160.79
Table 9. Stiffener widths of the five schemes.
Stiffener Width (mm)Stiffener Width (mm)
StiffenerW0W1W2W3W4StiffenerW0W1W2W3W4
L15.03.0 9.9 9.9 9.9L95.03.0 9.9 9.9 9.9
L25.05.0 5.05.05.0L105.05.0 5.05.05.0
L35.03.09.9 9.99.9L115.05.0 5.05.05.0
L45.03.09.9 9.99.9L125.03.09.9 9.6 9.6
L55.05.0 5.05.05.0L135.05.05.05.05.0
L65.03.0 9.9 4.6 4.6L145.05.05.05.05.0
L75.05.0 5.05.05.0L155.05.05.05.05.0
L85.03.09.94.2 8.1
Table 10. Comparison of the static performance between the two schemes.
Displacement (mm)Displacement (mm)
PointInitial SchemeOptimal SchemeError (%)PointInitial SchemeOptimal SchemeError (%)
1–0.034 –0.035 2.9410–1.279 –1.008 –21.19
2–0.178 –0.200 12.3611–1.376 –1.017 –26.09
3–0.377 –0.398 5.5712–1.375 –0.987 –28.22
4–0.587 –0.596 1.5313–1.319 –1.000 –24.18
5–0.762 –0.787 3.2814–1.215 –0.973 –19.92
6–0.950 –0.920 −3.1615–1.064 –0.893 –16.07
7–1.086 –1.056 −2.7616–0.872 –0.778 –10.78
8–1.210 –1.009 −16.6117–0.653 –0.687 5.21
9–1.257 –1.012 −19.4918–0.418 –0.428 2.39
AVG–0.890–0.766 –8.62
Table 11. Comparison of the dynamic performance between the two schemes.
Frequency (Hz)Acceleration (m/s2)
InitialOptimalError (%)DirectionInitialOptimalError (%)
58.5660.793.81X9.182.69
Y5.707.53
Z29,077.5017,454.10–39.97
Disclaimer/Publisher’s Note: The statements, opinions and data contained in all publications are solely those of the individual author(s) and contributor(s) and not of MDPI and/or the editor(s). MDPI and/or the editor(s) disclaim responsibility for any injury to people or property resulting from any ideas, methods, instructions or products referred to in the content.

