Article

Detect Insider Threat with Associated Session Graph

by
Junmei Ding
1,*,
Peng Qian
2,†,
Jing Ma
3,
Zhiqiang Wang
4,
Yueming Lu
1 and
Xiaqing Xie
5
1
School of Cyberspace Security, Beijing University of Posts and Telecommunications, Beijing 100876, China
2
College of Computer Science and Technology, Zhejiang University, Hangzhou 310058, China
3
Department of Computer Science, Hong Kong Baptist University, Hong Kong, China
4
Department of Cyberspace Security, Beijing Electronic Science and Technology Institute, Beijing 100070, China
5
Key Laboratory of Trustworthy Distributed Computing and Service, Ministry of Education, Beijing University of Posts and Telecommunications, Beijing 100876, China
*
Author to whom correspondence should be addressed.
Current address: Goplus Open Research, Hangzhou 310007, China.
Electronics 2024, 13(24), 4885; https://doi.org/10.3390/electronics13244885
Submission received: 17 October 2024 / Revised: 5 December 2024 / Accepted: 8 December 2024 / Published: 11 December 2024

Abstract

:
Insider threats pose significant risks to organizational security, often leading to severe data breaches and operational disruptions. While foundational, traditional detection methods suffer from limitations such as labor-intensive rule creation, lack of scalability, and vulnerability to evasion by sophisticated attackers. Recent advancements in graph-based approaches have shown promise by leveraging behavior analysis for threat detection. However, existing methods frequently oversimplify session behaviors and fail to extract fine-grained features, which are critical for identifying subtle malicious activities. In this paper, we propose a novel approach that integrates session graphs to capture multi-level fine-grained behavioral features. First, seven heuristic rules are defined to transform user activities across different hosts and sessions into an associated session graph while extracting features at both the activity and session levels. Furthermore, to highlight critical nodes in the associated session graph, we introduce a graph node elimination technique to normalize the graph. Finally, a graph convolutional network is employed to extract features from the normalized graph and generate behavior detection results. Extensive experiments on the CERT insider threat dataset demonstrate the superiority of our approach, achieving an accuracy of 99% and an F1-score of 99%, significantly outperforming state-of-the-art models. The ASG method also reduces false positive rates and enhances the detection of subtle malicious behaviors, addressing key limitations of existing graph-based methods. These findings highlight the potential of ASG for real-world applications such as enterprise network monitoring and anomaly detection, and suggest avenues for future research into adaptive learning mechanisms and real-time detection capabilities.

1. Introduction

Insider threat detection aims to identify and monitor potential malicious activities by individuals within an organization. By analyzing user activities, access patterns, and data flows, it enables the timely detection of anomalies and helps to mitigate risks that could lead to information leaks or system damage [1]. This capability is particularly critical in sensitive industries such as healthcare [2] and security [3], where insider threat detection not only reduces potential risks but also ensures the security and stability of core operations. User behavior data are vast, multi-source, and heterogeneous, posing significant challenges for the accurate and real-time detection of insider threats. In most cases, individuals typically maintain normal behavior, with malicious actions occurring infrequently and exhibiting high concealment. Consequently, detecting anomalous behaviors among insiders becomes even more challenging. Moreover, a recent report [4] showed that over half of organizations experienced an insider threat in the last year, with 8% encountering such threats more than 20 times. Therefore, it is essential to develop an efficient and accurate method for insider threat detection that can enable decision-makers to respond swiftly to insider threats.
With the advancement of insider threat detection methods [3,5,6,7], including rule-based and anomaly-based approaches, machines are now better equipped to automatically and effectively detect insider threats from large behavioral datasets. In recent years, rapid advancements in machine learning, particularly deep learning, have led to significant progress in various fields such as medical health [2], blockchain security [8], and anomaly detection [9]. In the context of insider threat scenarios, Yaseen et al. [10] proposed a rule-based manageable model capable of effectively detecting and preventing internal threats during policy execution. Yuan et al. [11] proposed a framework combining LSTM and CNN to detect anomalous user behavior, aiming to enhance insider threat detection. Recently, Liu et al. [12] introduced a heterogeneous graph embedding method that maps relationships between log entries into a heterogeneous graph, enabling the identification of malicious patterns in enterprise environments. Despite this progress, insider threat detection still faces numerous challenges. Precise user behavior modeling requires extracting more fine-grained behavioral features, as insider attacks often exhibit highly covert and complex patterns. Additionally, anomalous activities from insiders are rare compared to normal activities, resulting in an extremely imbalanced dataset for insider threat detection. Thus, specific algorithms for imbalanced datasets are essential to enhance the detection of these anomalies.
In the area of feature extraction, mainstream methods include those based on sessions and fixed time intervals (such as daily or weekly). Among these, session-based methods aim to extract a series of behavioral features of users from login to logout, thereby enabling a more comprehensive and accurate revelation of user behavior patterns. As shown in Figure 1, which is drawn based on the AB-III behavior pattern, the fixed-time method (Figure 1a) appears reasonable to some extent; however, it lacks more detailed semantic features of activities performed within sessions (Figure 1b). Furthermore, multiple activities between sessions also exhibit associations, such as semantic and temporal relationships. Figure 1b illustrates an example where a system administrator steals sensitive data. Specifically, the malicious administrator attempts to log on to the supervisor’s machine to steal the password, corresponding to logon(6) and logoff(7) in Session 5. To achieve this, the administrator first downloads a keylogger and stores it on a thumb drive, corresponding to Http(1) and Device(2) in Session 1. The administrator then transfers the keylogger to the supervisor’s machine using the thumb drive, which corresponds to logon(3), Device(4), and logoff(5) in Session 4. Notably, subtle differences between normal and abnormal behaviors can be further captured through activity attributes, such as URLs and device status, as shown in Figure 1c.
Leveraging the aforementioned behavioral features can significantly enhance the identification of malicious activities, raising the question of whether automatic recognition and extraction of these features can improve the performance of insider threat detection models. To address this, we focus on aggregating multiple sessions to construct an associated session graph and extract fine-grained behavioral features from both intra-session and inter-session activities, thereby improving graph-based insider threat detection methods.
To this end, we propose a novel insider threat detection approach based on a graph network, which we call ASG-ITD (Associated Session Graph for Insider Threat Detection), consisting of four stages. The first stage involves constructing the associated session graph, where seven heuristic rules are defined to relate various operation types of users across different hosts and sessions. The second stage focuses on graph normalization, aiming to highlight key nodes in the graph structure. Next, data augmentation is implemented to mitigate the impact of data imbalance by synthesizing samples based on the behavior patterns of abnormal instances. Finally, the insider threat detection stage employs a detector developed to automatically identify malicious behavior by utilizing graph convolutional networks to learn the graphical representation of the normalized association graph.
The contributions of this paper can be summarized as follows:
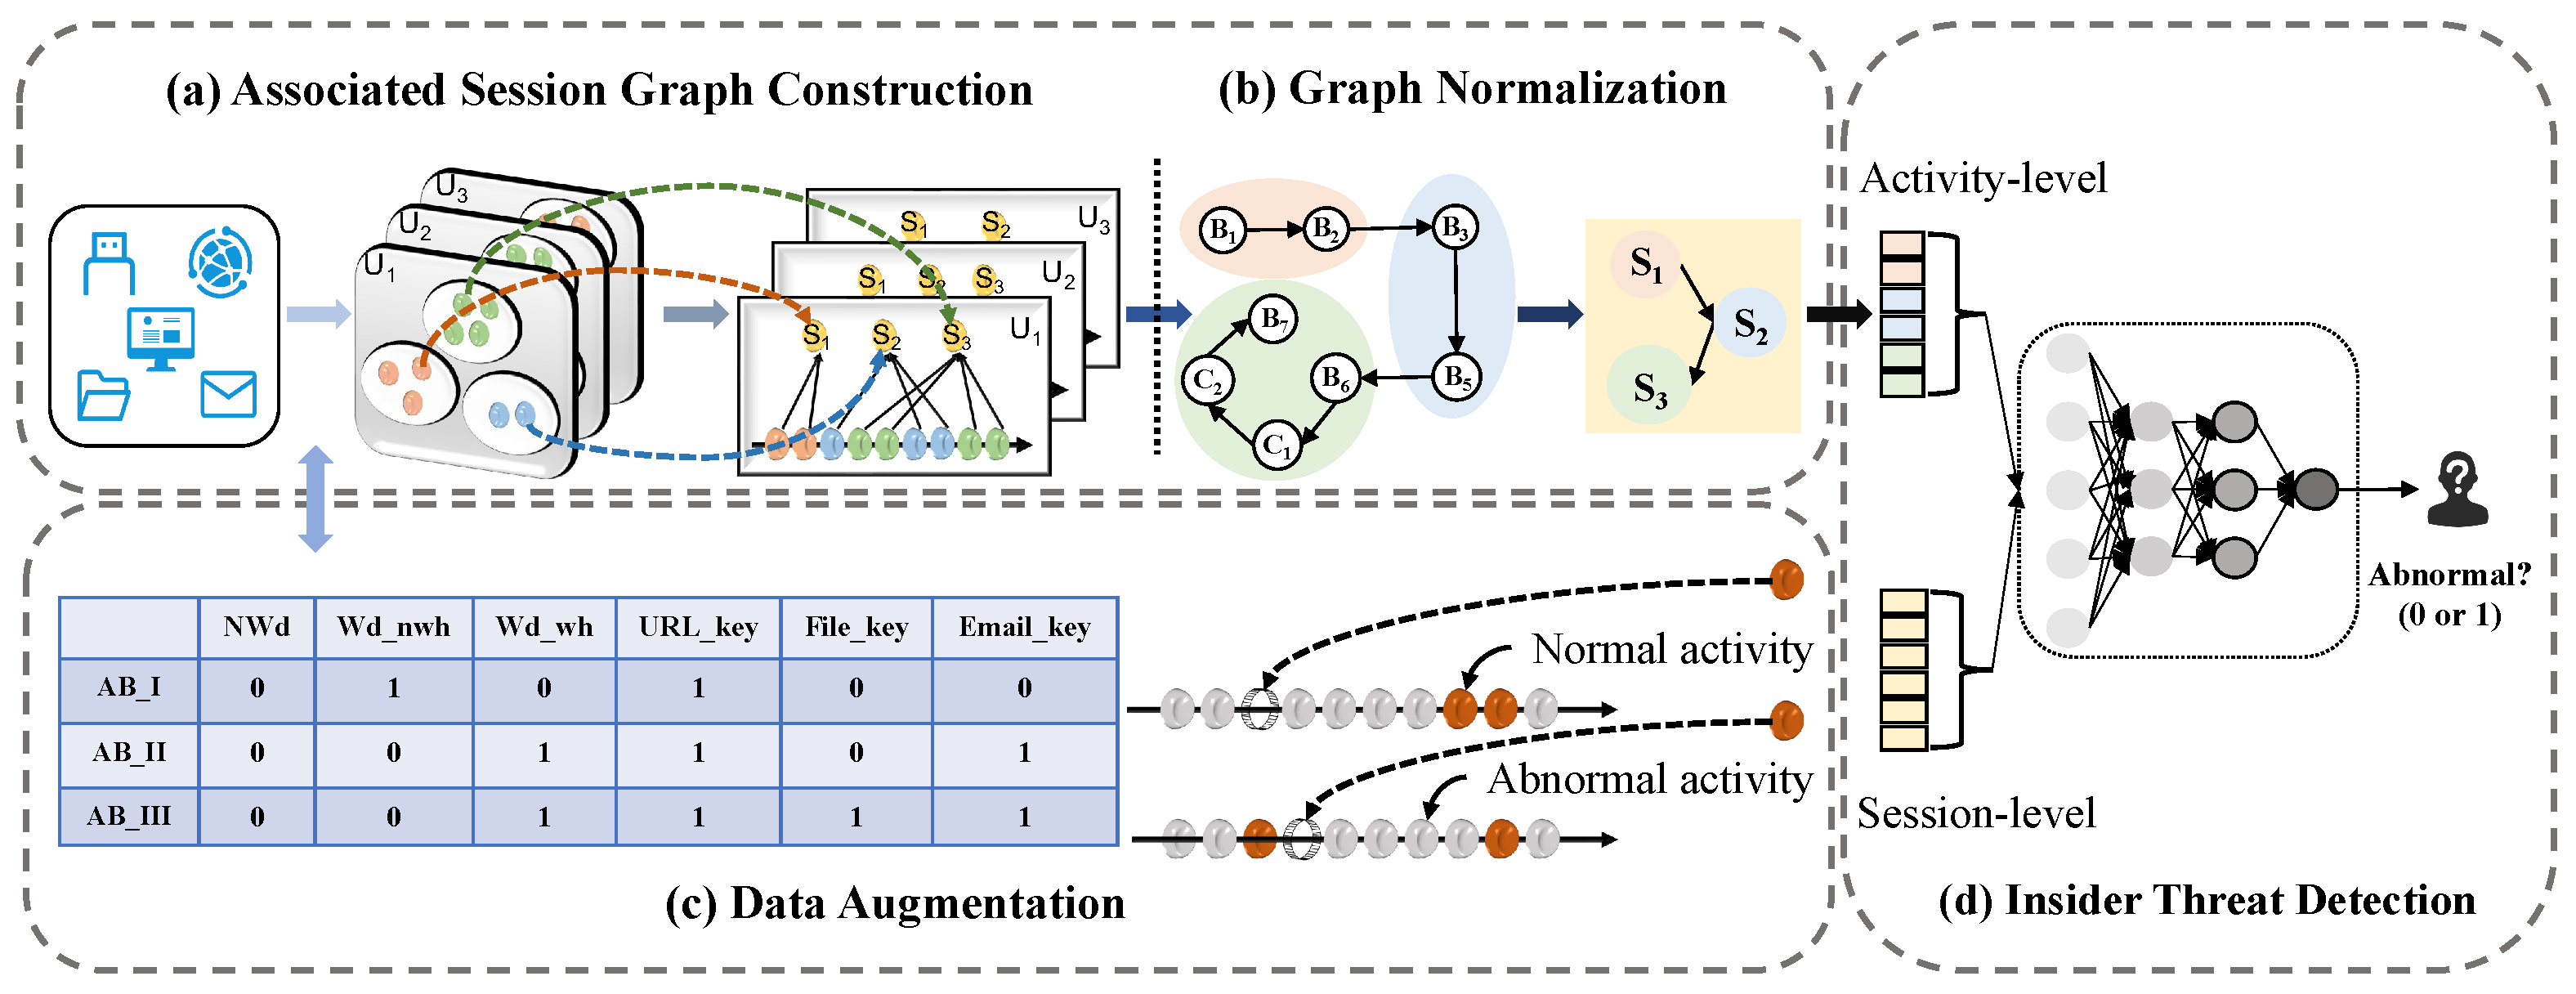
  • An associated session graph-based insider threat detection approach is proposed to enhance the performance of graph-based models.
  • To construct the associated session graph, seven heuristic rules are defined and fine-grained user behavior features from both intra-session and inter-session activities are extracted to model user behavior.
  • To further enhance the performance of the insider threat detection model based on the associated session graph, graph normalization and data augmentation are introduced to highlight key nodes of the associated session graph and mitigate the imbalance of anomalous samples.
  • Extensive experiments show that ASG-ITD effectively identifies three types of anomalous behavior and achieves state-of-the-art performance in insider threat detection that integrates multi-source heterogeneous behavioral data. We have also made our code publicly available at https://github.com/JmeiDing/ASG-ITD (accessed on 7 December 2024).
The remainder of this paper is organized as follows: related works are reviewed in Section 2; Section 3 depicts the problem definition; Section 4 presents the proposed ASG-ITD in detail; we explain the experimental setup and evaluate ASG-ITD in Section 5 by implementing a series of tests on the CERT Insider Threat Dataset [13]; finally, our conclusion and future work are presented in Section 6.

2. Related Work

2.1. Insider Threat Detection

Upon scrutinizing the existing methods, the current literature on insider threat detection based on behavioral analysis can be generally categorized into two types. The first category comprises rule-based methods [3,7,10], which utilize known malicious activity features to establish a feature library or model. When the activity to be detected matches the stored feature library or model, it is identified as a malicious insider or insider threat. Yen et al. [3] proposed an improved rule-based security event detection method that extracts knowledge from large volumes of noisy log data to identify suspicious host behaviors. Eldardiry et al. [7] utilized a Markov model to identify anomalous changes in behavior as they occur over time. The second category consists of anomaly-based methods [5,14,15]. In this approach, a baseline of normal behavior is first established, and the anomalies learned from this baseline are marked as such. Subsequently, the method identifies whether the samples under examination exhibit normal or anomalous behavior. For instance, Le et al. [15] employed machine learning models to detect insider threats based on a certain type of insider malicious behavior or anomaly detection system scores. Zhang et al. [9] modeled log events into a sequence that records the execution flow of a particular task and feeds it into an attention-based Bi-LSTM model to identify abnormal behavior. However, these studies primarily focused on modeling individual sequential behaviors, overlooking the complex dependencies and relationships between activities.

2.2. Graph-Based Anomaly Detection

Given the strong representational capability of graphs [16,17,18,19], recent efforts have leveraged graph methods for anomaly detection [12,20,21]. The main difference between graph-based anomaly detection methods and other anomaly detection approaches lies in feature extraction. Due to the potential relationships among behavioral data from different sources, graph structure modeling not only extracts conventional features but also captures the unique dependencies of nodes or edges within the graph. For example, Zeng et al. [20] constructed a log-based knowledge graph, then used an embedding model to infer log semantics to help understand behaviors. Wang et al. [21] proposed a graph-based behavioral anomaly detection method that improves the behavioral model by utilizing the attribute information of each behavior. Zhang et al. proposed a spectral-based directed graph method [22] and a dynamic evolving graph convolutional network [23] for malware detection, demonstrating the strong potential of graph-based approaches to capture temporal and semantic relationships within complex datasets. However, most current studies only convert user behavior into sequences or graphs within fixed time windows, lacking session-level behavioral analysis and the extraction of more fine-grained features.

3. Problem Definition
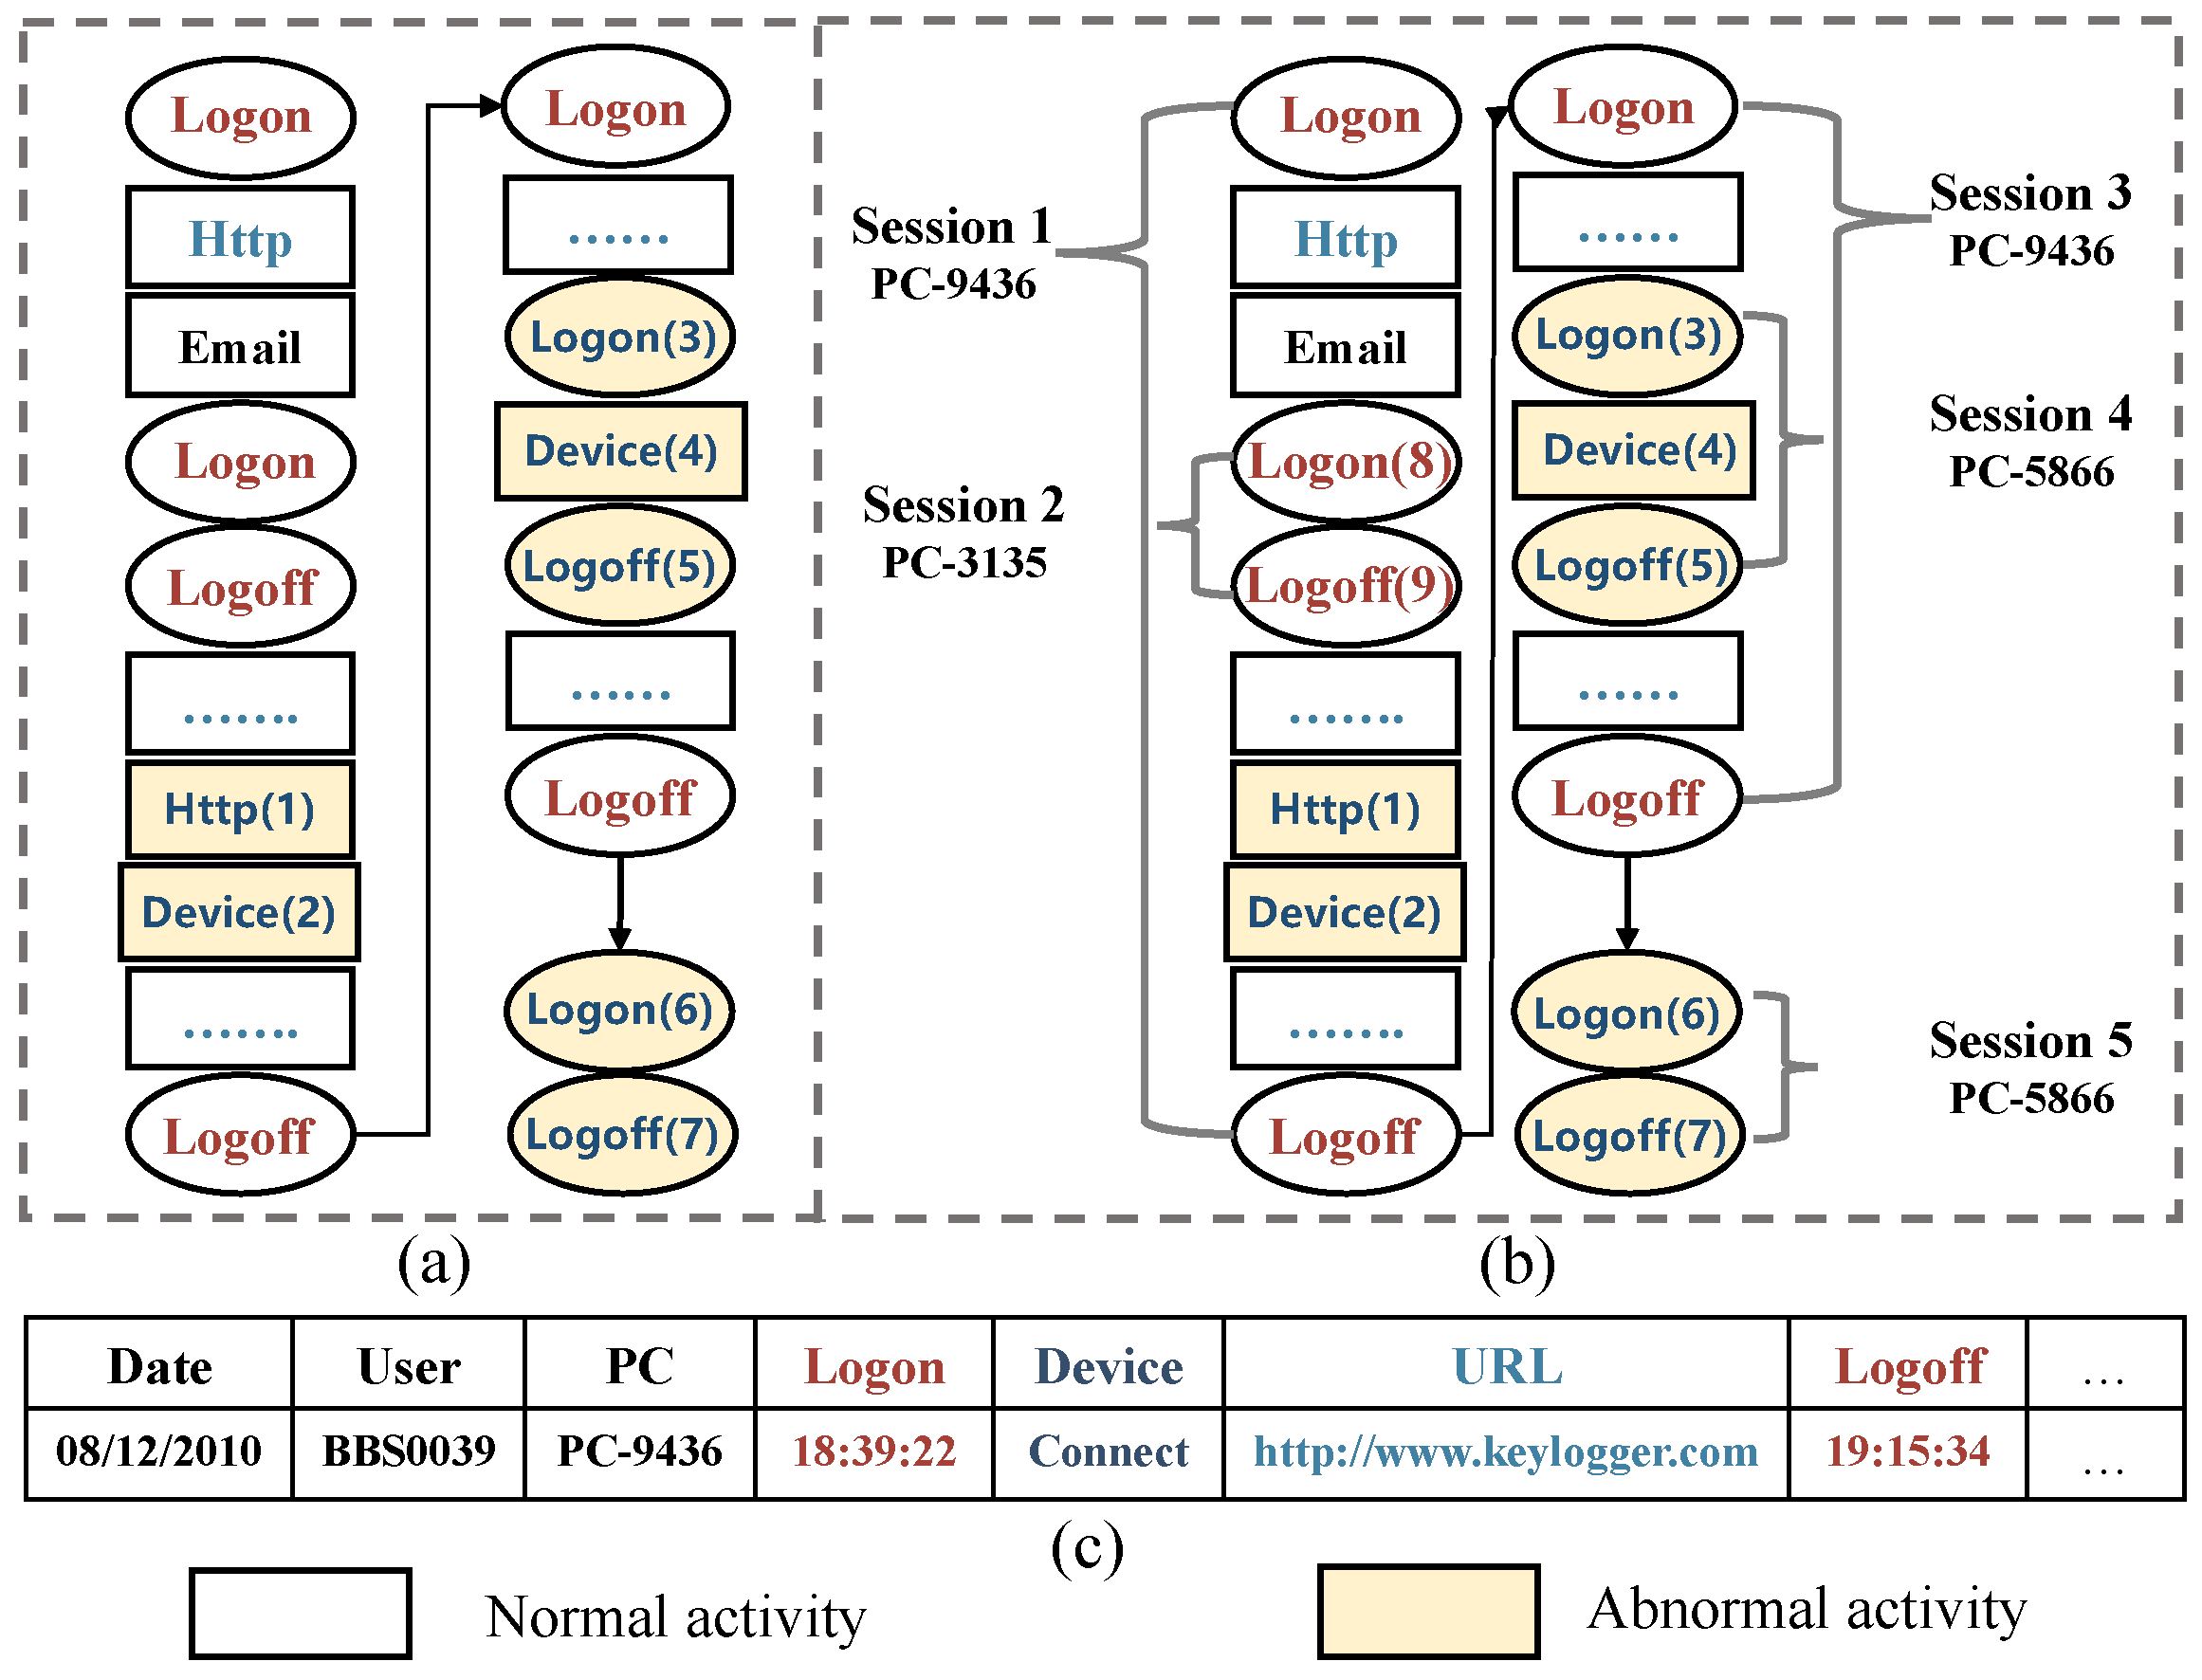
This section defines a user session, formulates the insider threat detection problem, and explains three different kinds of abnormal behavior.

3.1. User Session

User sessions consist of a series of activities that serve as the fundamental unit for describing different behavior patterns, encompassing the entire process from login to logout and the various activities performed during this period [6,11], with different user sessions having varying durations. Formally, a user session is represented as S i = A i 1 ,   A i 2 ,   ,   A i m , where A i m represents the m-th user activity in session S i and m stands for the number of user activities appearing in session S i .
Specifically, each activity A i m has a unique identifier (i.e., variable name), which is denoted as A i m i d . We use A i m 0 = 0 to represent a user performing logon activity in session S i , and A i m 0 = 1 to represent a user performing logoff activity in session S i . In addition, we define other activity representations A i m 1 = 1, A i m 2 = 2, A i m 3 = 3, A i m 4 = 4 to represent a user performing http, email, file, and device activity in session S i , respectively. Specifically, the value of A i m n from 0 to 4 provides explicit representations of different activity types (logon, logoff, HTTP, email, file, device), ensuring consistent integration into graph construction processes and enhancing compatibility with graph-based algorithms.

3.2. Insider Threat

Given user behavioral data S = S 1 ,   S 2 ,   ,   S | S | , where | S | is the number of the user sessions and each user session contains multiple activities, e.g., logon, email, and file, we aim to develop a fully automated method that can extract behavioral features and determine the behavior type. The user’s activity is denoted as A i m = a i m 1 ,   a i m 2 ,   ,   a i m n | T , where a i m n is the n-th feature of A i m and T represents the user activity occurrence time. Our goal is to estimate the label y ^ for user behavioral data S, where y ^ = 1 represents S being a specific abnormal behavior and y ^ = 0 indicates that S is normal. The three categories of abnormal behavior described in the insider threat test dataset [13] are listed below:
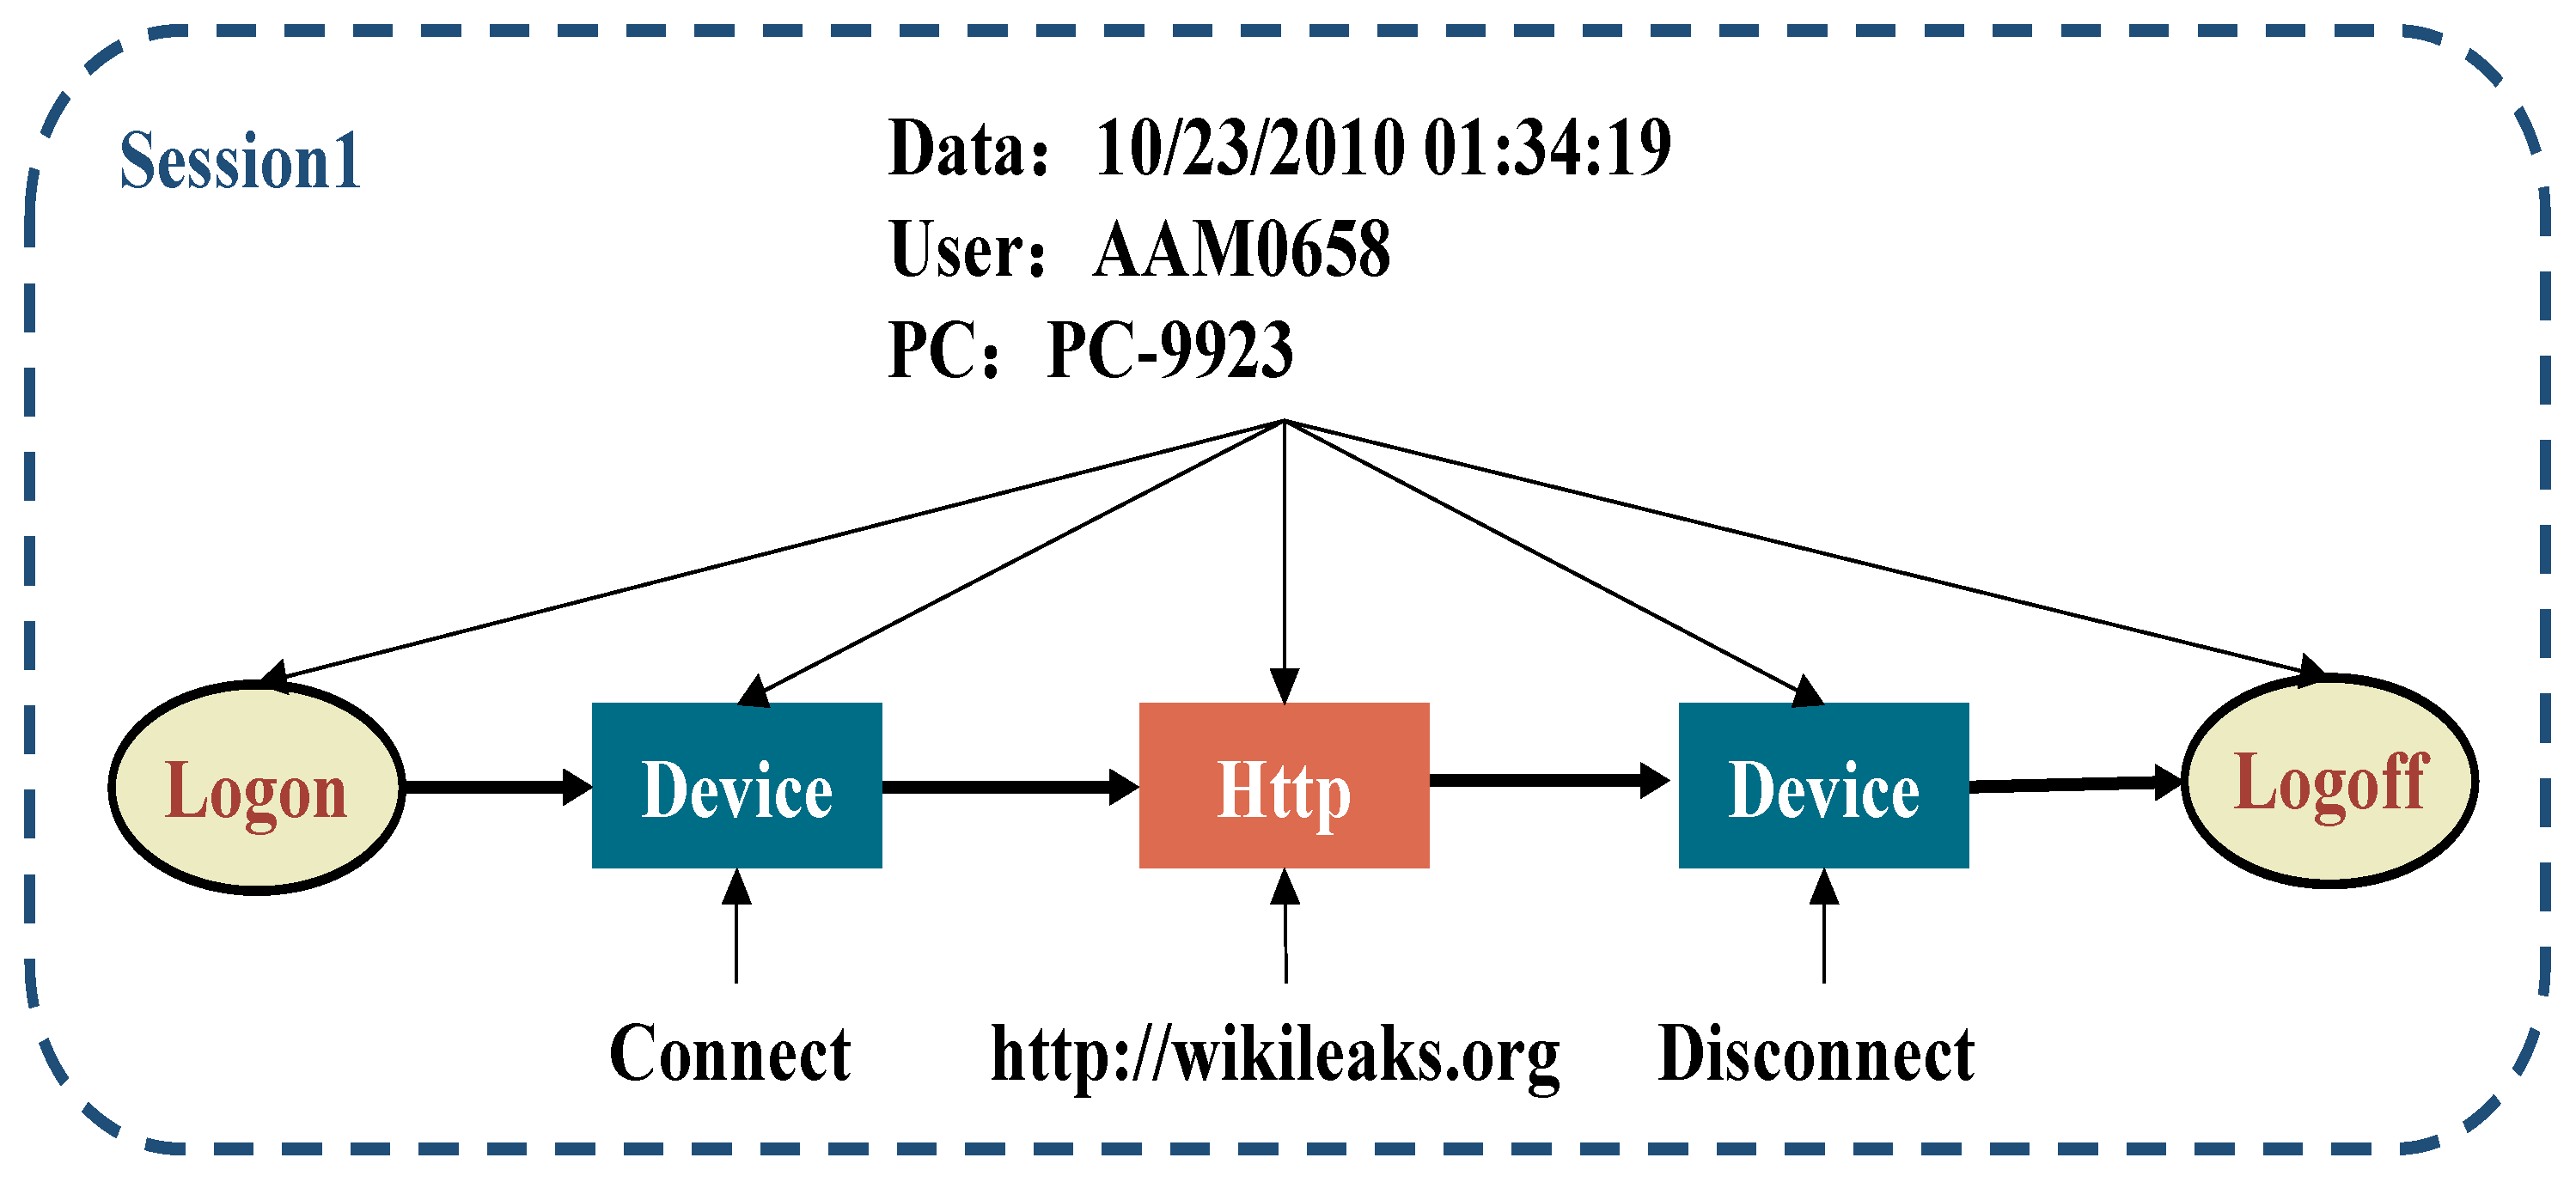
  • Abnormal Behavior-I (AB-I): A user who previously did not use removable drives or who did not work at off-hour times suddenly logs on during off-hour time and uses a removable drive to upload files to a suspicious domain (i.e., wikileaks.org). After that, the user leaves the organization within the next few days.
  • Abnormal Behavior-II (AB-II): A user suddenly starts visiting job sites and looking for a job that the user has never done before; after a few days, the user leaves the company and uses a thumb drive to steal data (accessing data at a rate significantly higher than during previous activity).
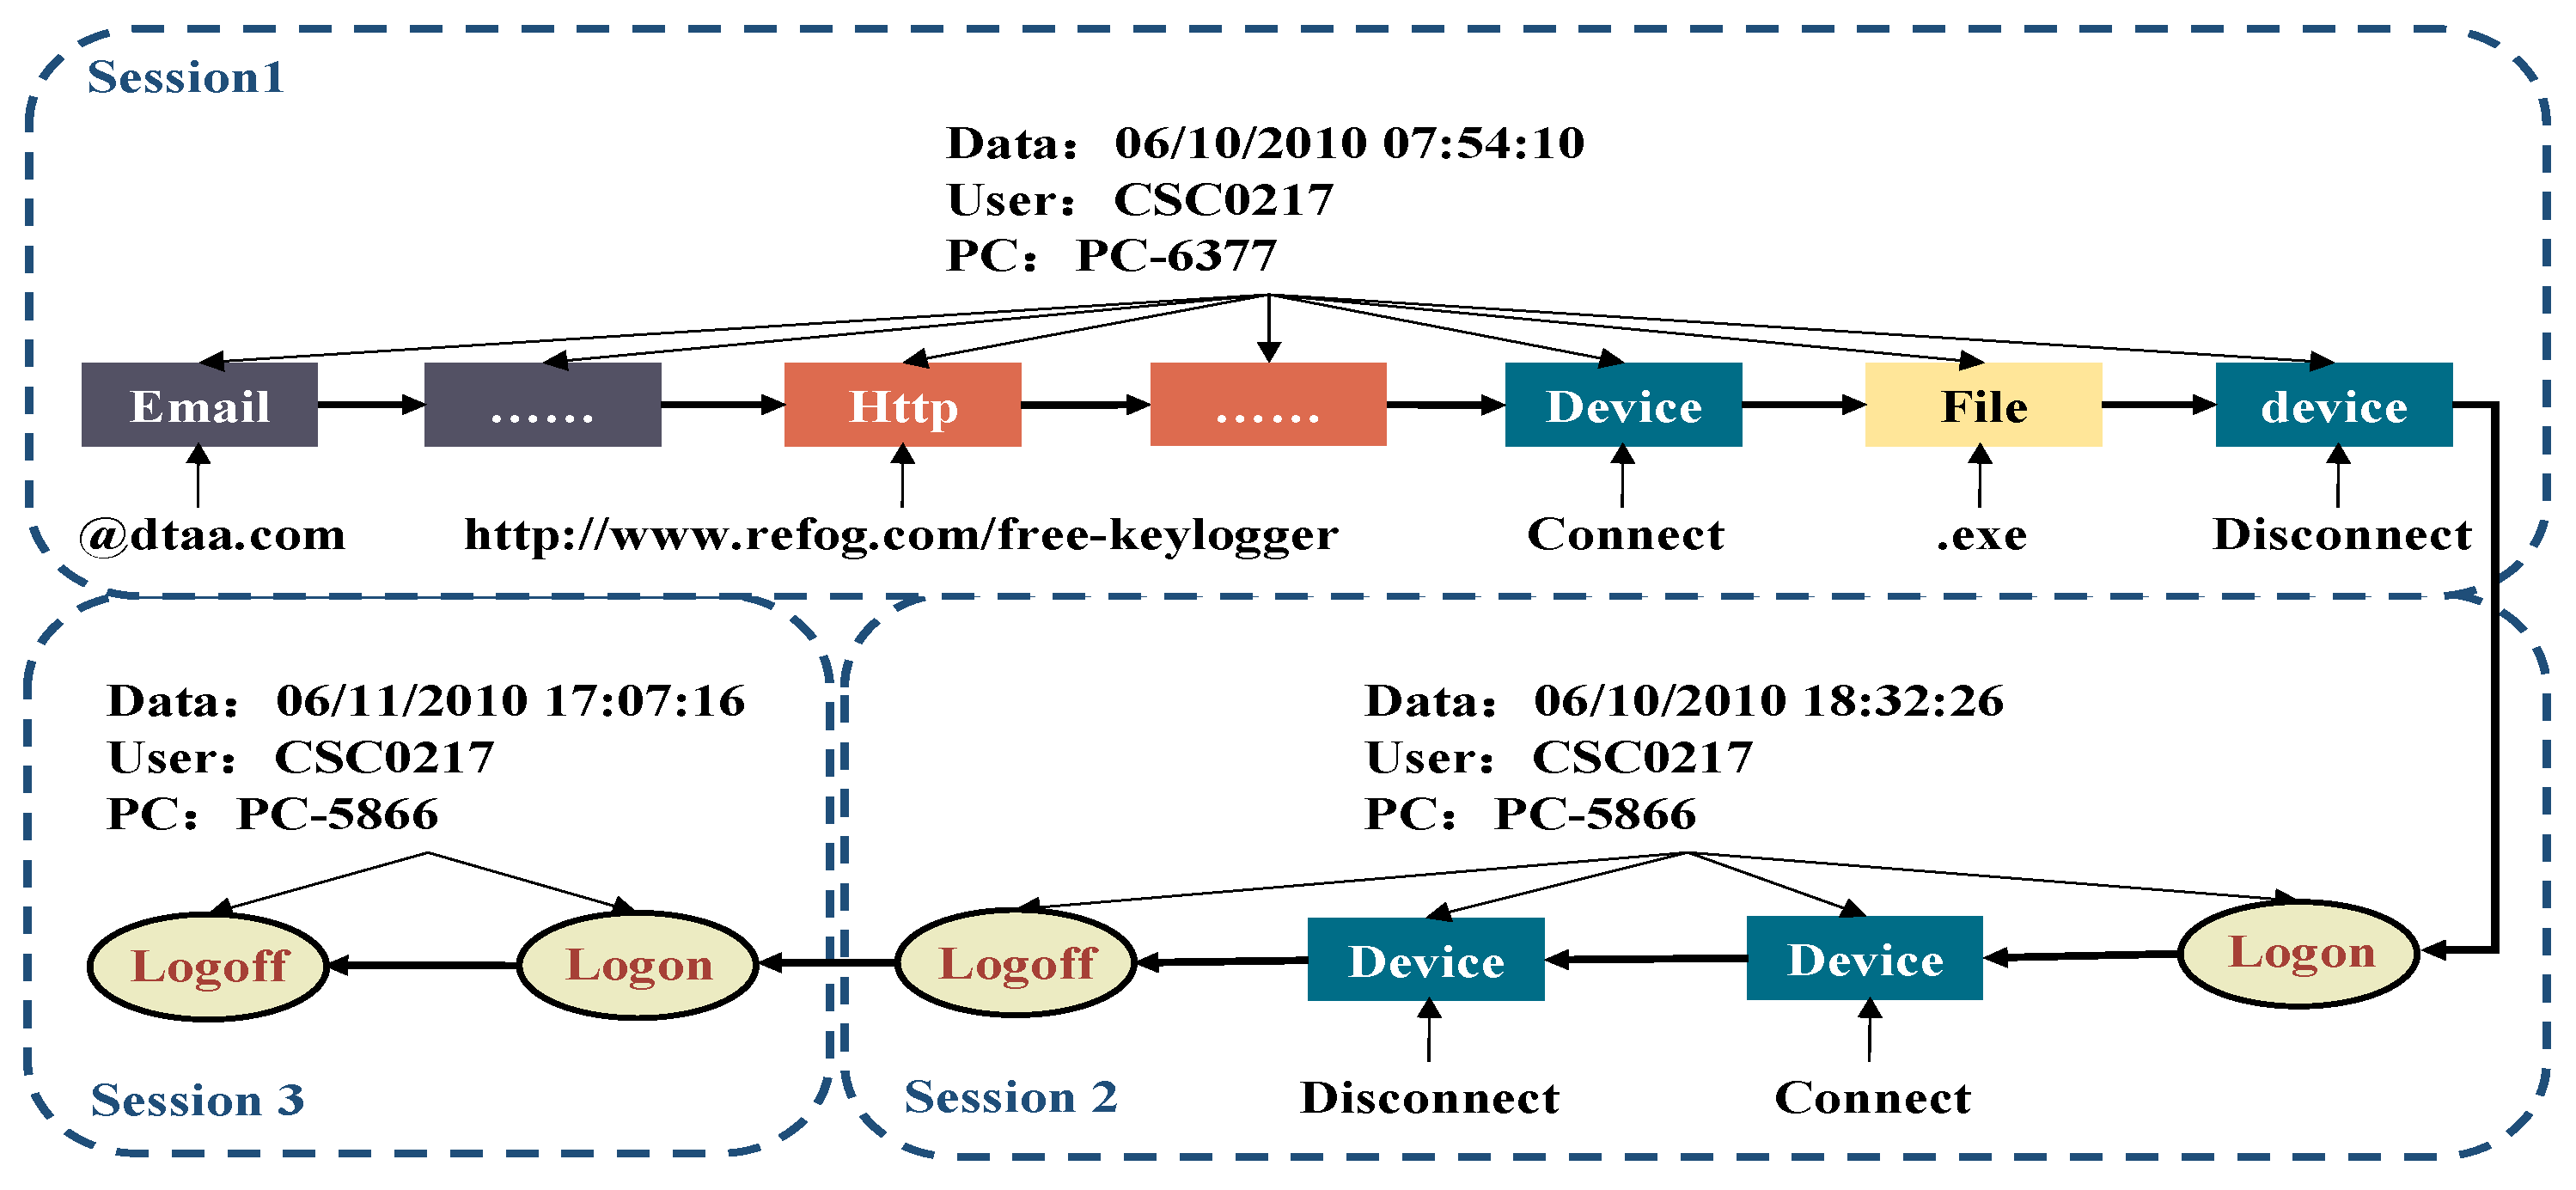
  • Abnormal Behavior-III (AB-III): A system administrator who has access to a variety of assets and resources downloads a keylogger and uses a thumb drive to transfer the keyboard logger to a supervisor’s machine. The malicious administrator uses the collected keystroke logs to steal the password of the supervisor’s system, then leaves the organization.

4. Method

The overall architecture of our proposed ASG-ITD approach is depicted in Figure 2. The approach consists of four stages: (1) associated session graph construction, which transforms user activities into an associated session graph by integrating multiple sessions and extracting fine-grained features at both intra-session and inter-session levels; (2) graph normalization, which introduces a node elimination technique to normalize the graph representation by deleting and merging nodes; (3) data augmentation, which generates additional anomalous samples to address data imbalance; and (4) insider threat detection, which utilizes a graph neural network to extract features from the normalized graph and outputs the anomaly detection results. In what follows, we elaborate the details of these four components.

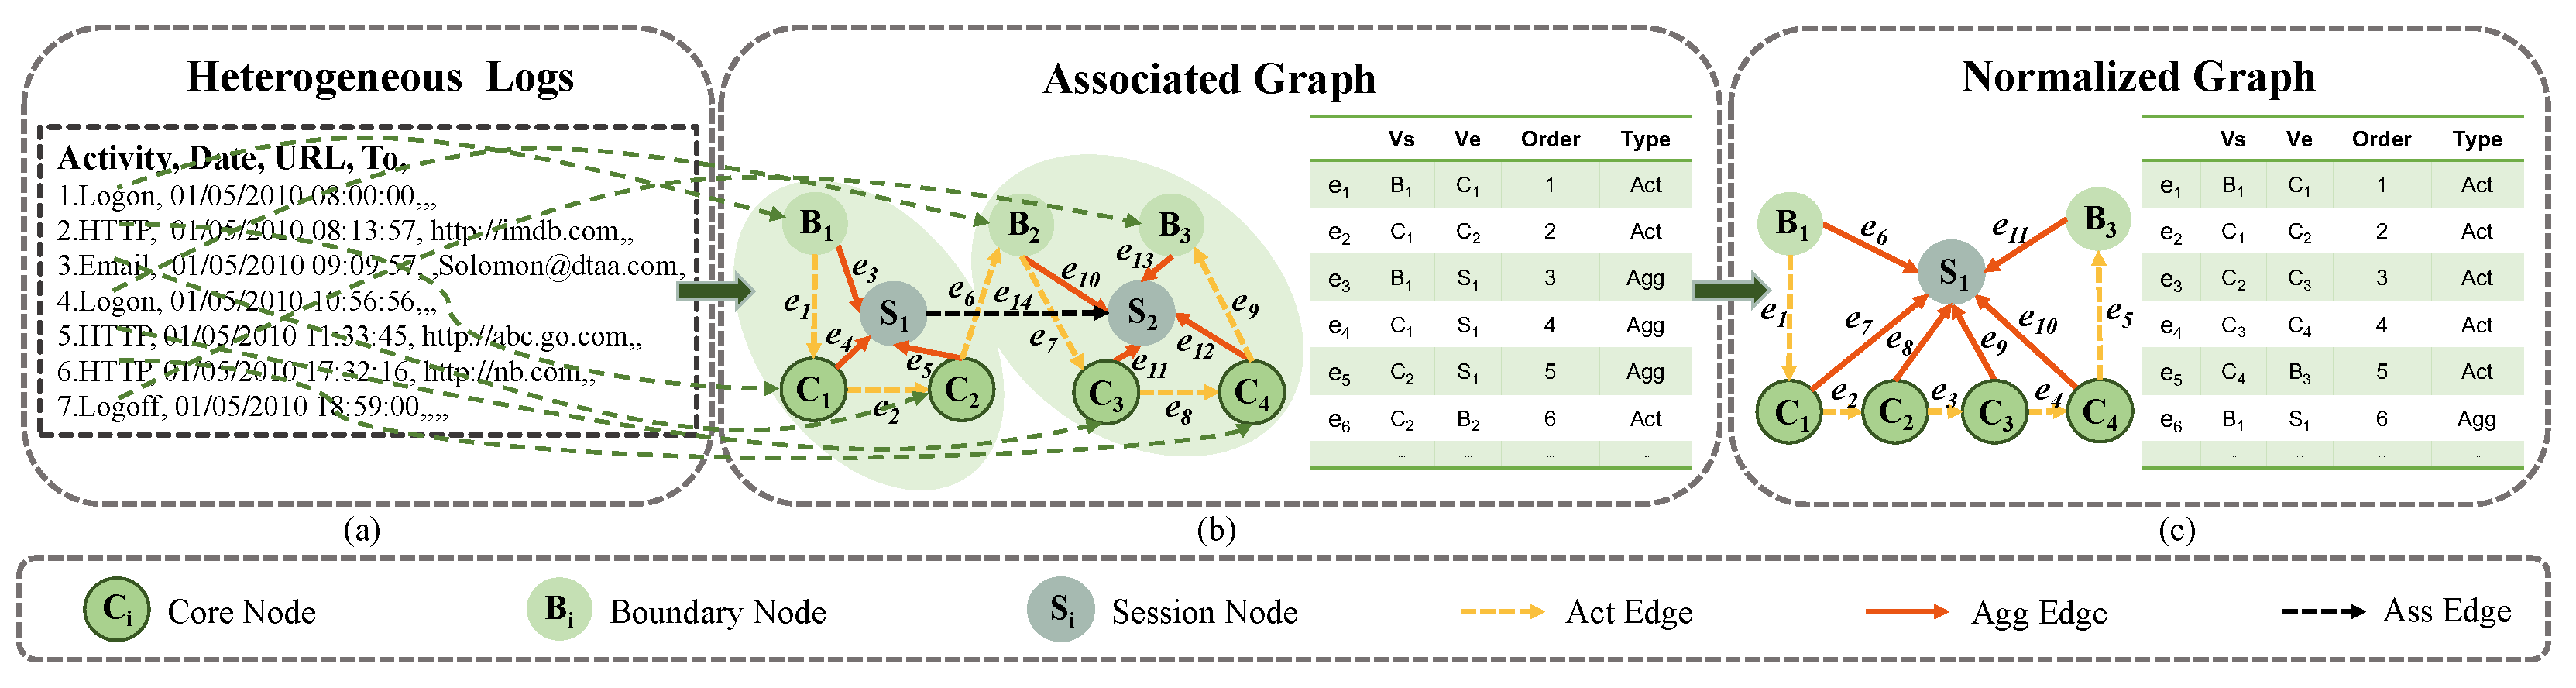
4.1. Associated Session Graph Construction

Existing studies [12,24] indicate that user behavior data can be modeled as symbolic graph representations while preserving the semantic relationships between user activities (e.g., activity dependencies). Inspired by this, we use behavior analysis to define seven heuristic graph construction rules in order to construct an associated session graph for modeling user behavior. Below, we introduce the process of constructing the session graph.

4.1.1. Activity Nodes Construction

To highlight the differences among various activities in user sessions, two categories of activity nodes are defined: core nodes and boundary nodes.
Core Nodes signify key activities that are critical to detect abnormal behaviors, e.g., visiting suspicious websites or sending external emails. Formally, the critical activities are defined as core nodes C 1 , C 2 , …, C n .
Boundary Nodes are used to model the beginning and end of a user session; specifically, logon and logoff activities are extracted as boundary nodes, and appear in pairs. Formally, boundary nodes are denoted by B 1 ,   B 2 ,   ,   B n .

4.1.2. Activity Edges Construction

To capture the rich temporal relationships and semantic dependencies between nodes, we observe distinct temporal patterns in user behavior during abnormal activities, such as logging in outside of typical hours. To model this pattern, we design an activity-level chronological order rule to represent the execution sequence of activities and use this rule to construct activity edges. Each edge describes the behavioral path within a monitored user session, with sequence numbers indicating their positions within the session.
Rule 1.
Activity-Level Chronological Order, Intra-Session. Given all activities in a user session  S i = A i 1 ,   A i 2 ,   ,   A i m  and the occurrence time of activities  T = T 1 ,   T 2 ,   ,   T m , if  T 1 T 2 , then we say that  A i 1 = 1 ,  A i 2 = 2 ; similarly, if  T 1 T 2 T m , then we define  A i 1 = 1 ,   A i 2 = 2 ,   ,   A i m = m  to characterize the sequence number, where 1 indicates the earliest time in the session and m indicates the latest time. We say that the activity sequence  A i 1 ,   A i 2 ,   ,   A i m  is ordered by time.
Activity Edges are constructed by directing from the previous node to the next neighboring node in the activity sequence, as defined by Rule 1, which captures the semantic relationship of behavior flow between adjacent nodes and preserves the inherent behavioral logic of the sequence. These edges are depicted as horizontal arrows in Figure 3.

4.1.3. Node and Edge Features in Session Graph

To distinguish different nodes, two activity-level behavior feature extraction rules are designed based on a detailed analysis of abnormal behavior in insider threat scenarios.
Logon Pattern Analysis. It is common for usersto logon during regular hours, such as 8:00 AM or 9:00 AM, while logons during off-hour times may be anomalous. We visualize all abnormal activities associated with AB-I in a user session in Figure 3, where the user logs in before dawn, which is usually considered to be non-working hours.
Formally, a logon activity is defined as a tuple u i ,   A i ,   F ,   t ,   p containing five attributes, where A i = 1 represents that the logon is activated, F denotes the collection of logon activity features, u i is the user name, t stands for the occurrence time of the logon activity, and p indicates the PC number used by the user. In addition, based on the organization’s work schedule, 8:00 AM to 5:00 PM is defined as normal working hours and Monday to Friday are considered regular working days. We then design the following logon feature extraction rule to distinguish between login behaviors during working and non-working hours.
Rule 2.
Activity-Level Logon feature Extraction. Given a logon activity  u i ,   A i ,   F ,   t ,   p , where  A i = 1 ,   f 1 ,   f 2 ,   f 3 ,   F , we say that  f 1 = 0  and  f 2 = 1  if the execution time t of logon is during normal working hours; otherwise,  f 1 = 1  and  f 2 = 0 . Further, we say that  f 3 = 0  if the execution time t of logon is during normal working days; otherwise,  f 3 = 1 .
Contextual Pattern Analysis. User activities typically originate from multiple heterogeneous logs, resulting in varied attributes for different activities. The content attribute, an essential source of information in user behavior analysis alongside the time attribute, reveals user activity patterns in greater detail. If the content attribute of an activity contains keywords associated with abnormal behavior, it is likely to indicate an anomaly. For example, in the definition of AB-I, a URL with suspicious keywords, such as http://wikileaks.org (accessed on 7 December 2024), is classified as malicious activity. Similarly, in AB-II of Figure 4, URLs associated with job sites, such as http://hp.com (accessed on 7 December 2024), may also be flagged as abnormal. Contextual analysis significantly improves the extraction of meaningful features through keyword matching. Consequently, we blacklist keywords based on identified abnormal behaviors [25,26] and establish corresponding rules for abnormal keyword extraction in user activities.
Rule 3.
Activity-Level Keyword Feature Extraction. Given a keyword k extracted from the content information of a user activity  u i ,   A i i d ,   F ,   t ,   p , where  i d = 1 ,   2 ,   3 ,   4  represents http, email, file, and device activity, respectively, we say that the keyword k is a malicious keyword and that  f n = 1 F  if k K , where  K  is the blacklist of malicious keywords defined by specific abnormal behavior patterns and n is the type of the keyword extracted from a specific activity.
More specifically: (a) the feature of an activity node consists of I D ,   F ,   T y p e , where ID denotes its identifier, F is a collection of the node features extracted based on Rule 2 and Rule 3, and Type stands for the node type; and (b) the feature of an activity edge is extracted as a tuple V s t a r t ,   V e n d ,   O r d e r ,   T y p e , where V s t a r t and V e n d represent its start node and end node, respectively, Order denotes its temporal order extracted based on Rule 1, and Type stands for the edge type.

4.1.4. Session Node Construction

Considering that the behavior flows of insider threat attacks may originate from multiple user sessions and that the relationships between different sessions are nonlinear, as shown in Figure 4 and Figure 5, an associated session graph is constructed by connecting activity sequences across different hosts and sessions. The construction process is detailed in Algorithm 1, which also introduces a new type of node, termed session nodes, to represent the semantic dependencies between multiple user sessions.
Algorithm 1:  Associated Graph Construction
Electronics 13 04885 i001
Session Nodes. Unlike core nodes and boundary nodes, session nodes are considered as a kind of virtual nodes to aggregate all nodes within a session and associate all session graphs. The number of session nodes is equal to the number of user sessions. Formally, the session nodes are denoted as S 1 ,   S 2 ,   ,   S n .
Figure 6 illustrates the overall process of constructing the associated session graph. In Figure 6a,b, the Logon activity is first represented as a boundary node ( B 1 ), marking the beginning of the user session. Following the temporal order of the activity sequence, we classify the critical activities HTTP and Email as core nodes ( C 1 and C 2 respectively), while an additional node ( S 1 ) is designated as a session node.

4.1.5. Construction of Session Edges

To enhance intra-session and inter-session feature extraction, we define two types of session edges: aggregation edges and association edges.
Aggregation Edges. To distinguish activities within different user sessions and preserve their semantic features, we construct aggregation edges by connecting all activity nodes and session nodes within user sessions. This approach prevents disruptions to the current session’s semantic relationships which could arise from prioritizing nodes from other sessions. Specifically, we define “multiple actions performed by a user within the same session” as a key behavior; aggregation edges connect these action nodes to help identify the continuity of user behavior and potential attack patterns. Next, we define the construction rules for aggregation edges to extract the semantic features of activities within the user session; the red arrows in Figure 6b represent aggregation edges.
Rule 4.
Aggregation Edge Construction. Given an activity sequence  S i = A i 1 ,   A i 2 ,   ,   A i M  appearing in the i-th session and session nodes  S = S 1 ,   S 2 ,   ,   S N  from different sessions, we define the aggregation edge as  e a g g i j = ( v i ,   v j ) = ( A i j ,   S i ) E a g g i , where the edge  e a g g i j  directs from the activity node  A i j  to the session node  S i .
Association Edges. To further extract the temporal and semantic relationships between sessions, we sort the sessions based on the chronological order of user activities. Insider threat behaviors often unfold in stages, with attackers potentially executing malicious actions across multiple sessions; therefore, correctly sorting and processing these sessions in temporal order is crucial for accurately detecting anomalous behaviors. To achieve this, a session-level priority order rule (Rule 5) is designed to sort multiple aggregated session graphs.
Rule 5.
Session-Level Priority Order. Given a set of session graphs  G S = G S 1 ,   G S 2 ,   ,   G S N , where the extraction time of the first boundary node in a session graph is  T = T 1 ,   T 2 ,   ,   T N  and the set of session nodes  S = S 1 ,   S 2 ,   ,   S N  can be used to record session graph priorities, we say that  G S i  has higher priority and that  S i = 1 ,  S j = 2  if  T i T j ; similarly, if  T 1 T 2 T N , then we say that  S 1 = 1 ,   S i = i ,   ,   S N = N , where 1 represents the highest priority and N denotes the lowest.
To link activity nodes across different sessions and enhance the extraction of cross-session behavioral features, we introduce association edges. Unlike behavioral edges, which capture sequential relationships within a single session, association edges are designed to connect nodes from different sessions, thereby constructing a comprehensive global view of user behavior. To achieve this, an association edge construction rule (Rule 6) is defined to connect these aggregated session graph sequences. These association edges, depicted by the black arrows in Figure 6b, denote connections starting from S 1 to S 2 .
Rule 6.
Association Edge Construction. Given a session graph sequence  G S 1 ,   G S 2 ,   ,   G S N , where  S = S 1 ,   S 2 ,   ,   S N  is session node sequence, we define an association edge as  e a s s i j = ( v i ,   v j ) = ( S i ,   S ( i + 1 ) ) E a s s i , where edge  e a s s i j  directs from the session node  S i  of the previous session graph to the session node  S ( i + 1 ) of the next session graph.

4.1.6. Node and Edge Features in the Associated Session Graph

To highlight the differences between abnormal and normal session node sequences, we calculate the total number of malicious activities within each user session and record the statistical features in the session nodes. Specifically, we design a statistical feature extraction rule (Rule 7) to capture the transmission characteristics of malicious activities within session sequences.
Rule 7.
Session-Level Statistical Feature Extraction. Given a set of user activities that appear in session i as  A = A i 1 ,   A i 2 ,   ,   A i M  and a set of session nodes  S = S 1 ,   S 2 ,   ,   S N , we can represent  | S i 1 |  and  | S i 2 |  as the respective sums of abnormal http and device activity in the i-th session.
More specifically: (a) the feature of session nodes is defined as a tuple S i ,   F ,   T y p e , where i denotes the identifier of the session, F is a collection of the session node features extracted based on Rule 5 and Rule 7, and Type stands for the node type; and (b) the feature of an edge consists of V s t a r t ,   V e n d ,   O r d e r ,   T y p e , where V s t a r t and V e n d represent its start and end nodes, Order denotes the session priority, and Type represents the edge type.

4.2. Graph Normalization

Given that most graph neural networks are inherently flat in information propagation and do not distinguish the importance of certain nodes [27], we propose a node elimination technique to normalize the associated session graph, thereby emphasizing key nodes in the graph structure. Specifically, we find that a small number of boundary nodes are not recorded, typically appearing between two consecutive normal user sessions on the same computer. To address this, the first boundary node of the second session is removed and the two sessions are merged to emphasize the importance of the first session node. For example, the boundary node B 2 in Figure 6b is removed, causing B 1 and B 3 to become the boundary node pair in the associated session graph, as shown in Figure 6c. Interestingly, the session node S 2 is also deleted and its neighbor nodes connect to the nearest session node S 1 , with the features of these neighbor nodes being transferred to S 1 , which enriches the feature representation of session node S 1 and further emphasizes its importance.
After eliminating some non-critical nodes, the features of the associated session graph are updated, as shown in Figure 6c. More specifically, the new feature is composed of two components: (1) the node features, that is, the feature of session node S i itself, and (2) the edge features, that is, those features having a path pointing from C i to S j or from B i to S j . Note that features of different removed nodes are respectively added when aggregating to the session node. Based on the associated session graph construction and normalization processes described above, we can obtain more fine-grained behavior features at the activity level, session level, and graph level.

4.3. Data Augmentation

To mitigate the impact of data imbalance on insider threat detection models, we propose a data augmentation technique that expands abnormal behavior data by generating high-quality synthetic samples following the original abnormal behavior patterns, as demonstrated in Algorithm 2.
Algorithm 2:  Data Augmentation
Electronics 13 04885 i002
For example, Figure 3 illustrates AB-I, where the user sequentially performs abnormal activities: logonconnect devicehttpdisconnect devicelogoff. In this sequence, http is flagged as suspicious because its url contains the abnormal keyword http://wikileaks.org, which is blacklisted according to Rule 3. We expand the anomalous data in three ways: (1) introducing normal email or file activities that are unrelated to the AB-I; (2) injecting benign http activities; and (3) inserting a sequence of connect devicedisconnect device. It is important to note that these activities are added between the logon and logoff actions on the same PC.

4.4. Insider Threat Detection

In this subsection, an anomaly detection model based on the associated session graph is developed for insider threat detection tasks. First, user behavior data are converted into an associated session graph using heuristic rules (Rule 1∼Rule 7). Then, a GCN model is employed to learn the graph representations. Finally, a label y ^ 0 ,   1 is generated to determine whether the user behavior is anomalous.
Behavior Feature Representation. First, the associated session graph is constructed based on seven defined rules, generating the adjacency matrix A and node attribute vector X. Then, A and X are used as inputs to the GCN, with individual behavior data categories as the output. Finally, the associated session graph is converted into a feature vector.
Graph Feature Learning. Formally, we denote the associated session graph as G = V ,   E , where V consists of core nodes, boundary nodes, and session nodes and E contains activity edges, aggregation edges, and association edges. The layer-wise propagation network of GCN is defined as:
X t ( l + 1 ) = θ D ˜ 1 / 2 A ˜ D ˜ 1 / 2 X t ( l ) Θ ( l )
where A ˜ = A + I N is the adjacency matrix of the directed graph G with additional self-connections, I N is the identity matrix, D ˜ = j A ˜ i ,   j is a degree matrix, Θ ( l ) R N × D is a trainable weight matrix in the l-th layer, and X 0 = X . θ · denotes an activation function, i.e., ReLU · = m a x 0 ,   · .
Abnormal Behavior Detection. The GCN passes the graph embedding X = { X 1 ,   X 2 ,   ,   X N } into a sigmoid layer. The process can be formulated as follows:
y ^ = s i g m o i d ( A ^ R e l u ( A ^ X Θ ( 0 ) ) Θ ( 1 ) )
where A ^ = D ˜ 1 / 2 A ˜ D ˜ 1 / 2 ,   Θ ( 0 ) R C × H is a weight matrix of a hidden layer with H feature maps, C is the number of input channels, Θ ( 1 ) R H × F is a hidden-to-output weight matrix used to assign different weights to different elements of the feature vector, and F is the number of feature maps. The nonlinear sigmoid layer produces the final estimated label y ^ 0 ,   1 indicating whether the user behavior under test is abnormal. We then use the supervised loss L s and graph Laplacian regularization loss L r e g to evaluate the error over all labeled examples. The loss function L is defined as follows:
L = L s + λ L r e g
L r e g = i ,   j A i ,   j f ( X i ) f ( X j ) 2 = f ( X ) Δ f ( X )
where λ is a weighting factor and Δ = D A denotes the un-normalized graph Laplacian of the graph G = V ,   E .

5. Evaluation

In this section, we describe the extensive experiments undertaken to assess the efficacy of our proposed method, aimoing to answer the following research questions:
  • RQ1: Can our proposed method effectively detect user abnormal behaviors? How does our approach perform in terms of different evaluation metrics compared to state-of-the-art detectors?
  • RQ2: How much do the individual components of our approach contribute to its performance gains in terms of anomalous behavior detection?
  • RQ3: What are the effects of different parameter settings of the graph model on the detection of user anomalies?
Below, we first present the experimental settings, then proceed to answer the aforementioned questions one-by-one.

5.1. Experimental Setup

Dataset. We evaluated our approach and the methods used for comparison on the CERT v4.2 insider threat test dataset [13], which contains more insider threat instances than other versions. Specifically, this dataset simulates a company with 1000 employees who generate 32,770,227 activity records (i.e., log events) over 17 months, in which 70 abnormal users and 6984 abnormal activities are injected by security experts under three different threat scenarios. The statistics of the dataset are listed in Table 1 and Table 2. In our experiments, we randomly took 80% of the dataset as the training set and used the remaining data as the test set.
Baseline Tools. To evaluate the effectiveness of our proposed ASG-ITD method, we compare it with six representative anomaly detection models: DBN-OCSVM [28], CNN [29], LSTM [30], LSTM-CNN [11], LSTM-Autoencoder(LSTM-AE) [31], and GCN. These comparative models can be divided into two categories, i.e., fixed-time and session-based approaches. Considering that the abnormal behavior data of AB II and AB III spans several days, we selected and extracted one week of behavior features for the fixed-time approach, while session-based methods were used to identify abnormal behaviors based on their characteristics.
Evaluation Metrics. To comprehensively assess our proposed framework, we adopted the widely used metrics of accuracy (ACC), precision (PR), recall (RE), F1-score (F1), true positive rate (TPR), false positive rate (FPR), and area under the curve (AUC). Due to the synonymous meanings of RE and TPR, we removed RE and employed only TPR.
Implementation. All experiments were performed on a computer equipped with an Intel(R) Xeon(R) CPU at 2.5 GHz and an NVIDIA (NVIDIA Corporation, Santa Clara, CA, USA) GeForce RTX 3080Ti GPU. Each module designed in our framework was implemented with the Python programming language, and the graph classification model was developed using the PyTorch framework.

5.2. Performance Comparison (Answering RQ1)

In this subsection, we benchmark our approach against existing behavioral anomaly detection methods to demonstrate its effectiveness.
Comparison with baselines in specific abnormal behavior identification. First, six of the most popular insider threat detection methods based on the fixed-time approach were evaluated on the CERT v4.2 dataset. Subsequently, we selected the best-performing model based on the highest metric score, which was GCN. Finally, a comparative analysis was conducted using the GCN model, which integrates intra-session and inter-session features based on the session approach. Specifically, G C N S refers to extracting features from each session based on Rule 1∼Rule 3 and using multiple session graphs as a comprehensive feature representation for insider threat detection. ASG-ITD integrates both intra-session and inter-session features according to Rule 1∼Rule 7 by associating G C N S . As shown in Table 3, ASG-ITD achieves state-of-the-art performance, highlighting the effectiveness of our proposed approach. In particular, G C N S achieves a higher TPR, indicating that the session graph model based on Rule 1∼Rule 3 can significantly enhance the detection capability for abnormal behaviors.
The above experiments demonstrate that our method significantly outperforms state-of-the-art abnormal behavior detection models. Specifically, our approach achieves 99% accuracy, surpassing baseline models that typically reach 50–95%. It also attains a 99% F1-score, indicating strong robustness in handling both false positives and false negatives, outperforming competing models. Moreover, our method reduces the FPR, which is crucial for minimizing unnecessary alerts in anomaly detection, especially in practical applications. Additionally, our method excels in detecting subtle malicious behaviors that many traditional models fail to identify, particularly when such behaviors are distributed across multiple sessions. This highlights the finding that integration of intra-session and inter-session features can capture more granular user behavior, thereby enhancing the model’s ability to detect various anomalous activities.
Comparison with baselines in binary anomaly behavior detection. To further evaluate the effectiveness of ASG-ITD, it is necessary to determine whether the identified user behavior is abnormal. The statistical experimental results of each method are shown in Table 4. Compared with other methods, ASG-ITD performs well in all evaluation metrics. Table 4 shows that the PR and F1 of [31] are much lower than ours, which is mainly due to the unbalanced dataset, with only 0.03% anomalous instances and 99.7% normal instances. Moreover, it is clear that existing methods have a high FPR, which may stem from two causes: first, several methods [15,28,31] only focus on numerical and categorical features from various log data, e.g., number of external emails received, number of web accesses during the weekend, user role, etc., while ignoring the relationship between user activities; second, other approaches [11,32] tend to apply temporal information in the data representation. This type of method uses deep learning, e.g., LSTM, to learn from past behavior and predict the next behavior. Obviously, this mainly captures sequential relationships between log data, while missing other relationships such as semantic relationships between sessions, interactive relationships between hosts, etc.

5.3. Ablation Study (Answering RQ2)

To assess the effectiveness of the components in ASG-ITD, an ablation study was conducted, with the results shown in Table 5. Specifically, a data enhancement strategy was introduced to augment anomalous samples in order to evaluate the contribution of each module to the performance of ASG-ITD. Additionally, the impact of eliminating specific nodes on the overall graph structure and ability of ASG-ITD to detect anomalies was investigated. Finally, fine-grained session feature analysis experiments were performed to evaluate their impact on the performance of our proposed ASG-ITD. The following experiments were conducted to study the contributions of these three modules.
Study of Data Enhancement Technique. To evaluate the effect of the proposed data enhancement technique, we analyzed the performance of ASG-ITD with and without it. The latter is named ITD-NDE, where NDE stands for without data enhancement. By default, both approaches adopt the defined associated graph construction phase to model user behavior. The quantitative results are summarized in Table 5, where all evaluation metrics are involved. It is apparent that the performance of ASG-ITD is significantly better than ITD-NDE; ASG-ITD achieves respective improvements of 77.27%, 76.20%, 75.03%, 75.03%, and 73.69% in terms of PR, F1, TPR, and AUC in AB-I, with all metrics being 0 in AB-II and AB-III except for ACC and AUC. The ACC of ITD-NDE exceeds that of ASG-ITD by 1.07% in AB-I, which is caused by the significant imbalance between the number of normal and abnormal samples in ITD-NDE, which highlights the necessity of incorporating data enhancement techniques to improve the performance of ASG-ITD.
Study of Node Elimination Approach. We further investigated the benefits of using node elimination methods. Specifically, we removed this approach in the association graph. This new variant was termed ITD-NNE. The comparison results are presented in Table 5. It can be clearly seen that the FPR of ITD-NNE is higher than ASG-ITD by 2.00% and 1.20% in AB-II and AB-III, respectively. In addition, we also compared ASG-ITD with machine learning methods using the eliminated nodes, including Decision Tree (DT), Random Forest (RF), MLP, KNN, and LSTM, with ASG-ITD achieving the highest performance across all evaluation metrics. This result suggests that the node elimination strategy improves the model’s ability to detect anomalous behaviors. By simplifying the network structure, the proposed strategy helps to identify critical nodes more effectively.
Study of Fine-Grained Associated Session Graph Features. To evaluate the performance of the fine-grained session graph features, we analyzed both intra-session and inter-session features to assess their impact on the proposed ASG-ITD. As shown in Table 5, both intra-session features and inter-session features clearly contribute to the final result. First, to assess the effectiveness of the inter-session features in ASG-ITD, we excluded them while extracting only intra-session features. We refer to the new variant as G C N I S , which stands for “only Intra-Session features”. It is apparent that ASG-ITD significantly outperforms G C N I S . The experimental results with inter-session features in ASG-ITD indicate a significant improvement in detecting abnormal behaviors. Second, we investigated the impact of intra-session features by comparing the performance of G C N I S with and without these features. The latter variant was denoted as G C N S , representing “only Session features”. G C N I S shows a substantial improvement over G C N S , indicating the effectiveness of intra-session features.

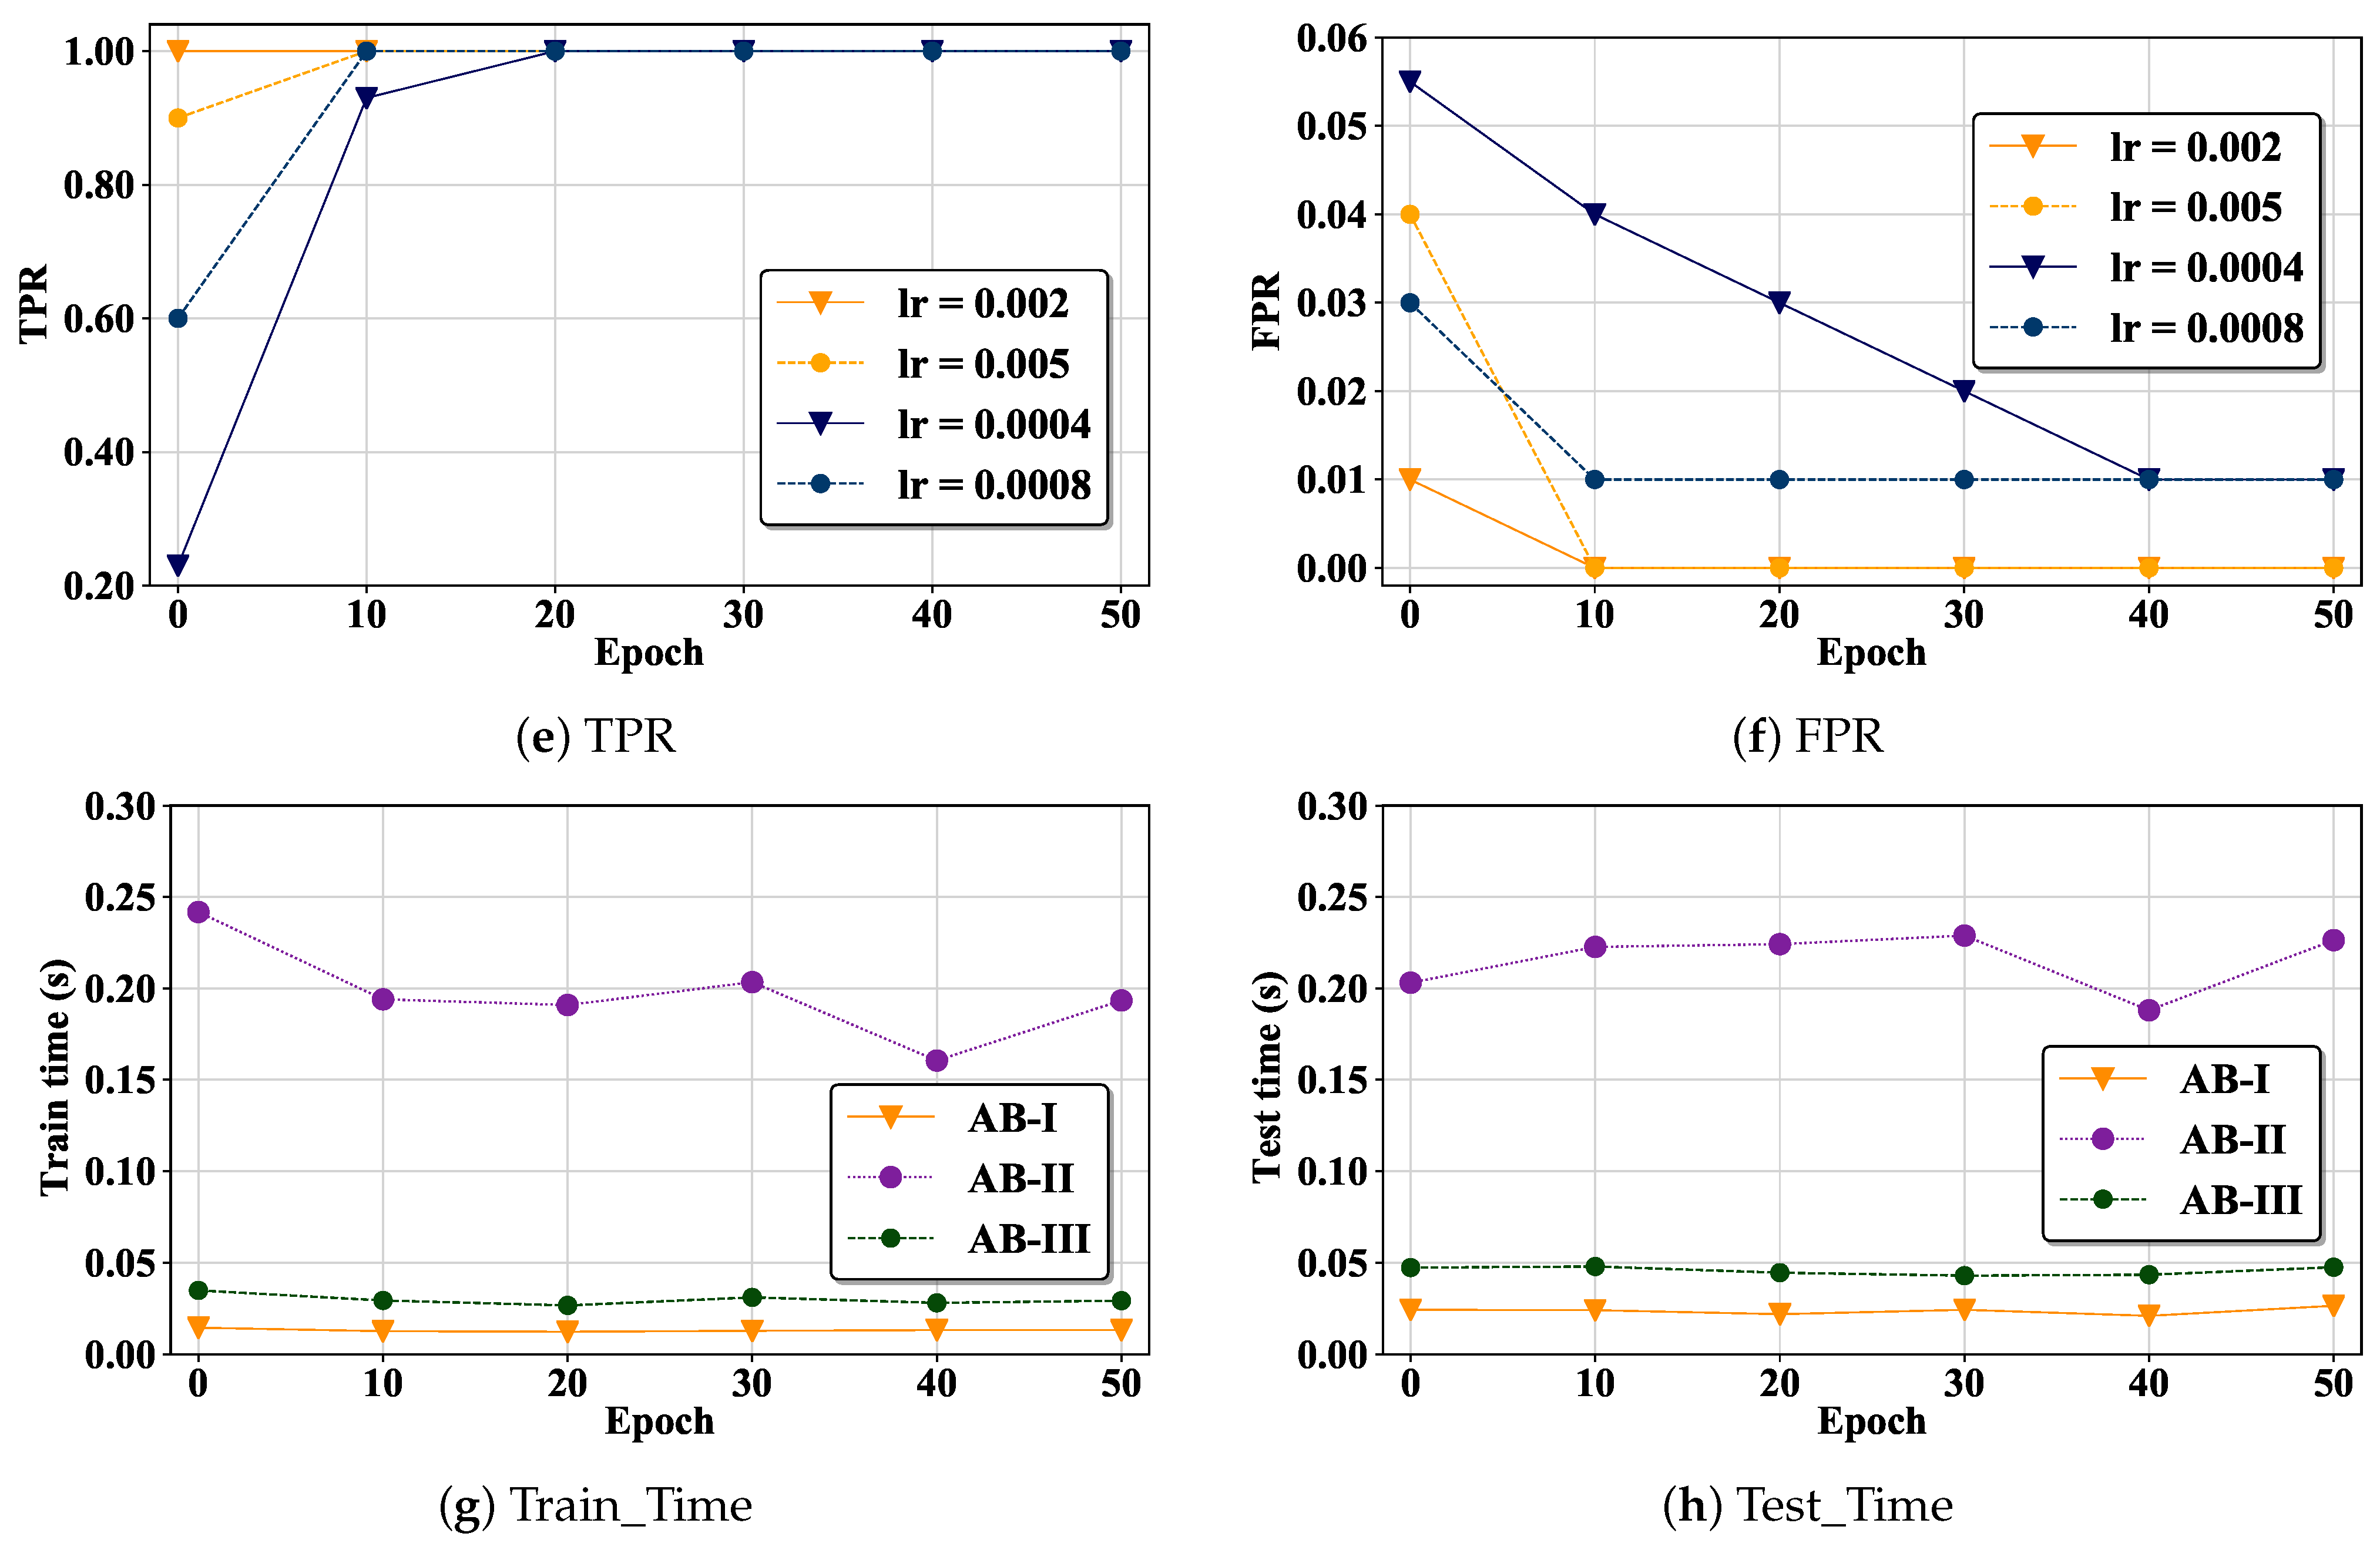
5.4. Parameter Sensitivity (Answering RQ3)

We systematically analyzed the effects of different parameters on ASG-ITD. We ran ASG-ITD on augmented anomalous datasets and selected five-fold cross-validation. In this subsection, we report the average results.
First, we studied the effects of key parameters on the results of ASG-ITD, with the results shown in Figure 7a–f. Due to space limitations, we only report the results in AB-III with a learning rate (lr) of 0.0004, 0.0008, 0.002, and 0.005, respectively, where the x-axis represents the number of epochs and the y-axis denotes the average evaluation statistics of the test cases. It can be observed that ASG-ITD with the learning rate set to 0.002 significantly outperforms the other learning rate values for the same epoch across all evaluation metrics.
Next, we conducted experiments to measure the runtime of ASG-ITD during training and testing by calculating the average execution time for three types of anomalous behavior, as shown in Figure 7g,h. Obviously, the execution time for AB-II is longer than that of AB-I and AB-III. The reasons for this are that, first, the training and testing times increase with the number of nodes and edges, and second, more behavior features result in longer run times. The relevant statistical information is shown in Table 1.

6. Conclusions

In this work, we have proposed a novel approach for insider threat detection. In contrast to existing approaches, we integrate multilevel and fine-grained session features into an associated session graph to effectively capture the rich dependencies between intra-session and inter-session activities. Additionally, we investigate the use of normalized graph neural networks to learn graph features from the associated session graph. Furthermore, we develop a data augmentation approach to address the challenge of unbalanced data when training deep learning models. Extensive experiments show that our method significantly outperforms state-of-the-art abnormal behavior detection models. Our study not only highlights the potential of session graph-based models in internal threat detection, but also opens possibilities for broader application scenarios. The proposed approach can be extended to other domains requiring anomaly detection, such as financial fraud detection, healthcare security, and blockchain environments. Future work will focus on validating the proposed ASG-ITD method on larger, more diverse, and more realistic datasets, expanding its application to other insider threat detection scenarios, and enhancing its ability to handle more complex anomalous behaviors. Additionally, efforts will be made to integrate real-time data and explore adaptive learning mechanisms to improve detection performance.

Author Contributions

Conceptualization, J.D. and J.M.; Methodology, J.D. and P.Q.; Writing—original draft, J.D.; Validation, J.D. and P.Q.; Writing—review & editing, Y.L.; Investigation, X.X.; Formal analysis, Z.W.; Visualization, Y.L. All authors have read and agreed to the published version of the manuscript.

Funding

This research was funded by the National Key R&D Program grant number 2022YFB3104900.

Data Availability Statement

Data is contained within the article.

Conflicts of Interest

The authors declare no conflicts of interest.

References

  1. Yuan, S.; Wu, X. Deep learning for insider threat detection: Review, challenges and opportunities. Comput. Secur. 2021, 104, 102221. [Google Scholar] [CrossRef]
  2. Omidi, L.; Moradi, G.; Salehi, V.; Khosravifar, M. A multi-criteria decision-making approach for prioritizing factors influencing healthcare workers’ safety performance: A case of a women’s hospital. J. Saf. Sustain. 2024, 1, 173–180. [Google Scholar] [CrossRef]
  3. Yen, T.F.; Oprea, A.; Onarlioglu, K.; Leetham, T.; Robertson, W.; Juels, A.; Kirda, E. Beehive: Large-scale log analysis for detecting suspicious activity in enterprise networks. In Proceedings of the 29th Annual Computer Security Applications Conference, New Orleans, LA, USA, 9–13 December 2013; pp. 199–208. [Google Scholar]
  4. Gurucul, T.R. 2023 Insider Threat Report. Available online: https://gurucul.com/2023-insider-threat-report{#}reportForm (accessed on 7 December 2024.).
  5. Parveen, P.; Thuraisingham, B. Unsupervised incremental sequence learning for insider threat detection. In Proceedings of the 2012 IEEE International Conference on Intelligence and Security Informatics, Washington, DC, USA, 11–14 June 2012; IEEE: Piscataway, NJ, USA, 2012; pp. 141–143. [Google Scholar]
  6. Glasser, J.; Lindauer, B. Bridging the gap: A pragmatic approach to generating insider threat data. In Proceedings of the 2013 IEEE Security and Privacy Workshops, San Francisco, CA, USA, 23–24 May 2013; IEEE: Piscataway, NJ, USA, 2013; pp. 98–104. [Google Scholar]
  7. Eldardiry, H.; Sricharan, K.; Liu, J.; Hanley, J.; Price, B.; Brdiczka, O.; Bart, E. Multi-source fusion for anomaly detection: Using across-domain and across-time peer-group consistency checks. J. Wirel. Mob. Netw. Ubiquitous Comput. Dependable Appl. 2014, 5, 39–58. [Google Scholar]
  8. Ressi, D.; Romanello, R.; Piazza, C.; Rossi, S. AI-enhanced blockchain technology: A review of advancements and opportunities. J. Netw. Comput. Appl. 2024, 225, 103858. [Google Scholar] [CrossRef]
  9. Zhang, X.; Xu, Y.; Lin, Q.; Qiao, B.; Zhang, H.; Dang, Y.; Xie, C.; Yang, X.; Cheng, Q.; Li, Z.; et al. Robust log-based anomaly detection on unstable log data. In Proceedings of the 2019 27th ACM Joint Meeting on European Software Engineering Conference and Symposium on the Foundations of Software Engineering, Tallinn, Estonia, 26–30 August 2019; pp. 807–817. [Google Scholar]
  10. Yaseen, Q.; Jararweh, Y.; Panda, B.; Althebyan, Q. An insider threat aware access control for cloud relational databases. Clust. Comput. 2017, 20, 2669–2685. [Google Scholar] [CrossRef]
  11. Yuan, F.; Cao, Y.; Shang, Y.; Liu, Y.; Tan, J.; Fang, B. Insider threat detection with deep neural network. In Proceedings of the Computational Science–ICCS 2018: 18th International Conference, Wuxi, China, 11–13 June 2018; Proceedings, Part I 18. Springer: Berlin/Heidelberg, Germany, 2018; pp. 43–54. [Google Scholar]
  12. Liu, F.; Wen, Y.; Zhang, D.; Jiang, X.; Xing, X.; Meng, D. Log2vec: A heterogeneous graph embedding based approach for detecting cyber threats within enterprise. In Proceedings of the 2019 ACM SIGSAC Conference on Computer and Communications Security, London, UK, 11–15 November 2019; pp. 1777–1794. [Google Scholar]
  13. Lindauer, B. Insider Threat Test Dataset. 2020. [Google Scholar]
  14. Hu, T.; Niu, W.; Zhang, X.; Liu, X.; Lu, J.; Liu, Y. An insider threat detection approach based on mouse dynamics and deep learning. Secur. Commun. Netw. 2019, 2019, 3898951. [Google Scholar] [CrossRef]
  15. Le, D.C.; Zincir-Heywood, N.; Heywood, M. Training regime influences to semi-supervised learning for insider threat detection. In Proceedings of the 2021 IEEE Security and Privacy Workshops (SPW), Francisco, CA, USA, 27 May 2021; IEEE: Piscataway, NJ, USA, 2021; pp. 13–18. [Google Scholar]
  16. Defferrard, M.; Bresson, X.; Vandergheynst, P. Convolutional neural networks on graphs with fast localized spectral filtering. Adv. Neural Inf. Process. Syst. 2016, 29, 3837–3845. [Google Scholar]
  17. Gori, M.; Monfardini, G.; Scarselli, F. A new model for learning in graph domains. In Proceedings of the 2005 IEEE International Joint Conference on Neural Networks, Montreal, QC, Canada, 31 July–4 August 2005; IEEE: Piscataway, NJ, USA, 2005; Volume 2, pp. 729–734. [Google Scholar]
  18. Micheli, A. Neural network for graphs: A contextual constructive approach. IEEE Trans. Neural Netw. 2009, 20, 498–511. [Google Scholar] [CrossRef] [PubMed]
  19. Veličković, P.; Cucurull, G.; Casanova, A.; Romero, A.; Lio, P.; Bengio, Y. Graph attention networks. arXiv 2017, arXiv:1710.10903. [Google Scholar]
  20. Zeng, J.; Chua, Z.L.; Chen, Y.; Ji, K.; Liang, Z.; Mao, J. WATSON: Abstracting Behaviors from Audit Logs via Aggregation of Contextual Semantics. In Proceedings of the Network and Distributed Systems Security (NDSS) Symposium 2021, Online, 21–24 February 2021. [Google Scholar]
  21. Wang, C.; Zhu, H. Wrongdoing Monitor: A Graph-Based Behavioral Anomaly Detection in Cyber Security. IEEE Trans. Inf. Forensics Secur. 2022, 17, 2703–2718. [Google Scholar] [CrossRef]
  22. Zhang, Z.; Li, Y.; Dong, H.; Gao, H.; Jin, Y.; Wang, W. Spectral-based directed graph network for malware detection. IEEE Trans. Netw. Sci. Eng. 2020, 8, 957–970. [Google Scholar] [CrossRef]
  23. Zhang, Z.; Li, Y.; Wang, W.; Song, H.; Dong, H. Malware detection with dynamic evolving graph convolutional networks. Int. J. Intell. Syst. 2022, 37, 7261–7280. [Google Scholar] [CrossRef]
  24. Jiang, J.; Chen, J.; Gu, T.; Choo, K.K.R.; Liu, C.; Yu, M.; Huang, W.; Mohapatra, P. Anomaly detection with graph convolutional networks for insider threat and fraud detection. In Proceedings of the MILCOM 2019—2019 IEEE Military Communications Conference (MILCOM), Norfolk, VA, USA, 12–14 November 2019; IEEE: Piscataway, NJ, USA, 2019; pp. 109–114. [Google Scholar]
  25. Zaman, M.; Siddiqui, T.; Amin, M.R.; Hossain, M.S. Malware detection in Android by network traffic analysis. In Proceedings of the 2015 International Conference on Networking Systems and Security (NSysS), Dhaka, Bangladesh, 5–7 January 2015; pp. 1–5. [Google Scholar] [CrossRef]
  26. Coskun, B. (Un)wisdom of Crowds: Accurately Spotting Malicious IP Clusters Using Not-So-Accurate IP Blacklists. IEEE Trans. Inf. Forensics Secur. 2017, 12, 1406–1417. [Google Scholar] [CrossRef]
  27. Liu, Z.; Qian, P.; Wang, X.; Zhuang, Y.; Qiu, L.; Wang, X. Combining Graph Neural Networks With Expert Knowledge for Smart Contract Vulnerability Detection. IEEE Trans. Knowl. Data Eng. 2023, 35, 1296–1310. [Google Scholar] [CrossRef]
  28. Lin, L.; Zhong, S.; Jia, C.; Chen, K. Insider threat detection based on deep belief network feature representation. In Proceedings of the 2017 International Conference on Green Informatics (ICGI), Fuzhou, China, 15–17 August 2017; IEEE: Piscataway, NJ, USA, 2017; pp. 54–59. [Google Scholar]
  29. Lu, S.; Wei, X.; Li, Y.; Wang, L. Detecting anomaly in big data system logs using convolutional neural network. In Proceedings of the 2018 IEEE 16th International Conference on Dependable, Autonomic and Secure Computing, 16th International Conference on Pervasive Intelligence and Computing, 4th International Conference on Big Data Intelligence and Computing and Cyber Science and Technology Congress (DASC/PiCom/DataCom/CyberSciTech), Athens, Greece, 12–15 August 2018; IEEE Computer Society: Piscataway, NJ, USA, 2018; pp. 151–158. [Google Scholar] [CrossRef]
  30. Meng, W.; Liu, Y.; Zhu, Y.; Zhang, S.; Pei, D.; Liu, Y.; Chen, Y.; Zhang, R.; Tao, S.; Sun, P.; et al. LogAnomaly: Unsupervised detection of sequential and quantitative anomalies in unstructured logs. In Proceedings of the IJCAI, Macao, China, 10–16 August 2019; Volume 19, pp. 4739–4745. [Google Scholar]
  31. Sharma, B.; Pokharel, P.; Joshi, B. User behavior analytics for anomaly detection using LSTM autoencoder-insider threat detection. In Proceedings of the 11th International Conference on Advances in Information Technology, Bangkok, Thailand, 1–3 July 2020; pp. 1–9. [Google Scholar]
  32. Zhang, F.; Ma, X.; Huang, W. SeqA-ITD: User Behavior Sequence Augmentation for Insider Threat Detection at Multiple Time Granularities. In Proceedings of the 2022 International Joint Conference on Neural Networks (IJCNN), Padua, Italy, 18–23 July 2022; IEEE: Piscataway, NJ, USA, 2022; pp. 1–7. [Google Scholar]
Figure 1. User behavior modeling methods based on time (a) and session (b), where PC-9436 represents the host of the malicious administrator, PC-5866 denotes the supervisor’s machines, and other PCs are used by regular employees; (c) shows the extracted attributes of user activities.
Electronics 13 04885 g001
Figure 2. The overall architecture of the proposed ASG-ITD for insider threat detection.
Electronics 13 04885 g002
Figure 3. Abstract representation of the abnormal behavior patterns in AB-I; Data represents the start time of the behavior, PC is the computer performing activities, User denotes the executor, and the horizontal arrow (→) indicates the direction of activities.
Electronics 13 04885 g003
Figure 4. Abstract representation of the abnormal behavior patterns in AB-II; Data represents the start time of a user session, PC is the computer performing the activities, User denotes the executor, and the horizontal arrow (→) indicates the direction of edges.
Electronics 13 04885 g004
Figure 5. Abstract representation of the abnormal behavior patterns in AB-III; Data represents the start time of a user session. PC is the computer performing activities, User denotes the executor, and the horizontal arrow (→) indicates the direction of edges.
Electronics 13 04885 g005
Figure 6. The associated graph construction and normalization phase: (a) aggregating heterogeneous logs, (b) associated graph construction, and (c) graph normalization.
Electronics 13 04885 g006
Figure 7. Effect of different learning rates on (af) ACC, PR, F1, AUC, TPR, and FPR, respectively; (g,h) show the average execution time by epoch for the three types of anomalous behavior.
Electronics 13 04885 g007aElectronics 13 04885 g007b
Table 1. Statistical information of the graph; NA represents the average number of nodes, EA denotes the average number of edges, AN indicates the number of activity nodes, and SN means the number of session nodes.
TypeNAEAANSN
AB-I54.2052.20815,94815,336
AB-II561.98555.172,704,23729,244
AB-III311.32300.341,786,36459,159
Table 2. Statistical information of the dataset; NB represents normal user behavior, while AB denotes abnormal user behavior.
CategoryNBAB-IAB-IIAB-III
User70303010
Activity32,763,2433456426213
Session455,0606976767786
Associated session11,800693010
Data augmentation13,319756623642890
Table 3. Performance comparison among six models.
TypeModelMethodACC (%)↑PR (%)↑F1 (%)↑TPR (%)↑FPR (%)↓AUC (%)↑
AB-IDBN-OCSVMfixed time81.0384.1080.5065.654.1080.77
CNNfixed time86.4584.6686.4788.355.4186.52
LSTMfixed time86.7986.7886.7783.299.7986.77
LSTM-CNNfixed time91.6793.3691.5789.853.5591.73
LSTM-AEfixed time50.6425.3233.620050.00
G C N fixed time95.0395.1195.1493.893.0095.39
G C N S session95.3196.1895.2994.123.0095.82
ASG-ITDsession98.6799.6198.5997.70098.66
AB-IIDBN-OCSVMfixed time50.8825.4433.720050.00
CNNfixed time75.8275.1275.6576.1914.5575.97
LSTMfixed time66.9468.8267.8784.105.0366.95
LSTM-CNNfixed time71.4977.6974.7496.035.2372.01
LSTM-AEfixed time57.8267.4162.3203.7657.96
G C N fixed time95.3196.1895.2997.123.0095.82
G C N S session96.9196.4396.6397.482.2096.35
ASG-ITDsession99.5699.5499.5399.56099.56
AB-IIIDBN-OCSVMfixed time51.6825.8434.070050.00
CNNfixed time95.1993.9694.4895.873.7594.48
LSTMfixed time95.0195.2895.0295.435.7994.43
LSTM-CNNfixed time95.1795.2295.2095.839.3094.24
LSTM-AEfixed time95.2095.1895.290048.68
G C N fixed time95.3195.3995.4096.023.0094.82
G C N S session95.6095.8795.4596.862.0095.01
ASG-ITDsession99.6799.1499.1399.15098.63
Table 4. Performance comparison with existing methods. Note that the results are sourced from their respective papers; “n/a” indicates that the method did not report evaluation results.
BehaviorModelMethodACC (%)↑PR (%)↑F1 (%)↑TPR (%)↑FPR (%)↓AUC (%)↑
AB
OR
NOT
Lin et al. [28]fixed time87.79n/an/a81.0412.80n/a
Yuan et al. [11]fixed timen/an/an/an/an/a94.49
Zhang et al. [32]fixed timen/a95.7995.6395.64n/a95.85
Sharma et al. [31]session90.172.625.0991.039.84n/a
Le et al. [15]fixed timen/an/an/a79.105.0096.80
ASG-ITDsession99.0599.4898.8998.38098.81
Table 5. Performance comparison in terms of ACC, PR, F1, TPR, FPR, and AUC.
MethodRaw DataAugmented DataTypeACC (%)↑PR (%)↑F1 (%)↑TPR (%)↑FPR (%)↓AUC (%)↑
ASGSGASG
ITD-NDE AB-I99.7422.3422.3922.67024.97
DT-Nne AB-I92.8292.8292.8292.830.7792.83
RF-Nne AB-I94.7694.7694.7694.760.4594.76
MLP-Nne AB-I93.7893.7793.7893.790.5893.79
KNN-Nne AB-I93.4693.4593.4693.460.5893.46
LSTM-Nne AB-I70.8675.4169.7071.218.0971.21
G C N S AB-I95.3196.1895.2994.120.4095.82
G C N I S AB-I96.6697.6396.3794.840.0296.52
ITD-NNE AB-I96.9199.5896.6995.17096.88
ASG-ITD AB-I98.6799.6198.5997.70098.66
ITD-NDE AB-II98.82000015.62
DT-Nne AB-II90.7590.7390.7590.871.6190.87
RF-Nne AB-II92.0792.0792.0792.090.2092.09
MLP-Nne AB-II91.9491.9291.9491.980.4091.98
KNN-Nne AB-II92.4492.1292.4491.480.4092.48
LSTM-Nne AB-II62.8278.2558.0264.037.1964.03
G C N S AB-II96.9196.4396.6397.482.2096.35
G C N I S AB-II97.1297.6597.6498.422.0097.37
ITD-NNE AB-II98.9598.4598.9399.482.0098.95
ASG-ITD AB-II99.5699.5499.5399.56099.56
ITD-NDE AB-III99.32000010
DT-Nne AB-III93.2593.2593.2593.250.7093.25
RF-Nne AB-III94.3294.3294.2394.320.6594.32
MLP-Nne AB-III93.2593.2593.2593.250.7093.25
KNN-Nne AB-III93.9093.8993.9093.942.1293.93
LSTM-Nne AB-III62.8278.2558.0264.037.1964.03
G C N S AB-III95.6095.8795.4596.862.0095.01
G C N I S AB-III97.7696.0396.6397.481.8096.35
ITD-NNE AB-III97.8096.1297.4698.961.2097.04
ASG-ITD AB-III99.6799.1499.1399.15098.63
Disclaimer/Publisher’s Note: The statements, opinions and data contained in all publications are solely those of the individual author(s) and contributor(s) and not of MDPI and/or the editor(s). MDPI and/or the editor(s) disclaim responsibility for any injury to people or property resulting from any ideas, methods, instructions or products referred to in the content.

