Abstract
Building on the fully encapsulated architecture of liquid crystal (LC) coaxial phase shifters, which leverages noise-shielding advantages for millimeter-wave wideband reconfigurable applications, this study addresses the less-explored issue of low-frequency breakdown (LFB) susceptibility in modern full-wave solvers. Specifically, it identifies the vulnerability nexus between the tuning states (driven by low-frequency bias voltages) and the constitutive elements of LC-filled coaxial phase shifters—namely, the core line, housing grounding, and radially sandwiched tunable dielectrics—operating at millimeter-wave frequencies (60 GHz WiGig), microwave (1 GHz), and far lower frequency regimes (down to 1 MHz, 1 kHz, and 1 Hz) for long-wavelength or quasi-static conditions, with specialized applications in submarine communications and geophysical exploration. For completeness, the study also investigates the device state prior to LC injection, when the cavity is air-filled. Key computational metrics, such as effective permittivity and characteristic impedance, are analyzed. The results show that at 1 kHz, deviations in effective permittivity exceed four orders of magnitude compared to 1 GHz, while characteristic impedance exhibits deviations of three orders of magnitude. More critically, in the LFB regime, theoretical benchmarks from 1 MHz to 1 kHz and 1 Hz demonstrate an exponential increase in prediction error for both effective permittivity, rising from 16.8% to 1.5 × % and 1.5 × %, and for characteristic impedance, escalating from 8.1% to 1.15 × % and 3.9 × %, respectively. Consequently, the prediction error of the differential phase shift, minimal at 60 GHz (0.16%), becomes noticeable at 1 MHz (4.39%), increases sharply to 743.88% at 1 kHz, and escalates dramatically to 2.18 × % at 1 Hz. The findings reveal a pronounced frequency asymmetry in LFB susceptibility for the LC coaxial phase shifter biased at extremely low frequencies.
1. Introduction
Flexible beam steering, realized through phased antenna array mechanisms [1,2,3,4,5], has emerged as a foundational technology permeating modern and next-generation communication systems, radars, sensors, space exploration (e.g., probing the origins of the universe), and joint communication-sensing technologies [6,7,8,9]. These advancements are integral to the 6G roadmap [6,10,11], which operates predominantly in the millimeter-wave [12,13,14] and sub-millimeter-wave (terahertz) [15,16] frequency domains to meet the insatiable needs of bandwidth and hyper-fast data rates.
A key enabler for electronically phased antenna array beam steering is the development of liquid crystal (LC) tunable phase shifters [17,18,19,20], which offer a superior alternative to traditional solid-state switch solutions [21]. The latter struggle to provide low-loss, low-power performance within the millimeter-wave (mmW), sub-mmW, and terahertz (THz) frequency ranges at the microscale. In an LC phase shifter, a low-amplitude voltage biasing field (e.g., approximately 10 V [19]) with an extremely low frequency (ELF) is applied to dynamically orient and reorient the liquid crystal (LC) material. It is noteworthy that industry-standard quasi-static alternating current (AC) tuning, operating at frequencies ranging from Hz to kHz, is employed instead of direct current (DC) control to mitigate the risk of chemical degradation [17]. These phase shifters are crucial for emerging applications such as the Internet of Things (IoT) [22,23,24,25] and the evolving Internet of Nano-Things (IoNT) [14,26], a field still in its early stages of development, with considerable progress needed to actualize full-scale commercialization.
Fortunately, with advances in computational power and artificial intelligence [27,28,29], cost-effective deployment of these technologies is becoming both technically and financially feasible. One of the critical prerequisites for this progress is the creation of digital twins [30] for LC-incorporated phasing components and networks in the engineering sector, which can adapt to the function requirements from a wide range of frequency-specific applications. Arguably, the integration of functional material (i.e., LC) with advanced electromagnetism (circuits and devices) is formulating a dielectrics-wave-guiding-information nexus to facilitate a more sustainable and efficient global 5G-to-6G transition.
However, a significant challenge in this domain lies in the absence of precise multi-scale, multi-physics simulations that span various disciplines. Such simulations must comprehensively capture the molecular reorientation dynamics at the nanoscale, alongside the spatial and temporal distribution of dielectric constants at the macroscale. This spans a wide frequency range, from Hz and kHz (associated with LC molecular biasing voltages) to MHz, GHz, and even THz (corresponding to the signals undergoing phase shifting). While reducing computational overhead is essential, maintaining the reliability of numerical predictions remains a top priority. Although the high-frequency behavior of LC-based microwave (MW) and millimeter-wave (mmW) tunable devices has been extensively studied (and matured for some planar topologies [31,32]), both numerically and experimentally, there has been insufficient focus on their low-frequency response and the accuracy of simulations in this regime. One of these computational challenges is the low-frequency breakdown (LFB), due, fundamentally, to the finite machine precision [33,34] for multi-scale simulations.
LFB represents a notable limitation of commercial full-wave simulators, which struggle to accurately characterize the wideband low-frequency behavior (e.g., from 0 Hz to MW) of devices where the wavelength is significantly larger than the circuit’s feature size. However, these extra-low-frequency bands (e.g., Hz, kHz) find specific applications in underwater wireless communications [35,36], more specifically, submarine communications [36] (a trade-off between data rate and transmission distance), in place of the conventional acoustic approach that is slow and bandwidth-limited.
Albeit MW and mmW frequencies are extensively used in modern high-data-rate communications with compact device sizes, these frequency bands face significant challenges in underwater communication. Their high attenuation and substantial absorption in seawater limit their ability to effectively reach the operational depths of submarines and underwater vehicles. This limitation drives the adoption of extremely low frequency (ELF), super low frequency (SLF), and ultra-low frequency (ULF) bands, which offer significantly lower attenuation, enabling more efficient penetration of seawater for oceanography [35] and naval applications. Additionally, ELF frequencies were also reported in earthquake monitoring and forecasting. These low-frequency signals leverage their ability to penetrate materials deeply and provide long-range communication capabilities, making them potentially critical for various industries.
However, challenged by the electromagnetic interference (EMI) noise and the attenuation (range constraint) of conventional ELF antenna technologies (e.g., coaxial transmission line antennas and loop antennas as reported in [35] for use in the sea), pronounced breakthroughs in submarine radio links (governing surface-to-submarine, submarine-to-surface, and submarine-to-submarine propagation), have yet to be convincingly evidenced. A solution by arrays of submerged antennas for enhanced directivity was proposed [35], for which adaptable wavefront phase control is highly desirable and linked to the subject of interest in this work.
As such, precisely characterizing the LC-based phase-reconfigurable device behavior at these extremely-low-frequency bands is of equally strategic importance for optimizing the LC biasing field in mainstream high-frequency applications and for enabling potential applications in ELF-phased array systems. Furthermore, from the lens of computational electromagnetics, this broader investigation, e.g., by strategically using a coaxial LC-accommodating structure that supports a transverse electromagnetic (TEM) mode propagation theoretically from DC (low frequency) to mmW, provides numerical insights into the behavior of the simulation models at different scales and ensures the robustness of the design tools used for both higher and lower-frequency applications.
Over the past decades, leading researchers, such as Jiao, D. [37,38,39], and Chew, W.C. [40,41], have made substantial contributions toward addressing the LFB issue. A host of definitive books on [42,43] can be referred to. However, their research has primarily focused on standard transmission lines and circuit components, without incorporating tunable dielectrics as functional materials into the analysis. More fundamentally and specifically, most of the studies so far have been tailored to address the LFB when solving integral equations (IEs) [39,40,41,44], whereas the evidence remains patchy for solving partial-differential equations (PDEs), e.g., via the finite-element method (FEM).
However, differences in the underlying mathematical frameworks between IEs and PDEs are a significant factor in limiting the generalizability of these findings. The validation of the proposed approaches in the existing literature often lacks consistency, making it difficult to fully substantiate their claims. This is because the parameters were intentionally constrained to create a favorable scenario for demonstrating the method’s efficacy, which may not accurately reflect real-world conditions. Therefore, a more general approach is necessary to effectively address the broader challenges posed by PDE solvers under low-frequency conditions.
More specifically, for reconfigurable devices like LC-based phase shifters, many unknowns and research opportunities remain, particularly concerning the low-frequency cutoff vulnerabilities in device design and simulation. This gap raises a pertinent scientific question: Is there a low-frequency breakdown (LFB) when simulating LC-based reconfigurable phase-shifting devices, originally designed for millimeter-wave applications [45,46], in the low-frequency regime (associated with LC molecular biasing) using the FEM solver, such as HFSS (High-Frequency Structure Simulator)? This question forms the basis of a legitimate scientific hypothesis, warranting further investigation.
In line with answering these questions, this study addresses the gap by preliminarily investigating the low-frequency breakdown (LFB) vulnerability in a single-dielectric liquid crystal (LC)-filled coaxial delay line device. While coaxial geometry is a legacy structure in microwave transmission lines, it offers a more consistent and computationally stable electromagnetic environment due to its fully shielded metal housing, which provides superior immunity to external interferences [16]. Furthermore, it mitigates internal computational errors often associated with inhomogeneous multi-dielectric systems, such as microstrip lines incorporating multiple dielectrics [31,32]. From the perspective of mode analysis, the single-dielectric topology of the coaxial structure supports a true transverse electromagnetic (TEM) propagation mode, assuming that the design includes an adequate guard band [16] to suppress the onset of the first higher-order mode. This ensures that the effective permittivity () theoretically equals the intrinsic dielectric constant (Dk) of the filled dielectric (i.e., LC), as represented by Equation (1). Thereby, the effective permittivity perturbation is entirely controlled by the dielectric constant tuning with the electric biasing field applied to the LC layer, due to which the LC material Dk and the induced permittivity () of the coaxial transmission line are used interchangeably in this work when referring to the specific tuning state of the LC.
By quantifying the deviations between the computed effective permittivity () and the theoretical value () at various frequencies (e.g., 1 Hz, 1 kHz, 1 MHz, 1 GHz, and 60 GHz), we aim to identify LFB computational issues in LC-based coaxial phase shifters for the first time. The accuracy, efficiency, and reliability of computational electromagnetic simulations in reconfigurable coaxial transmission lines filled with liquid crystal (LC) tunable media are highly influenced by boundary conditions and mesh discretization across varying frequency ranges and material properties. In this study, we compare meshing statistics for designs operating in coaxial TEM mode at millimeter-wave (60 GHz), microwave (1 GHz), and lower frequency ranges (1 MHz, 1 kHz, and 1 Hz), providing valuable insights into computational meshing metrology. The findings from this vulnerability analysis are expected to be rapidly integrated into low-frequency breakdown (LFB) threat detection frameworks, which are embedded in computational electromagnetics solutions. This work holds strategic importance for digital twin technologies and paves the way for the development of multi-physics and multi-scale open-source programs for LC-based devices beyond phase shifters.
2. Materials and Methods
The methodologies, geometrical configurations, material properties, and modelling approaches for evaluating LFB are presented in this section. Figure 1 illustrates the material composition and geometric configuration of the device that underpins the theoretical analysis and computational modelling. The LC-filled, coaxially confined delay line device can be electromagnetically characterized as comprising inhomogeneous and anisotropic dielectric materials, specifically utilizing the GT3-24002 series of liquid crystals [16,19,45,46] in this study. These materials are radially enclosed by non-ideal conductors, represented by C101-grade copper, with surface roughness effects excluded from this analysis. Although surface roughness is practically significant in relation to frequency-dependent insertion loss, characterizing this aspect falls outside the scope of the preliminary investigation into low-frequency breakdown (LFB) in this work. The primary objective is to ensure that the signal propagation path is as clean as possible, which motivates the use of coaxial topology to eliminate other complexities that may exacerbate the computational LFB problem.
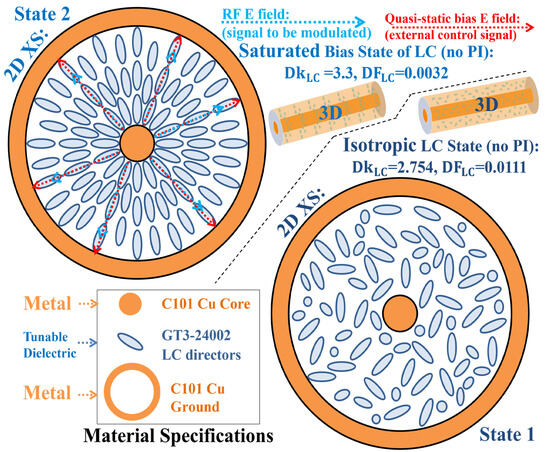
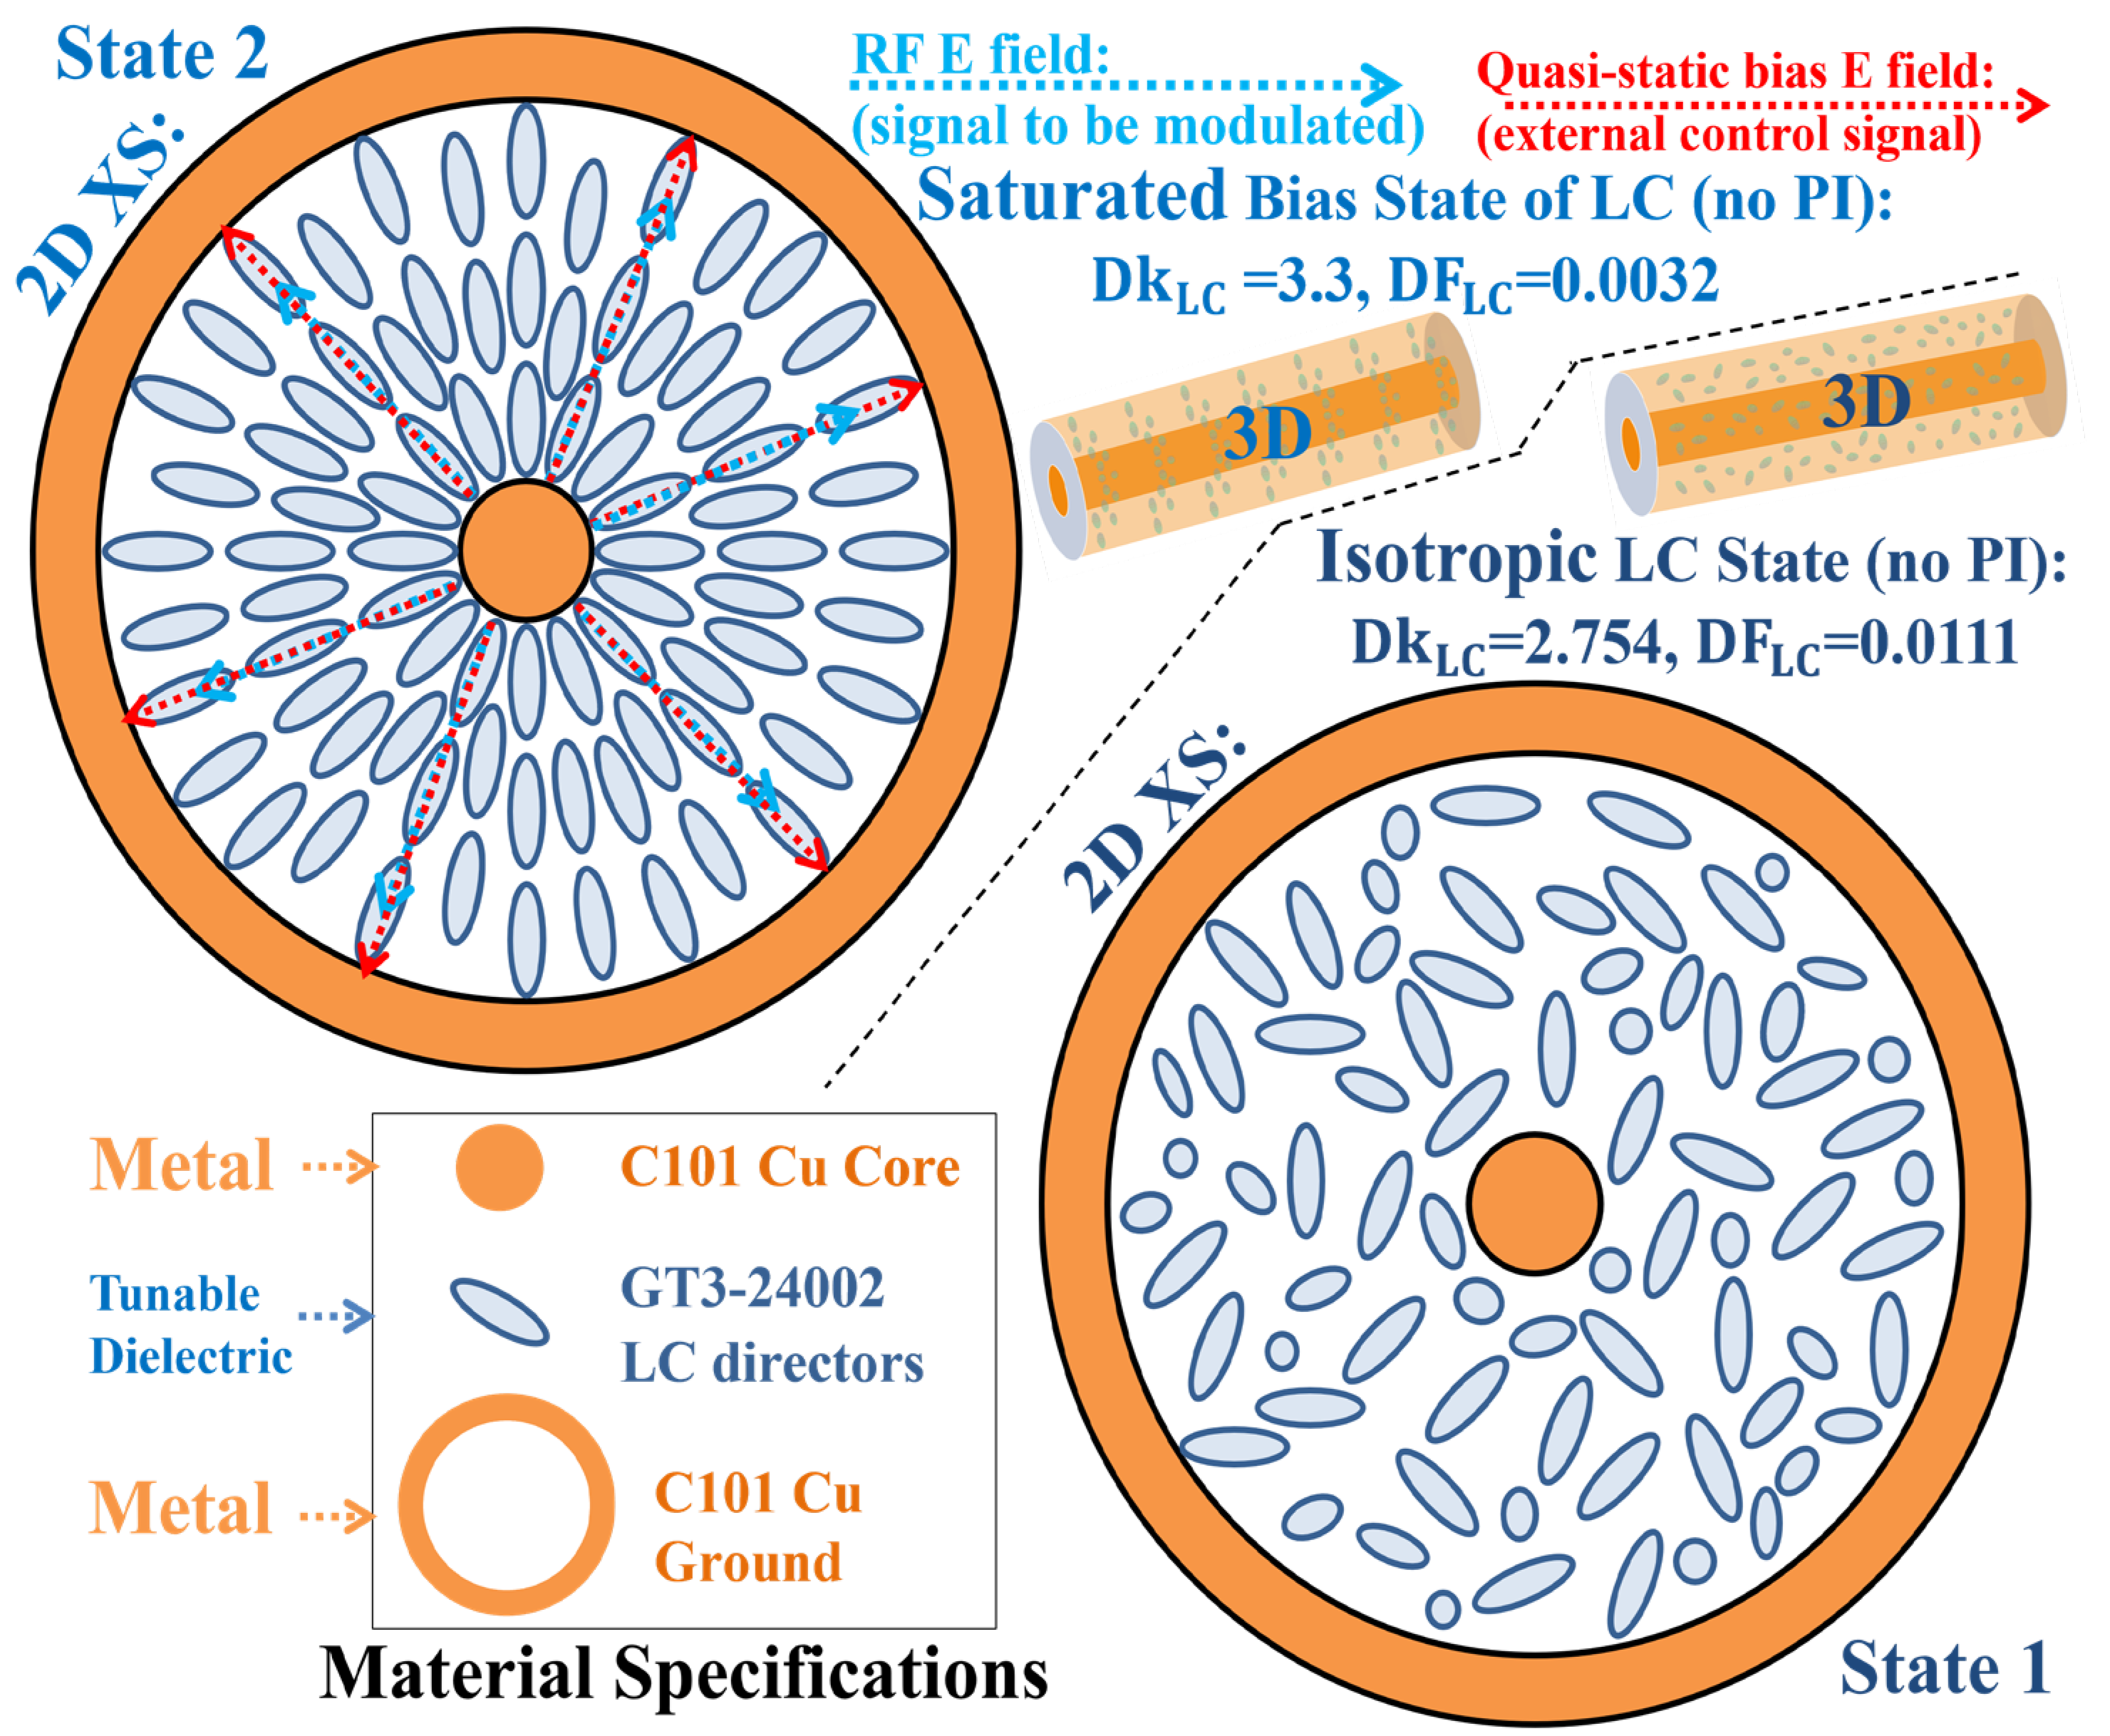
Figure 1.
Snapshot of the constitutive parameters for all materials utilized in the LC-filled coaxial delay line device, illustrating the material composition and geometric configuration. The depiction highlights the radially sandwiched anisotropic dielectric (GT3 LC series) and non-ideal copper conductors (C101-grade), modelled without consideration of surface roughness. The emphasis is placed on the coaxial structure and its associated electromagnetic properties under low-frequency bias fields, specifically at 0 V (state 1) and at the saturated bias field (state 2).
A key feature of liquid crystal (LC)-based devices is their inherent anisotropy, which arises from the nanoscopic anisotropy of the LC molecules and manifests macroscopically as dielectric permittivity anisotropy [18,19]. This variation in dielectric properties, induced by molecular anisotropy, is achieved through the application of a low-frequency external voltage field, specifically a quasi-electrostatic bias field for dynamic control. By adjusting the bias voltage from a reference state (e.g., 0 V in many cases) to a saturation point—at which the dielectric properties stabilize despite further increases in the applied field—the tunable characteristics of the device can be continuously controlled between these two extreme states, as illustrated in Figure 1 for the two-dimension (2D) cross-sectional (XS) and three-dimension (3D) longitudinal views.
From our past characterization work [16,47], the dielectric constant (Dk) for these two extreme states is identified, with values tunable from 2.754 (isotropic state, i.e., state 1 in Figure 1) to 3.3 (saturated bias state, i.e., state 2 in Figure 1). The dissipation factor (DF) is also specified; while it significantly influences the prediction of insertion loss performance, it has minimal or no impact on the low-frequency breakdown (LFB) problem of interest in this study.
Another significant advantage of the coaxially accommodating structure for LC-enabled phase shifting applications is its ability to eliminate the traditionally required alignment agents used in planar structures. One of the most commonly employed alignment agents is polyimide (PI), which is utilized in the fabrication of LC-based inverted microstrip [32] and enclosed coplanar [19] phase shifters. As demonstrated in our pioneering work on the LC-filled coaxial phase shifter [47], the removal of the PI—and the associated complex, time-consuming processing steps—substantially streamlines the manufacturing process for LC-based devices and mitigates additional insertion loss that may arise from the introduction of the PI.
The key property of the LC’s Dk is influenced less by the RF frequency dispersion and more significantly by the applied bias voltage (driven by a low-frequency field). In this numerical study, we analyzed three typical tuning states: 0 V bias, saturated bias, and an unfilled state (no bias, with the LC absent). For all cases, the length of the LC-filled device under numerical characterization is fixed at 10 mm, adhering to a per-unit-length approach for ease of cross-device benchmarking. The cross-sectional geometries of the LC coaxial phase shifter designs at various frequencies are summarized in Table 1. The vacuum wavelength (λ) is provided as an approximate reference; however, the effective wavelength (), which accounts for the varying dielectric constant of the tunable LC, will be analyzed and presented in the results section.

Table 1.
Geometrical parameters ensuring TEM mode operation in simulations across multiple frequency ranges.
For a given frequency, this study examines the dependence of low-frequency breakdown (LFB) vulnerability on the tuning states, where the LC is injected and subjected to varying bias voltages. The varying dielectric constant (Dk) perturbs the electrical size of the delay line’s cross-section relative to the guided wavelength, which subsequently leads to variations in computational resource consumption (memory and processing time).
The selection mechanism for the parameters TLC and Dcore in this study is based on four key considerations:
- The size must ensure pure TEM mode operation at all frequency points, without exciting any higher-order modes. The highest frequency under consideration (60 GHz in this case) is most susceptible to higher-order mode excitation. Therefore, the central pin diameter (Dcore) is chosen as 0.23 mm, the industry-standard for 60 GHz millimeter-wave operation, to guarantee single-mode behavior.
- TLC and Dcore are calculated using the characteristic impedance () formula derived from TEM mode analysis [47]. With one parameter fixed, the other is determined according to Equation (2):
- TLC must also comply with liquid crystal operational constraints, specifically within the classically defined rubbing interaction range (i.e., it should not be too thick). Using the 60 GHz case as a baseline is more appropriate than using lower frequencies, as a larger Dcore leads to a thicker TLC under the impedance-matching condition.
- Finally, designing the geometry based on the highest frequency point (60 GHz) amplifies the LFB vulnerability. For long-wavelength applications (e.g., 1 Hz, 1 kHz, and 1 MHz as listed in Table 1), the TLC (0.34876 mm) and Dcore (0.23 mm) dimensions, optimized for the 60 GHz standard, offer a highly area-efficient solution to the 50 Ω impedance-matching equation. However, LFB may still occur in full-wave computational simulations, as the wave-like behavior becomes infinitesimally small relative to the tiny structure. The multi-scale evolution of the LFB susceptibility is intuitively schematized in Figure 2. The multiple frequencies presented in this study correspond to the transmitted signal (or low-frequency biasing signal) undergoing phase shifting and subsequent analysis through simulations, where the quasi-static or low-frequency bias cannot be simulated independently (separately). It is crucial to carefully assess the potential computational impact (e.g., LFB errors) of the liquid crystal (LC) material’s low-frequency bias on the simulation of the transmitted signal across various frequencies, in addition to the practical coupling effects (crosstalk) between the mixed signals and the influence of noise from instrumentation.
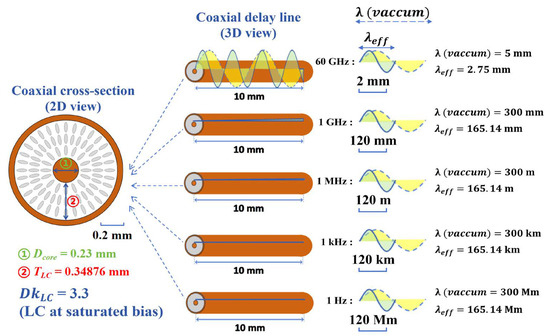 Figure 2. Schematic representation of potential low-frequency breakdown (LFB) issues in LC-filled coaxial phase shifters. The five frequency cases examined in this work are exemplified in cross-sectional and longitudinal views (mind the diverse scaling metrics for each case).
Compared to 3D simulations, 2D simulations provide faster computation and reduced memory consumption. Although a 2D solver based on cross-sectional analysis is adequate for predicting characteristic impedance and effective permittivity, it does not account for the integral property of length, which is essential for accurately calculating core functionalities such as differential phase shift and insertion loss. Consequently, a 3D solver is necessary for a comprehensive performance evaluation.
In this study, we utilize a nematic LC mixture (grade GT3-24002) as the dielectric material within a coaxially filled cylindrical structure, positioned between the core and the surrounding ground conductor. The dielectric properties of the nematic LC material employed have been explicitly depicted in Figure 1. A notable property of liquid crystals is their long-range molecular alignment, which allows the LC molecules to align along the length of the microstructure in the direction of wave propagation. Additionally, van der Waals forces may promote planar alignment of the molecules between the internal and external conductors, a phenomenon observed in silica-glass microcapillaries infiltrated with liquid crystals [48,49]. To minimize uncertainties associated with liquid crystal (LC) alignment and geometry-dependent defects, we focus on the fully aligned state of the LC (with Dk = 3.3) for the analysis of low-frequency breakdown. In this saturated biased state, the LC molecules align with the electric field polarization, thereby eliminating uncertainties related to initial alignment. Additionally, other tuning states, including those prior to LC filling and at isotropic states, are considered in the computational study to evaluate vulnerability to low-frequency breakdown under various LC tuning conditions.
3. Results
This section reports the quantification of errors in assessing low-frequency breakdown at 1 MHz, 1 kHz, and 1 Hz. The analysis of low-frequency breakdown (LFB) vulnerability is conducted in HFSS (version 2022 R1) for an 3D model of the LC-filled coaxial delay line (structured with TLC = 0.34876 mm, Dcore = 0.23 mm, and length = 10 mm, as detailed in Table 1) across a single frequency spectrum of 60 GHz, 1 GHz, 1 MHz, 1 kHz, and 1 Hz (i.e., the same geometry is computationally solved at five frequencies, respectively). For each frequency, three phase-tuning states are examined, corresponding to two extreme biasing conditions of the LC and an air-filled state prior to LC infusion. This investigation is mathematically implemented by perturbing the dielectric constant (Dk) of the dielectric medium situated between the core line and the housing conductor (ground). The solutions for all cases adhere to a unified convergence criterion of ∆S = 0.01.
3.1. Comparison of Solution Statistics
In the pursuit of digital twinning, the computational paradigm must maximize performance and efficiency while prioritizing reliability for practical applications. Table 2 presents the computational resources utilized for each case, encompassing various frequencies and tuning states. High-performance computing (HPC) is implemented with eight cores engaged for parallel processing in the HFSS simulations.
Table 2.
Computational time and memory usage statistics for single-frequency solution cases.
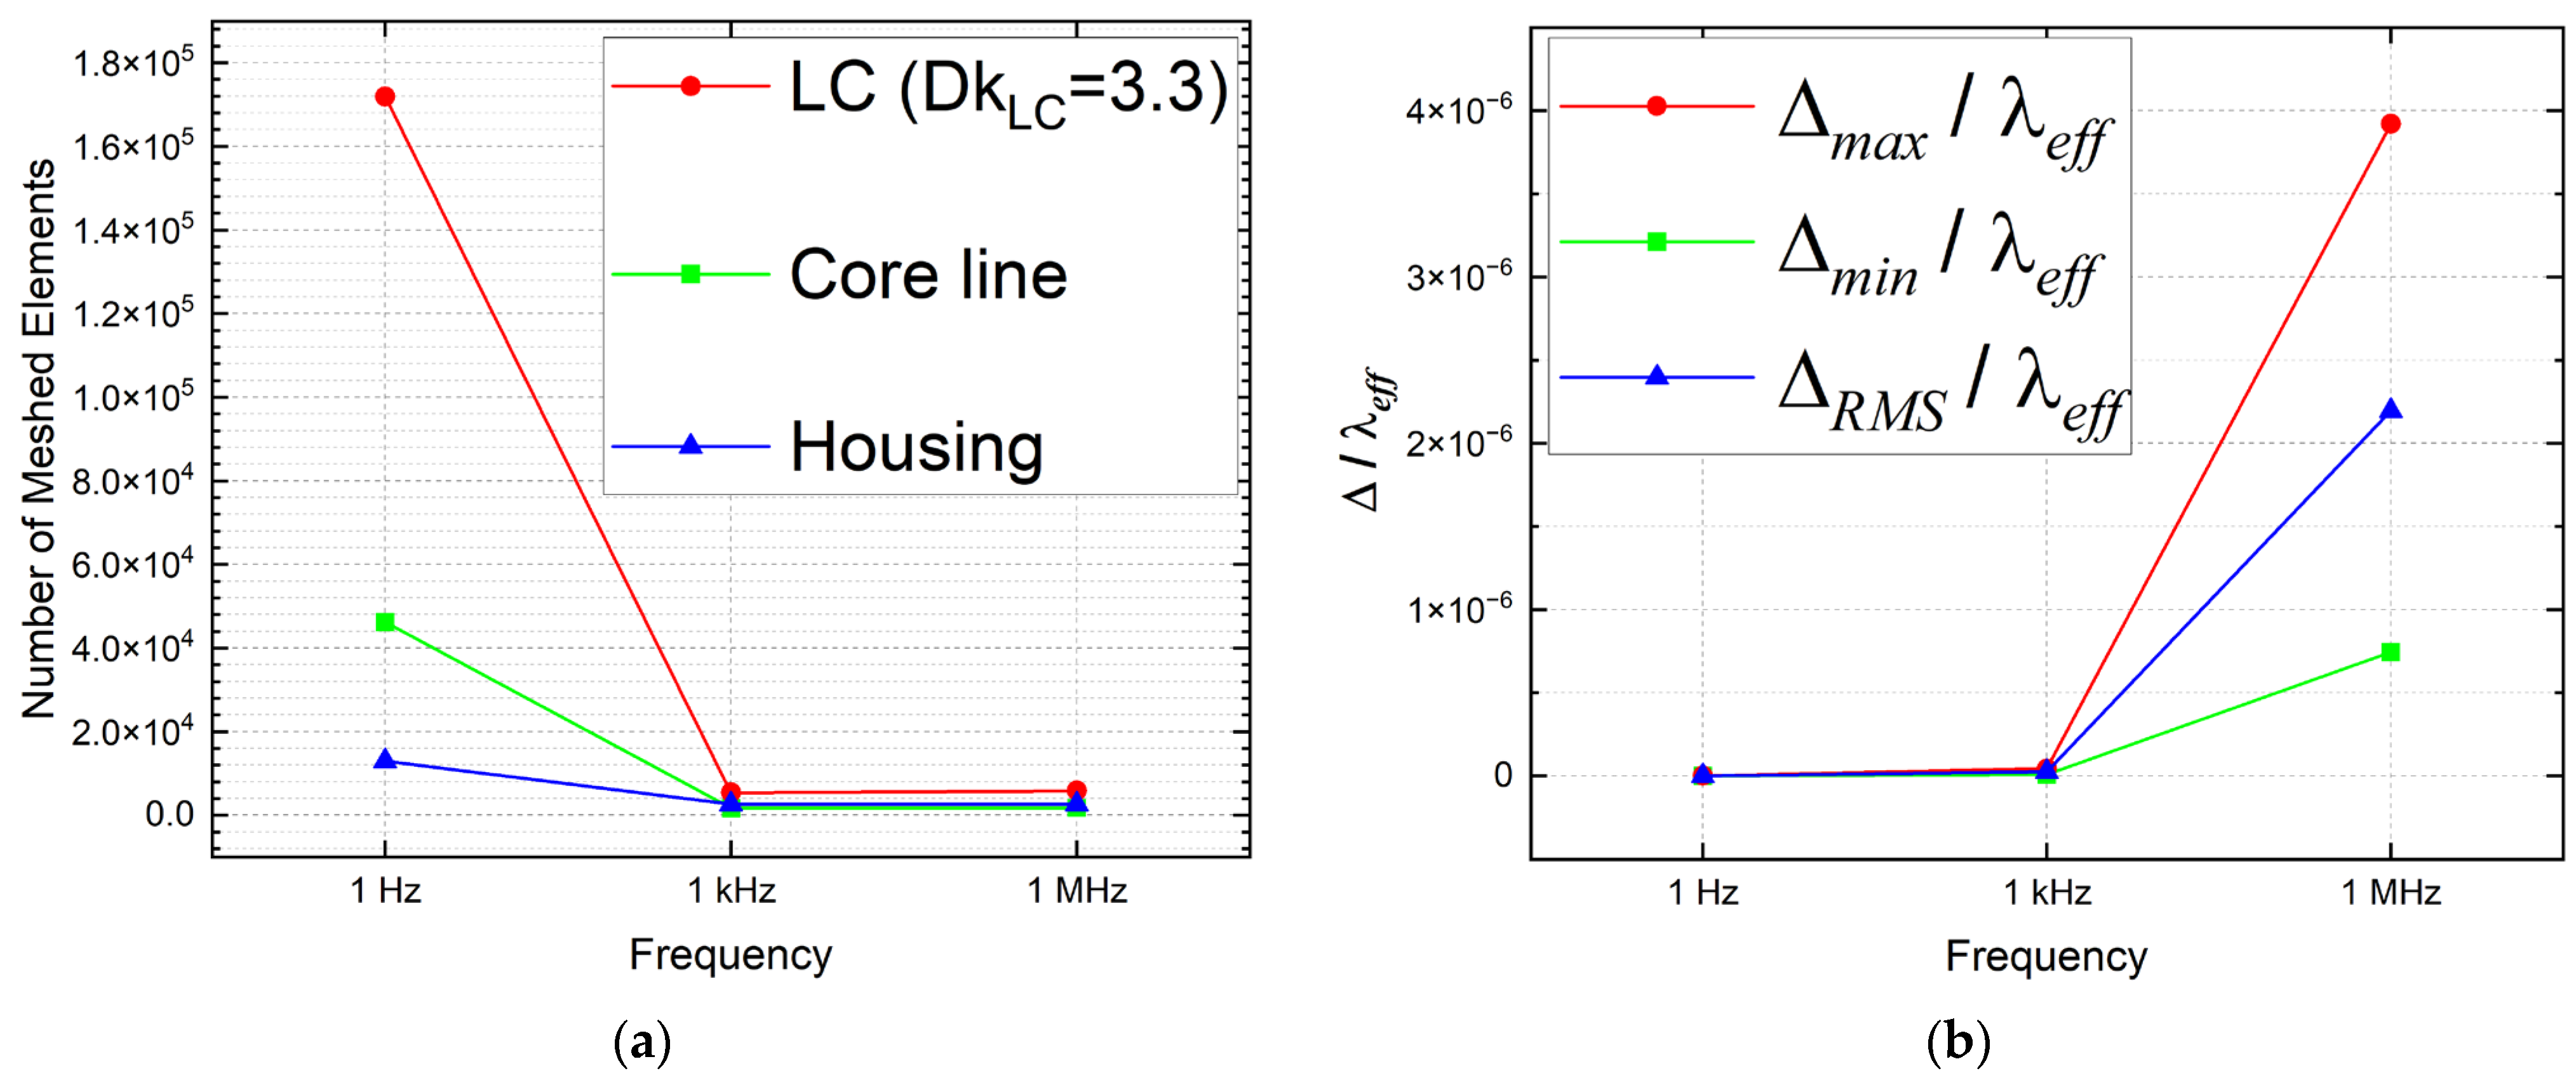
Meshing statistics are further compared across three potentially vulnerable frequency cases: 1 MHz, 1 kHz, and 1 Hz. Figure 3a illustrates the number of meshed elements at the surfaces of the core line, the housing conductor, and within the volume of the dielectric, i.e., liquid crystal (LC). Two primary phenomena are observed. First, there is a significant increase in the number of meshed elements when the solution frequency is decreased from 1 kHz to 1 Hz, while the change is minimal when the frequency is reduced from 1 MHz to 1 kHz. Second, the volume of the LC dielectric consistently accounts for the majority of meshed elements across all three frequency points, particularly evident in the 1 Hz case. This is followed by the number of meshed elements at the surface of the core line, with the grounding conductor exhibiting the least number. Notably, the difference in the number of meshed elements across the constitutive materials is minimal for both 1 kHz and 1 MHz.
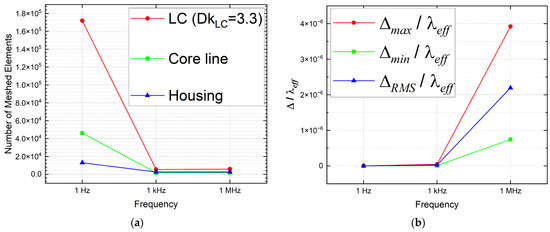
Figure 3.
(a) Frequency-based meshing statistics (number of elements) for metal components (Cu core line and Cu housing) and dielectric material (liquid crystal). (b) Edge sizes of meshing elements in the dielectric volume. Results are based on the saturated bias state of LC (Dk = 3.3).
Specifically, for the volume of the dielectric, the edge sizes (minimum, maximum, and root mean square (RMS) values) relative to the effective wavelength for each analyzed frequency are presented in Figure 3b. With the volume fixed based on the geometry specified in Table 1 for all three frequencies, the significant increase in the number of meshes observed from 1 kHz to 1 Hz in Figure 3a naturally results in a decrease in mesh size, as illustrated in Figure 3b. In contrast, the relative mesh sizes for the 1 MHz case are considerably larger, corresponding to the fewest number of meshes shown in Figure 3a. It is important to note that this relative mesh size does not represent the absolute mesh size; rather, it indicates the ratio of the mesh size to the effective wavelength () scaled within the dielectric medium.
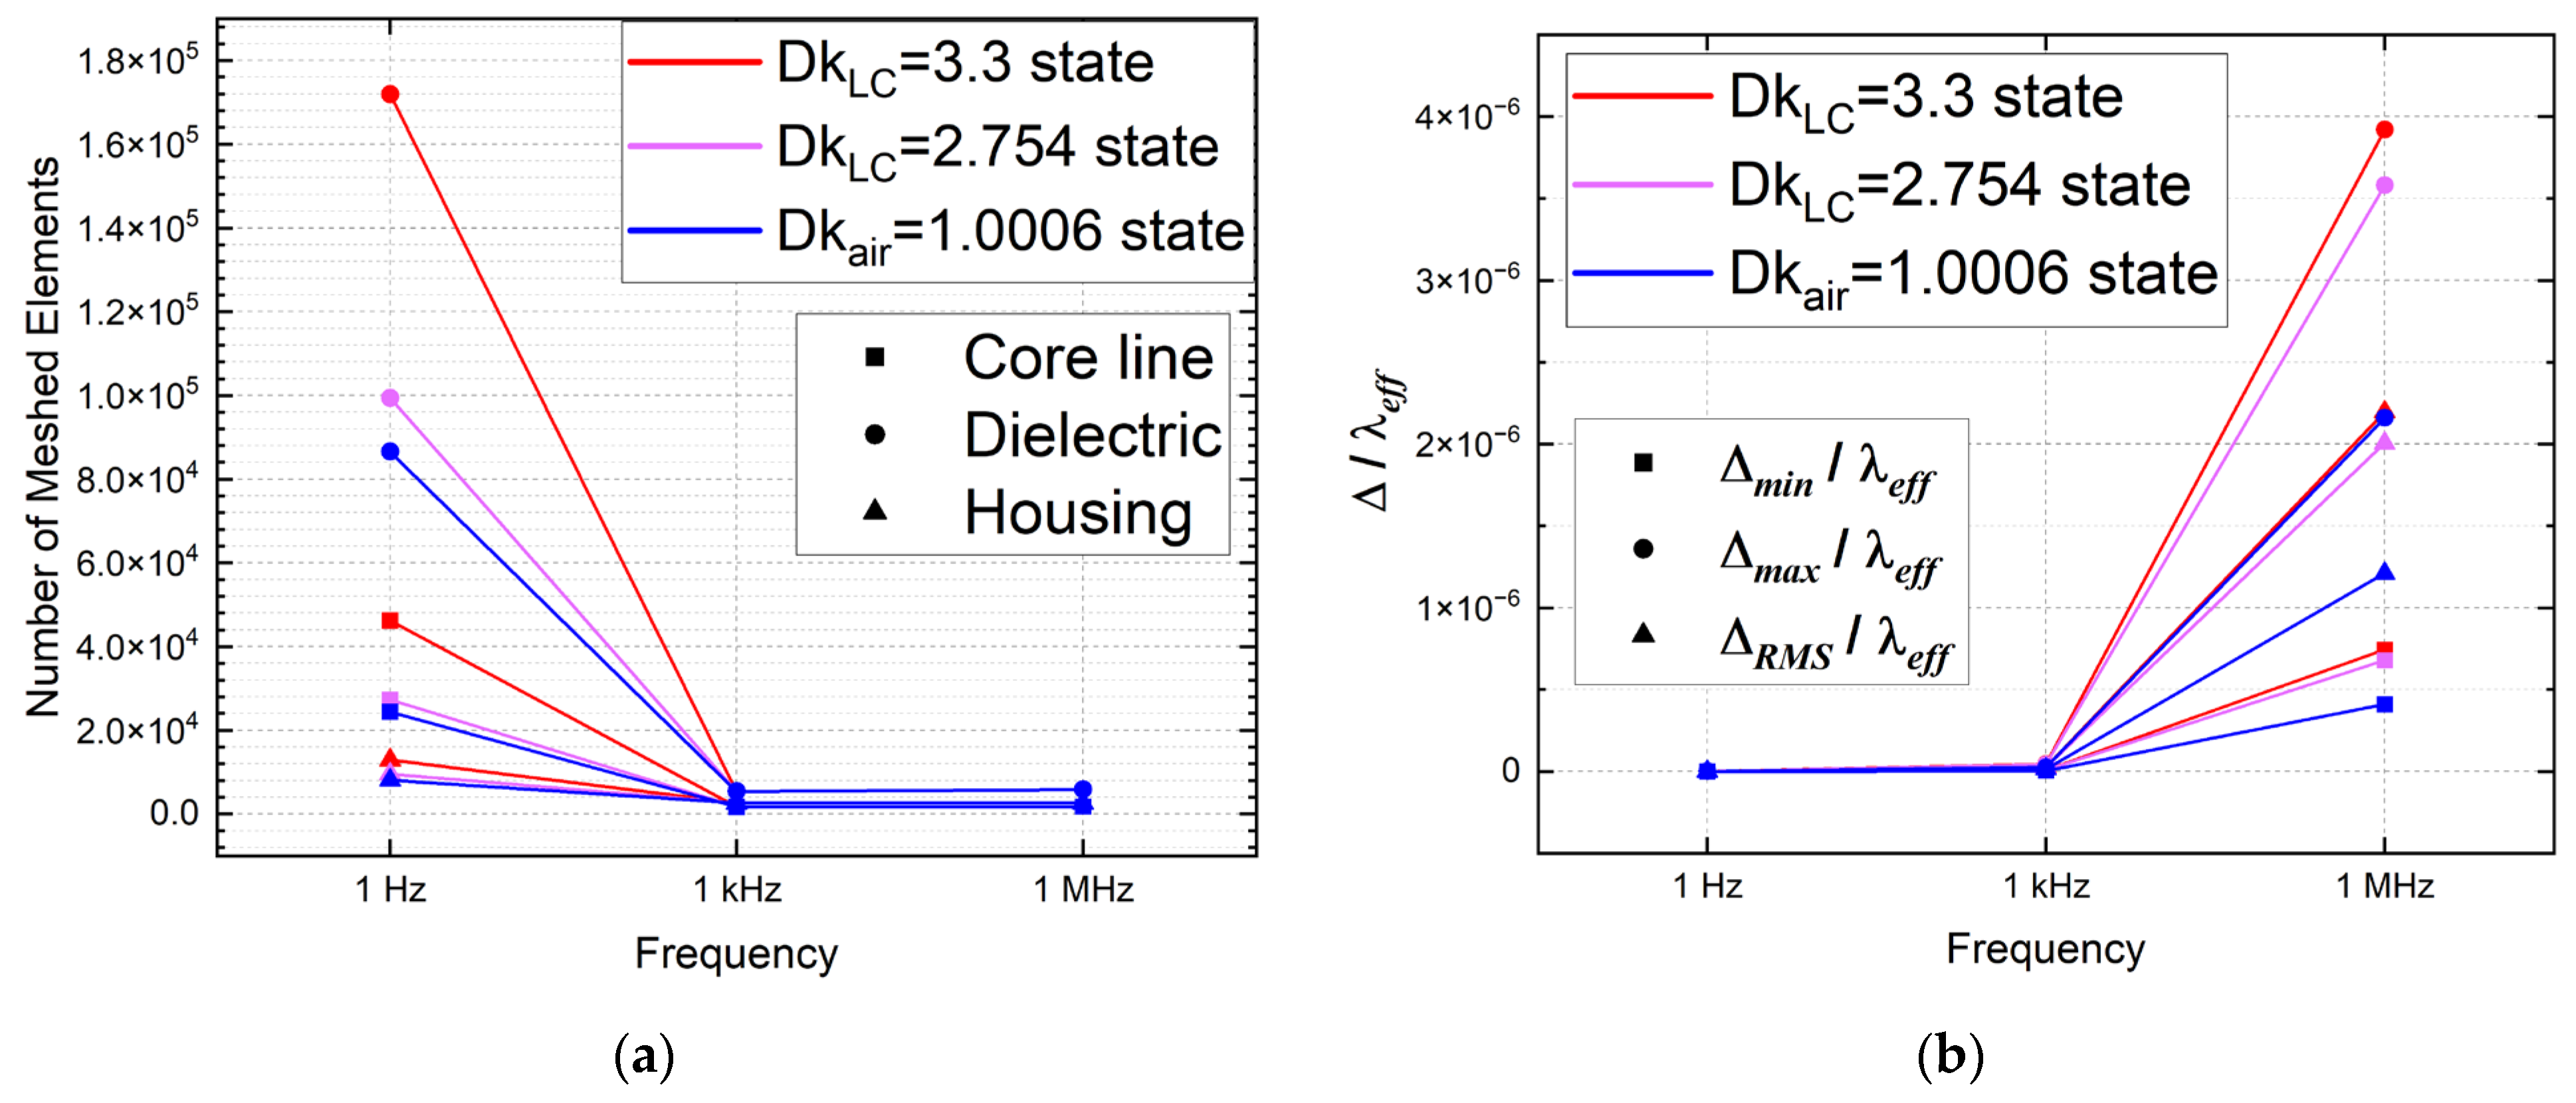
When we plot all three tuning states under analysis in a single graph, Figure 4a illustrates the impact of the filled dielectric constant on the meshing statistics. The results, particularly at 1 Hz, demonstrate that a higher permittivity (e.g., Dk = 3.3) corresponds to a greater number of mesh elements compared to the isotropic LC state with Dk = 2.754 and the air-filled state with Dk = 1.0006. This trend is evident in both volume and surface meshes. Accordingly, the edge sizes of the meshing elements in the LC volume follow the pattern depicted in Figure 4b, with the most pronounced deviations between tuning states observed at 1 MHz.
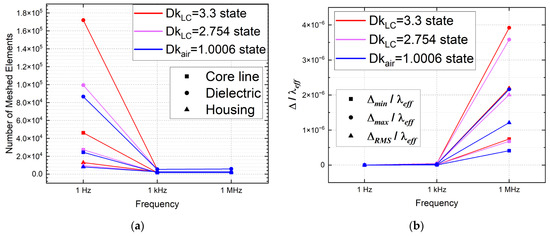
Figure 4.
(a) Frequency-based meshing statistics (number of elements) for metal components (Cu core line and Cu housing) and dielectric material (liquid crystal). (b) Edge sizes of meshing elements in the dielectric volume. Results encompass all three tuning states discussed in this work.
3.2. Errors in Cross-Spectrum Performance Prediction of Cross-Sections
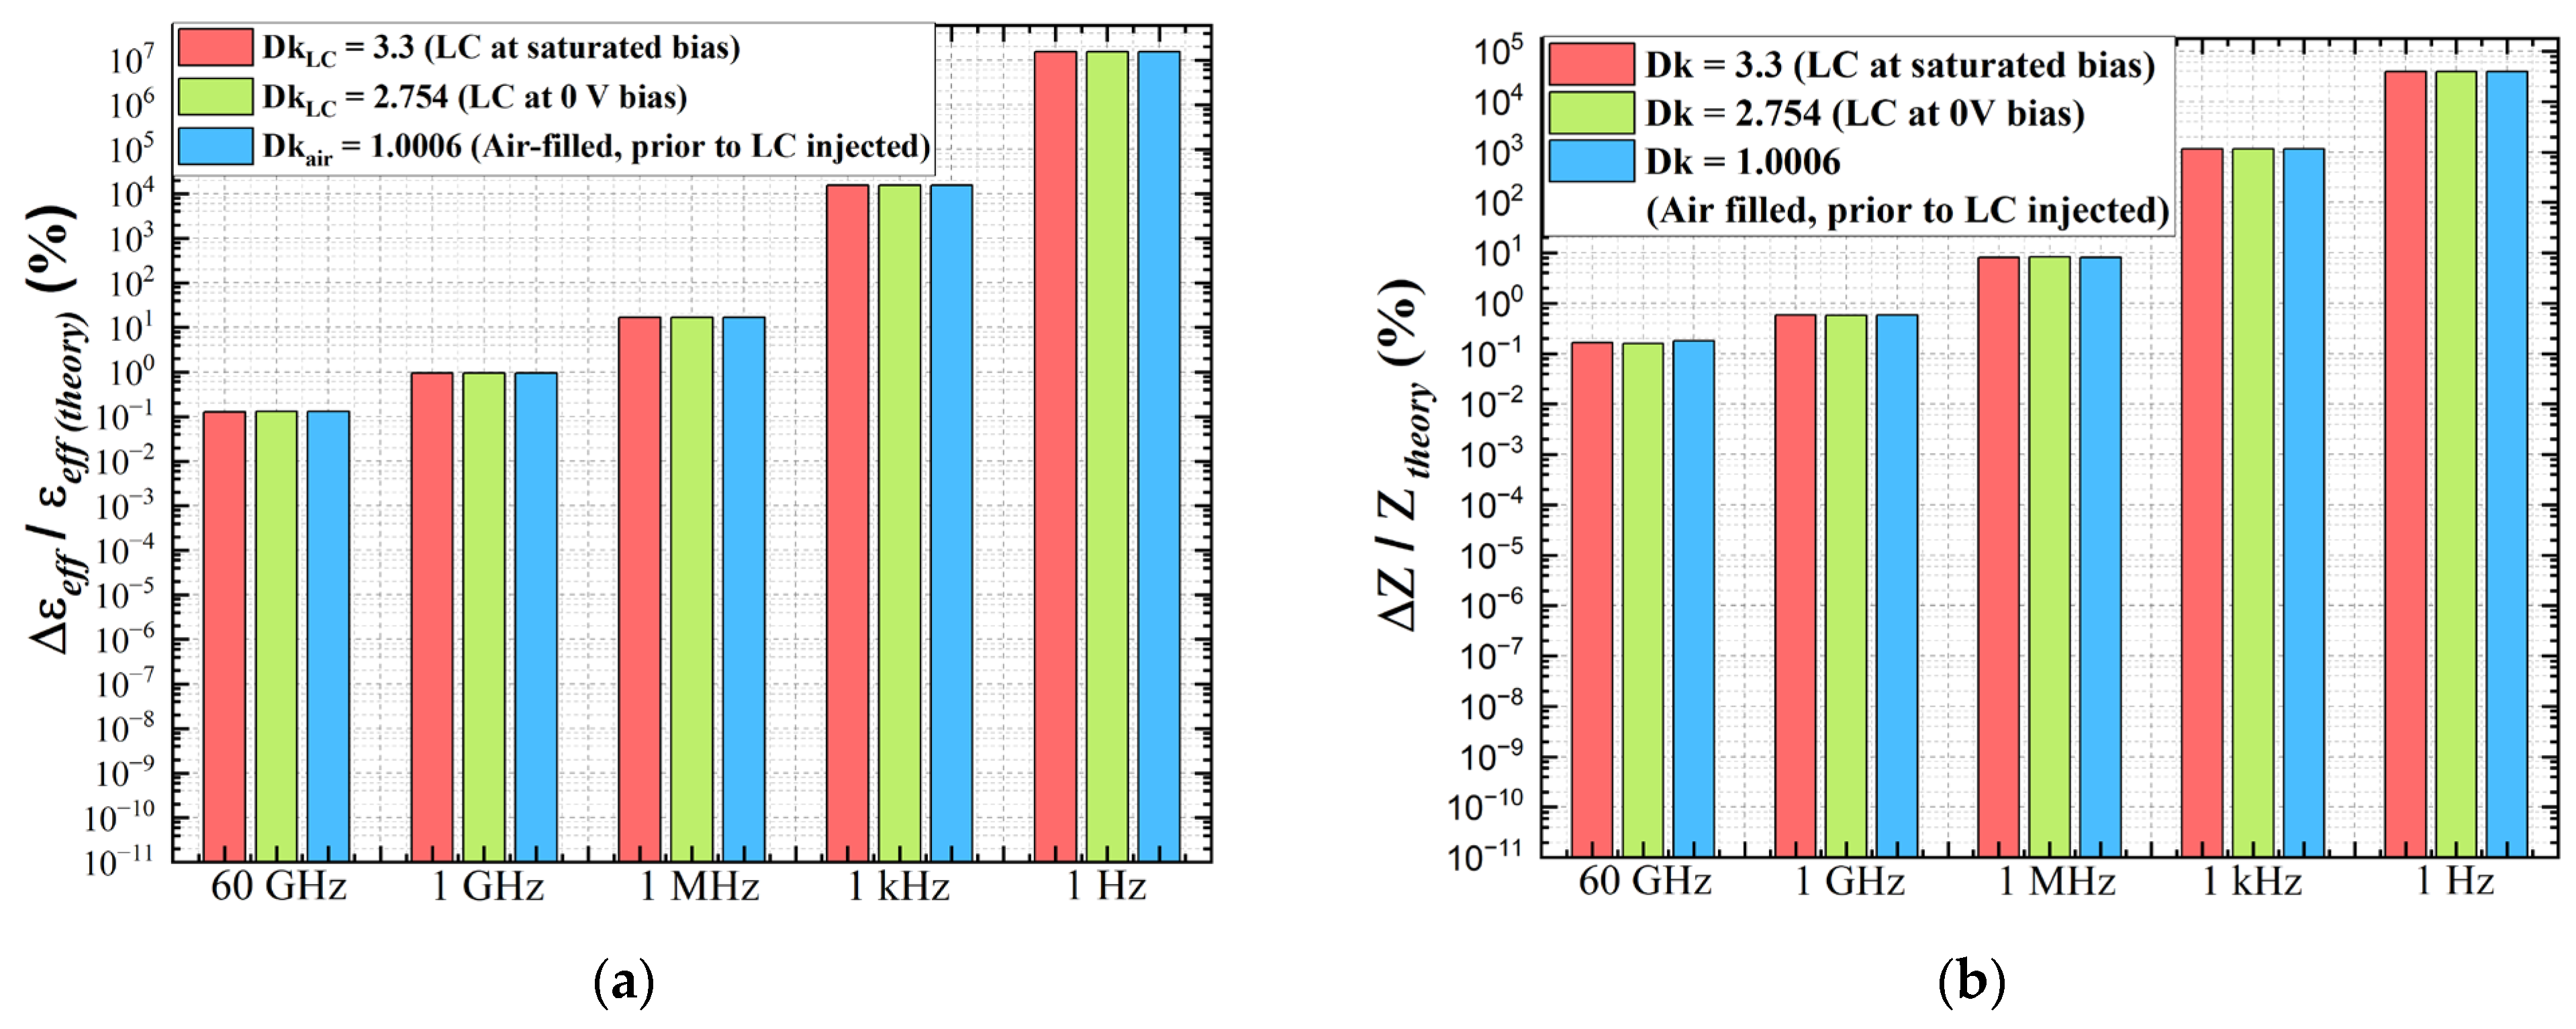
To evaluate the occurrence of low-frequency breakdown (LFB), we incorporate two critical electromagnetic parameters—effective permittivity () in Figure 5a and characteristic impedance (Z) in Figure 5b—into the benchmarking analysis against theoretical values, i.e., and , respectively. The prediction errors for both and Z vary by frequency, generally increasing as the frequency decreases. The most significant increase in errors occurs between 1 MHz and 1 kHz, with errors continuing to rise as the frequency drops further from 1 kHz to 1 Hz. Specifically at 1 kHz, the prediction error in dramatically amounts to the level of 1.5 × %, and the error in Z surges to the level of 1.15 × %. At 1 Hz, the errors further rise to the levels of 1.5 × % and 3.9 × % for and Z, respectively. These results suggest that errors in the computed cross-sectional properties, or modes, propagate into the scattering matrix (S-parameters), which links the input and output modes. However, the dependency of these errors on the tuning states is relatively minor compared to the significant influence of frequency dependency.
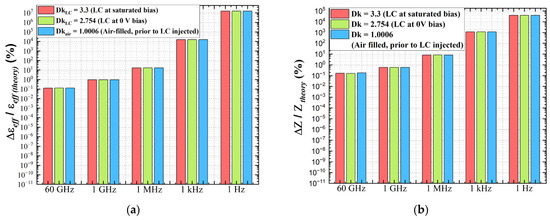
Figure 5.
Errors (percentage) in: (a) the prediction of effective permittivity; (b) the prediction of characteristic impedance, evaluated across three tuning states and at five discrete frequency points. Logarithmic scale applies for both vertical axes.
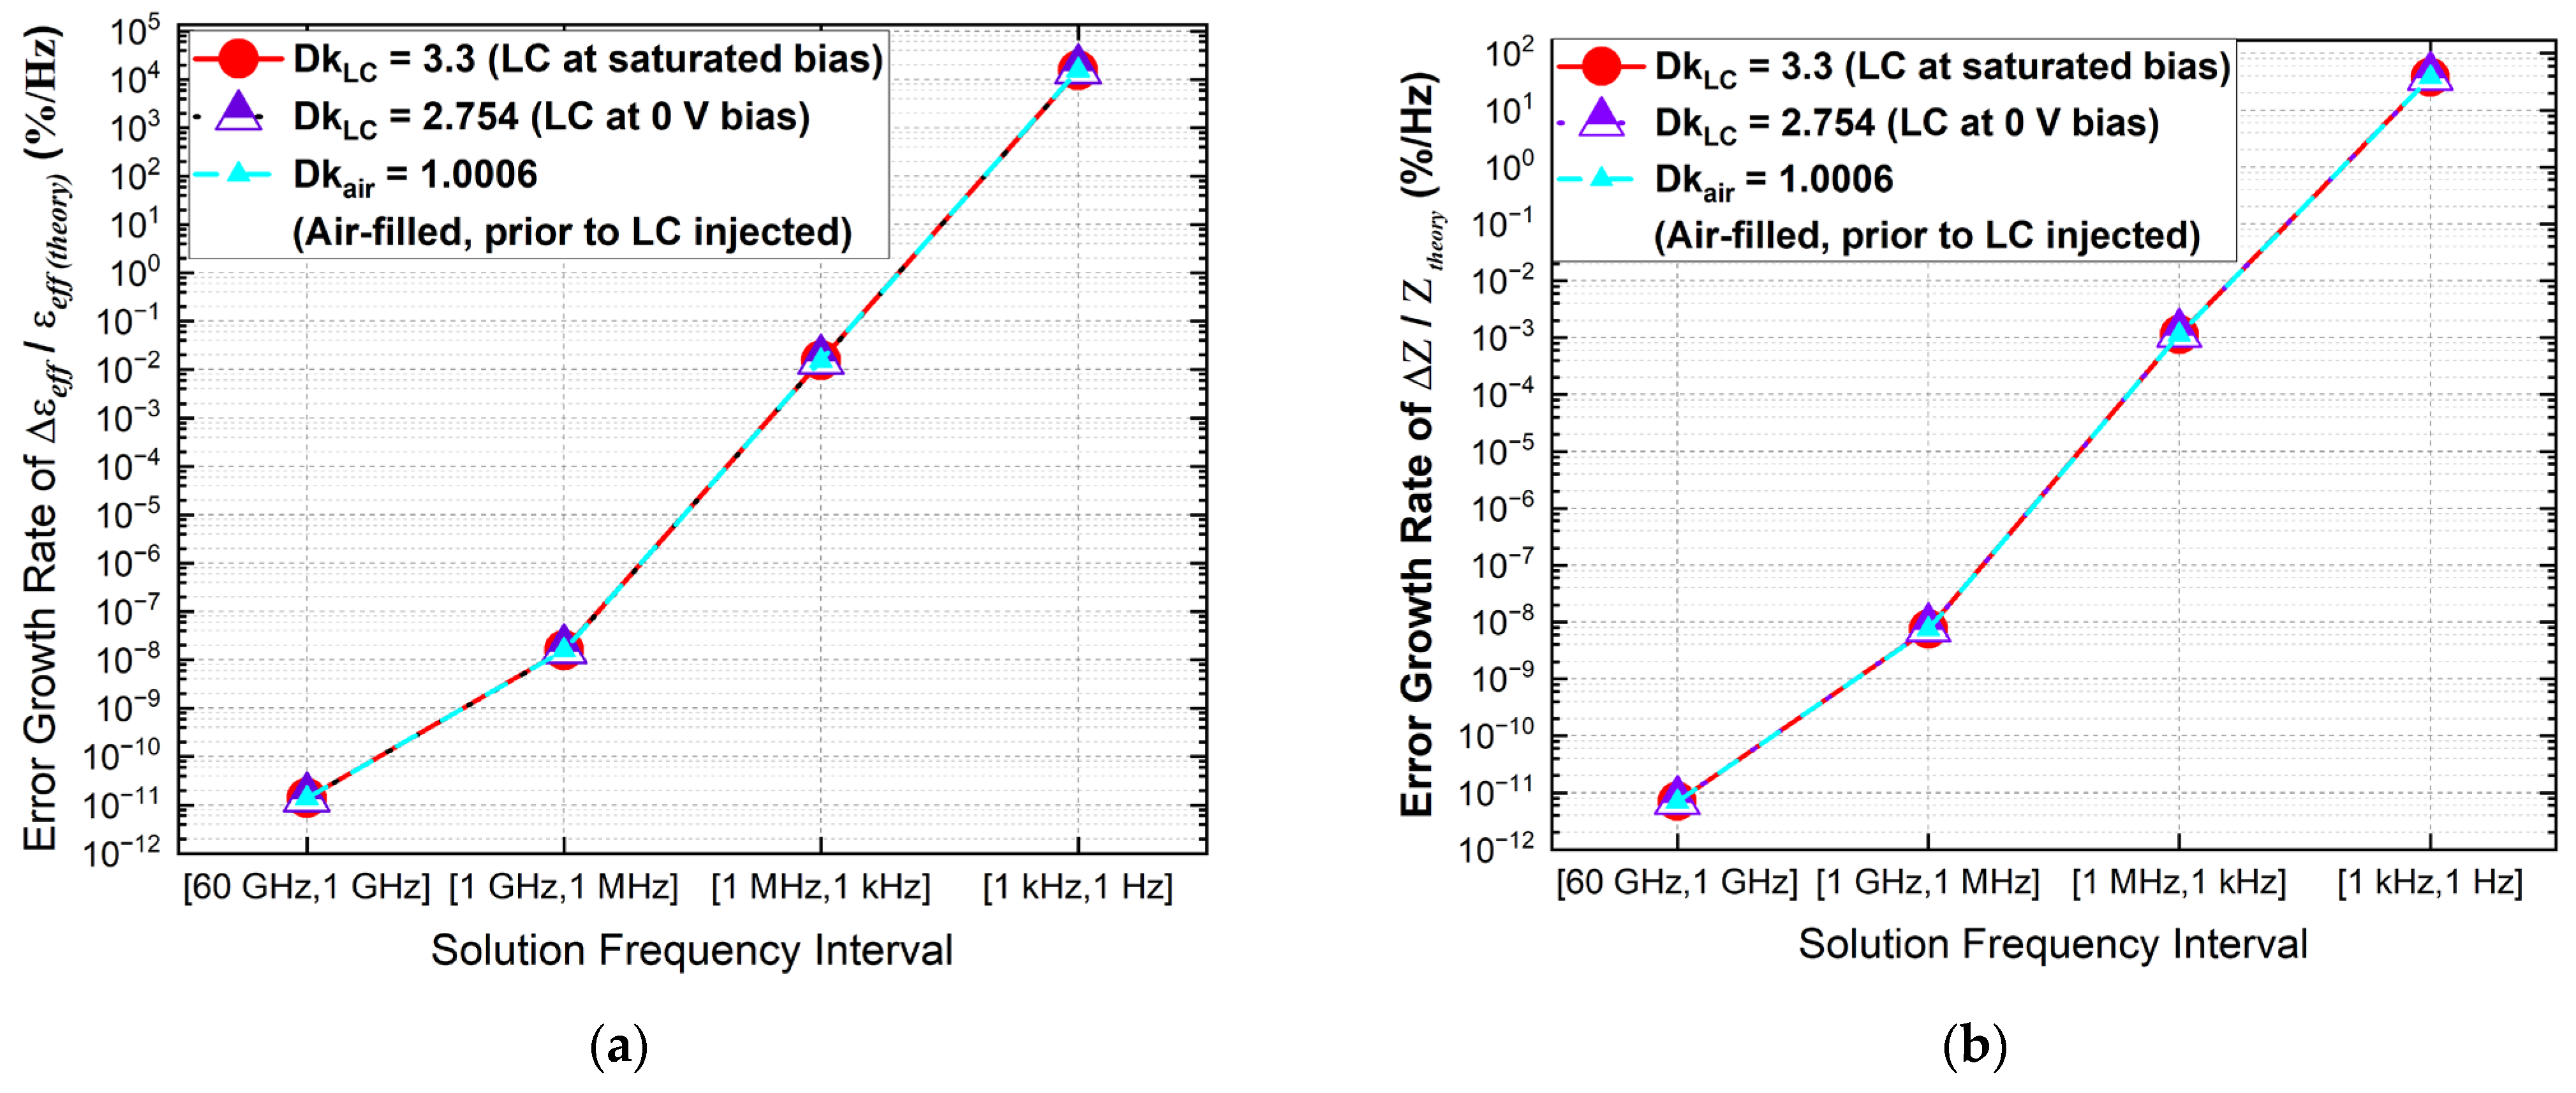
To further investigate the growth pattern of errors in and Z, we processed the data from Figure 5 by subtracting the error percentage at each frequency point from the corresponding value at the adjacent frequency point, and then dividing by the difference between these two frequencies. The resulting error growth rate, expressed as percentage per Hz, is presented in Figure 6. It is important to note that both Figure 5 and Figure 6 employ logarithmic scales on the vertical axes. The patterns observed in these figures further underscore the frequency asymmetry in the susceptibility to low-frequency breakdown (LFB).
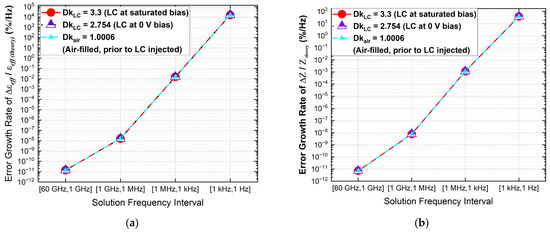
Figure 6.
Error growth pattern (percentage per Hz) in: (a) the prediction of effective permittivity; (b) the prediction of characteristic impedance, evaluated across three tuning states and four frequency intervals between five discrete frequency points. Logarithmic scale applies for both vertical axes.
3.3. Mesh Illustrations
In addition to the meshing statistics comparison presented in Section 3.1, the less vulnerable 1 MHz computation and the more vulnerable 1 Hz case are compared through meshing visualizations (Figure 7) in this section using the same geometry and material (saturated bias state of the same grade of liquid crystal, with a permittivity of 3.3). To facilitate comparison, the 2D view presents a cross-sectional representation of the volumetric mesh in the tunable dielectric region (i.e., the LC), while the 3D view illustrates the meshing detail along the length, including the core line surface mesh at both the input and output wave ports. The surface meshes generated at the housing conductor are made transparent to avoid obscuring the meshing visualization of the LC and core line. Interestingly, in the case of low-frequency breakdown (LFB) at the 1 Hz solution, denser meshes are observed in both the 2D cross-section and the 3D length representations. Quantitatively, the edge sizes of the meshes—including statistics such as minimum, maximum, and root mean square (RMS) values—are compared between the two solving cases at distinct frequencies (i.e., 1 MHz in Figure 8a vs. 1 Hz in Figure 8b).
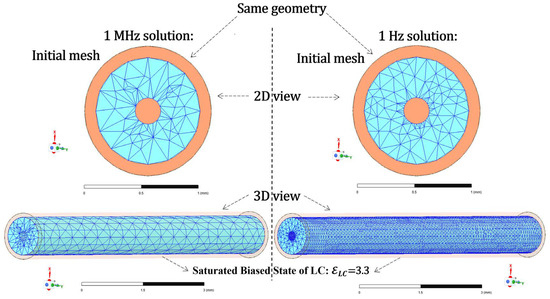
Figure 7.
Initial mesh visualization for single-frequency solutions at two distinct frequencies (1 MHz and 1 Hz), based on the same geometry, including both cross-sectional and longitudinal views.
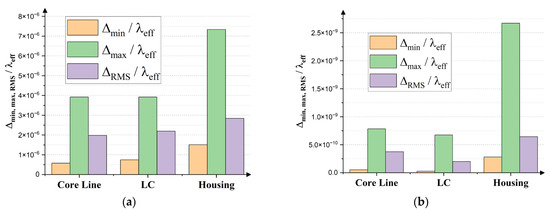
Figure 8.
Edge size statistics of the mesh solved at: (a) 1 MHz; (b) 1 Hz. Results are based on the liquid crystal in a saturated bias state (Dk = 3.3).
Given the significant impact of meshing density on the accuracy of FEM solvers, a future study will involve performing a mesh sensitivity analysis at each critical frequency. This analysis aims to provide further insights into the extent to which meshing influences the observed discrepancies in effective permittivity and characteristic impedance, particularly at lower frequencies.
3.4. Errors in Differential Phase Shift Behavior
The simulated results of the differential phase shift (DPS), a key performance metric of the LC-based phase shifter (calculated between the saturated bias state and the 0 V bias state of the LC), are compared with the theoretical values derived from Equation (3), where f represents the frequency of interest and L is the line length (10 mm, as specified in Table 1). Both the post-processed results, normalized to 50 Ω () and non-normalized (), are presented in Figure 9a. The benchmarking of the errors (∆DPS = ) expressed as a percentage (∆DPS/) is illustrated in Figure 9b.
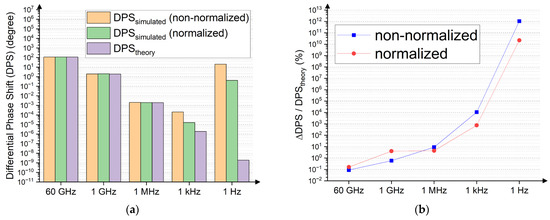
Figure 9.
Results of differential phase shift (DPS) at five discrete frequency points under examination: (a) Comparison of simulated values (both normalized and non-normalized to 50 Ω) with theoretical values; (b) Prediction errors in percentage. Logarithmic scale applied to both vertical axes.
As illustrated by the DPS pattern in Figure 9, the prediction error (using the normalized result as an example) is minimal at 60 GHz, with a value of 0.16%, and begins to become noticeable at 1 MHz with an error of 4.39%, then increases sharply to 743.88% at 1 kHz, and escalates dramatically to 2.18 × % at 1 Hz. The error growth rate, expressed as percentage per Hz, is depicted in Figure 10, highlighting a continuously increasing trend as the frequency decreases from the gigahertz (GHz) range into the low-frequency breakdown (LFB) regime (MHz, kHz, and Hz). These DPS deviation results are consistent with the cross-spectrum performance predictions of the cross-sectional properties presented earlier in Section 3.2 and further demonstrate the frequency-asymmetric error growth pattern in the LFB regime from 1 MHz down to 1 kHz and 1 Hz.
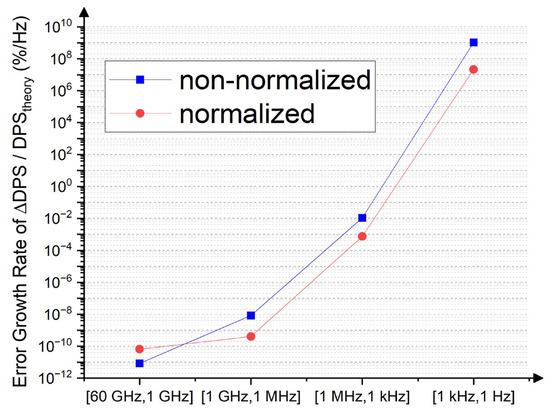
Figure 10.
Error growth pattern (percentage per Hz) in the DPS prediction. Logarithmic scale applies for the vertical axis.
In summary, the results within the low-frequency breakdown (LFB) segment of the spectrum (1 MHz, 1 kHz, and 1 Hz) are considered unreliable and warrant re-evaluation. The computational errors observed in these frequency regimes have significant implications for predicting the impact of the low-frequency LC-biasing field on the cross-sectional properties (effective permittivity and characteristic impedance, as quantified in Section 3.2), as well as on the prediction of the differential phase shift (discussed in Section 3.4). To address this issue and mitigate the risks associated with LFB vulnerability in broadband applications—particularly at frequencies below 1 kHz—it is essential to develop a dedicated low-frequency subroutine. This would not only improve accuracy but also ensure more efficient budgetary control and enhance return on investment. While this presents certain challenges, it also opens up new opportunities for AI-driven multi-source data fusion, offering potential solutions to these limitations.
4. Discussion and Generalizations
Building on the fully encapsulated design of liquid crystal (LC) coaxial phase shifters, which provide noise-shielding advantages for millimeter-wave wideband reconfigurable applications, this study investigates the largely overlooked issue of low-frequency breakdown (LFB) susceptibility in modern full-wave solvers that are primarily designed for high-frequency (e.g., MMW and mmW) electromagnetic simulations. The research specifically examines the vulnerabilities arising from the interaction between tuning states (controlled by bias voltage) and the key components of LC-filled coaxial phase shifters—namely, the core line, grounding structure, and radially positioned tunable dielectrics—across a wide range of frequencies, including millimeter-wave (60 GHz WiGig), microwave (1 GHz), and significantly lower frequency regimes (down to 1 MHz, 1 kHz, and 1 Hz), where long-wavelength or quasi-static conditions prevail. For completeness, the analysis also includes the air-filled state of the device prior to LC injection. The study focuses on essential computational parameters, such as effective permittivity and characteristic impedance. Results demonstrate that at 1 kHz, deviations in effective permittivity exceed four orders of magnitude compared to 1 GHz, while characteristic impedance varies by as much as three orders of magnitude.
It is important to note that the modeling approach presented here carries specific implications due to the exclusive use of a noise-shielded coaxial transmission line configuration for accommodating a single dielectric layer (i.e., LC). Other reconfigurable transmission line or waveguide configurations incorporating LC and other dielectric materials—beyond the coaxial structure examined in this study—may yield different levels of low-frequency band (LFB)-induced errors, contingent upon their structural variations.
4.1. Analysis of Root Causes and Associated Complexities
Partial differential equations (PDEs) and integral equations (IEs) form the fundamental mathematical frameworks for electromagnetism and its applications in the modern information age. This section seeks to identify the root cause of low-frequency breakdown (LFB) in PDE-based methods, particularly in the finite element method (FEM) approaches used for analyzing LC-filled coaxial phase shifters in this work. The analysis aims to clarify the source of LFB-induced errors and provide a pathway for improving mathematical-physical models. By pinpointing these LFB sources, this work also supports future development of FEM-based solutions and other computational techniques that can mitigate these errors, offering insights that are valuable for tool selection and adaptation in similar applications, and assisting designers who may face uncertainty regarding which method is optimal for minimizing LFB-induced inaccuracies in LC device simulations.
Figure 11 outlines the characteristics of LFB specific to the Galerkin FEM solution, where ω denotes the angular frequency, S is the stiffness matrix (coefficient matrix), T is the mass matrix, R is the conductivity-related mass matrix, and b is the excitation vector. (See Appendix A for detailed mathematical formulations [37]). The matrix norm is represented by the function ‖·‖ and is used to assess LFB ratios. The discussion encompasses three cases: a purely lossless system, a lossy system within good conductors, and a generally lossy system (with non-ideal dielectrics and conductors), as examined in this work using the LC-filled coaxial phase shifter.
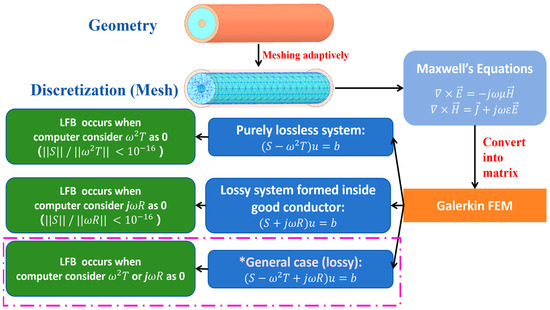
Figure 11.
Conceptual framework for low-frequency breakdown (LFB).
LFB arises when the angular frequency (ω) becomes sufficiently small, causing the frequency-dependent terms jωR or ω2T to diminish to a level indistinguishable from zero due to finite machine precision [37,38]. This leads the computer to treat these terms as zero, resulting in incorrect solutions to the matrix Equation (A1) outlined in Appendix A.
As the frequency decreases from higher ranges (millimeter-wave and microwave) to the low-frequency breakdown (LFB) regime, two previously unrecognized computational complexities emerge. First, the penetration depth inside conductors increases, becoming comparable to or larger than the conductor’s dimensions, which necessitates meshing within the conductors. Second, the frequency dependencies of the solutions differ significantly between the lossy dielectric (LC) and the lossy conductor (Cu). An additional avenue for future research involves examining the impact of workstation or server configurations on LFB. It is crucial to assess whether utilizing alternative computing setups, such as dedicated high-performance computing clusters, can improve or reduce prediction accuracy in these scenarios. Furthermore, conducting a cross-solver benchmark, i.e., testing the same LC-based coaxial structures using different FEM or hybrid solvers, could add robustness to the findings by showing whether these LFB issues persist across various solver architectures.
4.2. Implications for Next-Generation B5G/6G Communication-Sensing Integrated Platforms
Mixed-signals sensor fusion has garnered significant attention over the past decade due to its wide-ranging applications in advanced driver assistance systems (ADAS) [50,51], the Internet of Things (IoT) [22,23,24], satellite internet [9,47], and beyond [52,53,54,55]. Fundamentally, these sensors (e.g., mmWave radars, LiDARs, cameras, ultrasonic sensors, infrared sensors, THz sensors, etc.) operate at different frequencies (wavelengths). As we move into the era of beyond 5G (B5G) and 6G, the demand for sensor fusion is expected to grow, driven by the increasing need for advanced functionalities and the transformative advancements in optical and quantum (entangled) networks [56,57]. This progression imposes increasingly stringent requirements for a low-power, low-profile, small-footprint, cost-effective, and low-complexity ecosystem that can reliably orchestrate multi-wavelength devices, both hardware and software, with resilience and sustainability.
Designing a controlled distribution system that integrates distributed sensor networks of multi-frequency, multi-scale nature is a complex challenge. It involves specific, wavelength-dependent approaches due to the intricate dynamics of grids operating across diverse spatial and temporal scales. Moreover, integrating this mixed signals-embedded system with supporting infrastructure introduces additional layers of complexity. To address these challenges, research and development efforts at both the component and system levels are essential for creating an efficient and effective controlled distribution system. One promising solution is the use of reconfigurable [58,59,60,61,62] devices and components (e.g., the LC-based devices examined in this study), which allow for on-demand reconfiguration of wavelength-specific functionalities. This is achieved by real-time tuning of external stimuli to which the materials respond, such as electric fields (voltage), magnetic fields (current), temperature, pressure, light (polarization and intensity), humidity, and other chemical environmental variations. Precise computational characterization across a broad frequency range is crucial for the successful implementation of such systems. The LFB issue identified and quantified in this work is a key step toward achieving the roadmap objectives outlined for the field.
Given that the major focus of the current work is from the lens of computational electromagnetics, a practical limitation of the present LFB analysis is the omission of potential interference effects arising from electrical instrumentation—specifically, the low-frequency voltage bias field (e.g., ~1 kHz for LC reorientation) that may electromagnetically couple with the transmitted signal when its frequency approaches that of the LC biasing field (in the Hz or kHz range). This crosstalk introduces an additional layer of LFB susceptibility, suggesting the need for experimental investigations into more rigorous frequency-decoupling (filtering) techniques. Conventional three-port bias-tee solutions for MW–DC decoupling, as used in previous work [63], may be insufficient in separating these closely spaced frequencies. A practical solution to mitigate this issue at low-frequency operations could involve replacing the electronic biasing with a magnetic biasing scheme, making it worthwhile exploring alternative transmission line configurations, such as substrate-integrated waveguides [64], in future research.
5. Conclusions
A significant number of microwave researchers are at the forefront of innovation in terahertz (THz) electronics, engaged in projects that push the boundaries of next-generation wireless systems, remote sensing, and space terahertz instrumentation. While the transition from microwave (MW) to millimeter-wave (mmW) and THz frequencies is numerically substantiated through geometric design to avoid higher-order modes, the computational justification for frequency downscaling (i.e., increasing wavelength) remains less clear in mainstream full-wave simulators. This raises concerns about potential low-frequency breakdown (LFB) issues in the simulation of the new family of liquid crystal (LC) coaxial models, which are designed for MW and mmW wavelengths and which are electrically biased at extremely low frequencies (ELF).
Although LFB has been extensively studied in the context of integral equations (IE), research on its implications for methods solving partial differential equations (PDE), particularly in finite element method (FEM)-based simulators for LC-based reconfigurable devices, is notably scarce. This paper addresses this gap by presenting a novel investigation through a comprehensive series of computational studies focused on the LFB phenomenon in LC-enabled reconfigurable delay lines structured in a classic coaxial topology, utilizing the widely recognized FEM solver, HFSS.
The findings from this broadband computational analysis reveal a frequency-asymmetric error growth pattern in the LFB regime, highlighting the critical importance of selecting and optimizing meshing parameters [65,66] to accurately capture intricate electromagnetic behavior across varying frequency ranges and material properties. Such optimization is essential for ensuring stable operation and improved yield. This comparative analysis enhances the fidelity and accuracy of electromagnetic simulations, thereby advancing our understanding and capabilities in designing and optimizing complex systems characterized by a delicate balance between computational resource utilization (memory and time) and precision, particularly concerning anisotropic LC-based dielectric tuning.
Building on the advancements observed in this study of LC-based coaxial phase shifters at V-band (60 GHz), 1 GHz, 1 MHz, 1 kHz, and 1 Hz, we anticipate scalable deployment for intermediate frequencies. Future work will focus on precisely identifying the low-frequency breakdown point and associated transition regimes, extending beyond the five discrete frequencies examined in this study. Addressing this scientific gap is vital for advancing LC-integrated microwave, millimeter-wave, and terahertz research.
Moreover, the implications of this research can be generalized to other transmission line configurations utilizing LC beyond the coaxial design discussed here; however, the degree of LFB-induced errors (deviations) varies across different structures. Several factors influence these errors, with solution frequency being the most prominent, followed by tuning states (i.e., the variable dielectric constant). Importantly, the identification of the computational limit, specifically the lower-frequency computation limit, does not reflect the performance limit of the device itself. Given that the coaxial-structured device operates in the transverse electromagnetic (TEM) mode, concerns about low-frequency malfunctioning of a mmW-designed geometry are minimal. Instead, the LFB-induced errors identified in this work underscore the limitations of the computational tools employed by many researchers to predict and design devices. In essence, numerical predictions in the vulnerable LFB regime may significantly underestimate device performance, resulting in false-positive assessments of the device’s capabilities.
These insights and conclusions provide a robust foundation for designers and engineers dedicated to advancing reconfigurable devices based on LC technology. They pave the way for applications across a broad frequency spectrum, ranging from extremely low frequencies (e.g., 1 Hz to 1 kHz for submarine underwater communications [36,67,68], sensor networks [69], as well as seismic studies [70,71]) to millimeter-wave (mmW) and even sub-millimeter-wave frequencies, targeting 5G/6G communications.
Author Contributions
Conceptualization and methodology, J.L.; software, H.L.; validation and formal analysis, J.L. and H.L.; investigation and data curation, J.L. and H.L.; writing—original draft preparation, J.L. and H.L.; writing—review and editing, J.L.; visualization, J.L. and H.L.; supervision, J.L.; project administration and funding acquisition, J.L. All authors have read and agreed to the published version of the manuscript.
Funding
This research was funded by the National Natural Science Foundation of China, grant number 62301043, as well as the Fundamental Research Funds for the Central Universities (Beijing Institute of Technology Research Fund Program for Young Scholars), grant number 220502052024011.
Data Availability Statement
Data are available upon request from the corresponding author.
Conflicts of Interest
The authors declare no conflicts of interest. The funders had no role in the design of the study; in the collection, analyses, or interpretation of data; in the writing of the manuscript; or in the decision to publish the results.
Abbreviations
The nomenclature and corresponding abbreviations used in this paper are listed below.
| Nomenclatures | Abbreviations |
| Low-frequency breakdown | LFB |
| Cross-section | XS |
| Liquid crystal | LC |
| Liquid crystal thickness | TLC |
| Core line diameter | Dcore |
| Length | L |
| Polyimide | PI |
| Direct current | DC |
| Alternating current | AC |
| Extremely low frequency | ELF |
| Super low frequency | SLF |
| Ultra-low frequency | ULF |
| Microwave-wave | MW |
| Millimeter-wave | mmW |
| Electromagnetic interference | EMI |
| Kilometer | km |
| Megameter | Mm |
| Gigahertz | GHz |
| Terahertz | THz |
| Root mean square | RMS |
| Scattering parameters | S parameters |
| Forward transmission coefficient | S21 |
| Forward reflection coefficient | S11 |
| Characteristic impedance | ZC |
| Differential phase shift | DPS |
| Dielectric constant | Dk |
| Dissipation factor | DF |
| Effective permittivity | |
| Effective wavelength | |
| Two dimensional | 2D |
| Three dimensional | 3D |
| Fifth-generation wireless | 5G |
| Sixth-generation wireless | 6G |
| Wireless Gigabit | WiGig |
| Advanced driver assistance systems | ADAS |
| Light detection and ranging | LiDAR |
| Internet of Things | IoT |
| Internet of Nano-Things | IoNT |
| Finite-element method | FEM |
| High-frequency structure simulator | HFSS |
| High-performance computing | HPC |
| Partial-differential equation | PDE |
| Integral equation | IE |
| Artificial intelligence | AI |
Appendix A
Applying the mathematical framework from [37] to the analysis presented in this study, the matrix equation governing the FEM analysis of a general case involving both inhomogeneous dielectric materials and non-ideal conductors is provided in Equation (A1).
where ω is the angular frequency, and A(ω) is defined by Equation (A2) in accordance with the finite element method (FEM) solution to Maxwell’s equations, subject to either Dirichlet or Neumann boundary conditions.
where S is the stiffness matrix (coefficient matrix) defined by Equation (A3), T is the mass matrix specified in Equation (A4), R is the conductivity-related mass matrix described in Equation (A5), and b is the excitation vector presented in Equation (A6).
wherein represents the contribution from an element, is the normalized vector basis function for the electric field expansion, and ε represent permeability and permittivity, respectively, denotes conductivity, and represents the current density.
References
- Boyarsky, M.; Sleasman, T.; Imani, M.F.; Gollub, J.N.; Smith, D.R. Electronically steered metasurface antenna. Sci. Rep. 2021, 11, 4693. [Google Scholar] [CrossRef] [PubMed]
- Mumcu, G.; Kacar, M.; Mendoza, J. Mm-Wave Beam Steering Antenna with Reduced Hardware Complexity Using Lens Antenna Subarrays. IEEE Antennas Wirel. Propag. Lett. 2018, 17, 1603–1607. [Google Scholar] [CrossRef]
- Nikfalazar, M.; Sazegar, M.; Mehmood, A.; Wiens, A.; Friederich, A.; Maune, H. Two-Dimensional Beam-Steering Phased-Array Antenna With Compact Tunable Phase Shifter Based on BST Thick Films. IEEE Antennas Wirel. Propag. Lett. 2017, 16, 585–588. [Google Scholar] [CrossRef]
- Ali, M.; Guzmán, R.C.; Muñoz, L.E.G.; Dijk, F.V.; Carpintero, G. Photonics-Enabled Millimetre-Wave Phased-Array Antenna with True Time Delay Beam-Steering. In Proceedings of the 2020 50th European Microwave Conference (EuMC), Utrecht, The Netherlands, 12–14 January 2021; pp. 316–319. [Google Scholar]
- Yang, D.H.; Lin, W.P. Phased-array beam steering using optical true time delay technique. Opt. Commun. 2015, 350, 90–96. [Google Scholar] [CrossRef]
- Wymeersch, H.; Saleh, S.; Nimr, A. Joint Communication and Sensing for 6G—A Cross-Layer Perspective. In Proceedings of the 2024 IEEE 4th International Symposium on Joint Communications & Sensing (JC&S), Leuven, Belgium, 19–21 March 2024; pp. 1–6. [Google Scholar]
- Abdulkarim, Y.I.; Alkurt, F.Ö.; Bakır, M.; Awl, H.N.; Muhammadsharif, F.F.; Karaaslan, M.; Appasani, B.; Badri, K.S.L.A.; Zhu, Y.Y.; Dong, J. A polarization-insensitive triple-band perfect metamaterial absorber incorporating ZnSe for terahertz sensing. J. Opt. 2022, 24, 105102. [Google Scholar] [CrossRef]
- Zhang, J.A.; Rahman, M.L.; Wu, K.; Huang, X.J.; Guo, Y.J.; Chen, S.Z. Enabling Joint Communication and Radar Sensing in Mobile Networks—A Survey. IEEE Commun. Surv. Tutor. 2022, 24, 306–345. [Google Scholar] [CrossRef]
- Abdalmalak, K.A.; Botello, G.S.; Suresh, M.I.; Falcón-Gómez, E.; Lavado, A.R.; García-Muñoz, L.E. An Integrated Millimeter-Wave Satellite Radiometer Working at Room-Temperature with High Photon Conversion Efficiency. Sensors 2022, 22, 2400. [Google Scholar] [CrossRef]
- Delamotte, T.; Schraml, M.G.; Schwarz, R.T.; Storek, K.U.; Knopp, A. Multi-Antenna-Enabled 6G Satellite Systems: Roadmap, Challenges and Opportunities. In Proceedings of the 25th International ITG Workshop on Smart Antennas, French Riviera, France, 10–12 November 2021; pp. 1–6. [Google Scholar]
- Maduranga, M.W.P.; Tilwari, V.; Rathnayake, R.M.M.R.; Sandamini, C. AI-Enabled 6G Internet of Things: Opportunities, Key Technologies, Challenges, and Future Directions. Telecom 2024, 5, 804–822. [Google Scholar] [CrossRef]
- Gimenez, S.; Roger, S.; Baracca, P.; Martín-Sacristán, D.; Monserrat, J.F.; Braun, V.; Halbauer, H. Performance Evaluation of Analog Beamforming with Hardware Impairments for mmW Massive MIMO Communication in an Urban Scenario. Sensors 2016, 16, 1555. [Google Scholar] [CrossRef]
- Cahoon, N.; Srinivasan, P.; Guarin, F. 6G Roadmap for Semiconductor Technologies: Challenges and Advances. In Proceedings of the 2022 IEEE International Reliability Physics Symposium (IRPS), Dallas, TX, USA, 27–31 March 2022; pp. 11B.1-1–11B.1-9. [Google Scholar]
- Ragonese, E. Design Techniques for Low-Voltage RF/mm-Wave Circuits in Nanometer CMOS Technologies. Appl. Sci. 2022, 12, 2103. [Google Scholar] [CrossRef]
- Lavado, A.R.; Muñoz, L.E.G.; Lioubtchenko, D.; Preu, S.; Abdalmalak, K.A.; Botello, G.S.; Vargas, D.S.; Räisänen, A.V. Planar Lens–Based Ultra-Wideband Dielectric Rod Waveguide Antenna for Tunable THz and Sub-THz Photomixer Sources. J. Infrared Milli. Terahz. Waves 2019, 40, 838–855. [Google Scholar] [CrossRef]
- Li, J.; Li, H. Modeling 0.3 THz Coaxial Single-Mode Phase Shifter Designs in Liquid Crystals with Constitutive Loss Quantifications. Crystals 2024, 14, 364. [Google Scholar] [CrossRef]
- Jakoby, R.; Gaebler, A.; Weickhmann, C. Microwave liquid crystal enabling technology for electronically steerable antennas in SATCOM and 5G millimeter-wave systems. Crystals 2020, 10, 514. [Google Scholar] [CrossRef]
- Garbovskiy, Y.; Zagorodnii, V.; Krivosik, P.; Lovejoy, J.; Camley, R.E.; Celinski, Z.; Glushchenko, A.; Dziaduszek, J.; Dąbrowski, R. Liquid crystal phase shifters at millimetre wave frequencies. J. Appl. Phys. 2012, 111, 054504. [Google Scholar] [CrossRef]
- Li, J.; Chu, D. Liquid Crystal-Based Enclosed Coplanar Waveguide Phase Shifter for 54–66 GHz Applications. Crystals 2019, 9, 650. [Google Scholar] [CrossRef]
- Kim, D.; Kim, K.; Saeed, M.H.; Choi, S.; Na, J.H. Fast Reconfigurable Phase Shifter Based on a Chiral Liquid Crystal Configuration. IEEE Access 2023, 11, 60817–60826. [Google Scholar] [CrossRef]
- White, J.F. Diode Phase Shifters for Array Antennas. IEEE Trans. Microw. Theory Tech. 1974, 22, 658–674. [Google Scholar] [CrossRef]
- Massoni, E.; Desmarres, D.; Ezzeddineet, H.; Sittler, F.; Thomas, S.C.; Benoit-Gonin, J.; Tosetti, E.; Moscatelli, A.; Di Paola, N.; Lemarchand, O. An Integrated Passive Device RF Front-End for Narrow-Band Internet-of-Things Modules. In Proceedings of the 2021 IEEE MTT-S International Microwave Filter Workshop (IMFW), Perugia, Italy, 17–19 November 2021; pp. 221–223. [Google Scholar]
- Ballo, A.; Grasso, A.D.; Palumbo, G. Very-Low-Voltage Charge Pump Topologies for IoT Applications. IEEE Trans. Circuits Syst. I Regul. Pap. 2023, 70, 2283–2292. [Google Scholar] [CrossRef]
- Bozzi, M.; Moscato, S.; Silvestri, L.; Massoni, E.; Delmonte, N.; Rocco, G.M. Novel materials and fabrication technologies for SIW components for the Internet of Things. In Proceedings of the 2016 IEEE International Workshop on Electromagnetics: Applications and Student Innovation Competition (iWEM), Nanjing, China, 16–18 May 2016; pp. 1–3. [Google Scholar]
- Sala, R.D.; Centurelli, F.; Scotti, G.; Palumbo, G. Rail to Rail ICMR and High Performance ULV Standard-Cell-Based Comparator for Biomedical and IoT Applications. IEEE Access 2024, 12, 4642–4659. [Google Scholar] [CrossRef]
- Alabdulatif, A.; Thilakarathne, N.N.; Lawal, Z.K.; Fahim, K.E.; Zakari, R.Y. Internet of Nano-Things (IoNT): A Comprehensive Review from Architecture to Security and Privacy Challenges. Sensors 2023, 23, 2807. [Google Scholar] [CrossRef]
- Liakos, K.G.; Georgakilas, G.K.; Plessas, F.C.; Kitsos, P. GAINESIS: Generative Artificial Intelligence NEtlists SynthesIS. Electronics 2022, 11, 245. [Google Scholar] [CrossRef]
- Pantoli, L.; Leoni, A.; Marinković, Z. Calibration Strategy for Tunable Devices Based on Artificial Neural Network Modelling. In Proceedings of the 2020 5th International Conference on Smart and Sustainable Technologies (SpliTech), Split, Croatia, 23–26 September 2020; pp. 1–3. [Google Scholar]
- Kalapothas, S.; Flamis, G.; Kitsos, P. Efficient Edge-AI Application Deployment for FPGAs. Information 2022, 13, 279. [Google Scholar] [CrossRef]
- Li, J. Machine Learning and Digital Twinning Enabled Liquid Crystals mm-Wave Reconfigurable Devices Design and Systems Operation. In Proceedings of the 2022 IEEE MTT-S International Microwave Workshop Series on Advanced Materials and Processes for RF and THz Applications (IMWS-AMP), Guangzhou, China, 27–29 November 2022; pp. 1–3. [Google Scholar]
- Weil, C.; Luessem, G.; Jakoby, R. Tunable inverted-microstrip phase shifter device using nematic liquid crystals. In Proceedings of the 2002 IEEE MTT-S International Microwave Symposium Digest, Seattle, WA, USA, 2–7 June 2002; pp. 367–371. [Google Scholar]
- Li, J. Rethinking Liquid Crystal Tunable Phase Shifter Design with Inverted Microstrip Lines at 1–67 GHz by Dissipative Loss Analysis. Electronics 2023, 12, 421. [Google Scholar] [CrossRef]
- Althuwayb, A.A. The Dilemma of Resolving the Low-Frequency Breakdown Problem in Microwave Components via Traditional and Improved Finite-Element Time-Domain Techniques. IEEE Access 2022, 10, 42171–42180. [Google Scholar] [CrossRef]
- Zhu, J.; Jiao, D. A Theoretically Rigorous Full-Wave Finite-Element-Based Solution of Maxwell’s Equations From dc to High Frequencies. IEEE Trans. Adv. Packag. 2010, 33, 1043–1050. [Google Scholar] [CrossRef]
- Moore, R.K. Radio communication in the sea. IEEE Spectr. 1967, 4, 42–51. [Google Scholar] [CrossRef]
- Turner, R.W. Submarine Communication Antenna Systems. Proc. Ire 2007, 47, 735–739. [Google Scholar] [CrossRef]
- Zhu, J.; Jiao, D. A Rigorous Solution to the Low-Frequency Breakdown in Full-Wave Finite-Element-Based Analysis of General Problems Involving Inhomogeneous Lossless/Lossy Dielectrics and Nonideal Conductors. IEEE Trans. Microw. Theory Tech. 2011, 59, 3294–3306. [Google Scholar] [CrossRef]
- Zhu, J.; Jiao, D. Fast Full-Wave Solution That Eliminates the Low-Frequency Breakdown Problem in a Reduced System of Order One. IEEE Trans. Compon. Packag. Manuf. Technol. 2012, 2, 1871–1881. [Google Scholar]
- Zhu, J.; Omar, S.; Jiao, D. Solution of the Electric Field Integral Equation When It Breaks Down. IEEE Trans. Antennas Propag. 2014, 62, 4122–4134. [Google Scholar] [CrossRef]
- Qian, Z.G.; Chew, W.C. An augmented electric field integral equation for high-speed interconnect analysis. Microw. Opt. Technol. Lett. 2008, 50, 2658–2662. [Google Scholar] [CrossRef]
- Qian, Z.G.; Chew, W.C. A quantitative study on the low frequency breakdown of EFIE. Microw. Opt. Technol. Lett. 2008, 50, 1159–1162. [Google Scholar] [CrossRef]
- Zhu, J.; Jiao, D. Solution to the Low-Frequency Breakdown Problem in Computational Electromagnetics. In Computational Electromagnetics, 1st ed.; Mittra, R., Ed.; Springer: New York, NY, USA, 2014; pp. 259–316. [Google Scholar]
- Chew, W.C.; Tong, M.S.; Hu, B. Low-Frequency Problems in Integral Equations. In Integral Equation Methods for Electromagnetic and Elastic Waves, 1st ed.; Springer: Cham, Switzerland, 2009; pp. 107–134. [Google Scholar]
- Chen, X.; Zhang, M.; Fan, Z.; Ding, D. Investigation on Low-frequency Breakdown of Electric Field Integral Equation Using 16-byte Floating-point Number. In Proceedings of the 2024 Photonics & Electromagnetics Research Symposium (PIERS), Chengdu, China, 21–25 April 2024; pp. 1–4. [Google Scholar]
- Li, J.; Li, H. Symmetry Implications of a 60 GHz Inverted Microstrip Line Phase Shifter with Nematic Liquid Crystals in Diverse Packaging Boundary Conditions. Symmetry 2024, 16, 798. [Google Scholar] [CrossRef]
- Li, J.; Li, H. Assessing Vulnerabilities in Line Length Parameterization and the Per-Unit-Length Paradigm for Phase Modulation and Figure-of-Merit Evaluation in 60 GHz Liquid Crystal Phase Shifters. Symmetry 2024, 16, 1261. [Google Scholar] [CrossRef]
- Li, J.; Li, H. Liquid Crystal-Filled 60 GHz Coaxially Structured Phase Shifter Design and Simulation with Enhanced Figure of Merit by Novel Permittivity-Dependent Impedance Matching. Electronics 2024, 13, 626. [Google Scholar] [CrossRef]
- Ertman, S.; Orzechowski, K.; Rutkowska, K.; Kołodyńska, O.; Różycka, J.; Ignaciuk, A.; Wasilewska, N.; Osuch, T.; Woliński, T.R. Periodic liquid crystalline waveguiding microstructures. Sci. Rep. 2023, 13, 13896. [Google Scholar] [CrossRef] [PubMed]
- Siarkowska, A.; Chychłowski, M.; Budaszewski, D.; Jankiewicz, B.; Bartosewicz, B.; Woliński, T.R. Thermo- and electro-optical properties of photonic liquid crystal fibers doped with gold nanoparticles. Beilstein J. Nanotechnol. 2017, 8, 2790–2801. [Google Scholar] [CrossRef]
- Yeong, D.J.; Velasco-Hernandez, G.; Barry, J.; Walsh, J. Sensor and Sensor Fusion Technology in Autonomous Vehicles: A Review. Sensors 2021, 21, 2140. [Google Scholar] [CrossRef]
- Panicker, A.; Kshirsagar, U.; Pareek, B. Advanced driver assistance system (ADAS) based on sensor fusion. In Proceedings of the 7th IET Smart Cities Symposium (SCS 2023), Hybrid Conference, Bahrain, 3–5 December 2023; pp. 406–410. [Google Scholar]
- Abdulkarim, Y.I.; Bakır, M.; Yaşar, İ.; Ulutaş, H.; Karaaslan, M.; Alkurt, F.Ö.; Sabah, C.; Dong, J. Highly sensitive metamaterial-based microwave sensor for the application of milk and dairy products. Appl. Opt. 2022, 61, 1972–1981. [Google Scholar] [CrossRef]
- Ragonese, E.; Italia, A.; Palmisano, G. A 5-GHz highly integrated receiver front-end. Analog. Integr. Circ. Sig. Process 2007, 53, 3–7. [Google Scholar] [CrossRef]
- Papadopoulos, M.; Lampropoulos, K.; Kitsos, P. FPGA-Based Cloud Security Solutions for 5G Networks. In Proceedings of the 2024 IEEE International Conference on Cyber Security and Resilience (CSR), London, UK, 2–4 September 2024; pp. 913–918. [Google Scholar]
- Psychalinos, C.; Minaei, S.; Safari, L. Ultra low-power electronically tunable current-mode instrumentation amplifier for biomedical applications. AEU Int. J. Electron. Commun. 2020, 117, 153120. [Google Scholar] [CrossRef]
- Ali, M.Z.; Abohmra, A.; Usman, M.; Zahid, A.; Heidari, H.; Imran, M.A.; Abbasi, Q.H. Quantum for 6G communication: A perspective. IET Quant. Comm. 2023, 4, 112–124. [Google Scholar] [CrossRef]
- Akbar, M.A.; Khan, A.A.; Hyrynsalmi, S. Role of quantum computing in shaping the future of 6 G technology. Inf. Softw. Technol. 2024, 170, 107454. [Google Scholar] [CrossRef]
- Pantoli, L.; Stornelli, V.; Leuzzi, G. High dynamic range, low power, tunable, active filter for RF and microwave wireless applications. IET Microw. Antennas Propag. 2018, 12, 595–601. [Google Scholar] [CrossRef]
- Elwakil, A.S.; Maundy, B.J.; Psychalinos, C. A family of resonance-based tunable frequency oscillators and application to chaos generation. Int. J. Electron. Lett. 2024, 12, 495–505. [Google Scholar] [CrossRef]
- Nako, J.; Kaloudi, E.; Tsirimokou, G.; Psychalinos, C. An Electronically Tunable Universal Non-Integer-Order Filter Structure. In Proceedings of the 2024 Panhellenic Conference on Electronics & Telecommunications (PACET), Thessaloniki, Greece, 28–29 March 2024; pp. 1–4. [Google Scholar]
- Pantoli, L.; Stornelli, V.; Leuzzi, G. Low-noise tunable filter design by means of active components. Electron. Lett. 2016, 52, 86–88. [Google Scholar] [CrossRef]
- Maundy, B.J.; Elwakil, A.S.; Psychalinos, C. A novel family of tunable-frequency oscillators. AEU Int. J. Electron. Commun. 2024, 177, 155219. [Google Scholar] [CrossRef]
- Li, J. Bias Tees Integrated Liquid Crystals Inverted Microstrip Phase Shifter for Phased Array Feeds. In Proceedings of the IEEE EPS 21st International Conference on Electronic Packaging Technology (ICEPT), Guangzhou, China, 12–15 August 2020; pp. 1–5. [Google Scholar]
- Angiulli, G.; Carlo, D.D.; Amendola, G.; Arnieri, E.; Costanzo, S. Support Vector Regression Machines to Evaluate Resonant Frequency of Elliptic Substrate Integrate Waveguide Resonators. Prog. Electromagn. Res. 2008, 83, 107–118. [Google Scholar] [CrossRef]
- You, Y.H.; Kou, X.Y.; Tan, S.T. Adaptive meshing for finite element analysis of heterogeneous materials. Comput. Aided Des. 2015, 62, 176–189. [Google Scholar] [CrossRef]
- Noguchi, S.; Naoe, T.; Igarashi, H.; Matsutomo, S.; Cingoski, V.; Ahagon, A.; Kameari, A. A New Adaptive Mesh Refinement Method in FEA Based on Magnetic Field Conservation at Elements Interfaces and Non-Conforming Mesh Refinement Technique. IEEE Trans. Magn. 2017, 53, 1–4. [Google Scholar] [CrossRef]
- Arya, S.; Tiwari, G.K. Characterizing Radio Frequency Transmission and Attenuation in Underwater Wireless Communication. In Proceedings of the 2023 3rd International Conference on Smart Generation Computing, Communication and Networking (SMART GENCON), Bangalore, India, 29–31 December 2023; pp. 1–5. [Google Scholar]
- Hu, S.; Xie, H.; Li, Z. Evaluation of Electromagnetic Fields of Extremely Low-Frequency Horizontal Electric Dipoles at Sea–Air Boundaries. Electronics 2023, 12, 4165. [Google Scholar] [CrossRef]
- Che, X.; Wells, I.; Dickers, G.; Kear, P.; Gong, X. Re-evaluation of RF electromagnetic communication in underwater sensor networks. IEEE Commun. Mag. 2010, 48, 143–151. [Google Scholar] [CrossRef]
- Tritakis, V.; Mlynarczyk, J.; Contopoulos, I.; Kubisz, J.; Christofilakis, V.; Tatsis, G.; Chronopoulos, S.K.; Repapis, C. Extremely Low Frequency (ELF) Electromagnetic Signals as a Possible Precursory Warning of Incoming Seismic Activity. Atmosphere 2024, 15, 457. [Google Scholar] [CrossRef]
- Mlynarczyk, J.; Kulak, A.; Salvador, J. The Accuracy of Radio Direction Finding in the Extremely Low Frequency Range. Radio Sci. 2017, 52, 1245–1252. [Google Scholar] [CrossRef]


Disclaimer/Publisher’s Note: The statements, opinions and data contained in all publications are solely those of the individual author(s) and contributor(s) and not of MDPI and/or the editor(s). MDPI and/or the editor(s) disclaim responsibility for any injury to people or property resulting from any ideas, methods, instructions or products referred to in the content. |
© 2024 by the authors. Licensee MDPI, Basel, Switzerland. This article is an open access article distributed under the terms and conditions of the Creative Commons Attribution (CC BY) license (https://creativecommons.org/licenses/by/4.0/).