Abstract
Ground-Penetrating Radar (GPR) is a non-destructive sensing technology that utilizes high electromagnetic frequencies. However, mutual interference waves caused by multiple scattering between targets can significantly complicate the interpretation of GPR B-scan images, especially when shallow targets obscure deeper ones. Existing methods primarily focus on extracting target signals from background clutter, frequently overlooking the impact of mutual interference. This paper proposes a convolutional neural network, termed MIS-SE-Net (Mutual Interference Suppression and Signal Enhancement Network), designed to suppress mutual interference waves while preserving shallow target signals and enhancing deeper ones. MIS-SE-Net incorporates attention gates into its encoder–decoder architecture, thereby improving its capabilities in interference suppression and enhancement of weak signals. The network is optimized using a combination of Mean Absolute Error (MAE) loss and perceptual loss. To evaluate MIS-SE-Net, the multi-scale weighted back projection (MWBP) imaging algorithm is used. Simulation results show that after processing with MIS-SE-Net, the integrated side-lobe ratio (ISLR) metric of MWBP imaging decreases by an average of 2.37%, while the signal-to-clutter ratio (SCR) increases by an average of 1.65%. For measured data, results show an average decrease of 7.51% in ISLR and an increase of 2.47% in SCR. These findings validate the effectiveness of the proposed method in suppressing interference, enhancing weak signals, and improving imaging quality.
1. Introduction
Ground-Penetrating Radar (GPR) is a commonly used non-destructive detection method [1,2]. It works by detecting underground targets through the collection of scattered signals for subsequent imaging, localization, and recognition. GPR offers several advantages, including high speed, cost-effectiveness, high resolution, and lightweight equipment, making it suitable for various applications, such as geological exploration [3], hydrological research [4], archaeological investigation [5], tunnel inspection [6], and landmine detection [7]. During a surface scan, wide-band electromagnetic waves emitted by GPR interact with subsurface targets that have different electromagnetic properties from the surrounding medium, resulting in scattering. The receiving antenna captures some of this scattered energy, which is then processed to generate a GPR B-scan image by integrating the signals collected from multiple spatial measurement points. Using a GPR B-scan image, researchers can leverage the propagation characteristics of electromagnetic waves, as well as the morphology and intensity of the target echo signals, to extract information such as the dielectric properties, spatial positions, and structural dimensions of subsurface media and detection targets [8,9,10].
However, when multiple targets are present in the detection scene, electromagnetic waves scatter multiple times between the targets [11]. This effect is particularly prominent when the targets are buried in close proximity, resulting in mutual interference waves between the two targets appearing in the B-scan image [12]. These mutual interference waves are coupled with genuine echo signals in the B-scan image, making them difficult to distinguish, which increases the complexity of analyzing and extracting features of underground targets [13]. The randomness of the medium, target diversity, and distribution uncertainty contribute to the variability of mutual interference waves, complicating the interpretation of GPR B-scan data and making it time-consuming and error-prone [14,15].
Furthermore, shallow targets may interfere with the detection of deeper concealed targets, making the identification more challenging [16]. For instance, in landmine detection or archaeological site investigations, surface activities or human intervention may cause deeper targets, such as landmines or relics, to be occluded by irregular stones [17]. In such scenarios, the strong scattering from shallow targets results in only a portion of the signals penetrating the deeper layers and being subsequently scattered by the deeper targets [18]. As these scattered signals propagate upwards, they again encounter strong scattering from shallow targets, resulting in even less signal being received [18]. Furthermore, multiple scattering between shallow and deep targets generates mutual interference waves, which further obscure the deeper target signals [11].
Mutual interference waves, which are caused by multiple scattering between targets, are a common challenge in GPR data analysis [13,14]. Suppressing these interference waves and enhancing target signals have long been key areas of research in GPR signal processing. Recent studies on GPR images have focused extensively on noise removal and clutter suppression. Denoising algorithms can be broadly categorized into three types. The first type is based on subspace techniques, which exploit the low-rank features of GPR data to separate target signals from noise [19,20,21]. The second type uses spatial filtering techniques to suppress random noise based on differences in spectral characteristics [22]. The third type relies on transform domain methods such as Wavelet Transform, Ridgelet Transform, Shearlet Transform, and Curvelet Transform for GPR data denoising [23,24,25,26,27,28]. Similarly, clutter suppression algorithms can be divided into three categories. The first category uses subspace techniques to decompose GPR B-scan images into components representing clutter, targets, or noise [29,30,31,32]. The second category is based on morphological component analysis, which decomposes the B-scan image into target and clutter morphological components, with each component represented sparsely using appropriate dictionaries [33]. The third category is based on low-rank sparse representation, which decomposes the GPR B-scan image into low-rank and sparse matrices, representing targets using the sparse matrix and clutter using the low-rank matrix [34,35,36].
In recent years, deep learning has achieved remarkable success in the fields of signal and image processing, and it has also found applications in the GPR domain [37]. In terms of GPR data processing, various deep learning strategies have recently been proposed for tasks such as target detection [38,39], electromagnetic inversion [40,41], image denoising [42,43,44], and clutter suppression [18,45,46]. Luo et al. proposed a Multi-Scale Convolutional Autoencoder (MCAE) for GPR data denoising, incorporating a Wasserstein Generative Adversarial Network to enhance the training dataset of MCAE [42]. Feng et al. designed a Deep Convolutional Autoencoder called AD-CDAEs-ResNet to remove random noise from GPR images [43]. Experimental results demonstrate that this method effectively reduces noise while having minimal impact on the original GPR data. Wang et al. developed an Recursive-Guided Dual-Multi-Scale Self-Attention Neural Network for GPR noise suppression, which is particularly suitable for handling complex noise in construction environments [44]. Sun et al. proposed a clutter suppression neural network to specifically deal with clutter in field GPR images, enhancing target signals that are obscured by clutter [45]. Ma et al. introduced a clutter suppression method based on Cycle-Consistent Adversarial Networks to enhance subsurface defect signals that are obscured by shallow rebar clutter [18,47]. Ge et al. proposed a GPR clutter suppression algorithm that combines discrete wavelet transform and generative adversarial networks, which is suitable for clutter suppression in small-scale datasets [46].
In summary, existing GPR interference suppression strategies focus primarily on image denoising and clutter suppression, mainly aiming to distinguish target signals from background clutter. However, these strategies have limitations, as they overlook the interactions between targets in multi-target scenarios and do not sufficiently account for the occlusion of deeper targets by shallower ones. As a result, mutual interference waves between multiple targets may still persist in GPR data processed by current methods. These mutual interference waves, arising from multiple scattering between targets rather than from any single true target, introduce false targets during subsequent target detection, radar imaging, and electromagnetic inversion processing [14,15]. Moreover, when GPR scans from the surface downward, signals from deeper targets are typically weaker than those from shallower ones. The presence of mutual interference further complicates the extraction of echo signals from deeper targets, making detection and identification more challenging.
To address these limitations and advance GPR interference suppression strategies, this paper proposes a novel interference suppression strategy based on the mechanism of mutual interference generation between targets. By preserving shallow target echo signals, this method suppresses mutual interference waves caused by multiple scattering between targets and enhances echo signals from deeper concealed targets, supporting applications in target detection, radar imaging, and electromagnetic inversion.
Based on an encoder–decoder framework, this paper proposes MIS-SE-Net (Mutual Interference Suppression and Signal Enhancement Network), a new deep learning-based method for mutual interference suppression and signal enhancement in GPR. The network is trained on GPR B-scan data by considering a variety of practical scenarios that may arise in real applications. The effectiveness and stability of the network are first evaluated on simulated data, followed by validation using real measured data. Experimental results, supported by quantitative metrics, demonstrate the practical efficacy of the proposed method in suppressing mutual interference waves and enhancing target signals. MIS-SE-Net effectively overcomes the limitations of existing GPR interference suppression strategies. In multi-target scenarios, it successfully suppresses mutual interference waves between targets while enhancing the weak echo signals from deeper concealed targets. This deep learning method not only achieves efficient optimization with a limited-scale dataset but also exhibits robust generalization performance across diverse detection scenarios.
2. Mathematical Model of Mutual Interference Waves
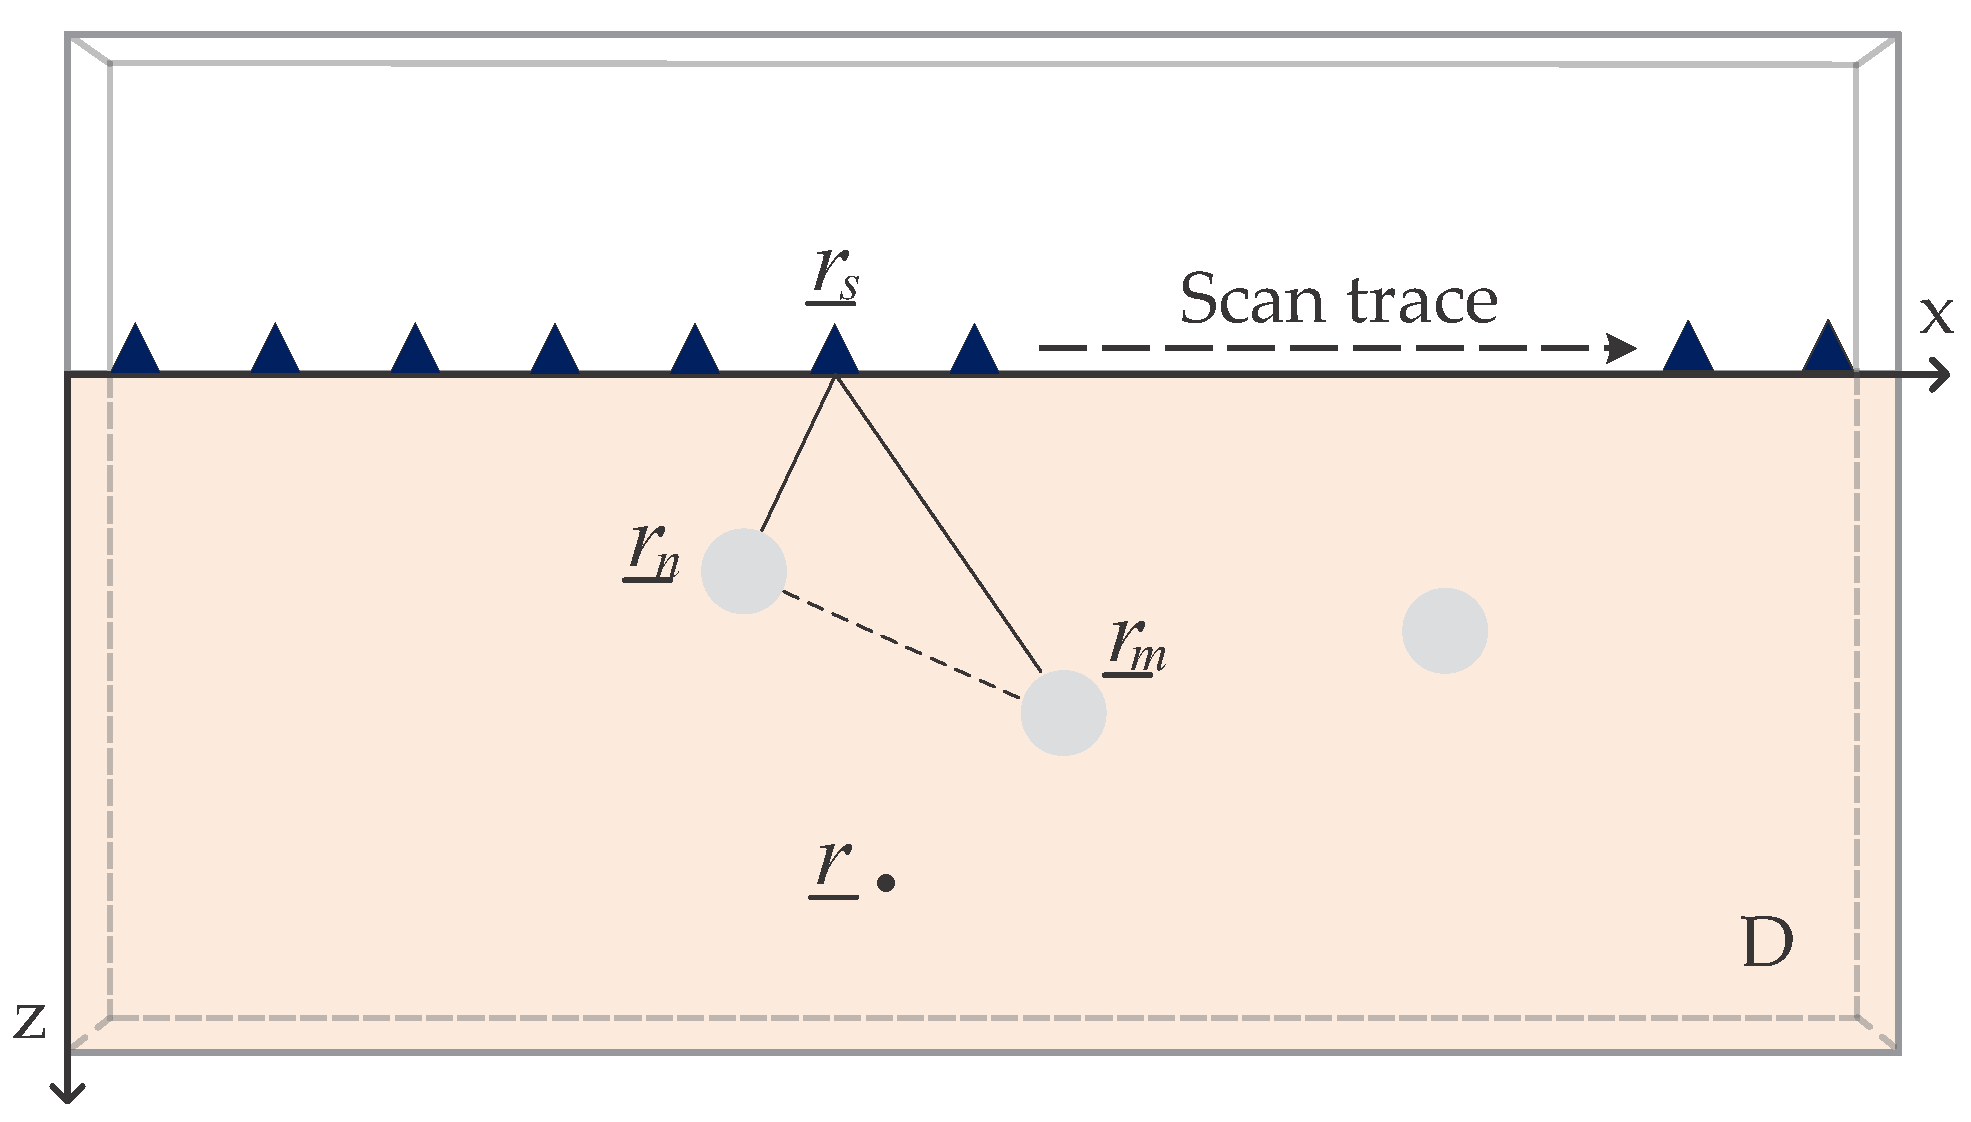
Consider the two-dimensional space illustrated in Figure 1. Since electromagnetic waves cannot penetrate perfectly conducting materials, significant mutual scattering occurs. As a result, we select N metallic cylindrical scatterers situated within the target region D for our analysis. The homogeneous medium in the target region is analyzed with a monostatic GPR system. This system includes a transmitting and receiving antenna that move along the x-axis. The transmitting antenna is assumed to be an infinite line source along the y-direction (TM polarization). The frequency range of the antenna is defined as to ensure general applicability. Let denote the position of target n, and represent the directional vector from target n to target m. Furthermore, specifies the position of a general point within the target region, and the transmit–receive antenna is at .
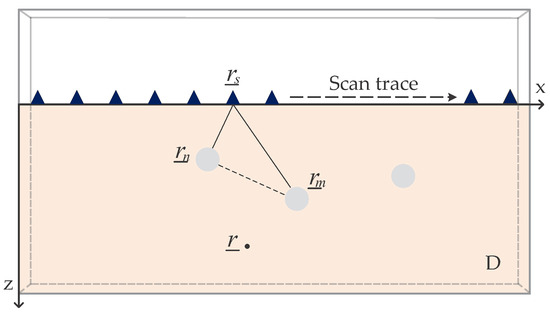
Figure 1.
Illustration of the mutual interference problem. Due to the interaction between targets, the signal received by each antenna in the array is a superposition of direct scattering and multiple scattering contributions.
Let denote the contour of the i-th target, and represent the union of all target contours. Then, the scattered electric field is determined by the induced current along the target contour, using the radiation integral [12]
where is the free-space Green’s function, represents the free-space propagation constant, c is the speed of light, and is the magnetic permeability of the medium. The current distribution is related to the tangential component of the total magnetic field along through the magnetic field integral equation
where is the incident magnetic field. Substituting this back into the expression for the scattered electric field shows that the integral now includes contributions from induced currents caused by mutual interactions. This causes the interaction terms to be nonlinear.
In the scenario depicted in Figure 1, the targets are modeled as thin cylindrical structures with radii much smaller than the probing wavelength. Under these conditions, the targets can be approximated as point sources. Consequently, the scattered electric field can be expressed as follows [11]
where represents the direct scattering contribution, and represents the contribution from multiple scattering due to interactions between the targets [11]. If only first-order and second-order contributions are considered, the equation can be rewritten as [15]
where is a complex coefficient indicating the incident field strength, and denote the distances from the measurement point to targets n and m, respectively, and is the distance between targets n and m. represents the amplitude of the multipath component.
Therefore, the GPR B-scan data contain not only the direct scattering contribution but also the multipath contributions due to interactions between the targets. These multipath contributions form the source of the mutual interference waves, increasing the difficulty of interpreting GPR images. The deep learning strategy proposed in this paper aims to suppress mutual interference waves in GPR B-scan data and enhance target signals. The specific details will be introduced in Section 3.
3. MIS-SE-Net Network
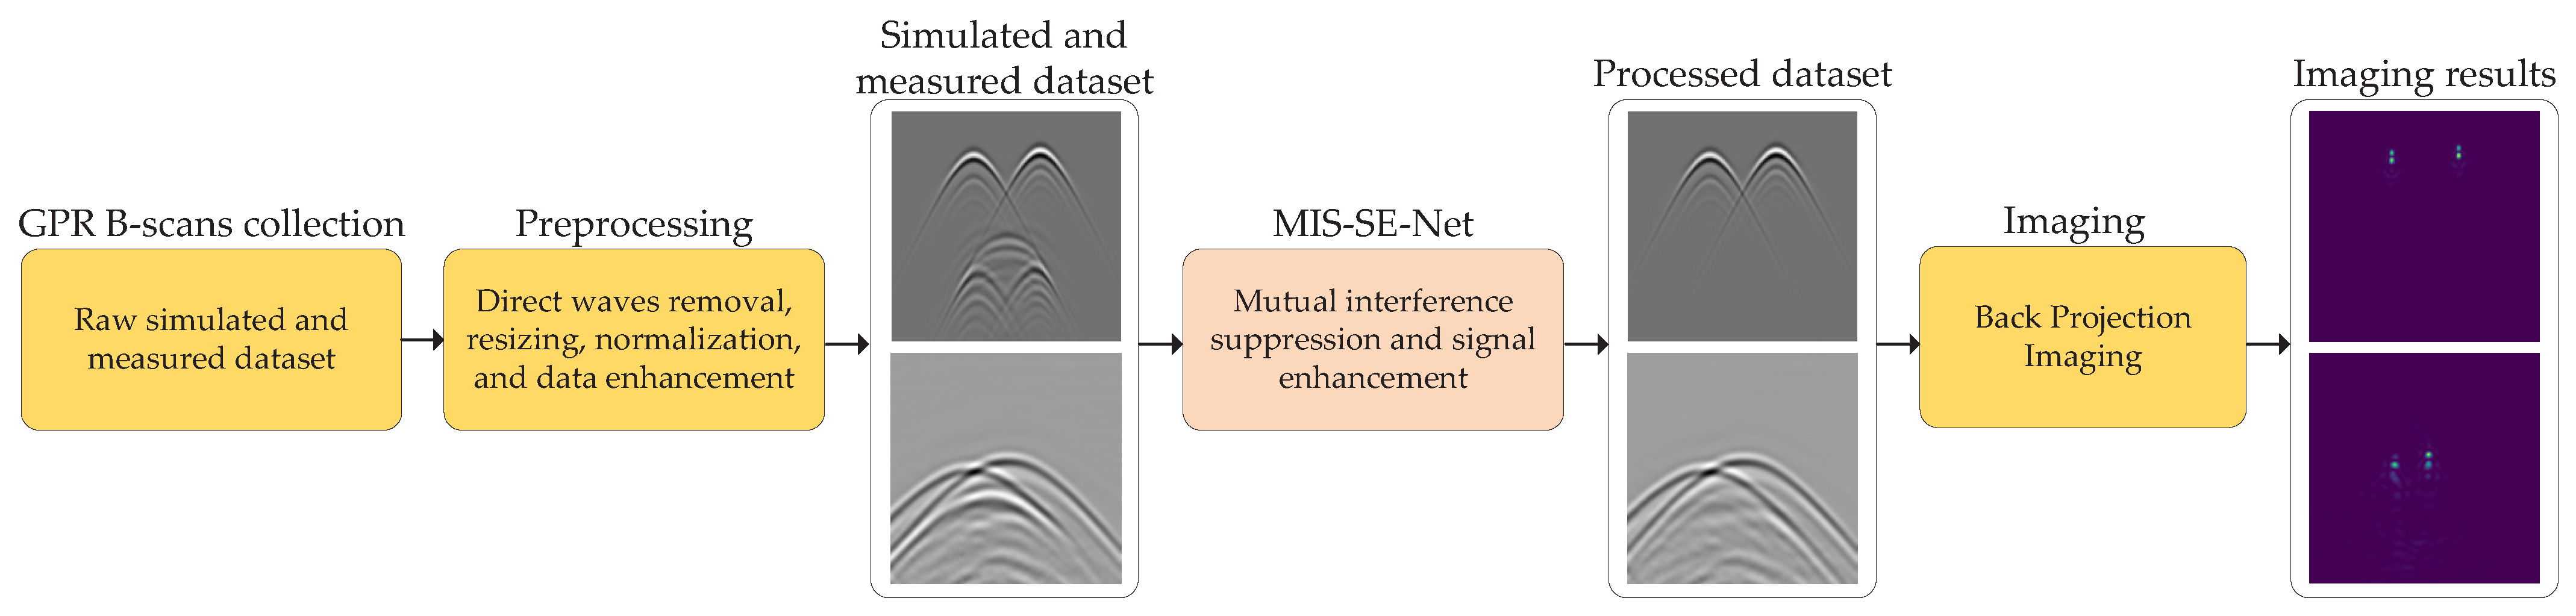
The process flow for data processing and validation is shown in Figure 2. First, simulated and measured GPR B-scan data are collected. To enhance the target signals, background removal algorithms are applied to suppress direct waves. Subsequently, the data are standardized and augmented to facilitate subsequent network training. However, mutual interference waves caused by target scattering interactions typically appear as quasi-hyperbolic patterns and cannot be suppressed through preprocessing alone. Therefore, this paper proposes a convolutional neural network named MIS-SE-Net, designed for mutual interference suppression and signal enhancement in GPR B-scan data. Finally, to evaluate the effectiveness of MIS-SE-Net in suppressing mutual interference and enhancing signals, imaging is performed on the data processed by MIS-SE-Net. This section provides a detailed introduction to MIS-SE-Net within the workflow, including its architecture, loss function, and implementation details.

Figure 2.
Processing and validation flow for the mutual interference suppression and signal enhancement method.
3.1. Network Architecture
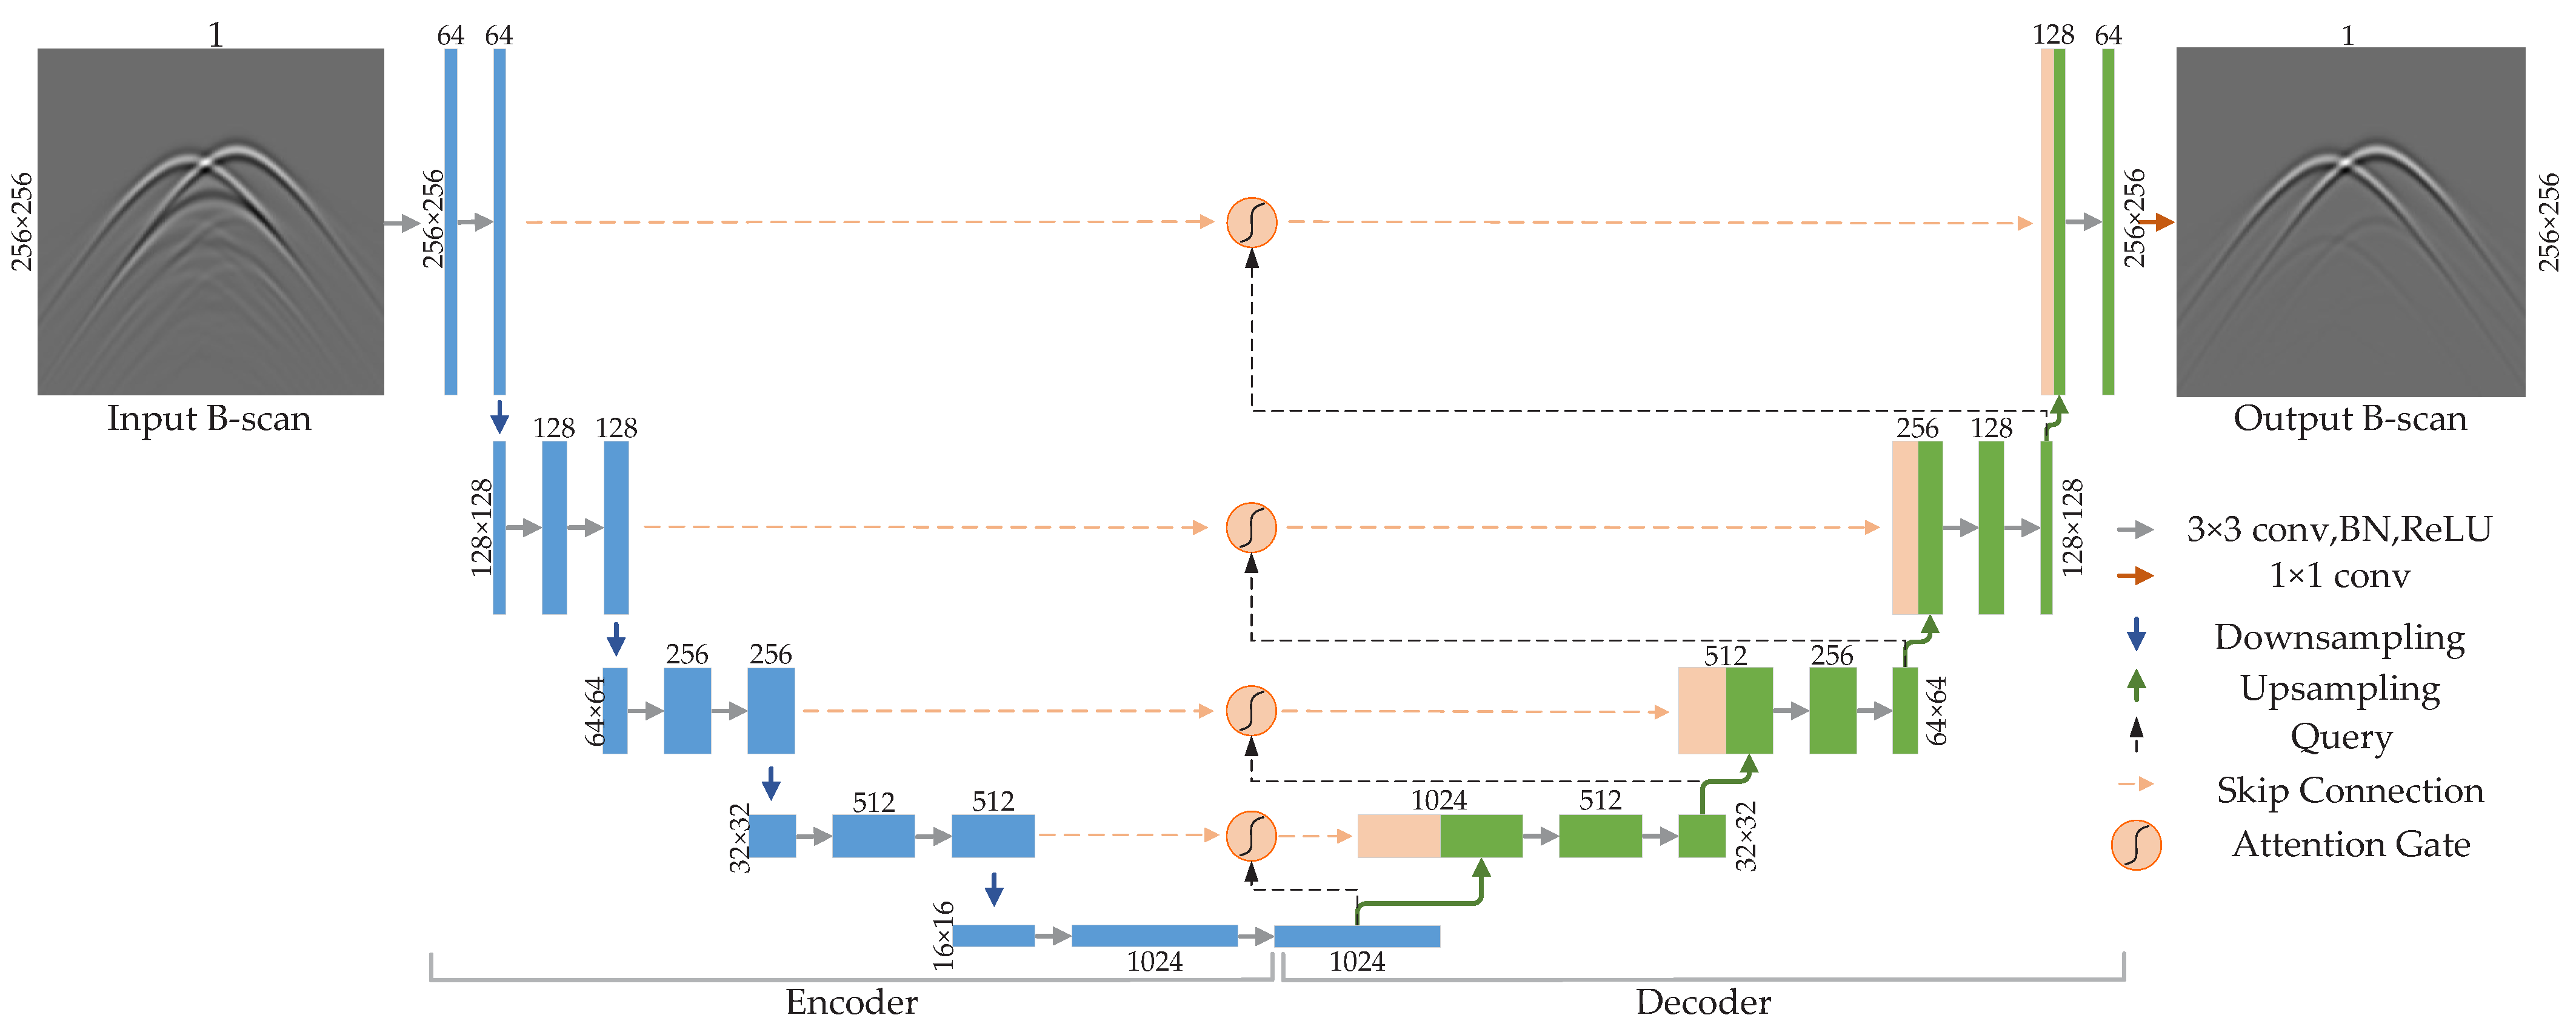
Figure 3 shows the structure of MIS-SE-Net, which is based on a classic U-shaped framework. The network consists of a symmetrical encoder–decoder architecture with skip connections. In this work, attention gates (AGs) are integrated into the skip connections to adaptively determine the importance of each position in the input feature maps. The network takes normalized GPR B-scan data as input and outputs B-scan data with suppressed mutual interference and enhanced target signal.

Figure 3.
Proposed MIS-SE-Net network architecture. It consists of an encoder, a decoder, and skip connections between them. AGs are integrated into the skip connections to adaptively retain features related to target reflections and suppress mutual interference features. The number of channels and the size of the feature maps are shown at the top and left of the corresponding feature maps.
The encoder consists of four layers, each composed of two sequential convolutional layers and one down-sampling operation. Each convolutional layer has a kernel size of , stride of 1, and a padding size of 1, followed by batch normalization and a Rectified Linear Unit (ReLU) activation function. Batch normalization is used to accelerate the training process and improve network performance. The down-sampling operation is implemented by a max-pooling layer with a window size of 3. The encoder extracts hierarchical features with different receptive fields from the input raw B-scan data.
The decoder also consists of four layers, each performing up-sampling, concatenation with the corresponding encoder feature map, followed by two convolutional layers. The up-sampling operation is realized by bilinear interpolation with a scaling factor of 2, followed by batch normalization and ReLU activation.
Direct connections between encoder and decoder features at different levels may blend high-level semantics with low-level details. This mixing can limit the advantages of each feature level. Moreover, such direct connections may fail to focus on critical regions, especially when handling complex interferences like mutual interference. The integration of AGs allows for adaptive feature fusion, prioritizing important regions and ensuring that feature levels are combined effectively. AGs can also focus on specific areas and perform more detailed processing in these regions, thereby improving the network’s performance.
Since GPR data often contain significant noise, direct connections between encoder and decoder features may lead to redundancy and noise propagation, reducing the decoder’s discriminative power and output quality. Introducing AGs effectively filters and selects useful information, significantly improving the network’s noise resistance.
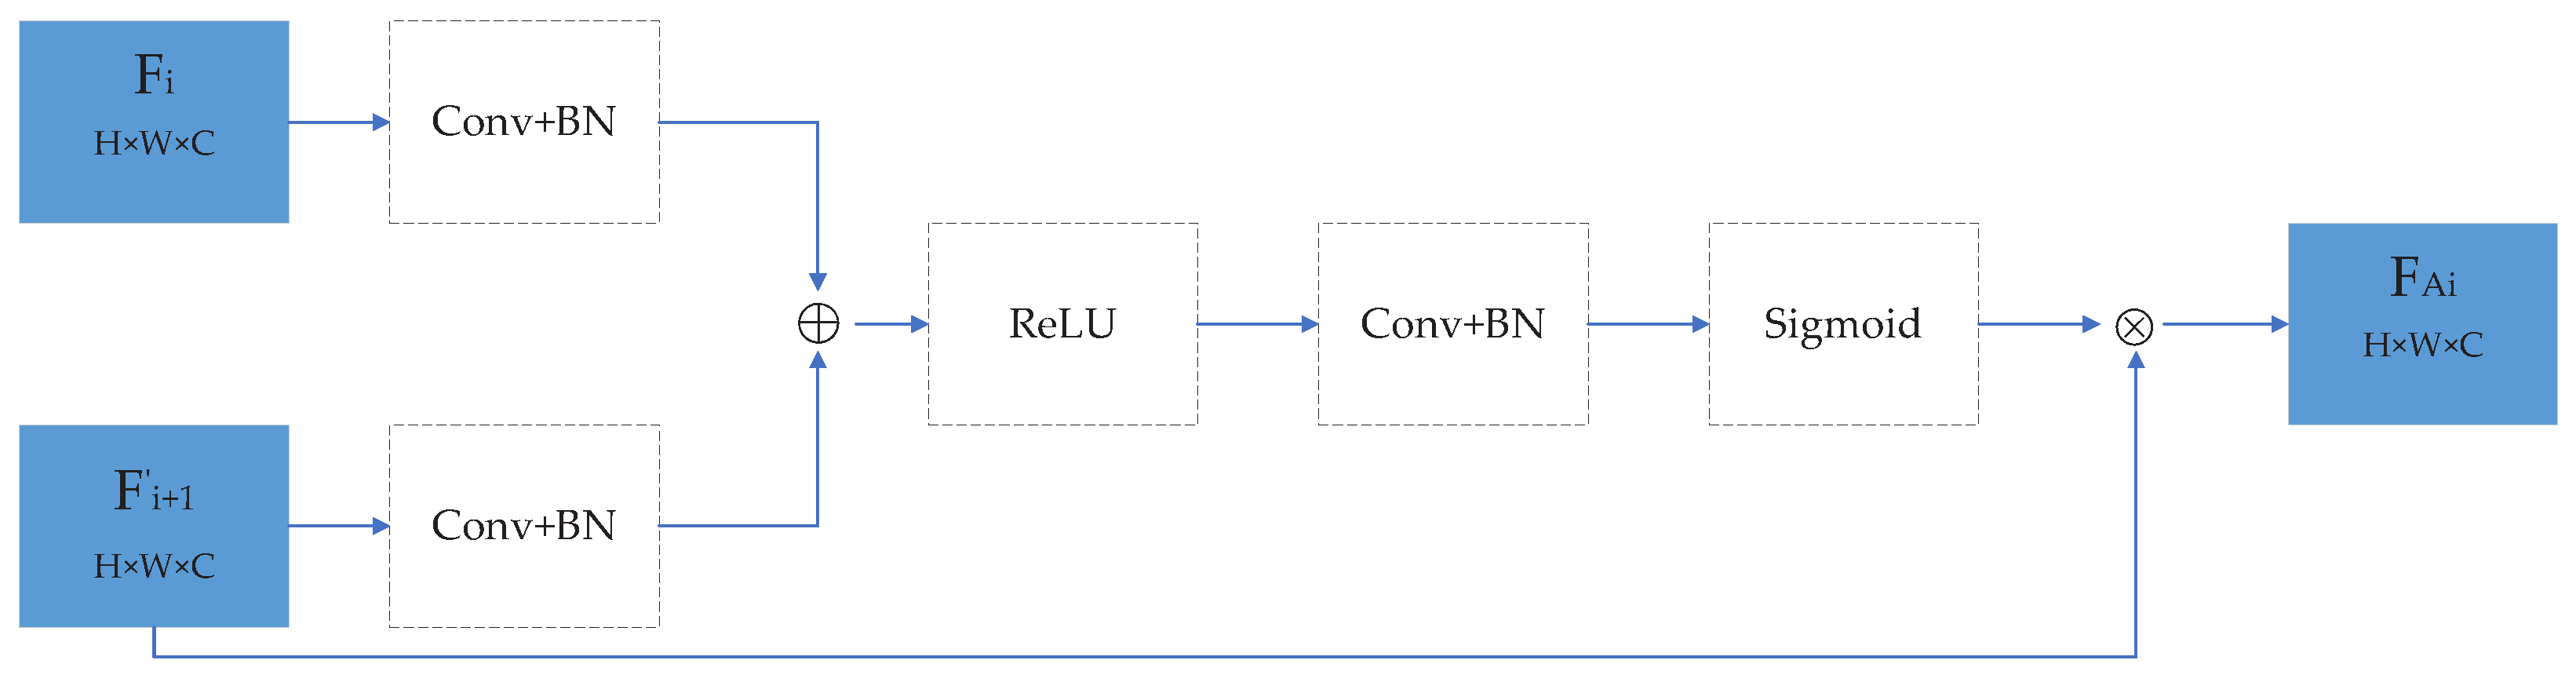
Each layer of the encoder integrates an AG, illustrated in Figure 4. Each AG takes two input feature maps: one from the encoder, denoted as , where , and the other from the up-sampled feature map of the corresponding layer of the decoder, denoted as . AG calculates the attention coefficient of the feature map extracted by the encoder by collecting similar regional features from the two input feature maps. The attention coefficient represents the level of attention for each region in the encoder’s feature map. The final output of the AG is the product of the feature map extracted by the encoder and the attention coefficient . The computation for a given AG can be expressed as follows:
where represents the feature map extracted by the i-th layer of the encoder; represents the up-sampled result of the corresponding feature map from the decoder; , , and are convolution operations, ; where , and are the corresponding biases; represents batch normalization; is the ReLU activation function; is the sigmoid activation function, and ⊙ represents element-wise multiplication; represents parameters of during computation. The convolution kernels used in this calculation are all of size , with a stride of 1 and no padding. The number of convolutional kernels used in and is set to half of the number of input feature map channels, while the number of convolutional kernels used in is set to 1. The final output of the AG at layer i is denoted as .
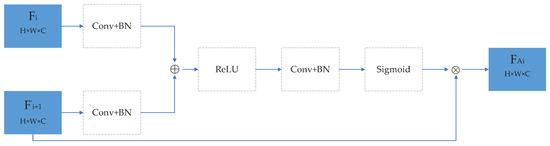
Figure 4.
Illustration of the attention gate (AG).
The echo signals from targets generally exhibit high correlations in both the time domain and spatial domain. For instance, they often form regular hyperbolic patterns in B-scan images. In contrast, the mutual interference waves are influenced by the relative positions and scattering intensities of the targets, and they often present as quasi-hyperbolic patterns or random features. Therefore, by employing supervised learning and integrating the input features with the labeled images, the AG can selectively enhance the regions associated with the target echo signals through attention coefficients , while simultaneously suppressing irrelevant features such as mutual interference waves.
In the final stage, a convolution adjusts the number of output feature channels in the decoder to 1. This step is used to estimate the B-scan data with suppressed mutual interference waves and enhanced target signals. Figure 3 shows the channel number and size of all feature maps in the network.
3.2. Network Loss Function
MIS-SE-Net is trained using a combined loss function of Mean Absolute Error (MAE) loss and Perceptual loss [48], defined as follows:
where the loss function L measures the difference between the network-predicted output image y, which is free of mutual interference and has enhanced target signals, and the label image .
The MAE loss is defined as follows:
where is the dimension of the image, and i and j are the indices of pixel values.
Traditional pixel-level loss functions have limitations in capturing high-level semantic information and structural details of images. To address this issue, we introduce a perceptual loss function based on a pre-trained convolutional neural network. The perceptual loss compares the generated image with the label image in the feature space, aiming to better preserve the semantic integrity and structural details of the image. The first 16 layers of the VGG16 network, pre-trained on the ImageNet dataset, are used as a feature extractor [49,50]. This feature extractor is used to calculate the MAE loss between the generated and target images in the feature space. The perceptual loss is defined as:
where represents the feature extraction function of the VGG16 network, and represent the feature maps of the generated and label images, respectively, and C, H, and W represent the channel number, height, and width of the feature map. The indices c, h, and w represent the channel and pixel indices, respectively.
While MSE loss dominates most deep learning-based methods, it is not the optimal loss for mutual interference suppression and target signal enhancement tasks in GPR. We choose MAE loss instead of MSE as the perceptual loss metric because MAE usually performs better in preserving B-scan image details and edges. Moreover, MSE tends to introduce greater penalties when large errors occur, affecting the quality of generated images and hindering the enhancement of complete hidden target signals. In our experiments, we found that using MAE resulted in more refined interference-free images, thus we adopted MAE as the final choice.
The combined MAE and perceptual losses optimize the model at both pixel and high-level feature levels. This approach leverages the strengths of both losses, making the model more robust under different scenarios and significantly improving the quality of generated images. Ablation experiments presented in Section 4.2 demonstrate the effects of different loss functions on network performance.
3.3. Implementation Details
All GPR B-scan data were resized to and normalized to the range of for network training. During training, the parameters of the feature extraction network were frozen to ensure they remained unchanged throughout training. Since VGG16 requires three-channel RGB images, each grayscale input is duplicated across all three channels to meet the input requirements.
MIS-SE-Net was implemented in the Pytorch framework and trained on an NVIDIA 3070Ti GPU. Weights were initialized using a standard Gaussian distribution, and the RMSprop optimizer was used, with a learning rate of 0.0001, weight decay of , and momentum parameter set to 0.9. The initial learning rate is set to 0.0001 and decays by 10% every 30 iterations. The training batch size was set to 8, and the network was trained for a total of 90 epochs.
4. Experiments and Analysis
This section is divided into five subsections aiming to verify the effectiveness of the proposed method. Section 4.1 introduces the construction process of the simulated dataset. Section 4.2 presents the ablation experiments for MIS-SE-Net. Section 4.3 discusses the suppression effect of mutual interference waves and the signal enhancement results on the simulated dataset. Section 4.4 applies the proposed method to measured data. Finally, Section 4.5 explores the generalization ability of MIS-SE-Net in broader scenarios.
4.1. Dataset Construction
4.1.1. Simulation Model
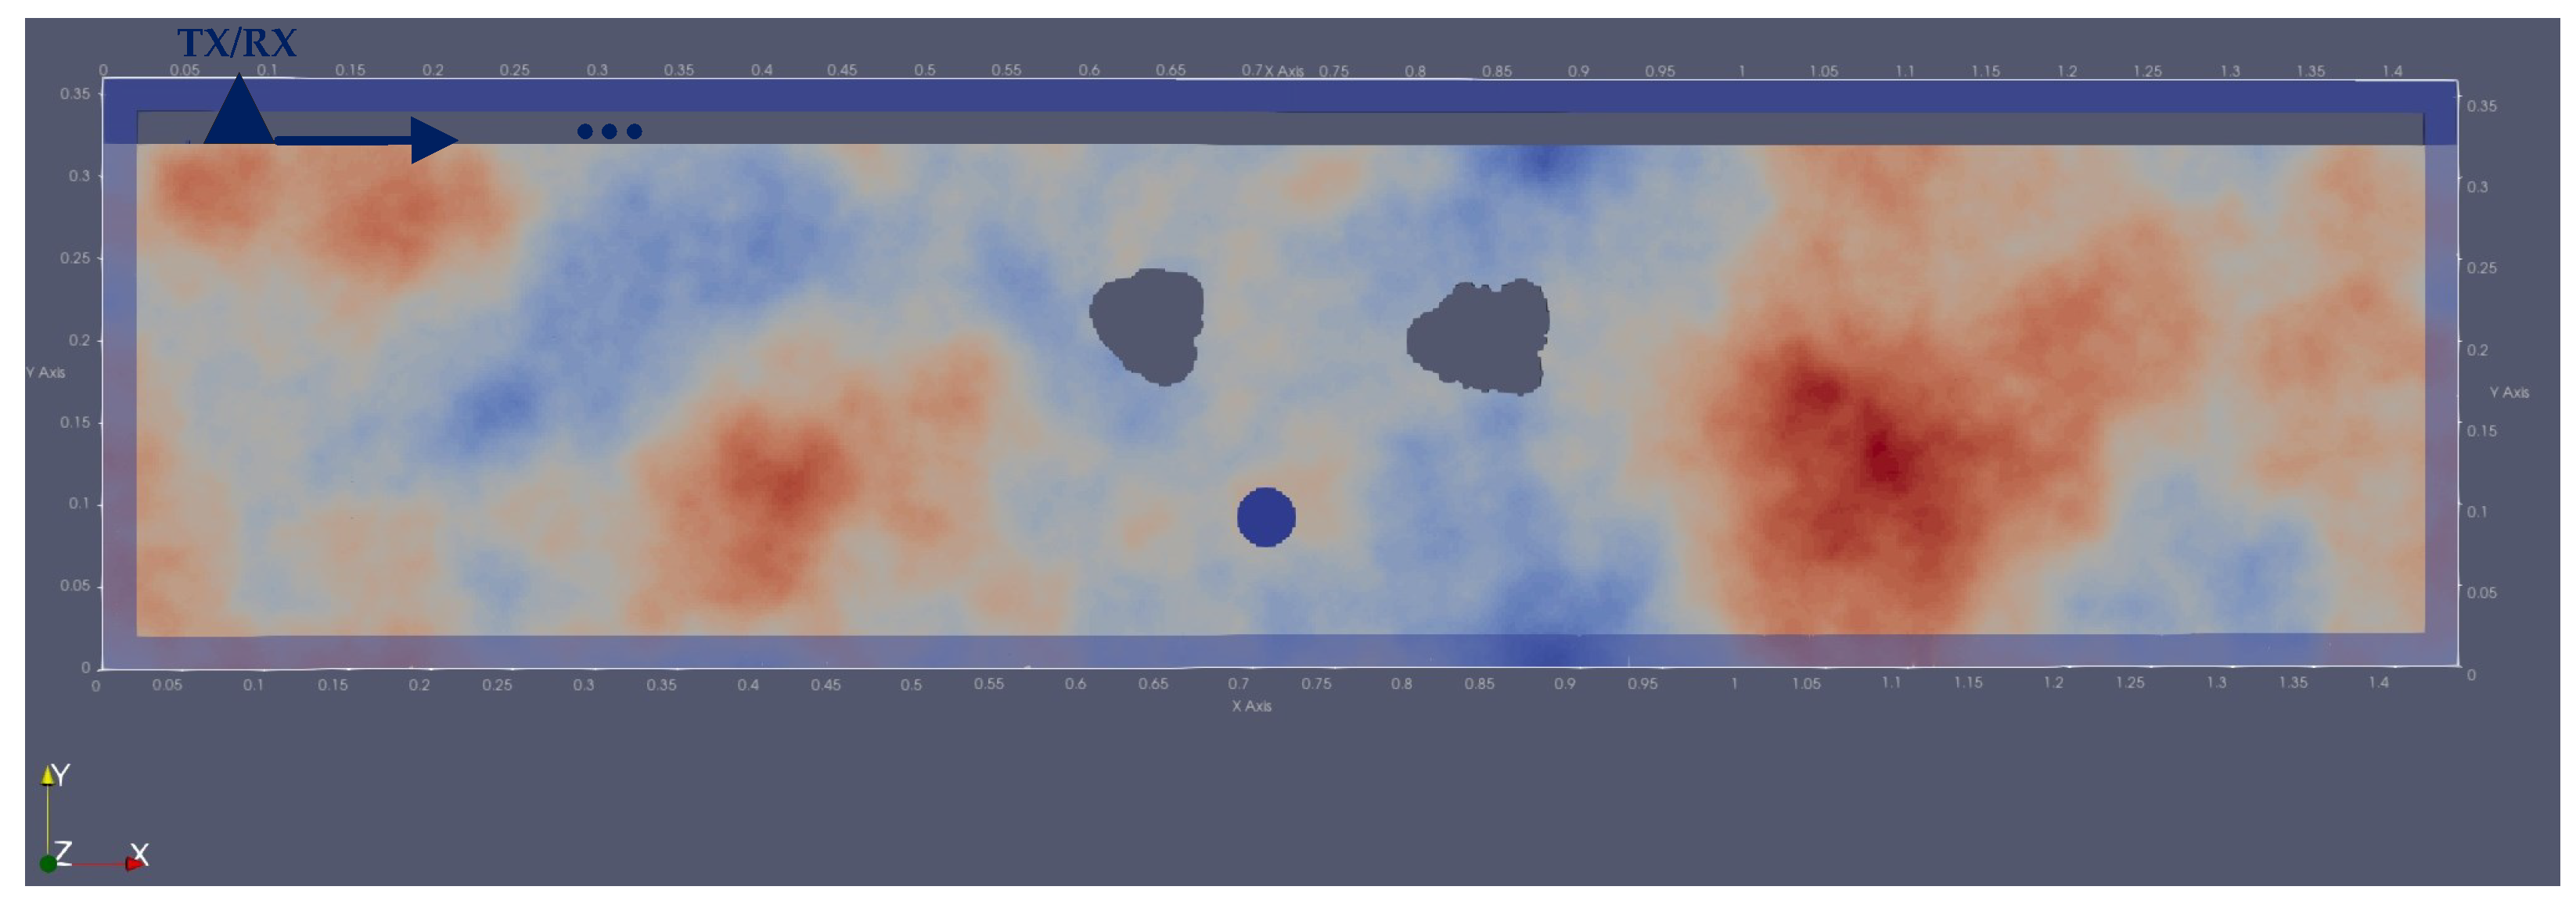
The simulated data used for training, validation, and testing of MIS-SE-Net are generated using the gprMax software (V3.1.6) based on the finite-difference time-domain method for 2D simulations [51]. The goal of the simulation was to recreate scenarios involving multiple underground targets during GPR exploration. These scenarios include mutual interference caused by multiple scattering among targets and cases of target occlusion. In this paper, a synthetic aperture method with single-transmit and single-receive antennas is employed for the detection of underground targets. Figure 5 illustrates a typical simulation scenario. The details of the fixed and random parameter configurations are provided in Table 1 and Table 2.

Figure 5.
Example of a simulation scenario, with two irregularly shaped stones placed above a metallic cylinder. The synthetic aperture configuration consists of both a transmitting and a receiving antenna.

Table 1.
Fixed parameters in the simulation experiments.
Table 2.
Random parameters in the simulation experiments.
To increase the diversity of simulated data, this study designs a variety of differentiated scenarios, considering the following aspects: variations in the dielectric constant of the background medium, changes in the size and position of multiple targets, and variations in the dielectric constants of multiple targets. This design ensures that the dataset not only captures the typical characteristics of mutual interference and target occlusion that may occur in practical GPR applications but also expands the diversity of potential application cases, providing broad generalization capabilities for network training. The specific parameter variations in the simulation are detailed as follows:
- Center Frequency of the Transmitting Antenna: The center frequency was uniformly distributed within the range of [1.0, 2.0] GHz and chosen randomly.
- Background Medium Type: A homogeneous medium or a randomly mixed soil background was selected with equal probability. For homogeneous media, the relative permittivity was uniformly distributed within [2.5, 12.0], and the conductivity was uniformly distributed within [0.001, 0.02] S/m. For the random mixed soil, the soil mixing model proposed by Peplinski was used (limited to a central frequency of 1 GHz to 1.3 GHz) [52].
- Number of Targets in the Scene: Either 2 or 3 targets were randomly selected, with equal probability.
- Target Type, Material, and Radius: The targets included cylindrical shapes made of metallic material, with radii randomly chosen from five possible values between 0.01 m and 0.05 m, and irregular shapes representing stones. A total of 10 different stone shapes were generated to simulate realistic scenarios, ensuring a diameter of no more than 0.1 m. Each time a data set was generated, one of these shapes was selected at random, and its relative permittivity and conductivity were also randomly chosen from the ranges [5.0, 20.0] and [, ] S/m, respectively.
- Target Position: The central position of each target was randomly generated within the surveyed area, with the requirement that all targets are at least 0.03 m (equivalent to 15 cell sizes) apart from one another and the environmental boundary.
4.1.2. Simulated Dataset Preparation
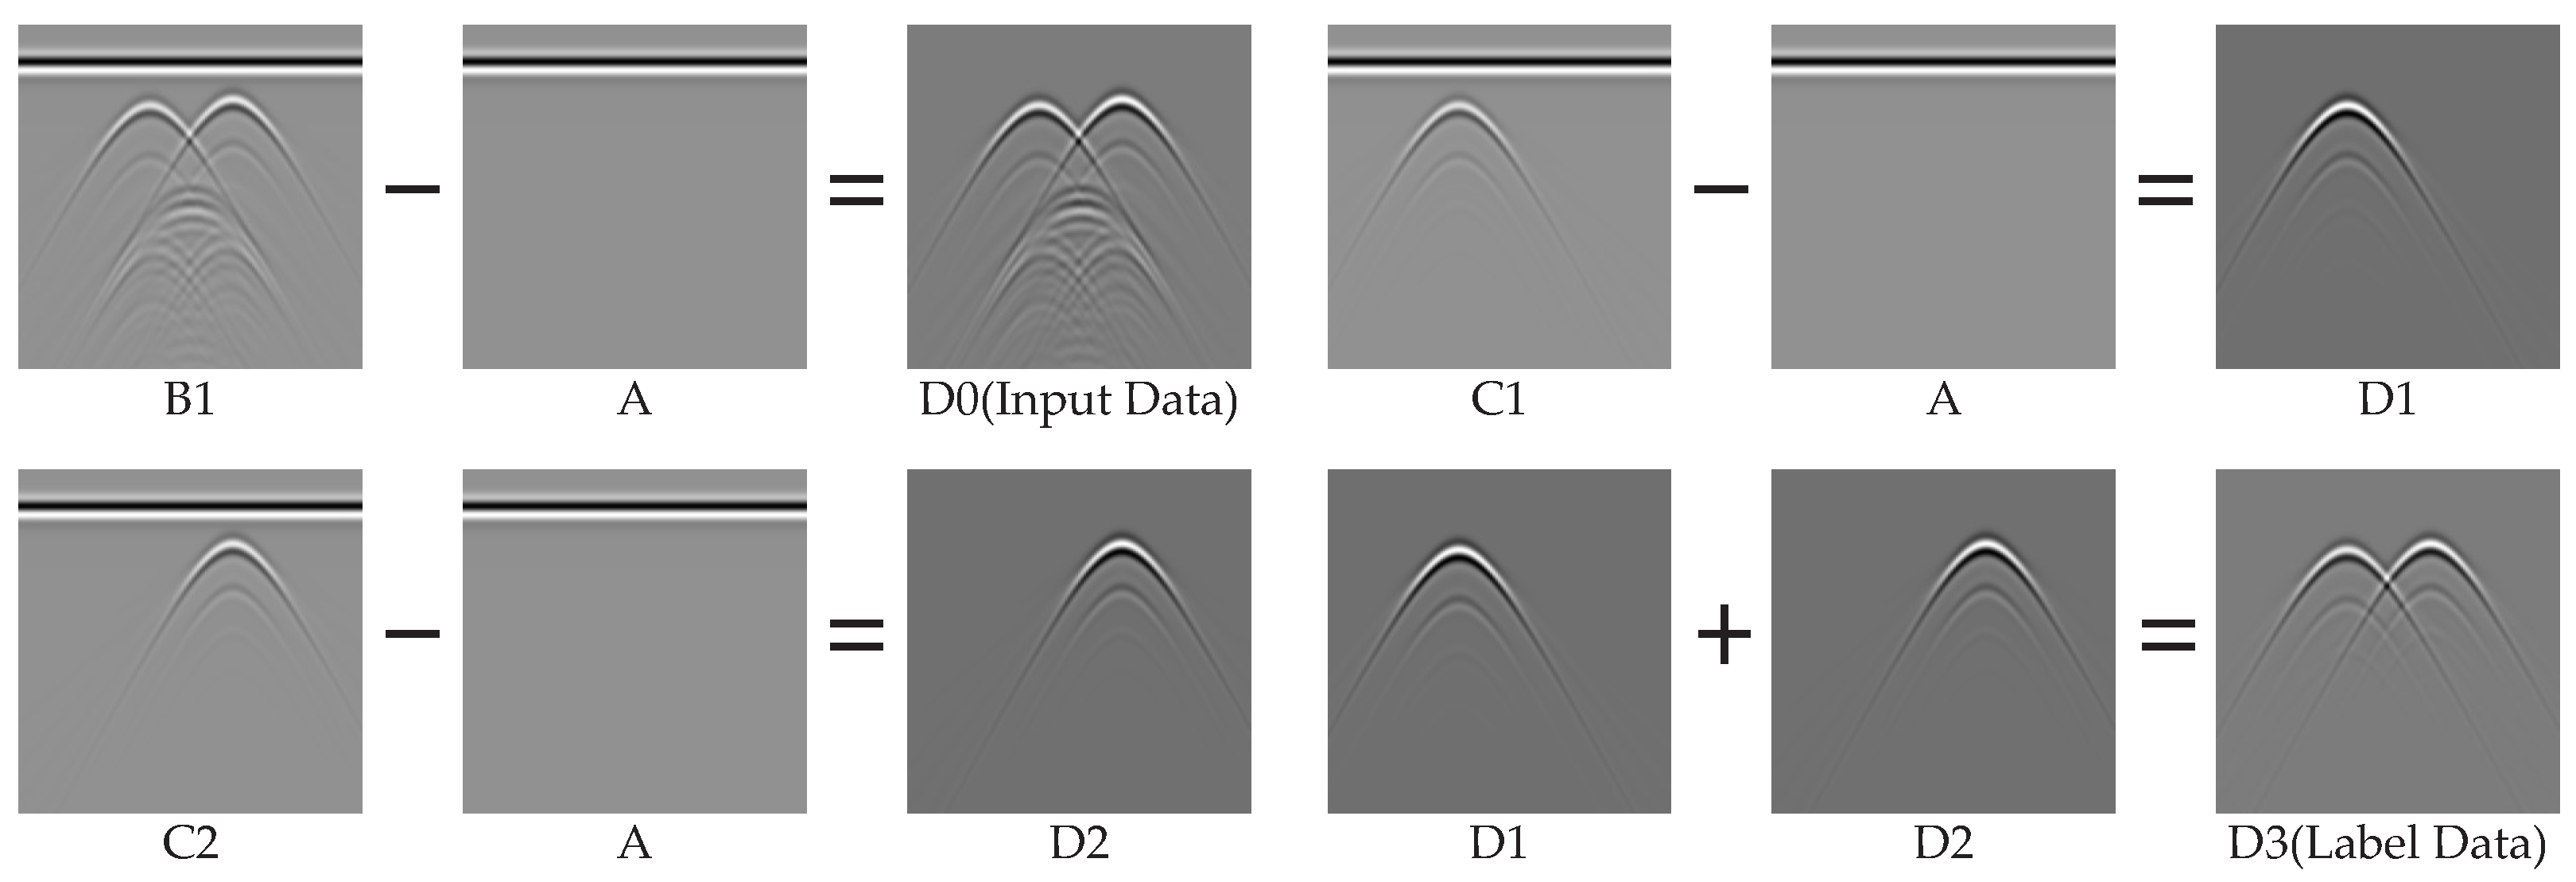
The process of creating the simulated dataset is detailed in Algorithm 1, where each B-scan dataset is generated through 131 A-scan traces. The dataset generation process for two-target simulations is illustrated in Figure 6. By computing each target separately, mutual interference from multipath effects and signal occlusions due to target positions are avoided. Repeating this procedure yields a total of 2300 two-target simulated data samples. For the three-target dataset, the same methodology was applied, but with the additional step of computing the B-scan data for the third target during the algorithm process. In total, we obtained 2300 three-target samples, leading to 4600 simulated data samples.
| Algorithm 1 Two-Target Simulated Dataset Creation Algorithm |
|
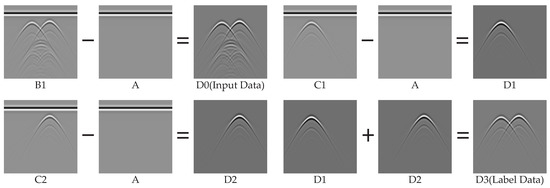
Figure 6.
Illustration of the two-target simulated dataset generation process. The obtained data pairs serve as a set of training data, where represents the network input, and is the label data.
4.2. Ablation Experiment
To verify the effectiveness of the proposed MIS-SE-Net for mutual interference suppression and signal enhancement, a series of ablation experiments were designed in this subsection. Each experiment used the same dataset and identical computational resources.
The evaluation metrics used in this experiment include the Peak Signal to Noise Ratio (PSNR) and the Structural Similarity Index Measure (SSIM). These metrics quantitatively analyze the quality of GPR B-scan data processed by the MIS-SE-Net, measuring the image quality and similarity between the generated GPR B-scan data and the corresponding ground-truth labels.
PSNR indicates image quality by representing the ratio between the maximum possible signal power and the noise power. A higher PSNR value indicates better image quality. It is calculated as follows:
where is the maximum possible pixel value of the image, and denotes the Mean Squared Error. represents the pixel value at location of the test image, and represents the pixel value at the same location of the reference image, while m and n are the dimensions of the image.
SSIM measures the similarity between two images, with values ranging from −1 to 1. A higher value implies greater similarity. When the images are identical, SSIM is equal to 1. The SSIM is calculated as follows:
where y and are the test and reference images, respectively. represents the mean pixel value of y, represents the mean pixel value of , and denotes the covariance between y and . and are the variances of y and , respectively. Constants and are used to stabilize the division and prevent zero-division errors, with and .
The ablation experiments evaluate the effect of integrating AGs into the network structure and compared the performance using different loss functions. The experimental results are shown in Table 3 and Figure 7.
Table 3.
Performance comparison of mutual interference suppression and signal enhancement in ablation experiments.
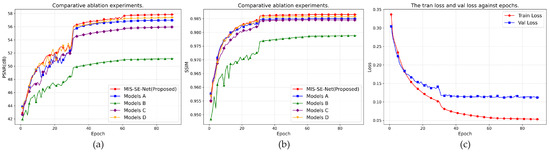
Figure 7.
Results of ablation experiments and Training Curves of MIS-SE-Net: (a) PSNR results for ablation experiments, (b) SSIM results for ablation experiments, (c) training and validation losses of MIS-SE-Net over training epochs.
- Effect of Different Loss Functions: The comparison among Models B, C, D, and MIS-SE-Net reveals the effects of using different loss functions. In the ablation experiments, three different loss functions were compared for network training. Models B, C, and D were trained using MSE loss, MAE loss, and perceptual loss, respectively. The results indicate that the combination of MAE loss and perceptual loss effectively leverages the advantages of both, achieving the best performance.
Ablation experiments demonstrate that by incorporating AGs into the network architecture and optimizing the model using a combined function of MAE loss and perceptual loss, MIS-SE-Net shows superior performance in mutual interference suppression and signal enhancement. Traditional MSE loss, while providing certain optimization effects, has limitations in capturing complex structural details and high-level semantic features of target signals. In contrast, MAE loss is often more effective in enhancing image details and edge information. By further incorporating perceptual loss, the model can be optimized simultaneously at both the pixel level and the high-level feature level, effectively leveraging the strengths of both losses. Additionally, the AGs adaptively focus on key areas, which further improves the model’s performance in complex interference scenarios. As a result, the PSNR and SSIM metrics of the final model reach optimal levels.
4.3. Simulation Experiments
This subsection presents the test results of MIS-SE-Net on the simulated dataset, after verifying its effectiveness in suppressing mutual interference and enhancing signals through ablation experiments. Figure 8 displays four typical scenarios from the test set. Figure 8a shows the input GPR B-scan data fed into the network, Figure 8b shows the output after MIS-SE-Net processes the data to suppress mutual interference waves and enhance the target signals, and Figure 8c illustrates the corresponding simulation scenario for the input data.
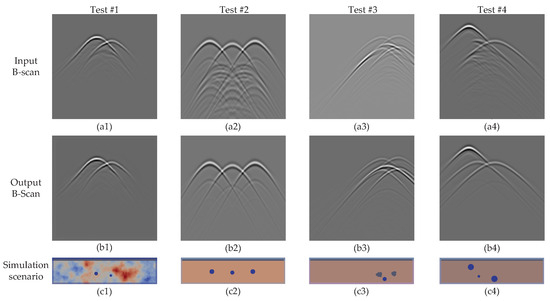
Figure 8.
Processing results of MIS-SE-Net on simulated data: (a) input GPR B-scan data, (b) output GPR B-scan data after mutual interference suppression and target signal enhancement, (c) simulation scenario corresponding to the input GPR B-scan data.
Scenario 1 involves two metallic cylinders in a mixed soil model. The high volumetric water content of the soil distorts the hyperbolic shape of the signal, making the mutual interference waves less recognizable due to their weak intensity. Scenario 2 shows three metallic cylinders in a homogeneous medium. When the center frequency of the transmitting antenna and the relative permittivity of the background medium are both low, the mutual interference waves experience minimal attenuation. As a result, they occupy a large portion of the B-scan space and strongly couple with the target signal. Scenario 3 involves two irregular stones and a metallic cylinder in a homogeneous medium. Because the stones above conceal it, the reflection from the middle metallic cylinder becomes difficult to detect. Additionally, due to the dielectric contrast between the stones and the background, multiple scattering occur within the stones, creating GPR multiples [53], which further complicates the identification of the reflection from the metallic cylinder. Scenario 4 includes three metallic cylinders in a homogeneous medium. The middle cylinder, which lies deeper, is occluded by the shallow targets and coupled with mutual interference waves. This makes identifying the deep target even more challenging.
The output from MIS-SE-Net effectively suppresses mutual interference in these scenarios and enhances most of the hyperbolic features of the targets.
To validate the performance of mutual interference suppression and signal enhancement for the GPR B-scan data processed by MIS-SE-Net, we applied an imaging algorithm to compare the data before and after processing. The traditional back projection (BP) algorithm, due to its ability to compensate for propagation attenuation based on a “delay-and-sum” approach, is commonly used in GPR imaging, especially given its weaker constraints on the configuration of transmitting and receiving antennas [54]. However, BP imaging often shows arc-shaped artifacts above or below the target focal points, which become more severe when multiple targets exist in the investigation space. To better visualize the effect of mutual interference suppression on false target suppression, this study used a multi-scale weighted back projection (MWBP) imaging algorithm that effectively reduces imaging artifacts [55].
Figure 9 presents three groups of imaging results from the test set before and after the MIS-SE-Net processing. BP imaging requires the relative permittivity of the background medium as a priori knowledge, which varies significantly in mixed soil models. Therefore, all the selected cases here involve metallic targets located in homogeneous media.
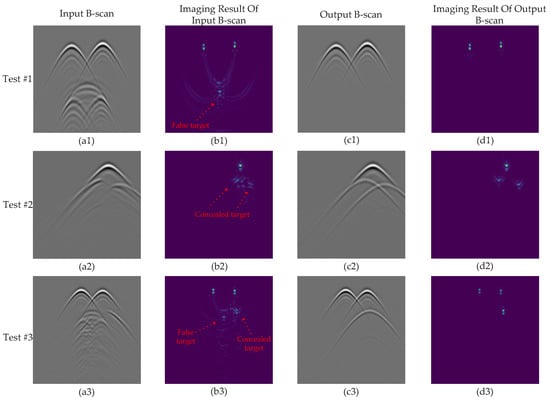
Figure 9.
Comparison of imaging results before and after processing simulated GPR B-scan data by MIS-SE-Net: (a) original GPR B-scan data before processing, (b) imaging results from original GPR B-scan data, (c) output GPR B-scan data after MIS-SE-Net processing, (d) imaging results of processed B-scan data.
Figure 9a shows the original GPR B-scan data before MIS-SE-Net processing, Figure 9b shows the corresponding imaging results, Figure 9c displays the GPR B-scan data after suppression of mutual interference waves and signal enhancement by MIS-SE-Net, and Figure 9d shows the imaging results after processing. In Scenario 1, strong mutual interference waves led to false targets in the imaging result, which MWBP could not suppress. In Scenario 2, the shallow target’s occlusion caused poor focusing on the deep target in the imaging result. Scenario 3 involves both mutual interference and target occlusion, resulting in both false targets and weakened main lobe energy for the deep hidden target. As seen in the network output data, MIS-SE-Net successfully suppressed mutual interference waves in these scenes and enhanced the main lobe energy of the deep hidden targets.
To quantitatively evaluate the imaging results, this study used the integrated side-lobe ratio (ISLR) and signal-to-clutter ratio (SCR) to assess the imaging quality. ISLR measures the ratio of side-lobe energy to main-lobe energy, with a lower value indicating better side-lobe suppression. SCR represents the ratio of target signal power to clutter (or background noise), where a higher value signifies better focusing. Improvements in ISLR and SCR are significant for enhancing the target recognition capabilities of ground-penetrating radar (GPR) in practical applications. For example, in scenarios such as landmine detection and buried structure assessment, a lower ISLR indicates effective suppression of side-lobe energy, thereby significantly reducing interference from false targets. These improvements in ISLR and SCR indicate enhanced clarity and reliability of target signals, which in turn reduces both false alarm rates and missed detection rates.
The definitions of ISLR and SCR are provided in Equations (14) and (15), respectively.
where is the total energy of the image, and is the energy in the main lobe. represents the intensity of pixel i, is the number of pixels in the target area, and is the number of pixels in the clutter or background area, with and representing the target and clutter/background regions, respectively.
On the test set of simulated data, the ISLR and SCR indicators were used to evaluate the improvements in imaging results achieved by MIS-SE-Net, as shown in Table 4. After processing by MIS-SE-Net, the imaging results obtained using MWBP demonstrated an average decrease of 2.37% in ISLR and an average increase of 1.65% in SCR.
Table 4.
MWBP imaging metrics comparison pre- and post- MIS-SE-Net processing on simulated data.
4.4. Lab-Based Experiments
We conducted lab-based experiments to verify the performance of MIS-SE-Net in practical applications. The test environment was a sandbox set up in a laboratory, as shown in Figure 10. The sandbox was filled with dry quartz sand to serve as the background medium, and two targets were randomly placed inside. The targets in the measured dataset include metal rebar with a radius of 3–12 mm and irregularly shaped stones of various sizes. Bomb models were also used for subsequent generalization experiments. By varying the spatial orientation and relative positions of rebar and irregular stones, multiple scenarios of target occlusion and mutual interference were simulated, thereby enhancing the diversity of the measured dataset. We collected data using a GSSI SIR4000 commercial ground-penetrating radar with a center frequency of 2 GHz, following the same dataset construction process as the simulations, ultimately producing a dataset containing 260 sets of measured data.
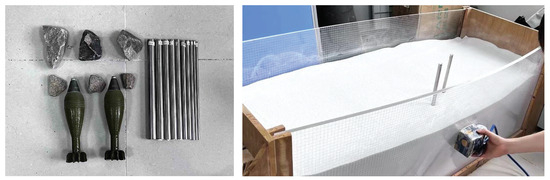
Figure 10.
Lab-based experiment setup with the sandbox and targets. Vertically placed targets were scanned from the side to simulate subsurface detection. Rebar and stone targets were used for training dataset collection, while bomb models were used in subsequent generalization experiments.
The 260 sets of measured data were divided into a training set and a test set at a ratio of 7:3, resulting in 182 training sets and 78 test sets. To enhance the generalization ability of MIS-SE-Net for measured data, data augmentation was performed on the measured training set. Additionally, to maintain the independence and authenticity of the test set, only the 182 training sets were augmented. Since GPR B-scan data are generally insensitive to horizontal changes, horizontal flipping does not cause loss or misinterpretation of semantic information. Therefore, horizontal flipping was performed on the 182 training sets to increase data diversity while preserving the key features of the original images.
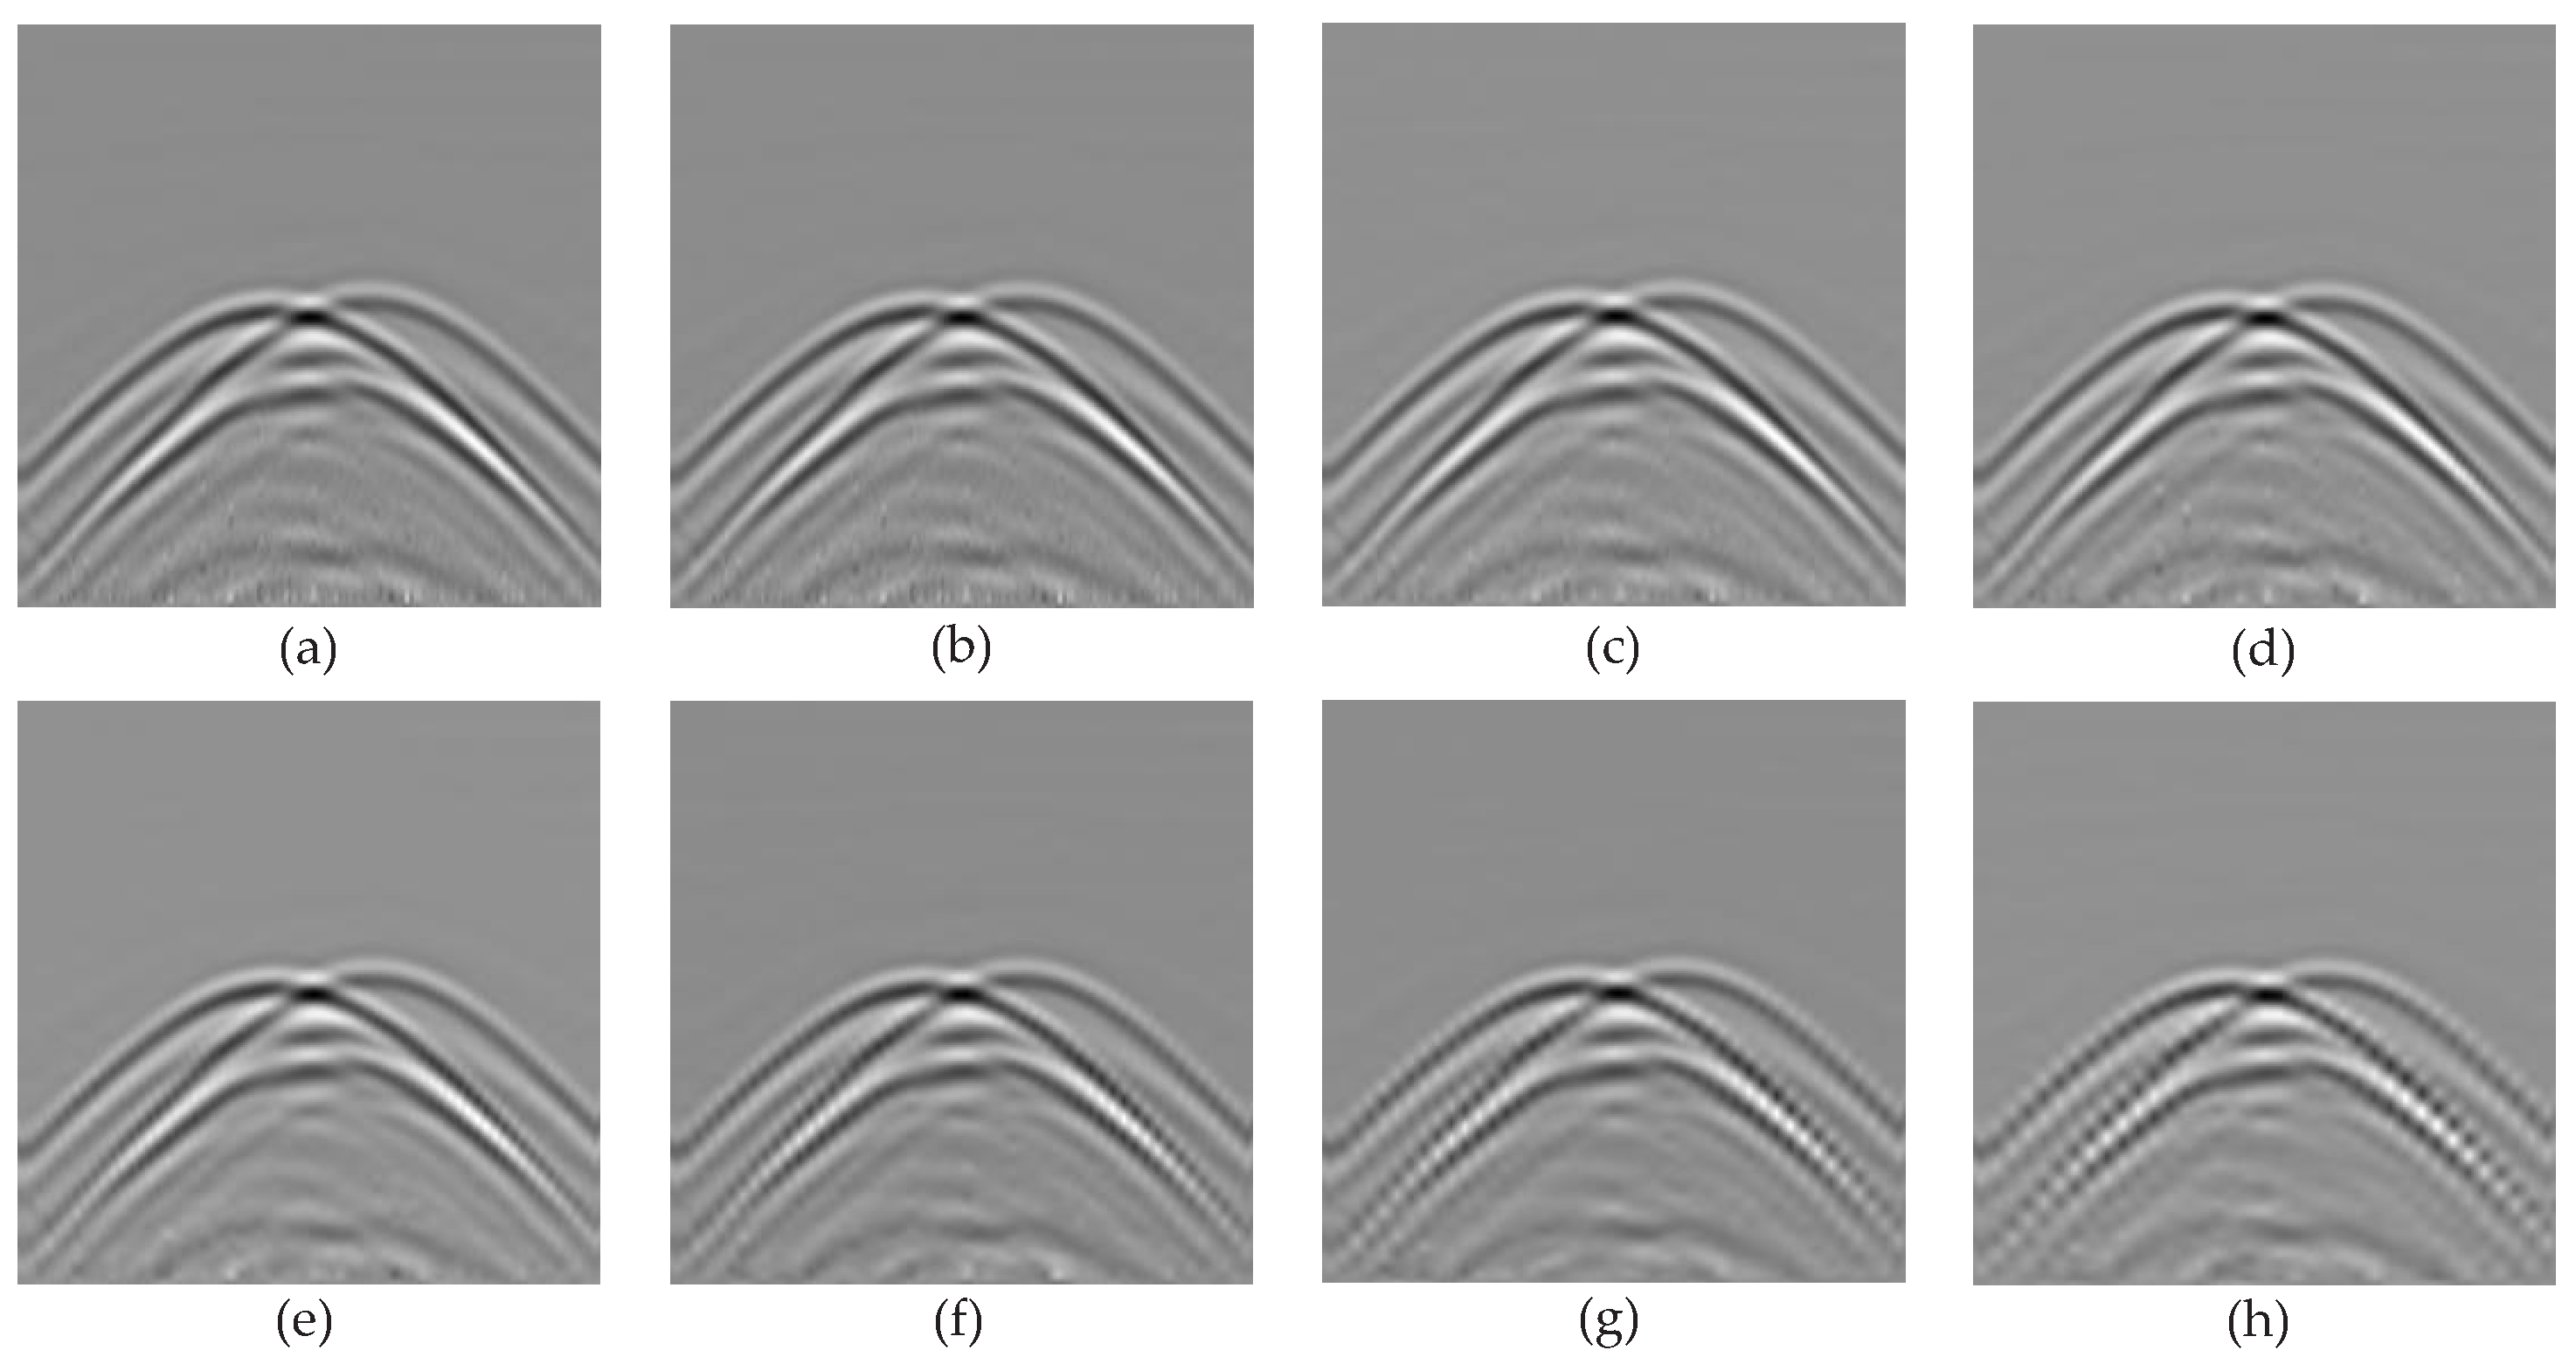
Additionally, we applied sampling interval data augmentation to simulate different sampling distances. The method involved subsampling the GPR B-scan data, where a fixed interval value was set, and an A-scan was extracted every time that value was reached. The GPR B-scan image was then resized to the original dimensions to produce a new GPR B-scan dataset. Figure 11 shows an example of sampling interval data augmentation for one GPR B-scan. Figure 11a represents the original data, while Figure 11b–h represent augmented data with fixed interval values ranging from 1 to 7, respectively. As the extraction interval increases, the pixel values in the image decrease gradually, while the morphological features of the targets in the B-scan image remain unchanged. In this study, we selected augmented data with fixed interval values from 2 to 4, ultimately expanding the training set to 910 sets.
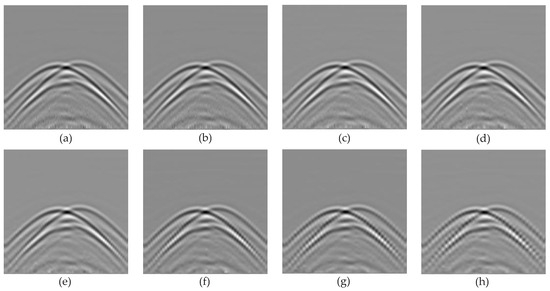
Figure 11.
Example of interval augmentation: (a) original data, (b–h) augmented data with interval values from 1 to 7.
The horizontal flipping and sampling interval alteration simulate the impact of reversed GPR scanning paths and different antenna sampling intervals on the data. The horizontal flipping operation simulates reverse scanning paths, enhancing the network’s ability to generalize across different target arrangement scenarios. Additionally, adjusting the sparsity of sampling intervals creates more diverse antenna spatial sampling patterns, allowing the network to better adapt to different antenna configurations. These two data augmentation techniques effectively extend the model’s adaptability to varying sampling patterns, thereby improving the robustness of the network when dealing with real-world data.
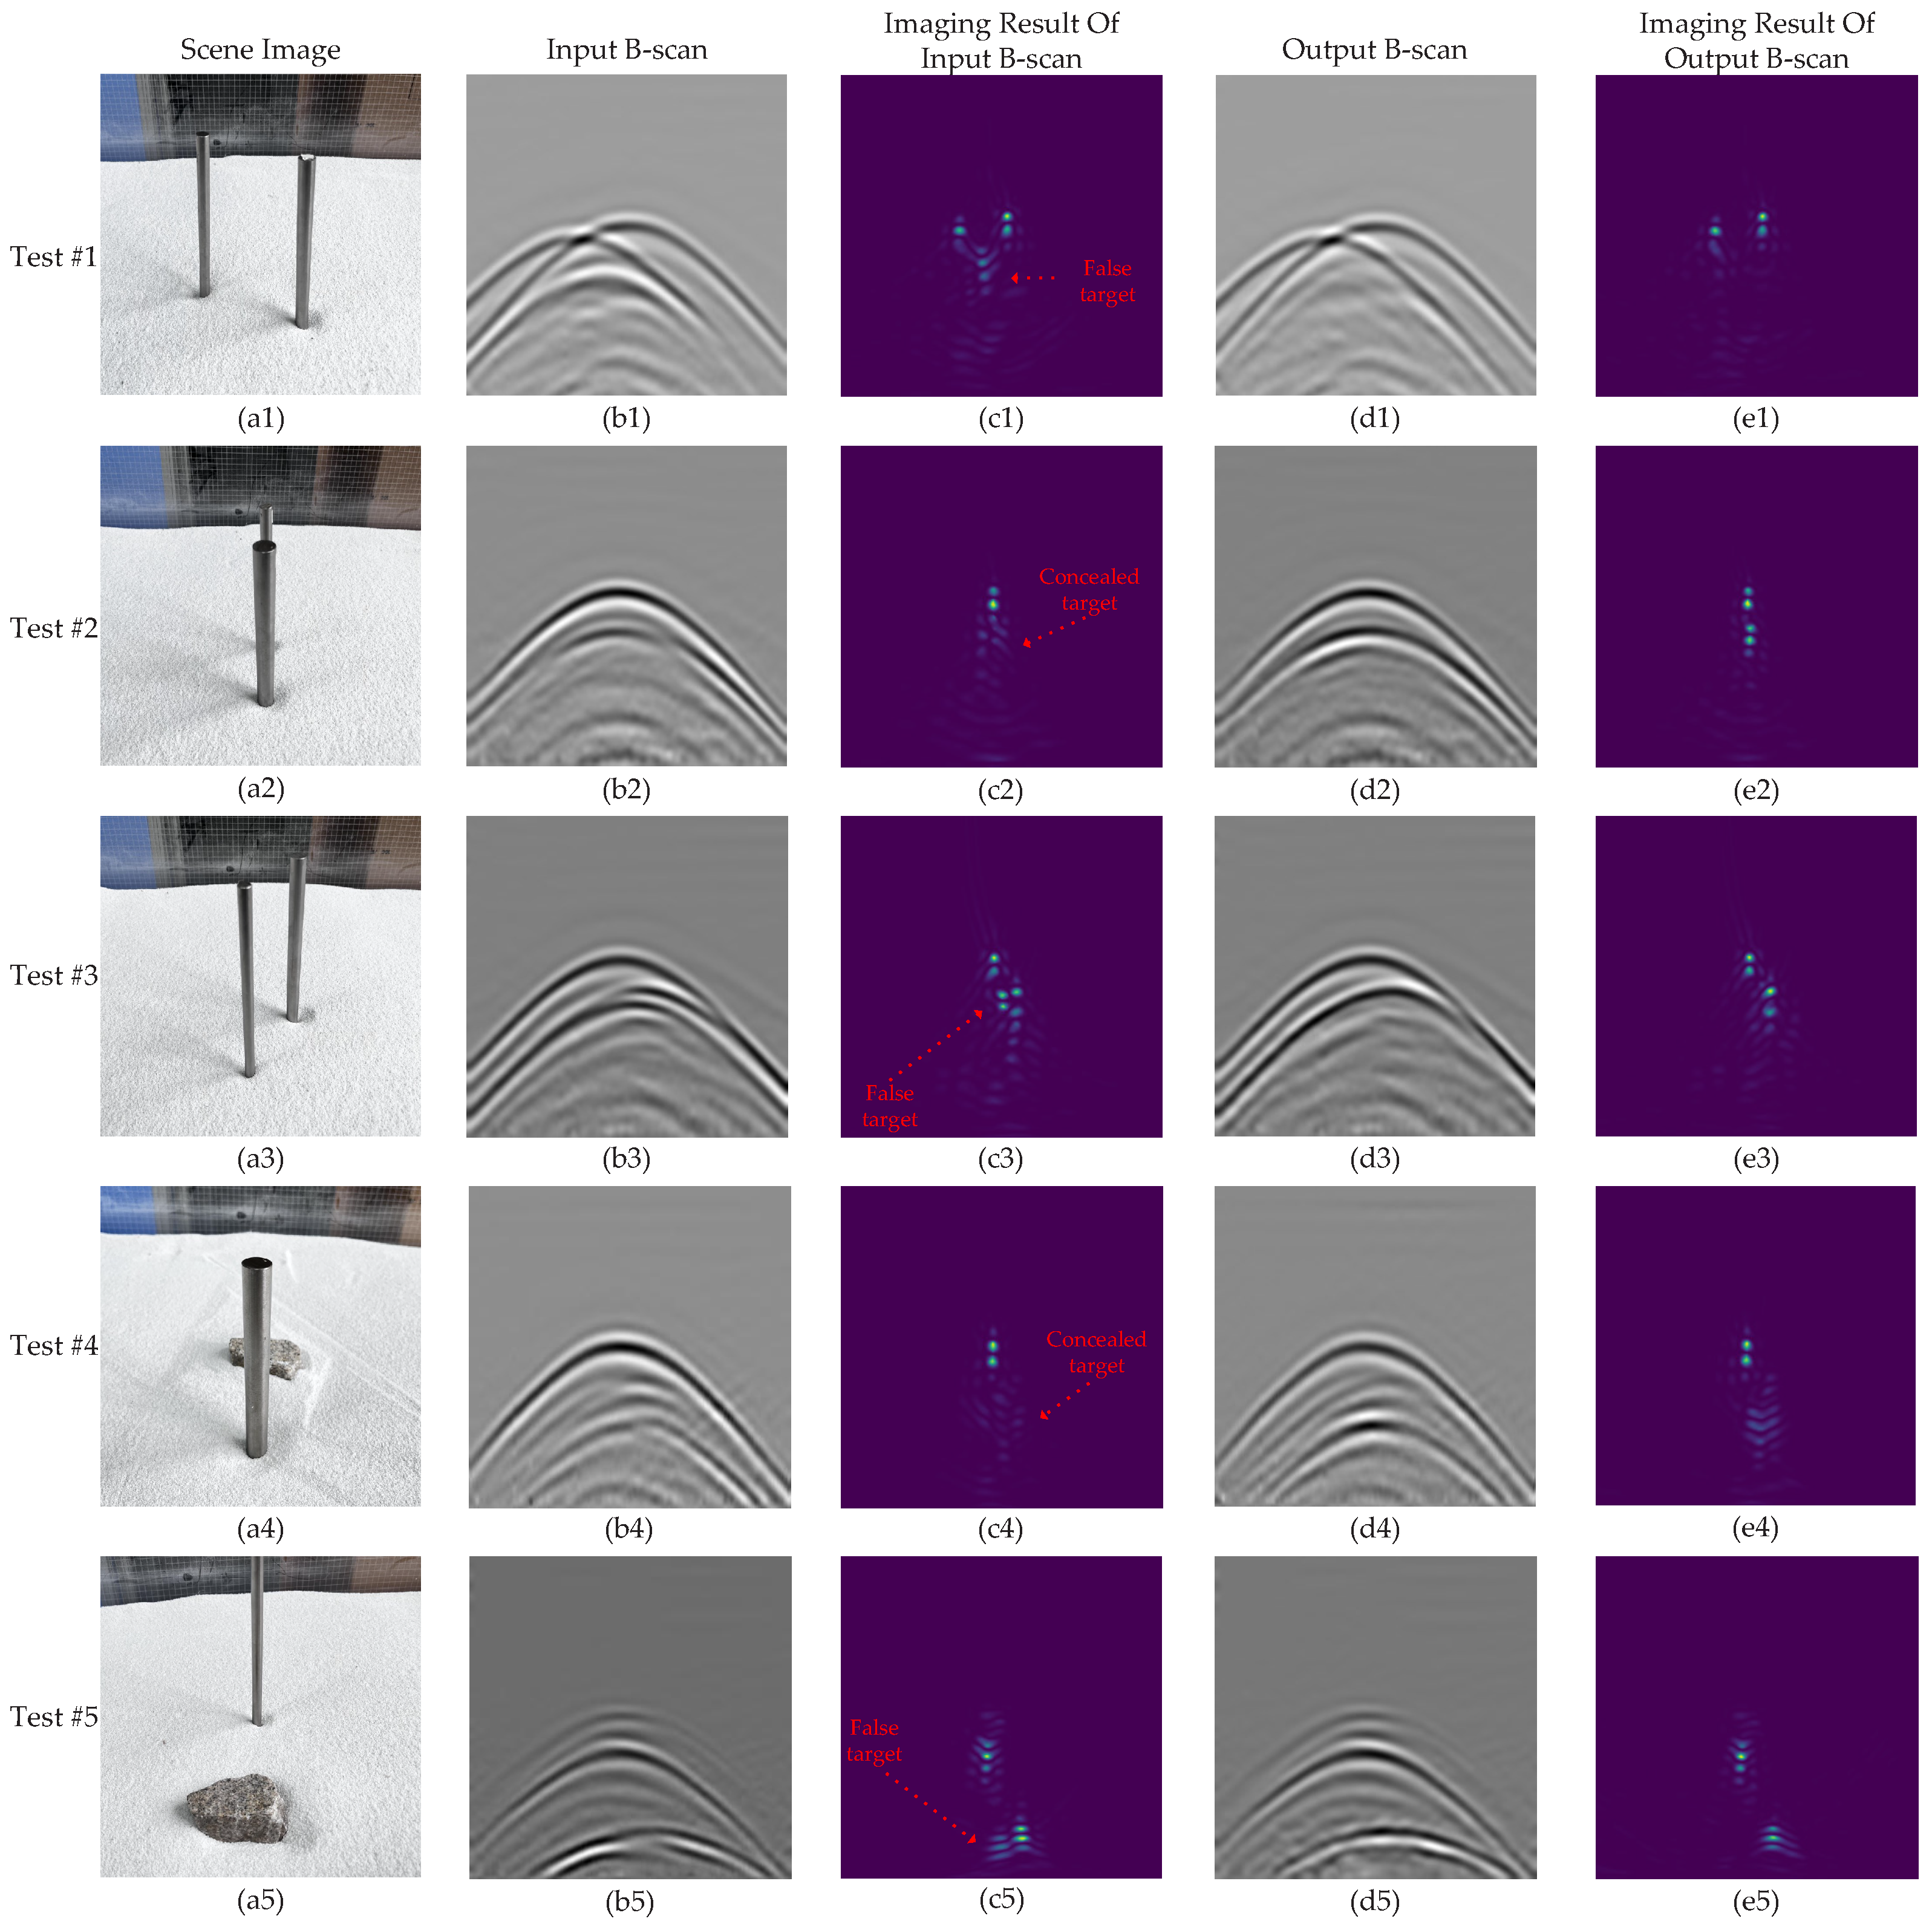
Figure 12 demonstrates the performance of MIS-SE-Net on five typical field scenarios. Figure 12a shows the corresponding field scenario image for the test set. Figure 12b presents the GPR B-scan data used for testing, Figure 12c shows the imaging result of the GPR B-scan data before processing, Figure 12d presents the GPR B-scan data after being processed by MIS-SE-Net, and Figure 12e shows the imaging result of the processed GPR B-scan data.
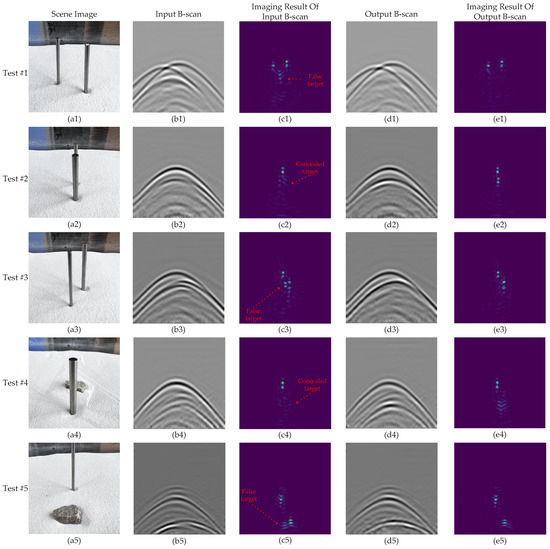
Figure 12.
Lab-based experimental results: (a) test set field scenario image, (b) original GPR B-scan data before processing, (c) imaging results of original B-scan data, (d) Output B-scan data from MIS-SE-Net, (e) imaging results of processed B-scan data.
It is important to note that while the collection procedure for the measured dataset is similar to the simulated data conditions, acquiring measured GPR data involves manually moving the transmitting antenna along an acrylic plate. Thus, the number of A-scans for each GPR B-scan may vary, causing slight lateral misalignment between the original data and the reference label. However, the primary purpose of the field label images is to serve as a reference, as the main objective is to suppress mutual interference waves in the actual GPR data and to enhance the target signals.
In Scenario 1, MIS-SE-Net effectively suppress the mutual interference waves between two rebar targets, as shown in Figure 12(c1). In the original B-scan data, mutual interference waves create visible false targets in the imaging result. After MIS-SE-Net processing, the interference is eliminated, and the false targets are removed. Scenario 2 illustrates the enhancement of concealed target signals when a front rebar obscures a rear rebar. As shown in Figure 12(c2), the concealed rebar in the original B-scan data was blocked by the front rebar, resulting in poor imaging of the hidden rebar. However, after MIS-SE-Net processing, the signal of the concealed rebar is enhanced, allowing it to be successfully focused in the imaging result.
Scenario 3 presents a situation where mutual interference and occlusion occurr simultaneously. As shown in Figure 12(c3,e3), after MIS-SE-Net processing, not only are the false targets suppressed, but the focusing of the concealed rebar is also improved. Scenarios 4 and 5 demonstrate the performance of MIS-SE-Net when rebar obstructs a stone target and when a stone target blocks a rebar, respectively. As shown in Figure 12(c4,e4), the imaging quality of the stone target was significantly enhanced after processing with MIS-SE-Net. As shown in Figure 12(d5,e5), the rebar target that was blocked by the stone was successfully enhanced after MIS-SE-Net processing, restoring the typical hyperbolic shape and improving focusing quality.
To quantitatively evaluate the improvement in imaging quality for the measured test set, we also used the ISLR and SCR metrics, as previously introduced in the simulation experiments, to assess the imaging results before and after MIS-SE-Net processing, as shown in Table 5. The results demonstrate that after MIS-SE-Net processing, the MWBP imaging results achieved an average decrease of 7.51% in the ISLR metric and an average increase of 2.47% in the SCR metric.
Table 5.
MWBP imaging metrics comparison pre- and post- MIS-SE-Net processing on measured data.
4.5. Generalization Experiments
To evaluate the generalization capability of MIS-SE-Net in broader scenarios, additional experiments were conducted. After confirming its outstanding performance in mutual interference suppression and signal enhancement under both simulated and real-world conditions, we tested its effectiveness in scenarios not present in the original dataset. Since background data is not available for performing background subtraction in practical applications, a background removal filter is used in this experiment to remove direct waves.
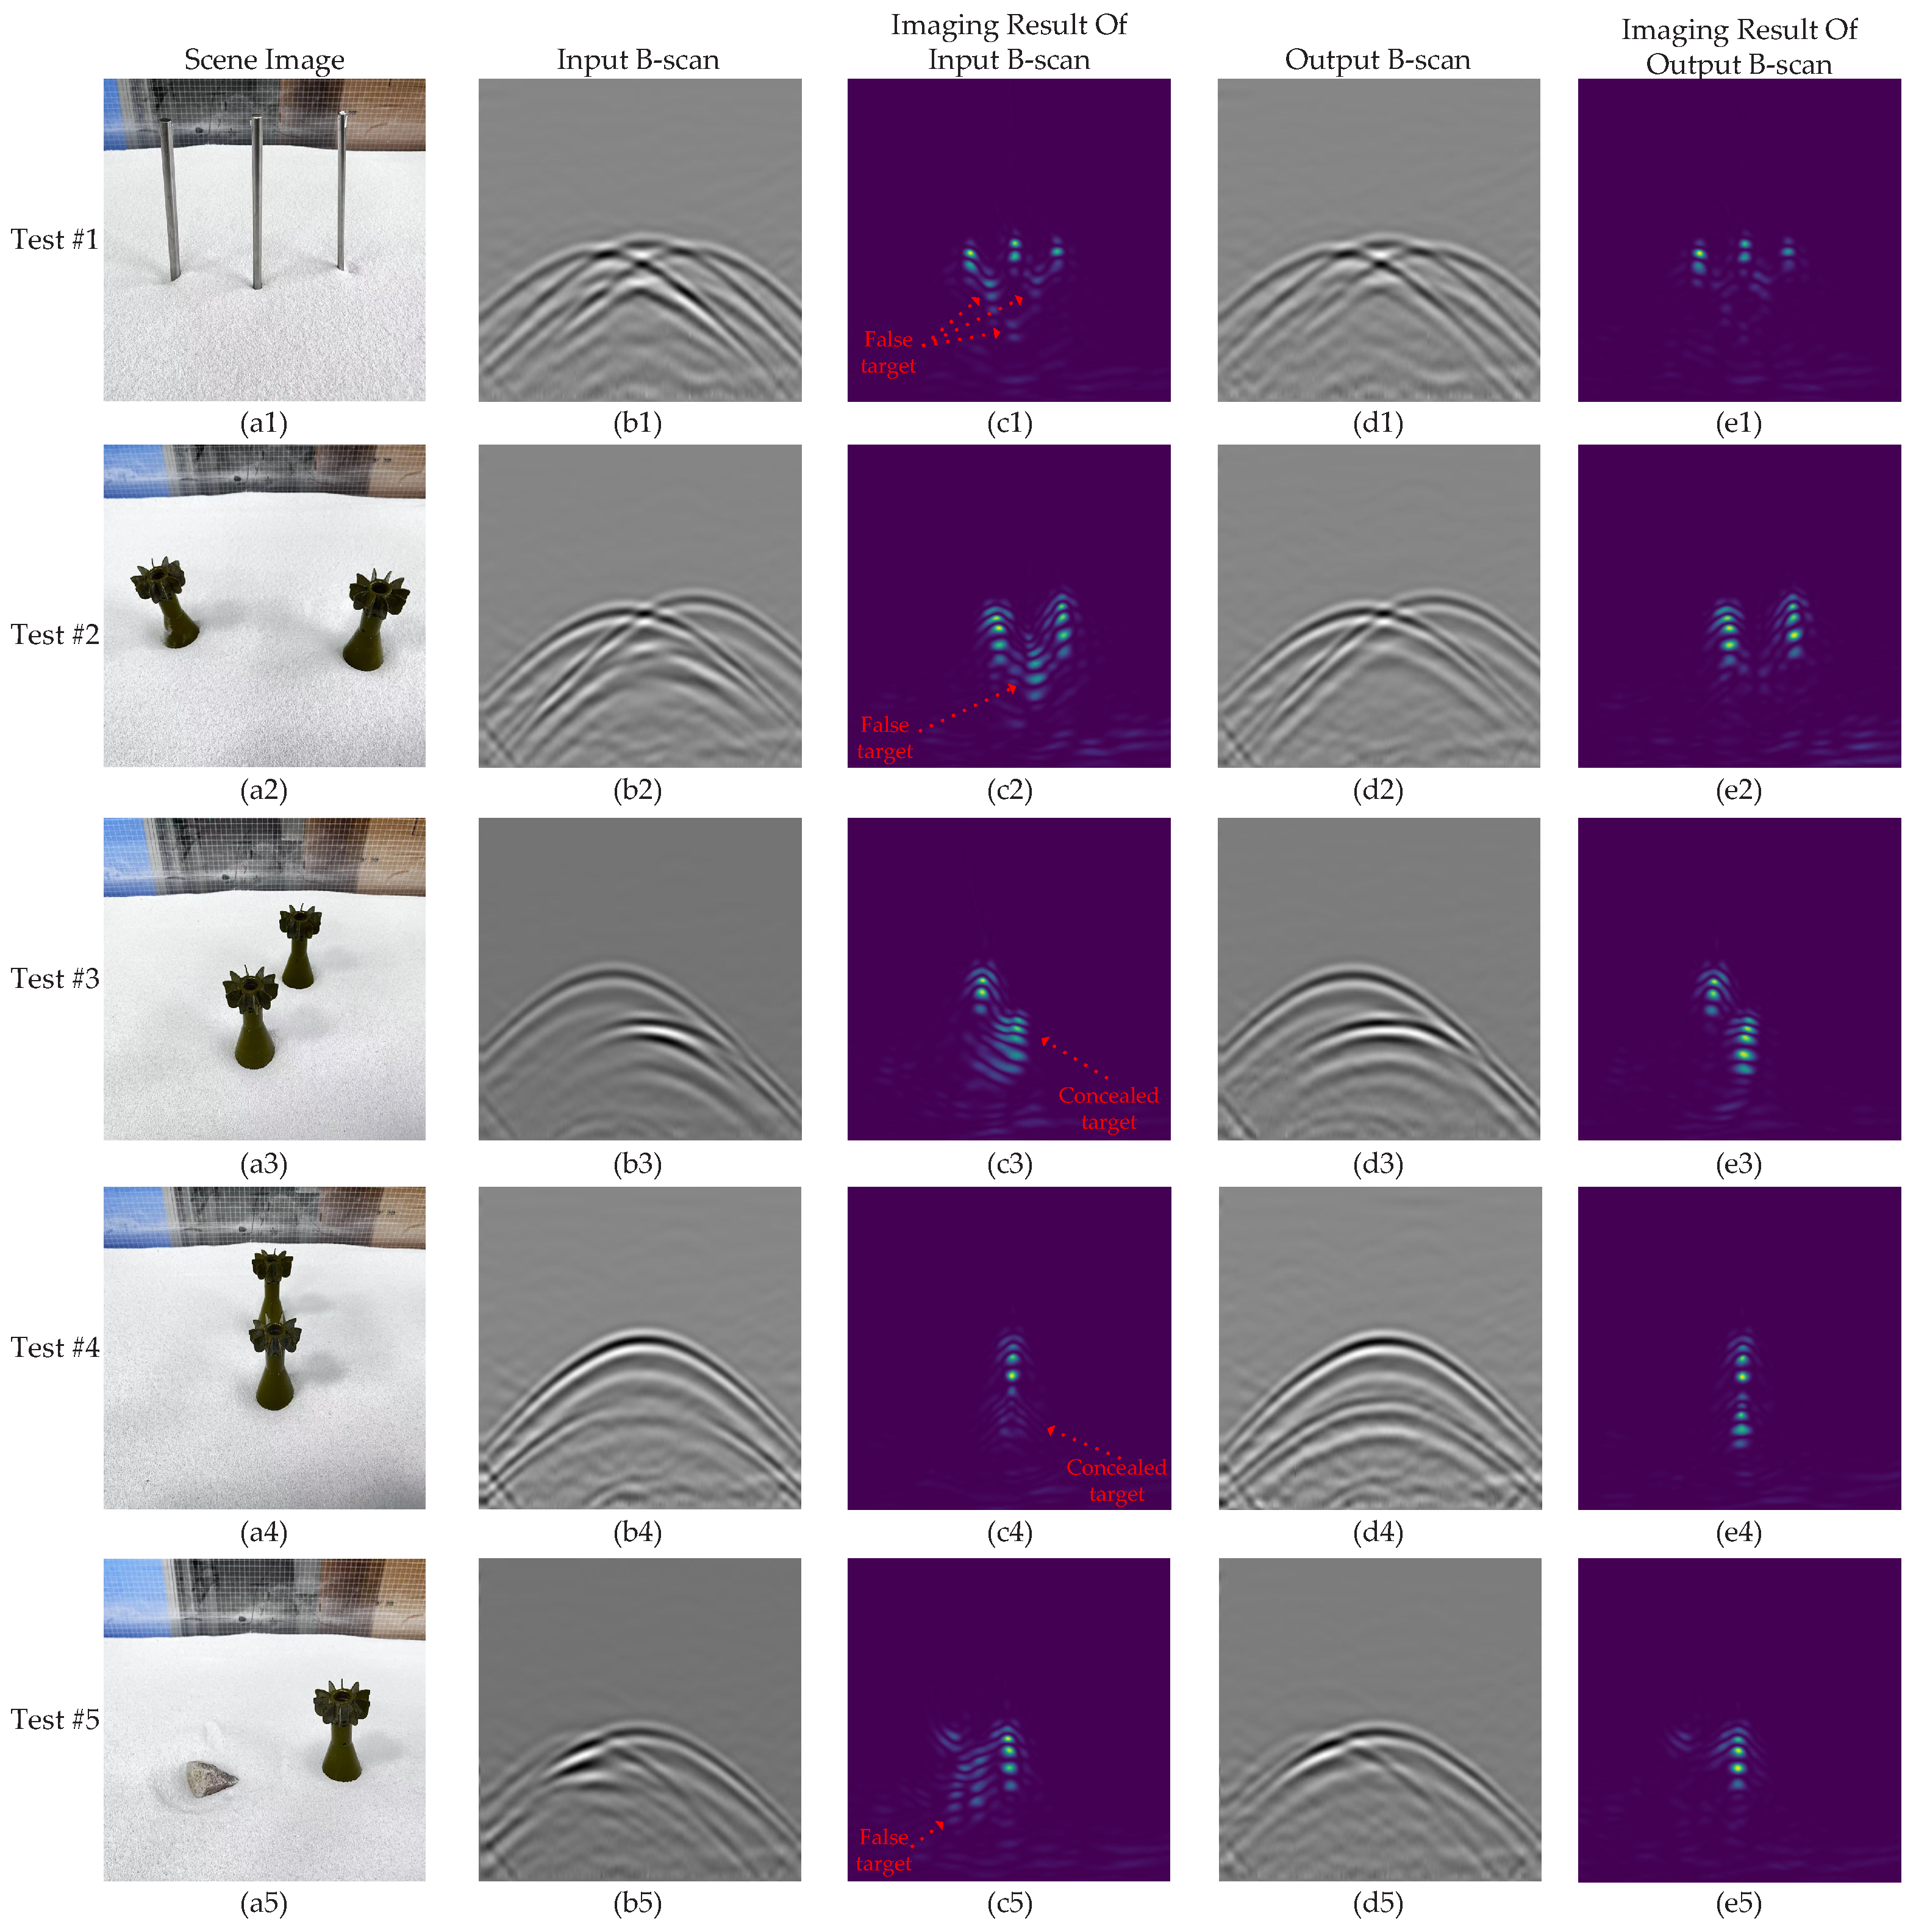
Figure 13 illustrates several representative scenarios. Specifically, Figure 13a shows the images of the physical experimental setup corresponding to the tested scenarios. Figure 13b shows the original GPR B-scan data before processing. Figure 13c presents the imaging results of the unprocessed GPR B-scan data. Figure 13d shows the GPR B-scan data after processing by MIS-SE-Net, and Figure 13e presents the imaging results after the processing.
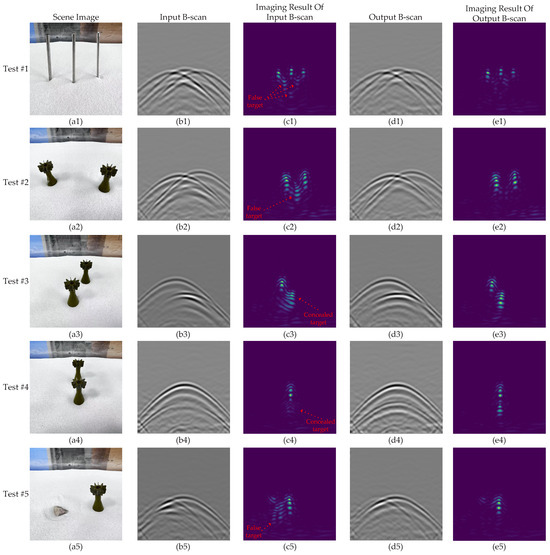
Figure 13.
Generalization test results: (a) test set field scenario image, (b) original GPR B-scan data before processing (with direct waves removed using a background removal filter), (c) imaging results of original B-scan data, (d) Output B-scan data from MIS-SE-Net, (e) imaging results of processed B-scan data.
Scenario 1 involves a three-target set that was not present in the measured training dataset. In this scenario, three metallic rebars were placed in a sandbox. As shown in Figure 13(d1), MIS-SE-Net effectively identifies and suppresses mutual interference waves between the targets. Scenarios 2 to 4 involve bomb models that were not part of the training dataset. For bomb models placed in horizontal, inclined, and vertical orientations, MIS-SE-Net successfully suppressed mutual interference waves and enhanced the target signals. Scenario 5 presents a case where an irregular stone and a bomb model are placed in proximity, leading to mutual interference. Although the reflection from the stone was weaker than the bomb model’s reflection, MIS-SE-Net was still able to identify and suppress the interference.
The results of the generalization experiments demonstrate that MIS-SE-Net exhibits strong generalization performance across diverse scenarios, even when trained on a dataset of limited size. Furthermore, in the experiments in this subsection, the direct waves and random noise were not eliminated using background subtraction algorithms. The GPR B-scan data, preprocessed only with a background removal filter, still showed significant random noise. Despite these conditions, MIS-SE-Net’s robust anti-noise capabilities enabled it to accurately suppress mutual interference waves and enhance target signals.
5. Conclusions
In this paper, we propose a novel deep learning-based mutual interference suppression and signal enhancement method for GPR B-scan data. The proposed MIS-SE-Net network effectively suppresses mutual interference waves and enhances the signals of hidden targets in GPR B-scan images. We used gprMax simulation software and GSSI SIR4000 equipment (Geophysical Survey Systems, Inc. (GSSI), Nashua, NH, USA) to acquire GPR B-scan datasets for our experiments. Additionally, through ablation experiments, we explored the impact of integrating AGs and different loss functions on network performance. The experimental results confirmed the effectiveness of choosing appropriate loss functions for mutual interference suppression and signal enhancement tasks. Overall, our results show that even with a relatively small training dataset, MIS-SE-Net is capable of automatically and efficiently suppressing mutual interference waves while effectively enhancing target signals. Improvements in ISLR and SCR metrics further demonstrate that images processed by MIS-SE-Net exhibit significantly enhanced imaging quality.
We also tested MIS-SE-Net using GPR B-scan images that were not part of the training set to validate its generalization capabilities and robustness. These tests included variations in the number and types of targets, and used a background removal filter, which was not part of the training set, to remove direct waves during preprocessing. With its robust ability to suppress mutual interference waves and enhance signals, MIS-SE-Net proves to be a powerful tool for processing GPR images in multi-target field scenarios. This eliminates the need for experienced GPR researchers to manually identify mutual interference waves and hidden target signals, significantly reducing their workload. Additionally, the interference-free images generated by MIS-SE-Net with enhanced signals pave the way for further GPR image analysis, including radar imaging, target detection, and electromagnetic inversion.
In the future, we plan to expand the MIS-SE-Net dataset with more diverse simulation scenarios, field data, and target categories to further improve its capability in mutual interference wave suppression and signal enhancement, aiming for better performance in complex field applications.
Author Contributions
Methodology, W.L. and X.T.; software, X.T.; validation, W.L., X.T., C.L. and W.X.; formal analysis, C.L.; investigation, W.X.; data curation, X.T.; writing—original draft preparation, X.T.; writing—review and editing, W.L., C.L. and W.X. All authors have read and agreed to the published version of the manuscript.
Funding
This research was funded by the Independent Exploration and Innovation Project of Graduate Students of Central South University (Grant No. 2024ZZTS0805) and the Foundation Project of Science and Technology on Near-Surface Detection Laboratory (Grant No. 6142414221605).
Data Availability Statement
The data presented in this study are available on request from the corresponding author. The data are not publicly available due to requirements surrounding data confidentiality.
Conflicts of Interest
The authors declare no conflicts of interest.
References
- Daniels, D. Ground Penetrating Radar; The Institution of Engineering and Technology Publishing: London, UK, 2004. [Google Scholar]
- Peters, L.; Daniels, J.J.; Young, J.D. Ground penetrating radar as a subsurface environmental sensing tool. Proc. IEEE 1994, 82, 1802–1822. [Google Scholar] [CrossRef]
- Liu, B.; Zhang, F.; Li, S.; Li, Y.; Xu, S.; Nie, L.; Zhang, C.; Zhang, Q. Forward modelling and imaging of ground-penetrating radar in tunnel ahead geological prospecting. Geophys. Prospect. 2018, 66, 784–797. [Google Scholar] [CrossRef]
- Kowalsky, M.B.; Finsterle, S.; Peterson, J.; Hubbard, S.; Rubin, Y.; Majer, E.; Ward, A.; Gee, G. Estimation of field-scale soil hydraulic and dielectric parameters through joint inversion of GPR and hydrological data. Water Resour. Res. 2005, 41, W11425. [Google Scholar] [CrossRef]
- Conyers, L.B. Ground-Penetrating Radar for Archaeology; Rowman & Littlefield: Lanham, MD, USA, 2023. [Google Scholar]
- Qin, H.; Zhang, D.; Tang, Y.; Wang, Y. Automatic recognition of tunnel lining elements from GPR images using deep convolutional networks with data augmentation. Autom. Constr. 2021, 130, 103830. [Google Scholar] [CrossRef]
- Torrione, P.A.; Morton, K.D.; Sakaguchi, R.; Collins, L.M. Histograms of oriented gradients for landmine detection in ground-penetrating radar data. IEEE Trans. Geosci. Remote Sens. 2013, 52, 1539–1550. [Google Scholar] [CrossRef]
- Mohammadi Vizheh, M.; Oskooi, B.; Bastani, M.; Kalscheuer, T. Using GPR data as constraints in RMT data inversion for water content estimation: A case study in Heby, Sweden. Pure Appl. Geophys. 2020, 177, 2903–2929. [Google Scholar] [CrossRef]
- Parnow, S.; Uzor, S.; Lantini, L.; Tosti, F. Enhanced decay detection and structural mapping in tree trunks using GPR and smartphone LiDAR. In Proceedings of the Multimodal Sensing and Artificial Intelligence: Technologies and Applications III, Munich, Germany, 26–29 June 2023; Volume 12621, pp. 41–46. [Google Scholar]
- Parnow, S.; Lantini, L.; Egyir, D.; Tosti, F. An Investigation into Bark Detachment Disease in Tree Trunks Using Different GPR Antennas and Frequency Systems. In Proceedings of the 2023 International Conference on Mechatronics, Control and Robotics (ICMCR), Jeju, Republic of Korea, 18–20 February 2023; pp. 1–5. [Google Scholar]
- Gennarelli, G.; Soldovieri, F. Multipath ghosts in radar imaging: Physical insight and mitigation strategies. IEEE J. Sel. Top. Appl. Earth Obs. Remote Sens. 2014, 8, 1078–1086. [Google Scholar] [CrossRef]
- Gennarelli, G.; Vivone, G.; Braca, P.; Soldovieri, F.; Amin, M.G. Comparative analysis of two approaches for multipath ghost suppression in radar imaging. IEEE Geosci. Remote Sens. Lett. 2016, 13, 1226–1230. [Google Scholar] [CrossRef]
- Catapano, I.; Gennarelli, G.; Ludeno, G.; Soldovieri, F. Applying ground-penetrating radar and microwave tomography data processing in cultural heritage: State of the art and future trends. IEEE Signal Process. Mag. 2019, 36, 53–61. [Google Scholar] [CrossRef]
- Catapano, I.; Gennarelli, G.; Ludeno, G.; Noviello, C.; Esposito, G.; Soldovieri, F. Contactless ground penetrating radar imaging: State of the art, challenges, and microwave tomography-based data processing. IEEE Geosci. Remote Sens. Mag. 2021, 10, 251–273. [Google Scholar] [CrossRef]
- Esposito, G.; Catapano, I.; Ludeno, G.; Soldovieri, F.; Gennarelli, G. A Deep Learning Strategy for Multipath Ghosts Filtering via Microwave Tomography. IEEE Trans. Geosci. Remote Sens. 2023, 62, 1–14. [Google Scholar] [CrossRef]
- Saarenketo, T.; Scullion, T. Road evaluation with ground penetrating radar. J. Appl. Geophys. 2000, 43, 119–138. [Google Scholar] [CrossRef]
- Daniels, D.J. EM Detection of Concealed Targets; John Wiley & Sons: Hoboken, NJ, USA, 2009; Volume 196. [Google Scholar]
- Ma, Y.; Lei, W.; Pang, Z.; Zheng, Z.; Tan, X. Rebar Clutter Suppression and Road Defects Localization in GPR B-Scan Images Based on SuppRebar-GAN and EC-Yolov7 Networks. IEEE Trans. Geosci. Remote Sens. 2024, 62, 1–14. [Google Scholar] [CrossRef]
- Liu, C.; Song, C.; Lu, Q. Random noise de-noising and direct wave eliminating based on SVD method for ground penetrating radar signals. J. Appl. Geophys. 2017, 144, 125–133. [Google Scholar] [CrossRef]
- Feng, D.; Liu, S.; Yang, J.; Wang, X.; Wang, X. The noise attenuation and stochastic clutter removal of ground penetrating radar based on the K-SVD dictionary learning. IEEE Access 2021, 9, 74879–74890. [Google Scholar] [CrossRef]
- Hao, T.; Jing, L.; He, W. An automated GPR signal denoising scheme based on mode decomposition and principal component analysis. IEEE Geosci. Remote Sens. Lett. 2022, 20, 3500105. [Google Scholar] [CrossRef]
- He, X.; Yan, H.; Wang, C.; Zheng, R.; Li, Y.; Li, X. Non-stationary random noise removal in ground-penetrating radar images by using self-guided filtering. Digit. Signal Process. 2022, 129, 103690. [Google Scholar] [CrossRef]
- Baili, J.; Lahouar, S.; Hergli, M.; Al-Qadi, I.L.; Besbes, K. GPR signal de-noising by discrete wavelet transform. Ndt E Int. 2009, 42, 696–703. [Google Scholar] [CrossRef]
- Verdonck, L.; Vermeulen, F.; Docter, R.; Meyer, C.; Kniess, R. 2D and 3D ground-penetrating radar surveys with a modular system: Data processing strategies and results from archaeological field tests. Surf. Geophys. 2013, 11, 239–252. [Google Scholar] [CrossRef]
- Wang, X.; Liu, S. Noise suppressing and direct wave arrivals removal in GPR data based on Shearlet transform. Signal Process. 2017, 132, 227–242. [Google Scholar] [CrossRef]
- Terrasse, G.; Nicolas, J.M.; Trouvé, E.; Drouet, E. Application of the curvelet transform for clutter and noise removal in GPR data. IEEE J. Sel. Top. Appl. Earth Obs. Remote Sens. 2017, 10, 4280–4294. [Google Scholar] [CrossRef]
- Oskooi, B.; Julayusefi, M.; Goudarzi, A. GPR noise reduction based on wavelet thresholdings. Arab. J. Geosci. 2015, 8, 2937–2951. [Google Scholar] [CrossRef]
- Oskooi, B.; Parnow, S.; Smirnov, M.; Varfinezhad, R.; Yari, M. Attenuation of random noise in GPR data by image processing. Arab. J. Geosci. 2018, 11, 677. [Google Scholar] [CrossRef]
- Abujarad, F.; Nadim, G.; Omar, A. Clutter reduction and detection of landmine objects in ground penetrating radar data using singular value decomposition (SVD). In Proceedings of the 3rd International Workshop on Advanced Ground Penetrating Radar, IWAGPR 2005, Delft, The Netherlands, 2–3 May 2005; pp. 37–42. [Google Scholar]
- Chen, G.; Fu, L.; Chen, K.; Boateng, C.D.; Ge, S. Adaptive ground clutter reduction in ground-penetrating radar data based on principal component analysis. IEEE Trans. Geosci. Remote Sens. 2019, 57, 3271–3282. [Google Scholar] [CrossRef]
- Abujarad, F.; Omar, A. Comparison of independent component analysis (ICA) algorithms for GPR detection of non-metallic land mines. In Proceedings of the Image and Signal Processing for Remote Sensing XII, Stockholm, Sweden, 13–14 September 2006; Volume 6365, pp. 362–373. [Google Scholar]
- Kumlu, D.; Erer, I. Performance evaluation of NMF methods with different divergence metrics for landmine detection in GPR. In Proceedings of the Target and Background Signatures IV, Berlin, Germany, 10–11 September 2018; Volume 10794, pp. 158–167. [Google Scholar]
- Temlioglu, E.; Erer, I. Clutter removal in ground-penetrating radar images using morphological component analysis. IEEE Geosci. Remote Sens. Lett. 2016, 13, 1802–1806. [Google Scholar] [CrossRef]
- Kumlu, D.; Erer, I. Improved clutter removal in GPR by robust nonnegative matrix factorization. IEEE Geosci. Remote Sens. Lett. 2019, 17, 958–962. [Google Scholar] [CrossRef]
- Song, X.; Xiang, D.; Zhou, K.; Su, Y. Improving RPCA-based clutter suppression in GPR detection of antipersonnel mines. IEEE Geosci. Remote Sens. Lett. 2017, 14, 1338–1342. [Google Scholar] [CrossRef]
- Ni, Z.K.; Ye, S.; Shi, C.; Li, C.; Fang, G. Clutter suppression in GPR B-scan images using robust autoencoder. IEEE Geosci. Remote Sens. Lett. 2020, 19, 1–5. [Google Scholar] [CrossRef]
- Fracastoro, G.; Magli, E.; Poggi, G.; Scarpa, G.; Valsesia, D.; Verdoliva, L. Deep learning methods for synthetic aperture radar image despeckling: An overview of trends and perspectives. IEEE Geosci. Remote Sens. Mag. 2021, 9, 29–51. [Google Scholar] [CrossRef]
- Lei, W.; Luo, J.; Hou, F.; Xu, L.; Wang, R.; Jiang, X. Underground cylindrical objects detection and diameter identification in GPR B-scans via the CNN-LSTM framework. Electronics 2020, 9, 1804. [Google Scholar] [CrossRef]
- Hou, F.; Lei, W.; Li, S.; Xi, J. Deep learning-based subsurface target detection from GPR scans. IEEE Sens. J. 2021, 21, 8161–8171. [Google Scholar] [CrossRef]
- Dai, Q.; Lee, Y.H.; Sun, H.H.; Ow, G.; Yusof, M.L.M.; Yucel, A.C. 3DInvNet: A deep learning-based 3D ground-penetrating radar data inversion. IEEE Trans. Geosci. Remote Sens. 2023, 61, 5105016. [Google Scholar] [CrossRef]
- Liu, Y.; Feng, D.; Xiao, Y.; Huang, G.; Cai, L.; Tai, X.; Wang, X. Full Waveform Inversion of Multi-frequency GPR data using a Multiscale Approach based on Deep Learning. IEEE Trans. Geosci. Remote Sens. 2024, 62, 5910212. [Google Scholar] [CrossRef]
- Luo, J.; Lei, W.; Hou, F.; Wang, C.; Ren, Q.; Zhang, S.; Luo, S.; Wang, Y.; Xu, L. GPR B-scan image denoising via multi-scale convolutional autoencoder with data augmentation. Electronics 2021, 10, 1269. [Google Scholar] [CrossRef]
- Feng, D.; Wang, X.; Wang, X.; Ding, S.; Zhang, H. Deep convolutional denoising autoencoders with network structure optimization for the high-fidelity attenuation of random GPR noise. Remote Sens. 2021, 13, 1761. [Google Scholar] [CrossRef]
- Wang, Q.; Chen, Y.; Shen, Y.; Li, M. Construction Environment Noise Suppression of Ground-Penetrating Radar Signals Based on an RG-DMSA Neural Network. Electronics 2024, 13, 2843. [Google Scholar] [CrossRef]
- Sun, H.H.; Cheng, W.; Fan, Z. Learning to remove clutter in real-world GPR images using hybrid data. IEEE Trans. Geosci. Remote Sens. 2022, 60, 1–14. [Google Scholar] [CrossRef]
- Ge, J.; Sun, H.; Shao, W.; Liu, D.; Liu, H.; Zhao, F.; Tian, B.; Liu, S. Wavelet-GAN: A GPR Noise and Clutter Removal Method Based on Small Real Datasets. IEEE Trans. Geosci. Remote Sens. 2024, 62, 5918214. [Google Scholar] [CrossRef]
- Zhu, J.Y.; Park, T.; Isola, P.; Efros, A.A. Unpaired image-to-image translation using cycle-consistent adversarial networks. In Proceedings of the IEEE International Conference on Computer Vision, Venice, Italy, 22–29 October 2017; pp. 2223–2232. [Google Scholar]
- Johnson, J.; Alahi, A.; Fei-Fei, L. Perceptual losses for real-time style transfer and super-resolution. In Proceedings of the Computer Vision–ECCV 2016: 14th European Conference, Amsterdam, The Netherlands, 11–14 October 2016; Proceedings, Part II 14. Springer: Cham, Switzerland, 2016; pp. 694–711. [Google Scholar]
- Deng, J.; Dong, W.; Socher, R.; Li, L.J.; Li, K.; Fei-Fei, L. Imagenet: A large-scale hierarchical image database. In Proceedings of the 2009 IEEE Conference on Computer Vision and Pattern Recognition, Miami, FL, USA, 20–25 June 2009; pp. 248–255. [Google Scholar]
- Simonyan, K.; Zisserman, A. Very deep convolutional networks for large-scale image recognition. arXiv 2014, arXiv:1409.1556. [Google Scholar]
- Warren, C.; Giannopoulos, A.; Giannakis, I. gprMax: Open source software to simulate electromagnetic wave propagation for Ground Penetrating Radar. Comput. Phys. Commun. 2016, 209, 163–170. [Google Scholar] [CrossRef]
- Peplinski, N.R.; Ulaby, F.T.; Dobson, M.C. Dielectric properties of soils in the 0.3-1.3-GHz range. IEEE Trans. Geosci. Remote Sens. 1995, 33, 803–807. [Google Scholar] [CrossRef]
- Nobes, D.C.; Davis, E.F.; Arcone, S.A. “Mirror-image” multiples in ground-penetrating radar. Geophysics 2005, 70, K20–K22. [Google Scholar] [CrossRef]
- Carin, L.; Geng, N.; McClure, M.; Sichina, J.; Nguyen, L. Ultra-wide-band synthetic-aperture radar for mine-field detection. IEEE Antennas Propag. Mag. 1999, 41, 18–33. [Google Scholar] [CrossRef]
- Lei, W.; Shi, R.; Dong, J.; Shi, Y. A multi-scale weighted back projection imaging technique for ground penetrating radar applications. Remote Sens. 2014, 6, 5151–5163. [Google Scholar] [CrossRef]
Disclaimer/Publisher’s Note: The statements, opinions and data contained in all publications are solely those of the individual author(s) and contributor(s) and not of MDPI and/or the editor(s). MDPI and/or the editor(s) disclaim responsibility for any injury to people or property resulting from any ideas, methods, instructions or products referred to in the content. |
© 2024 by the authors. Licensee MDPI, Basel, Switzerland. This article is an open access article distributed under the terms and conditions of the Creative Commons Attribution (CC BY) license (https://creativecommons.org/licenses/by/4.0/).