
Vehicle Target Detection Using the Improved YOLOv5s Algorithm


Abstract
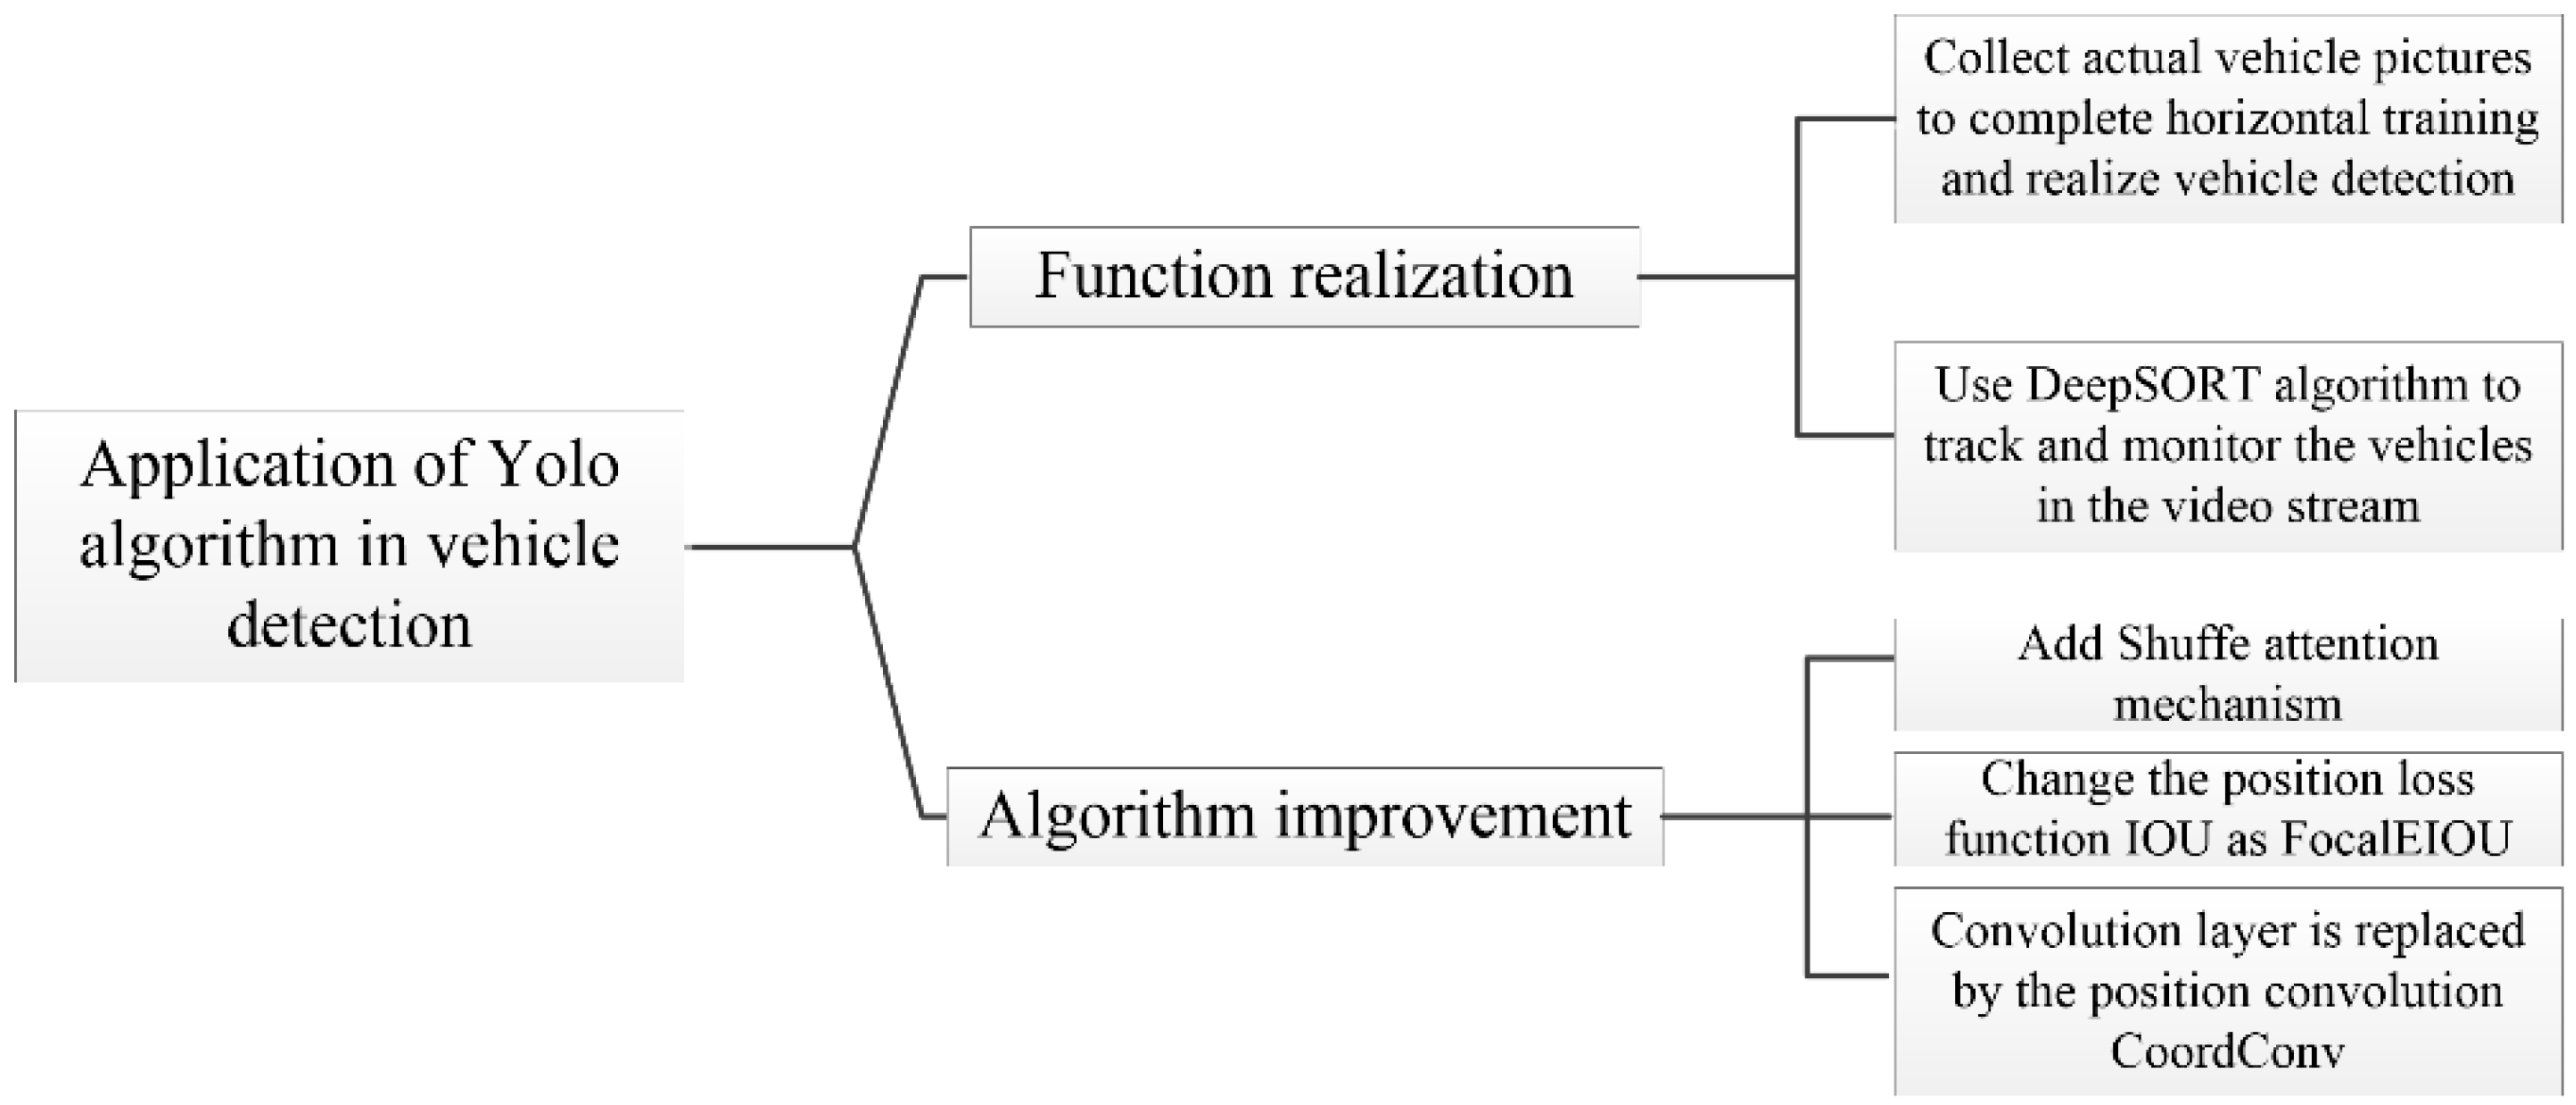
1. Introduction
2. Improved YOLOv5s Model
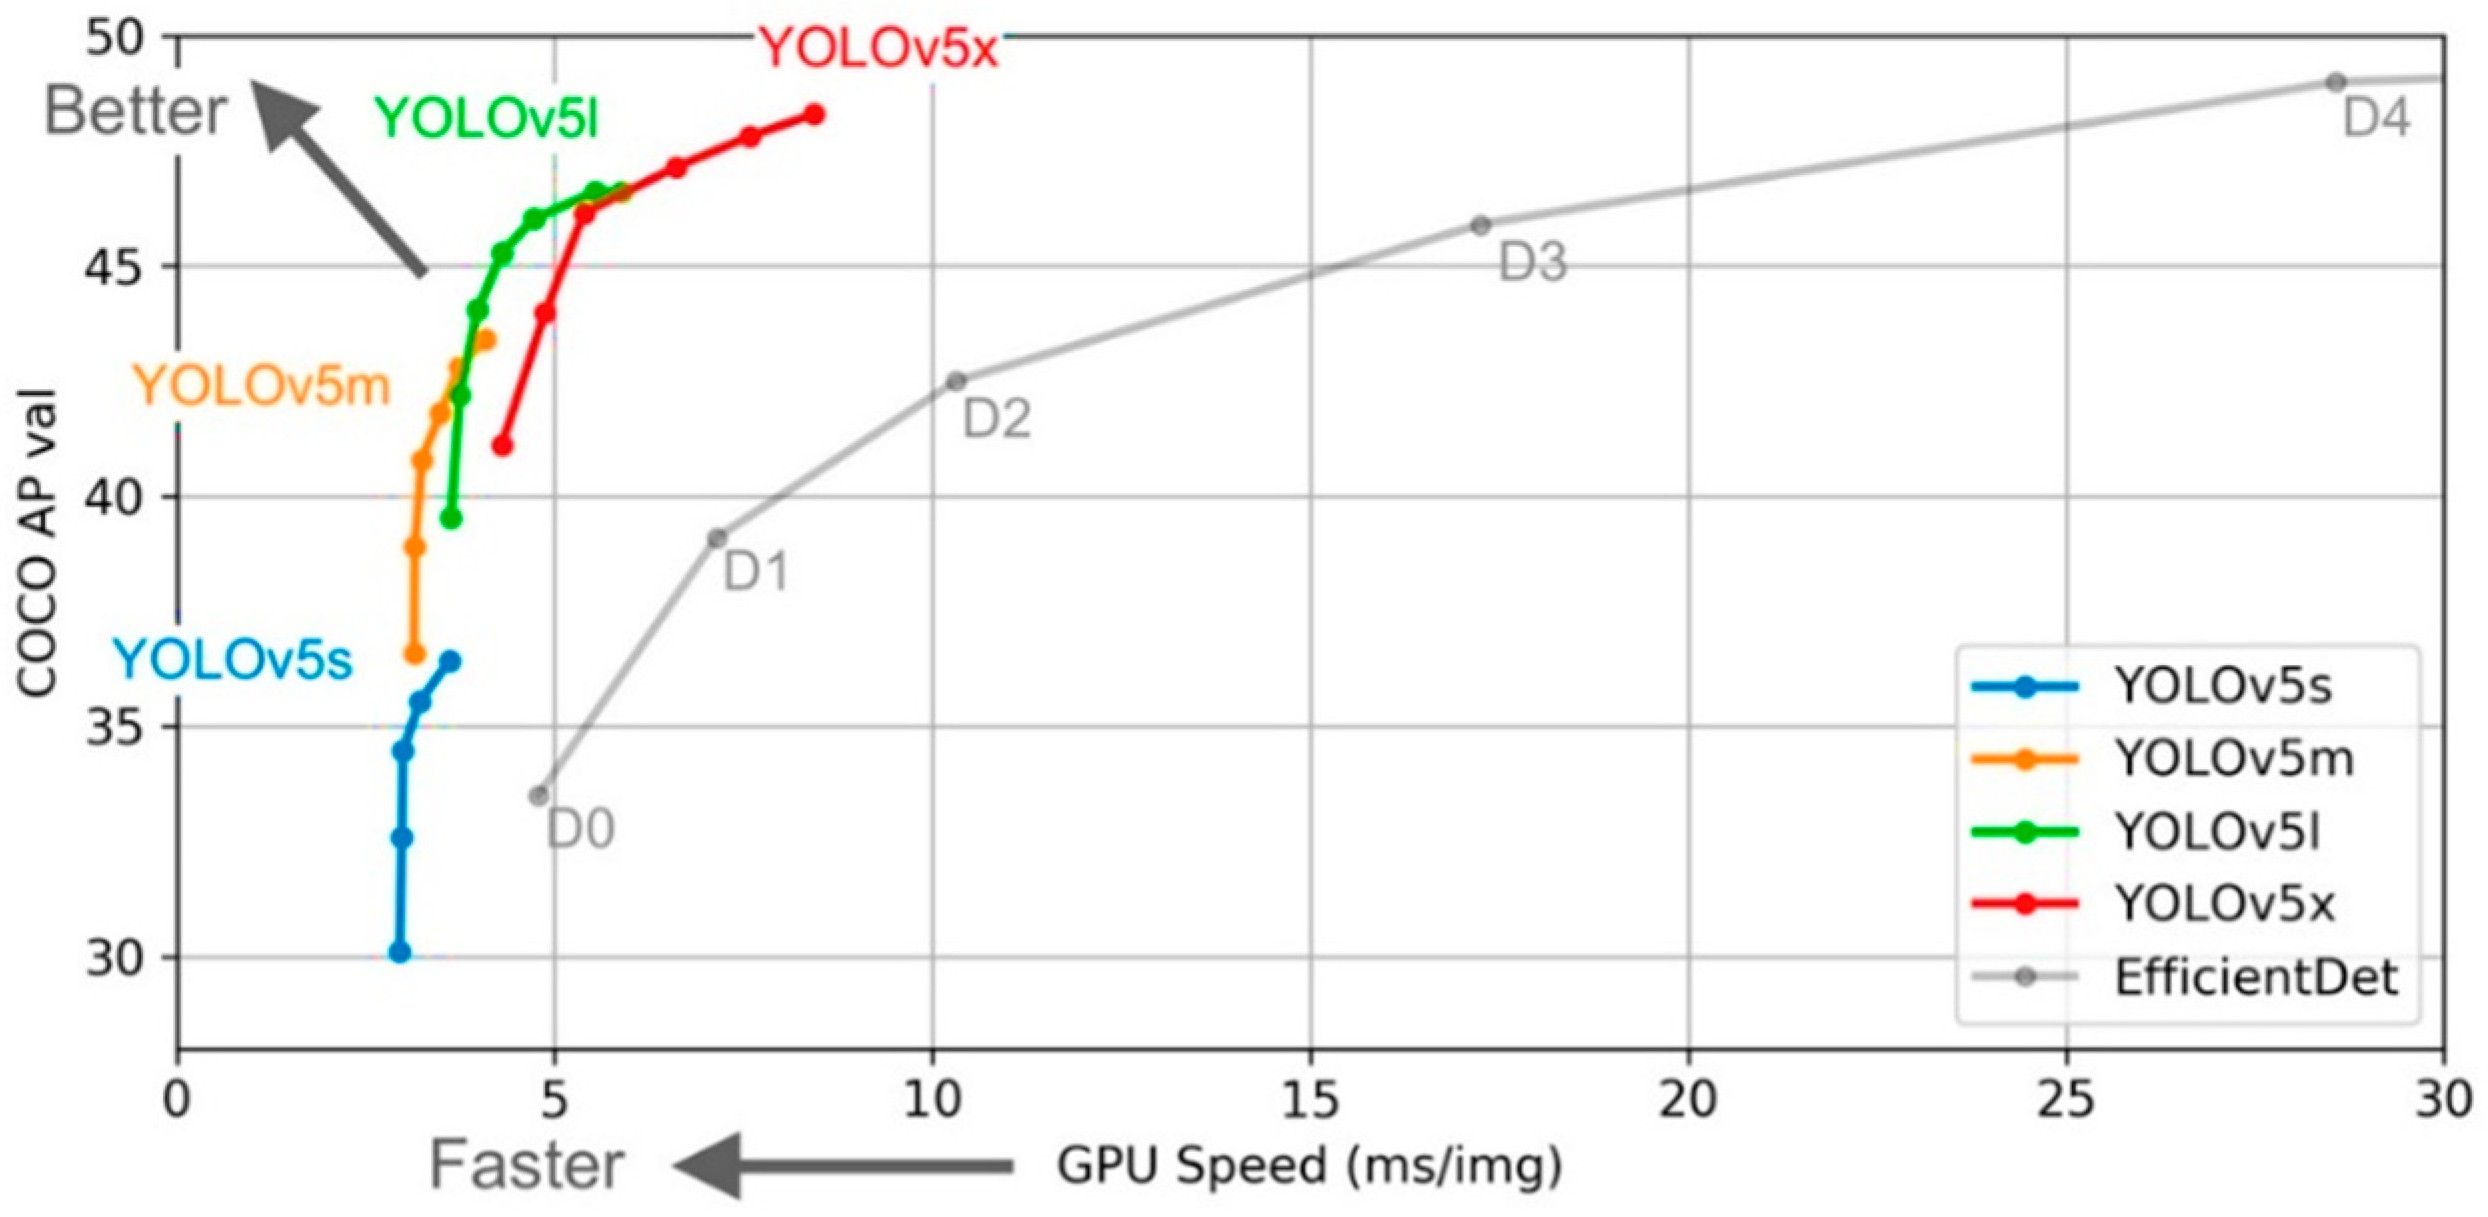
2.1. Structure of YOLOv5s Model
2.2. YOLOv5s Algorithm Improvement
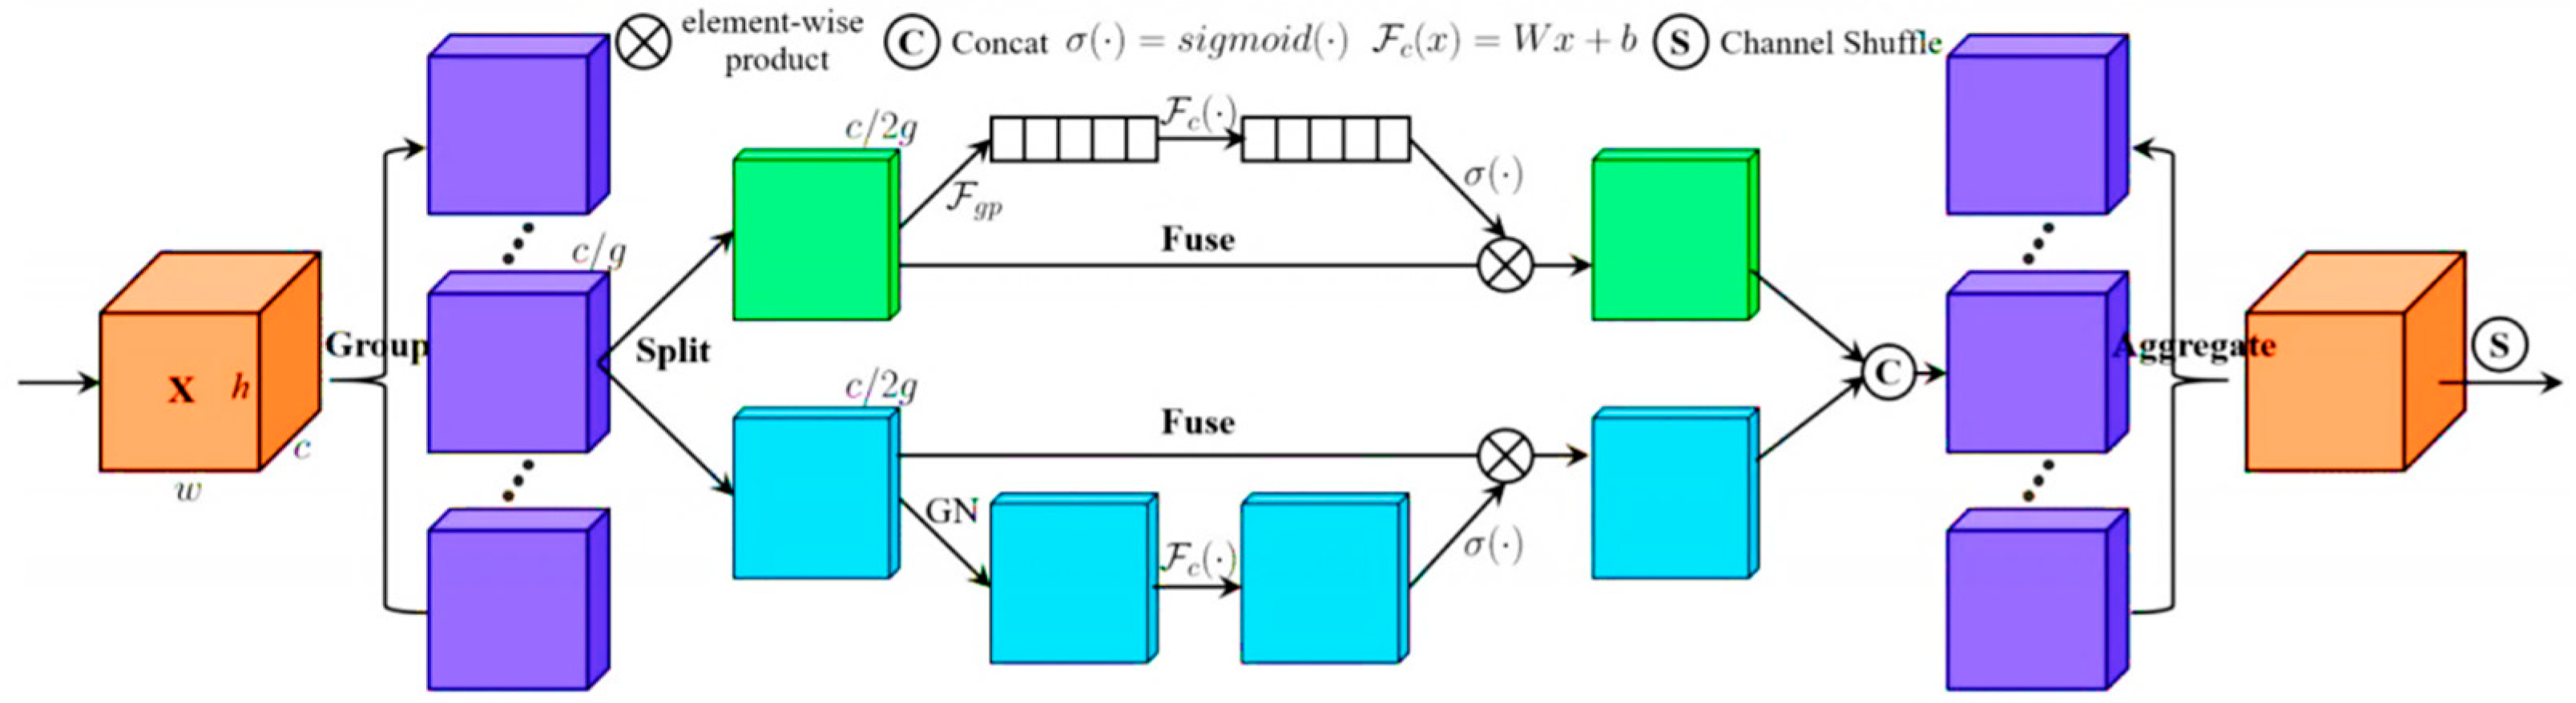
2.2.1. Add Shuffle Attentain Mechanism
2.2.2. Add CoordConv in Convolutional Layer
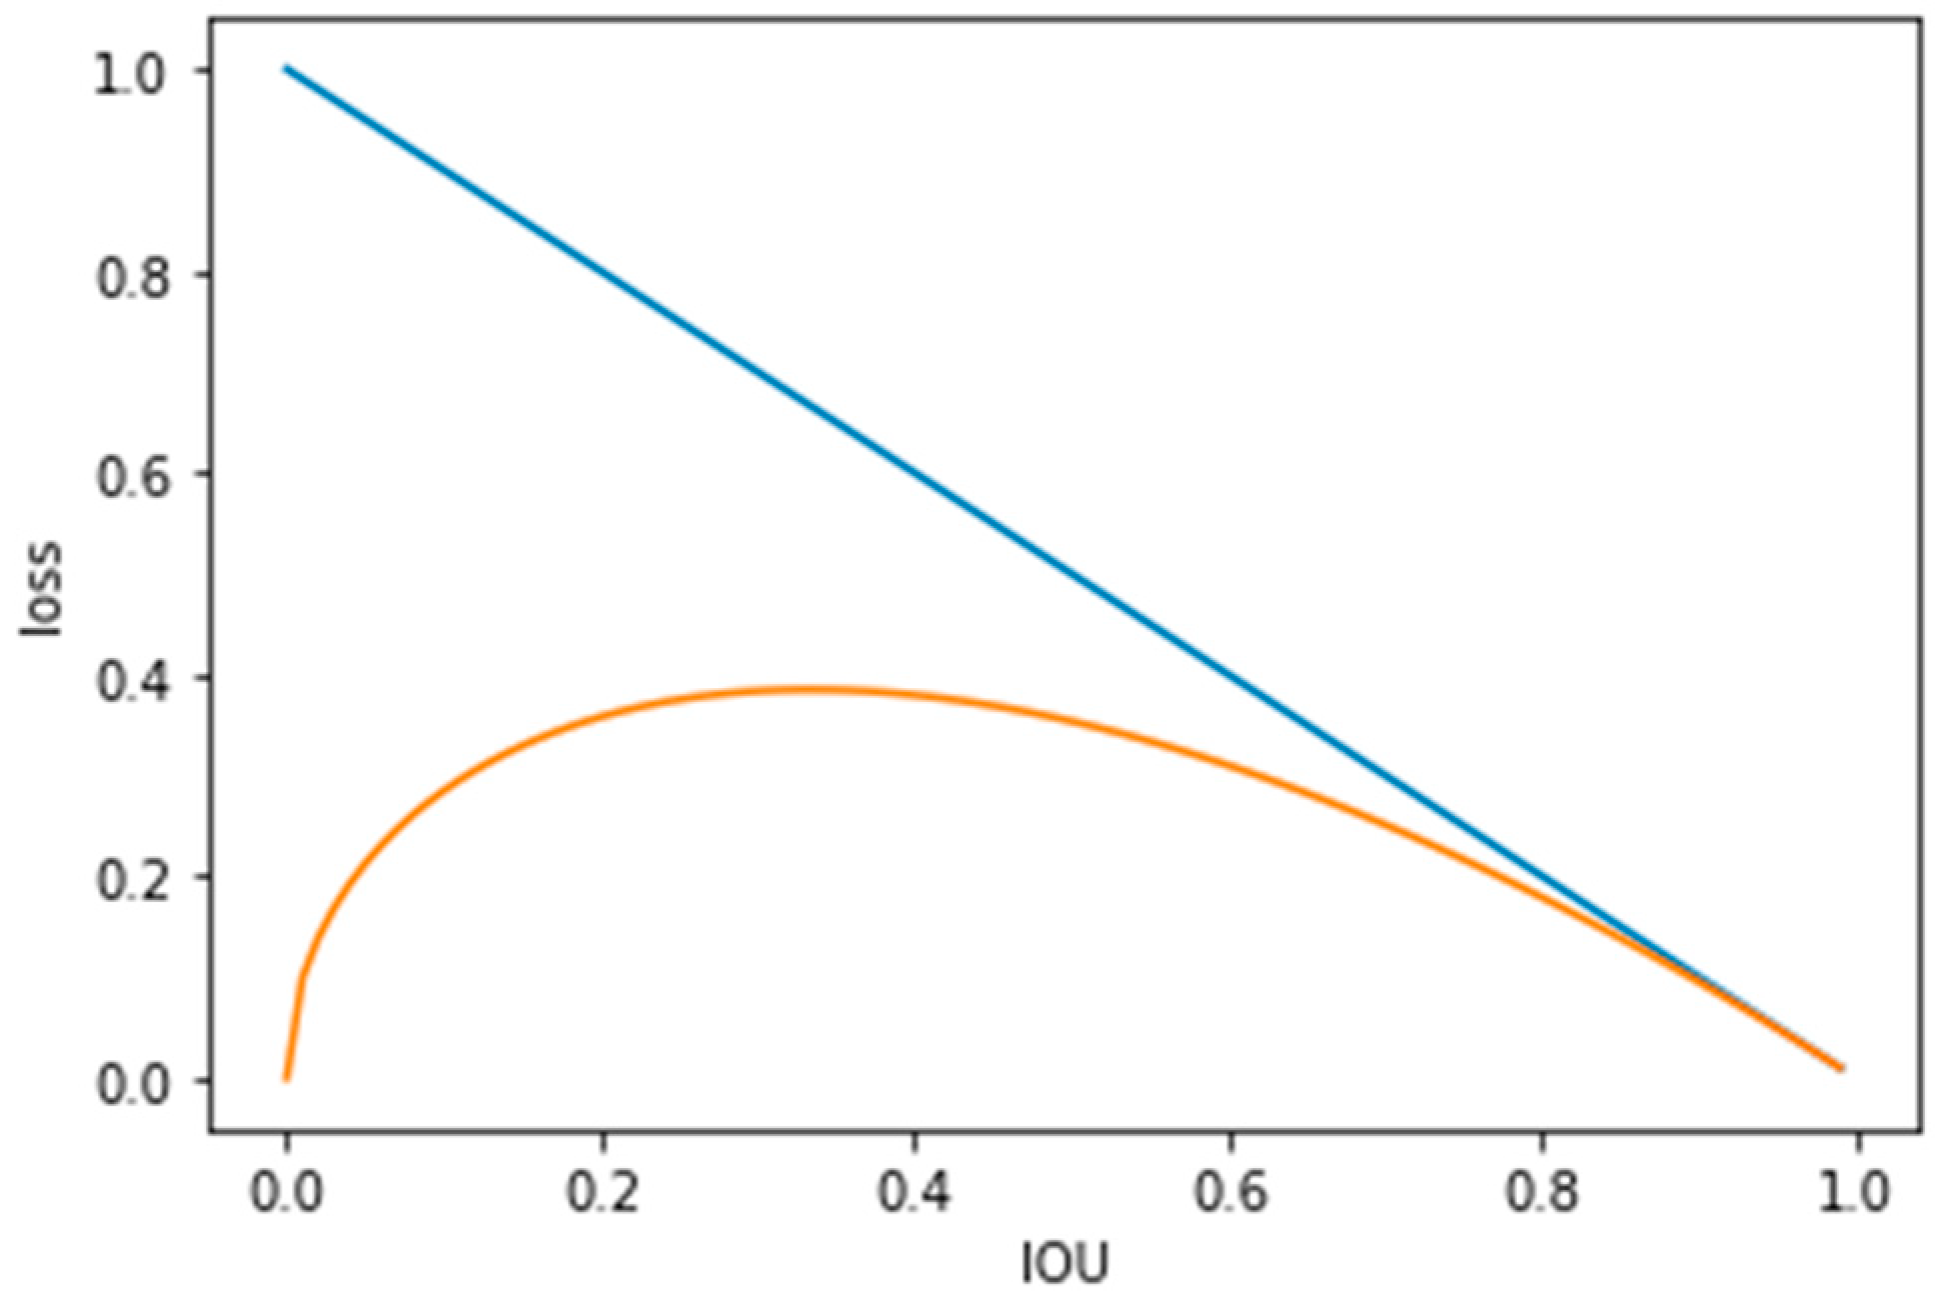
2.2.3. Improve the Position Loss Indicator-IOU (Intersection over Union)
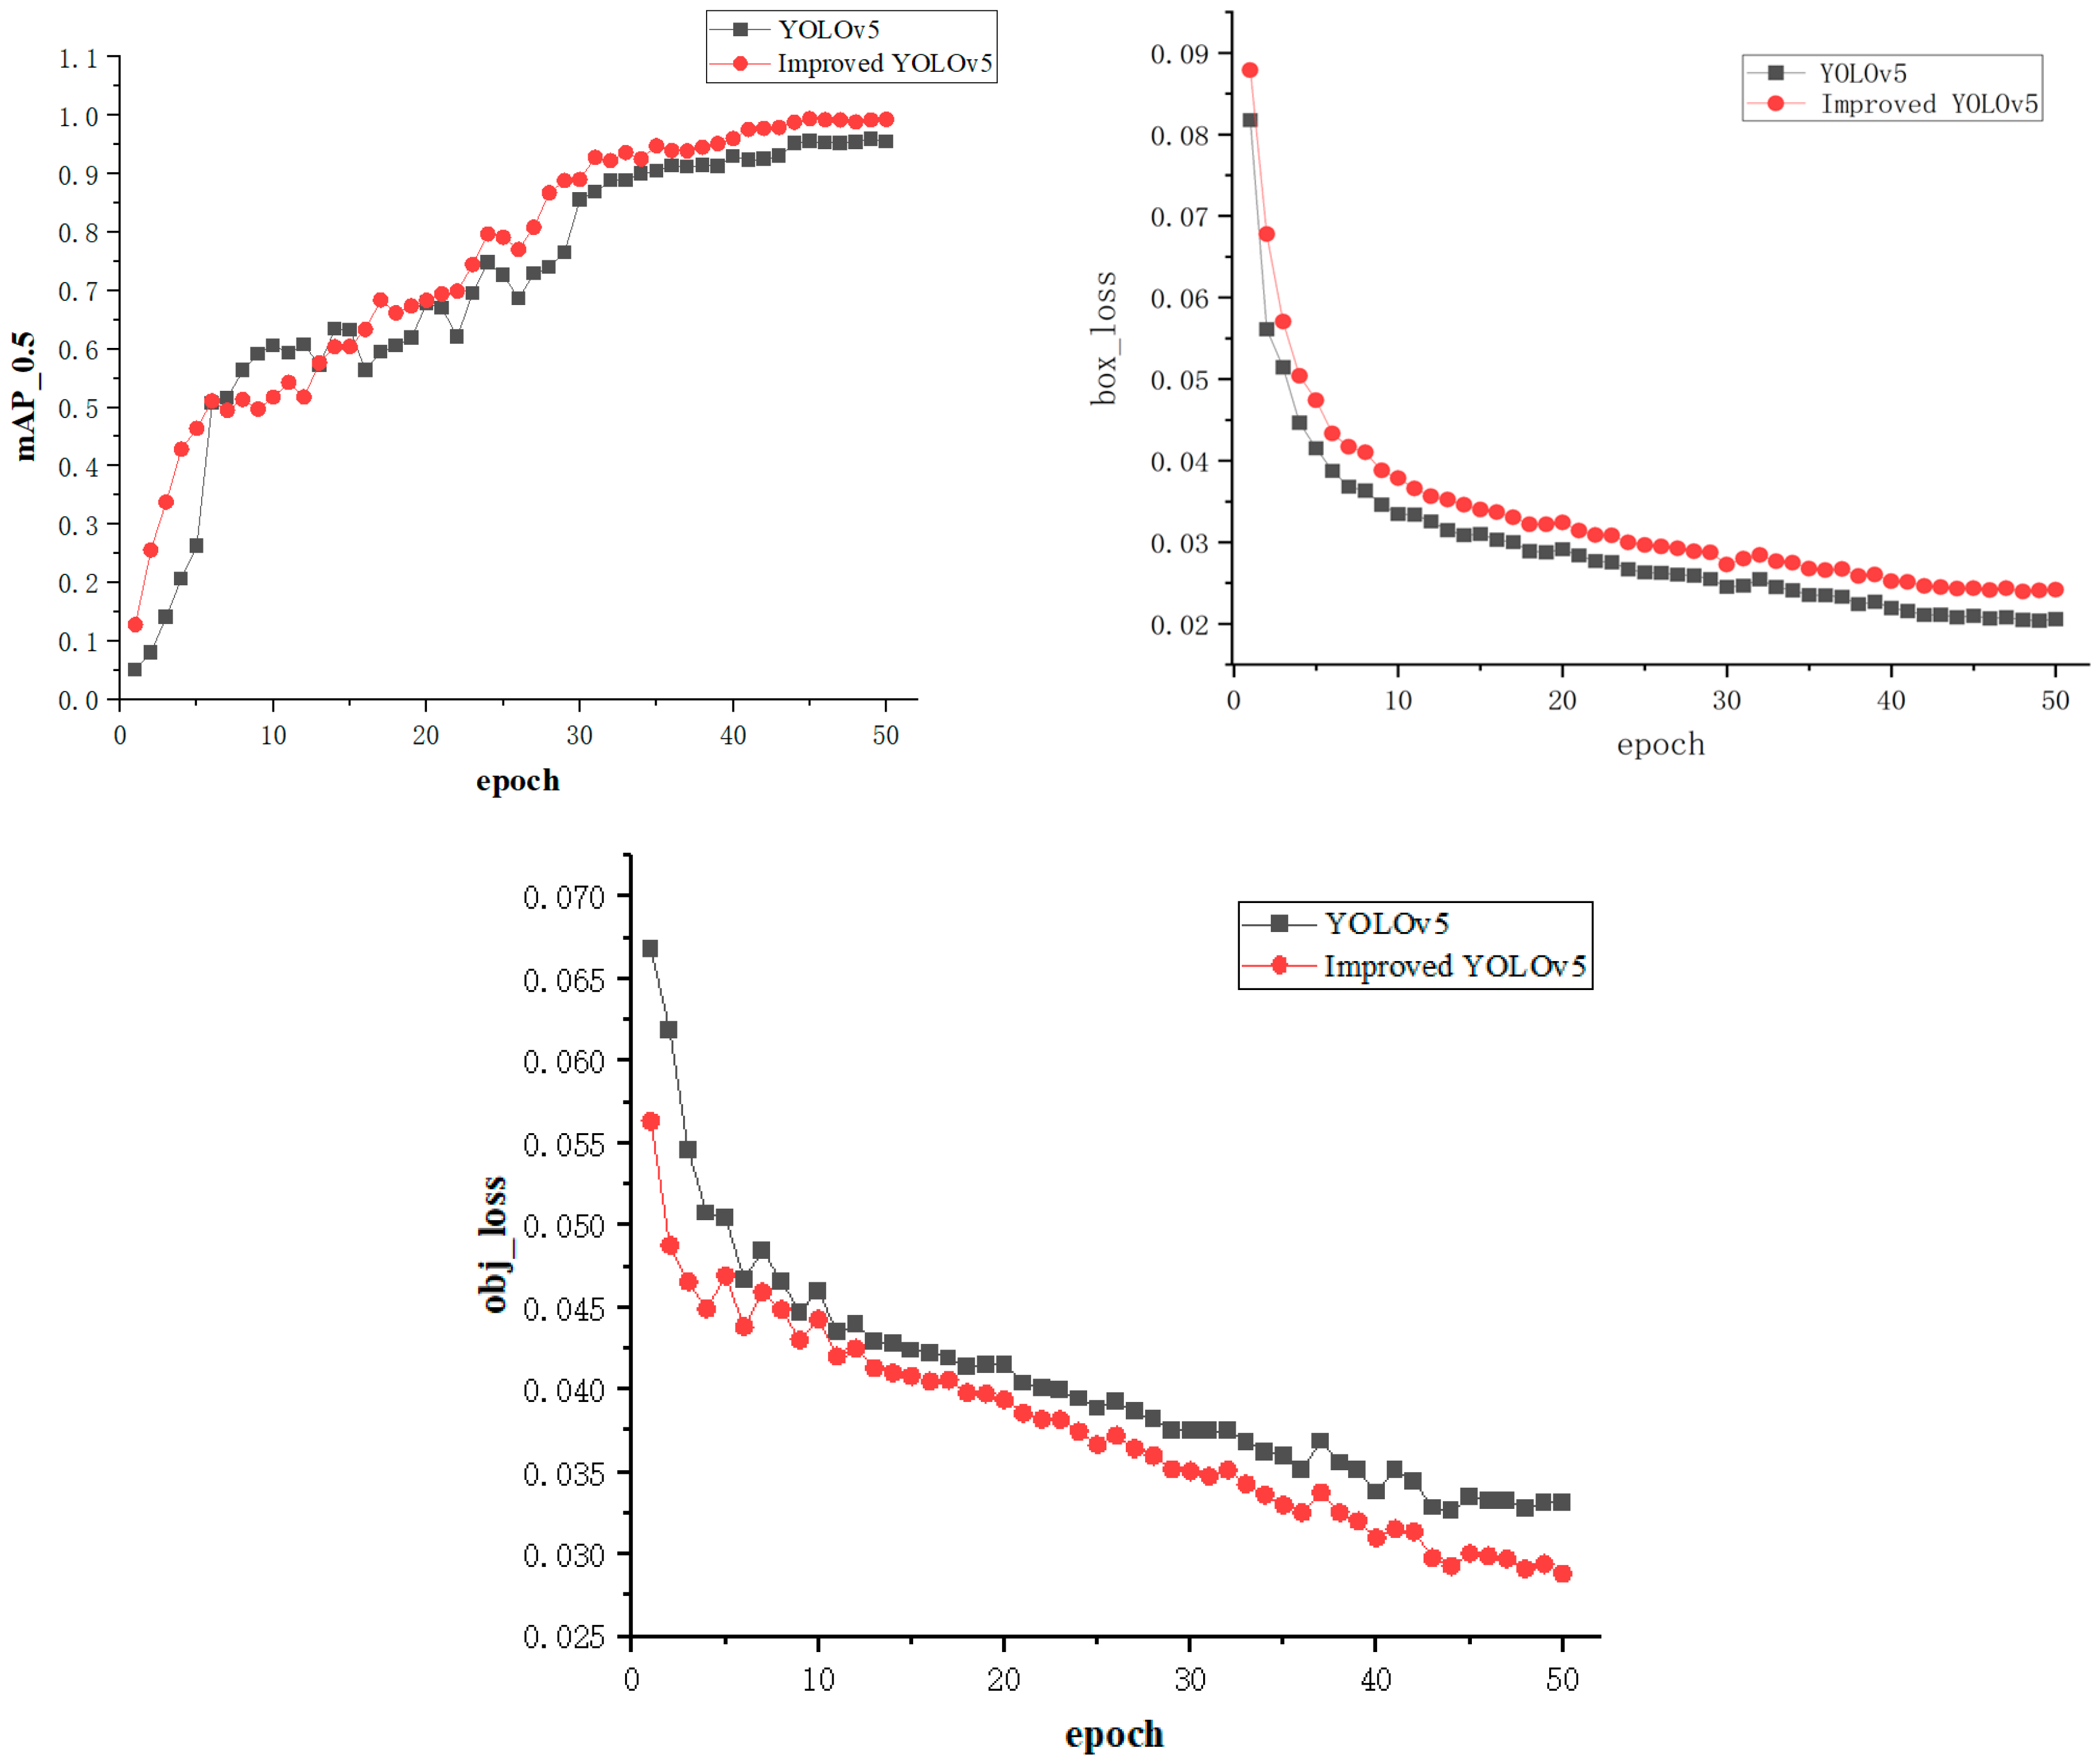
2.2.4. Model Improvement Summary and Verification of Improvement Effects
- (1)
- Shuffle Attention
- (2)
- CoordConv
- (3)
- Focal-EIoU
2.3. The Object Tracking Method—DeepSORT Algorithm
3. Experimental Verification and Result Analysis
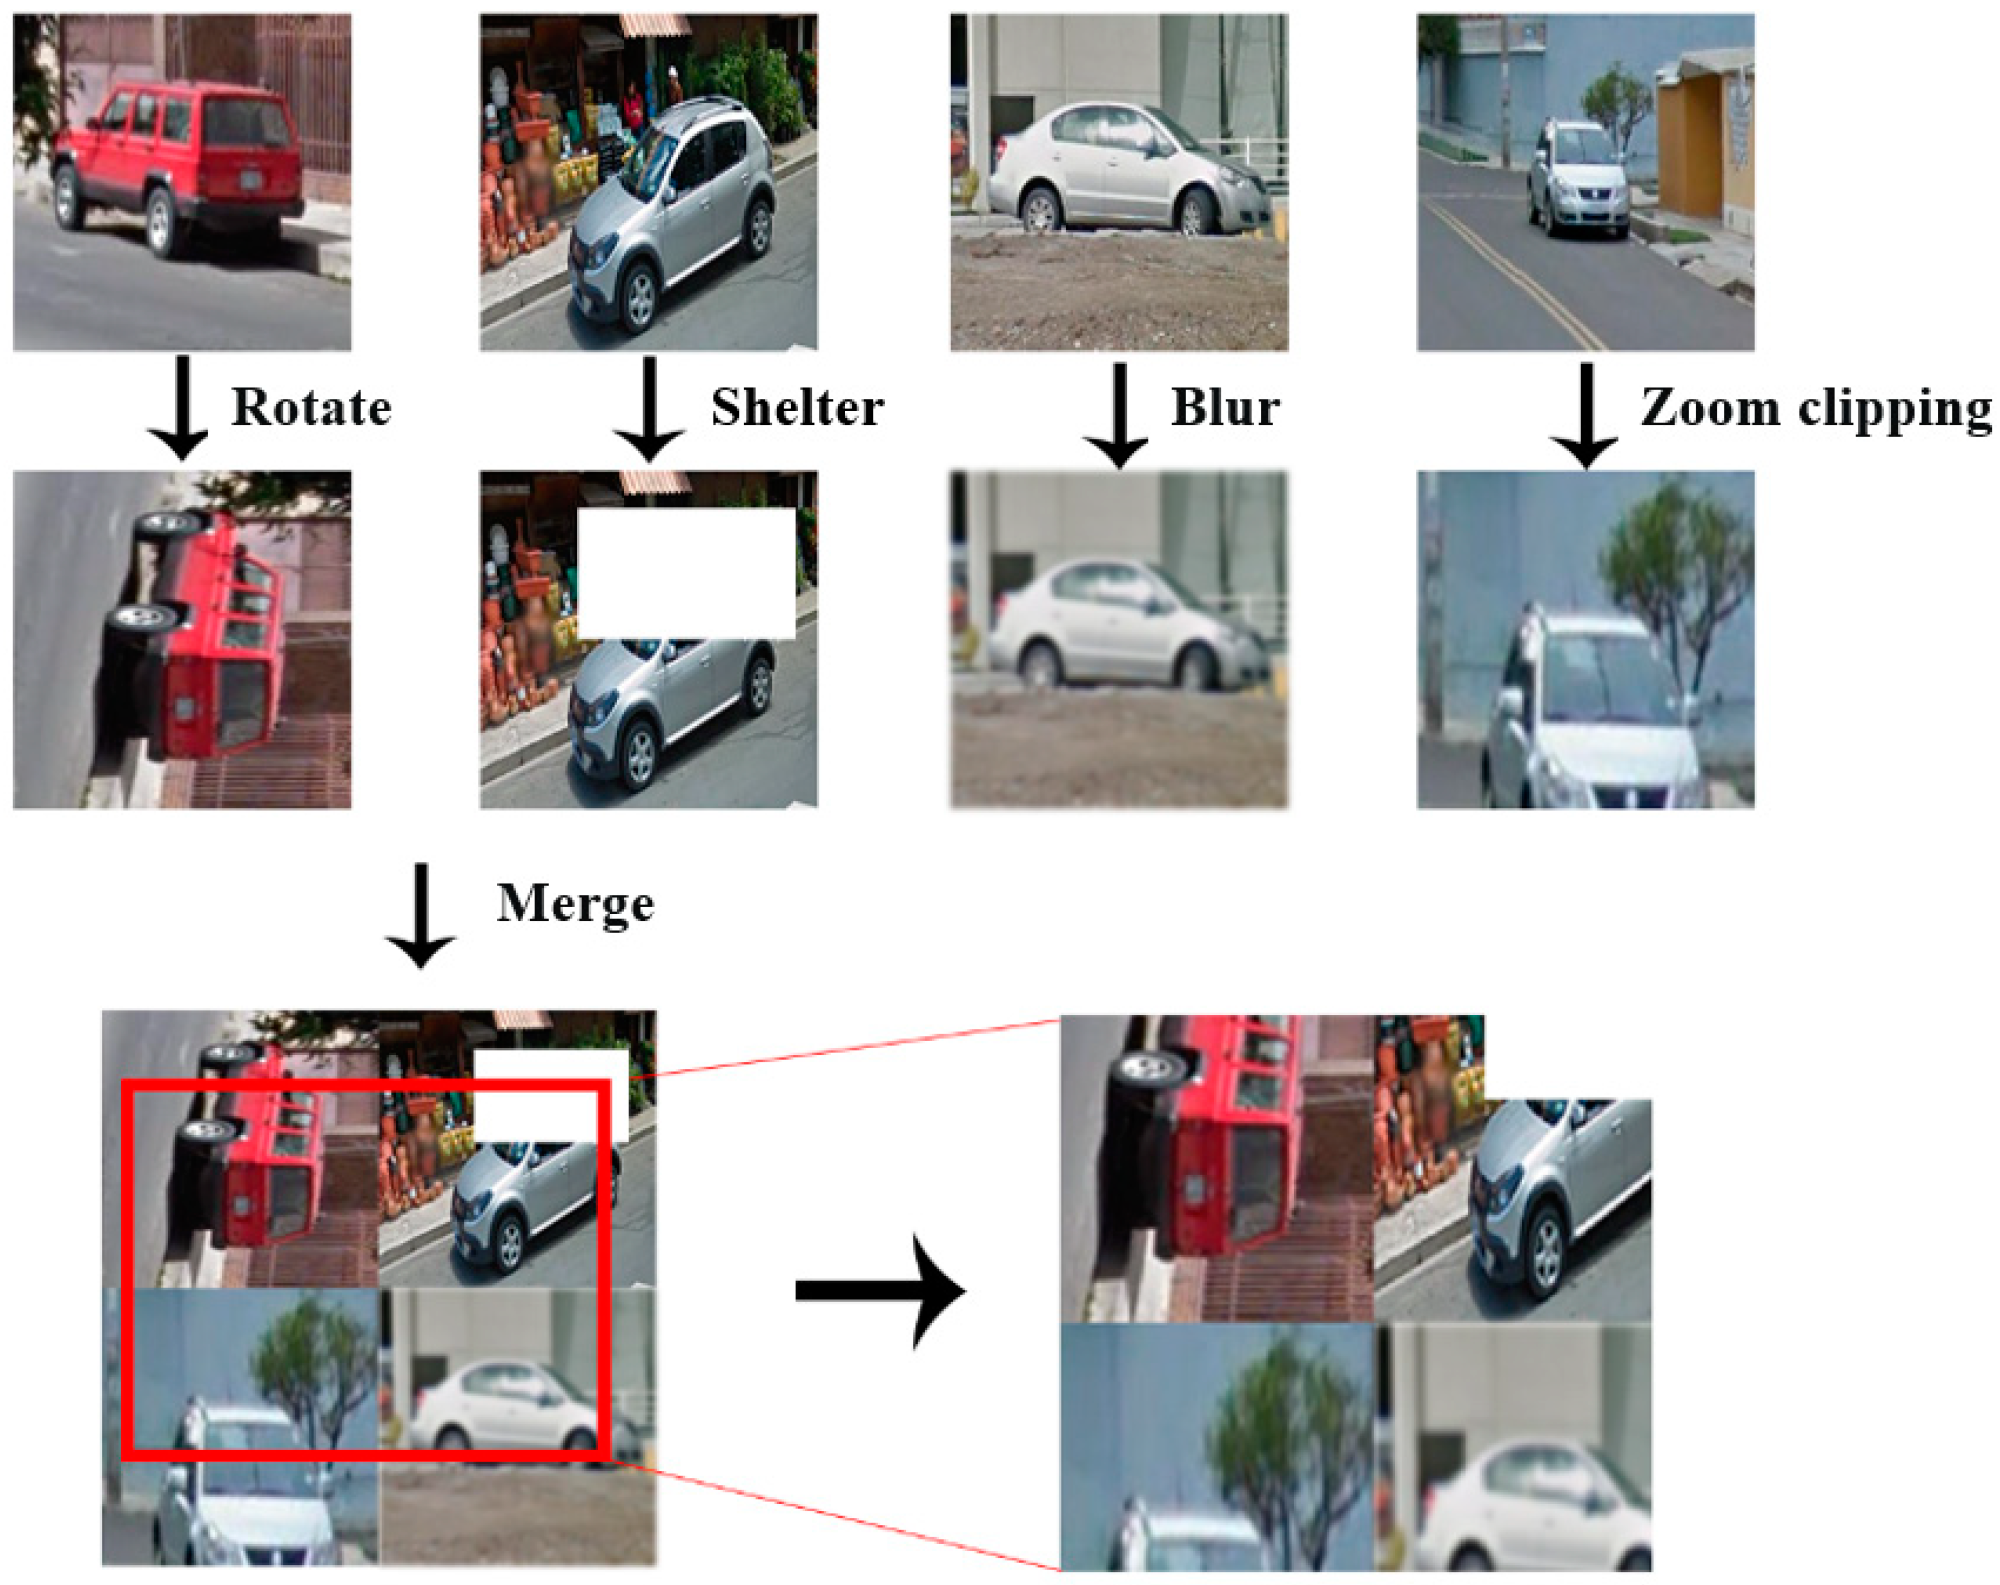
3.1. Data Pre-Processing
- (1)
- Training data acquisition
- (2)
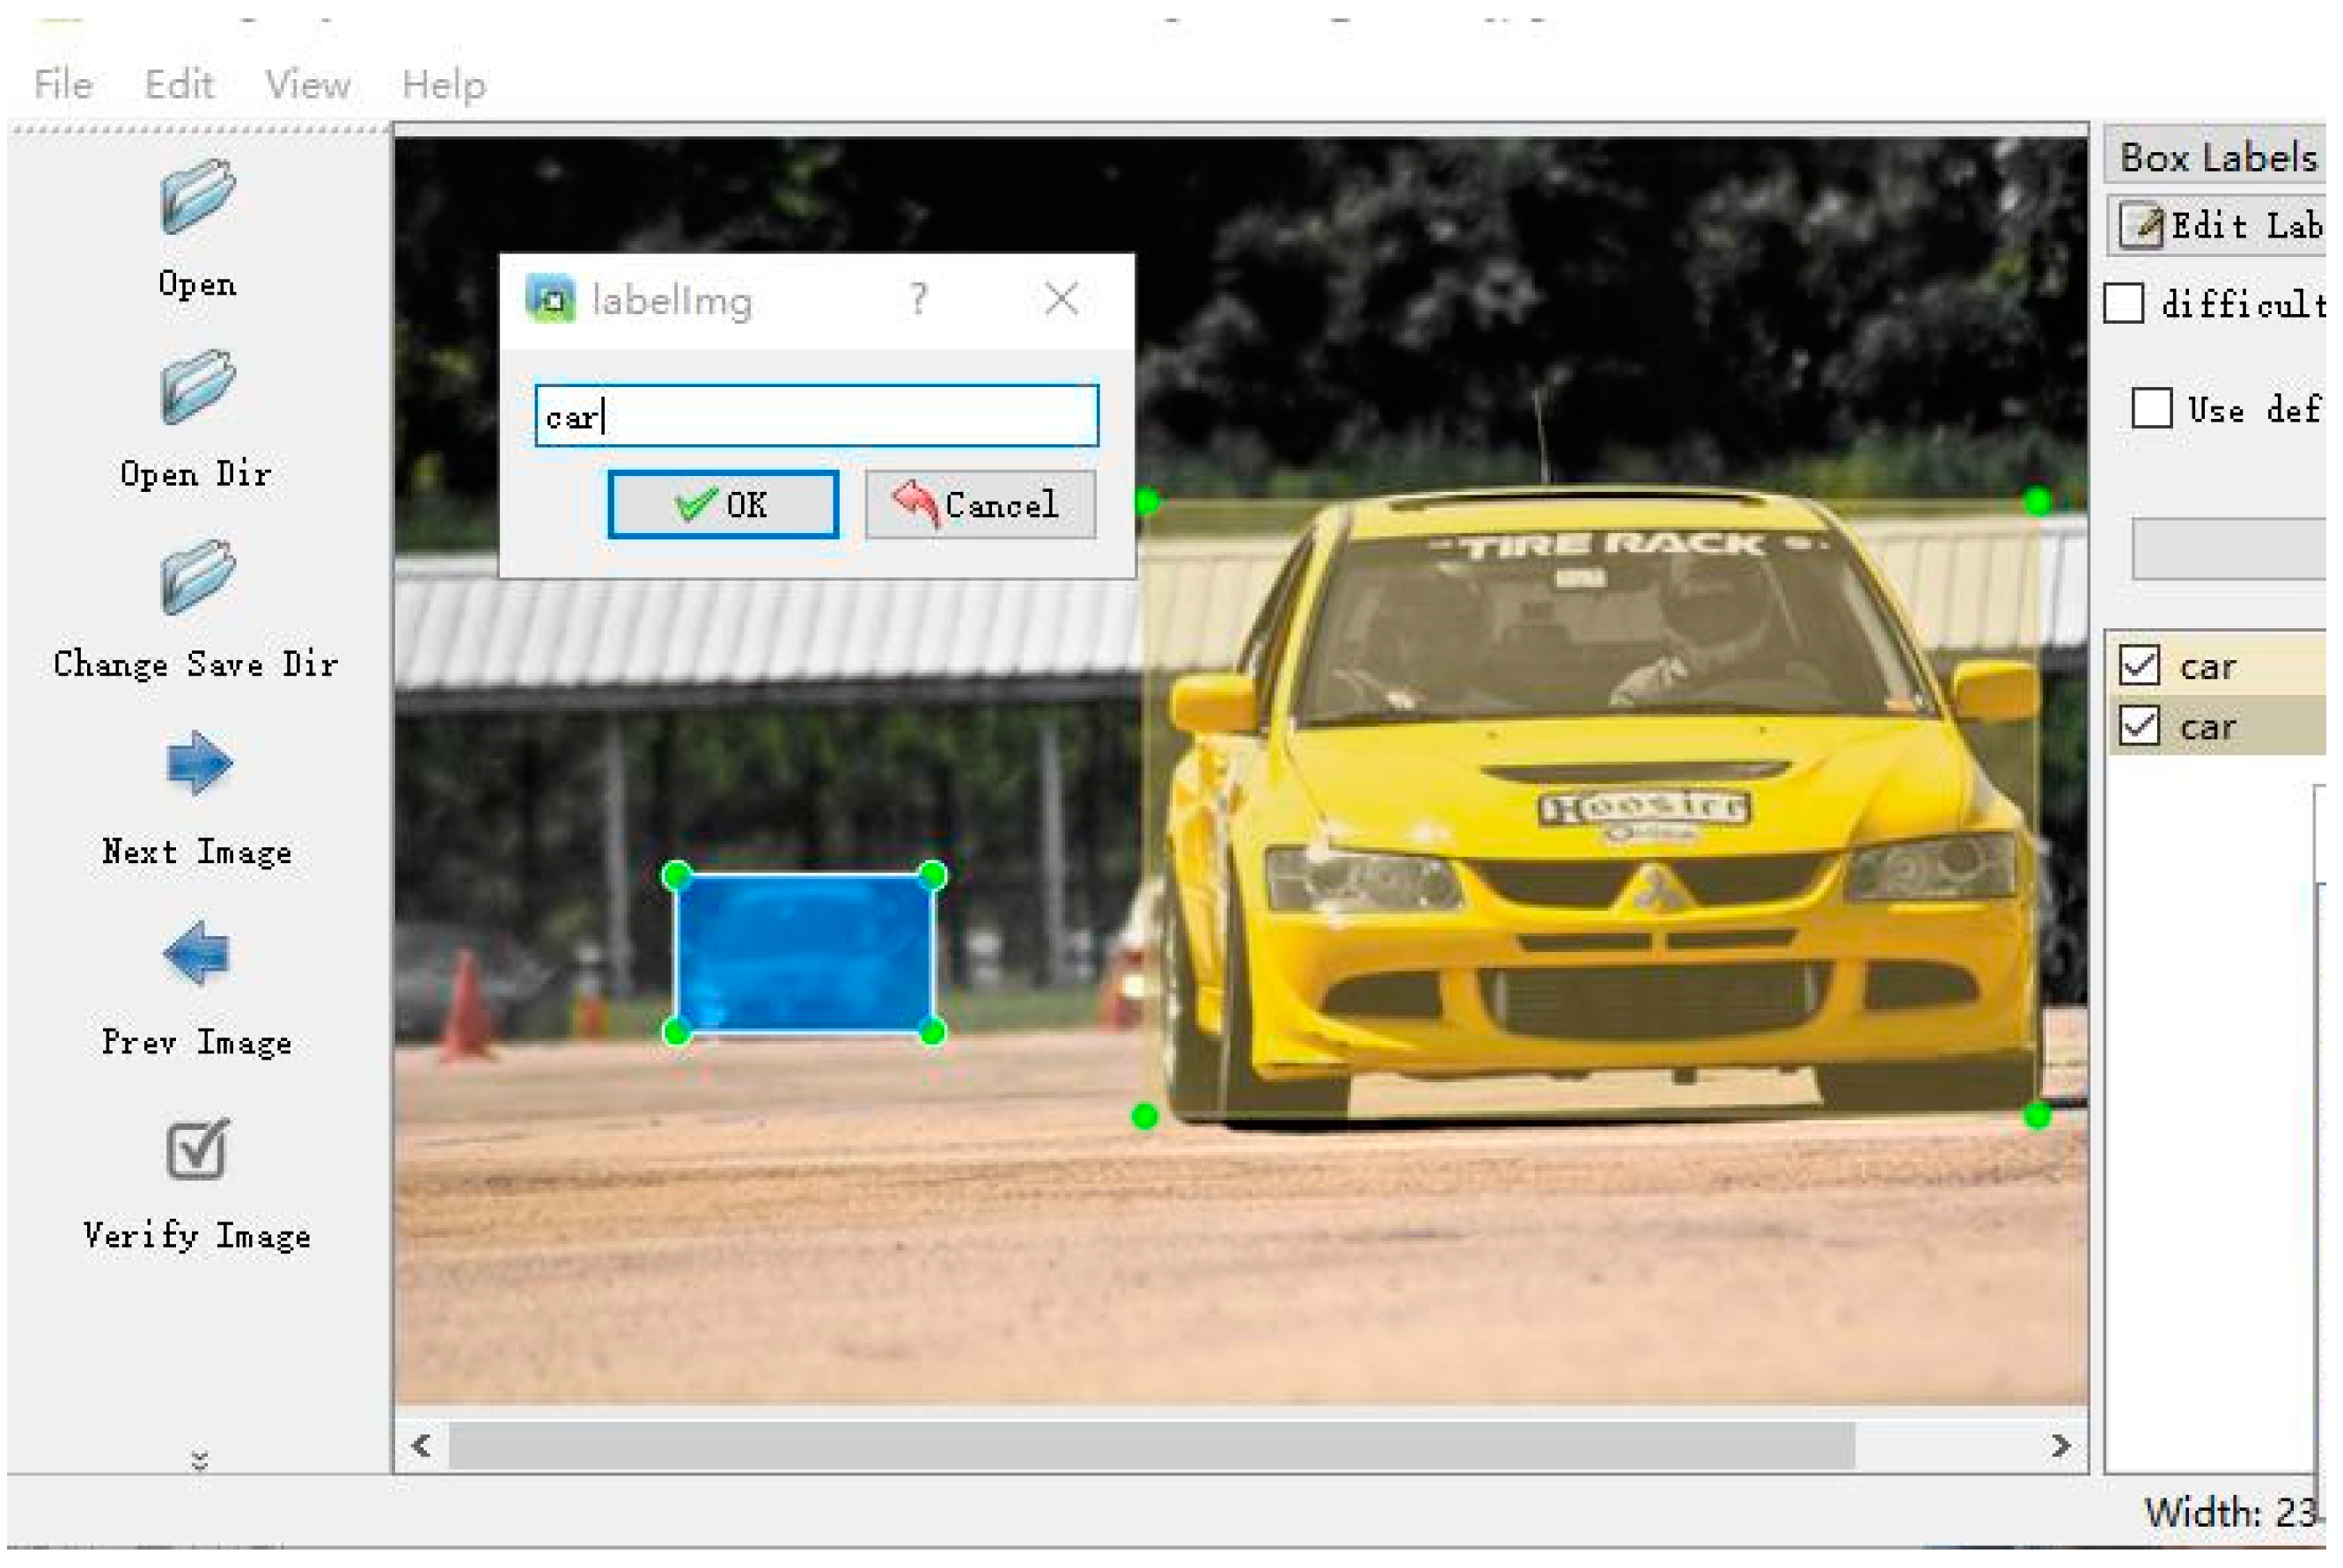
- Label processing
- (3)
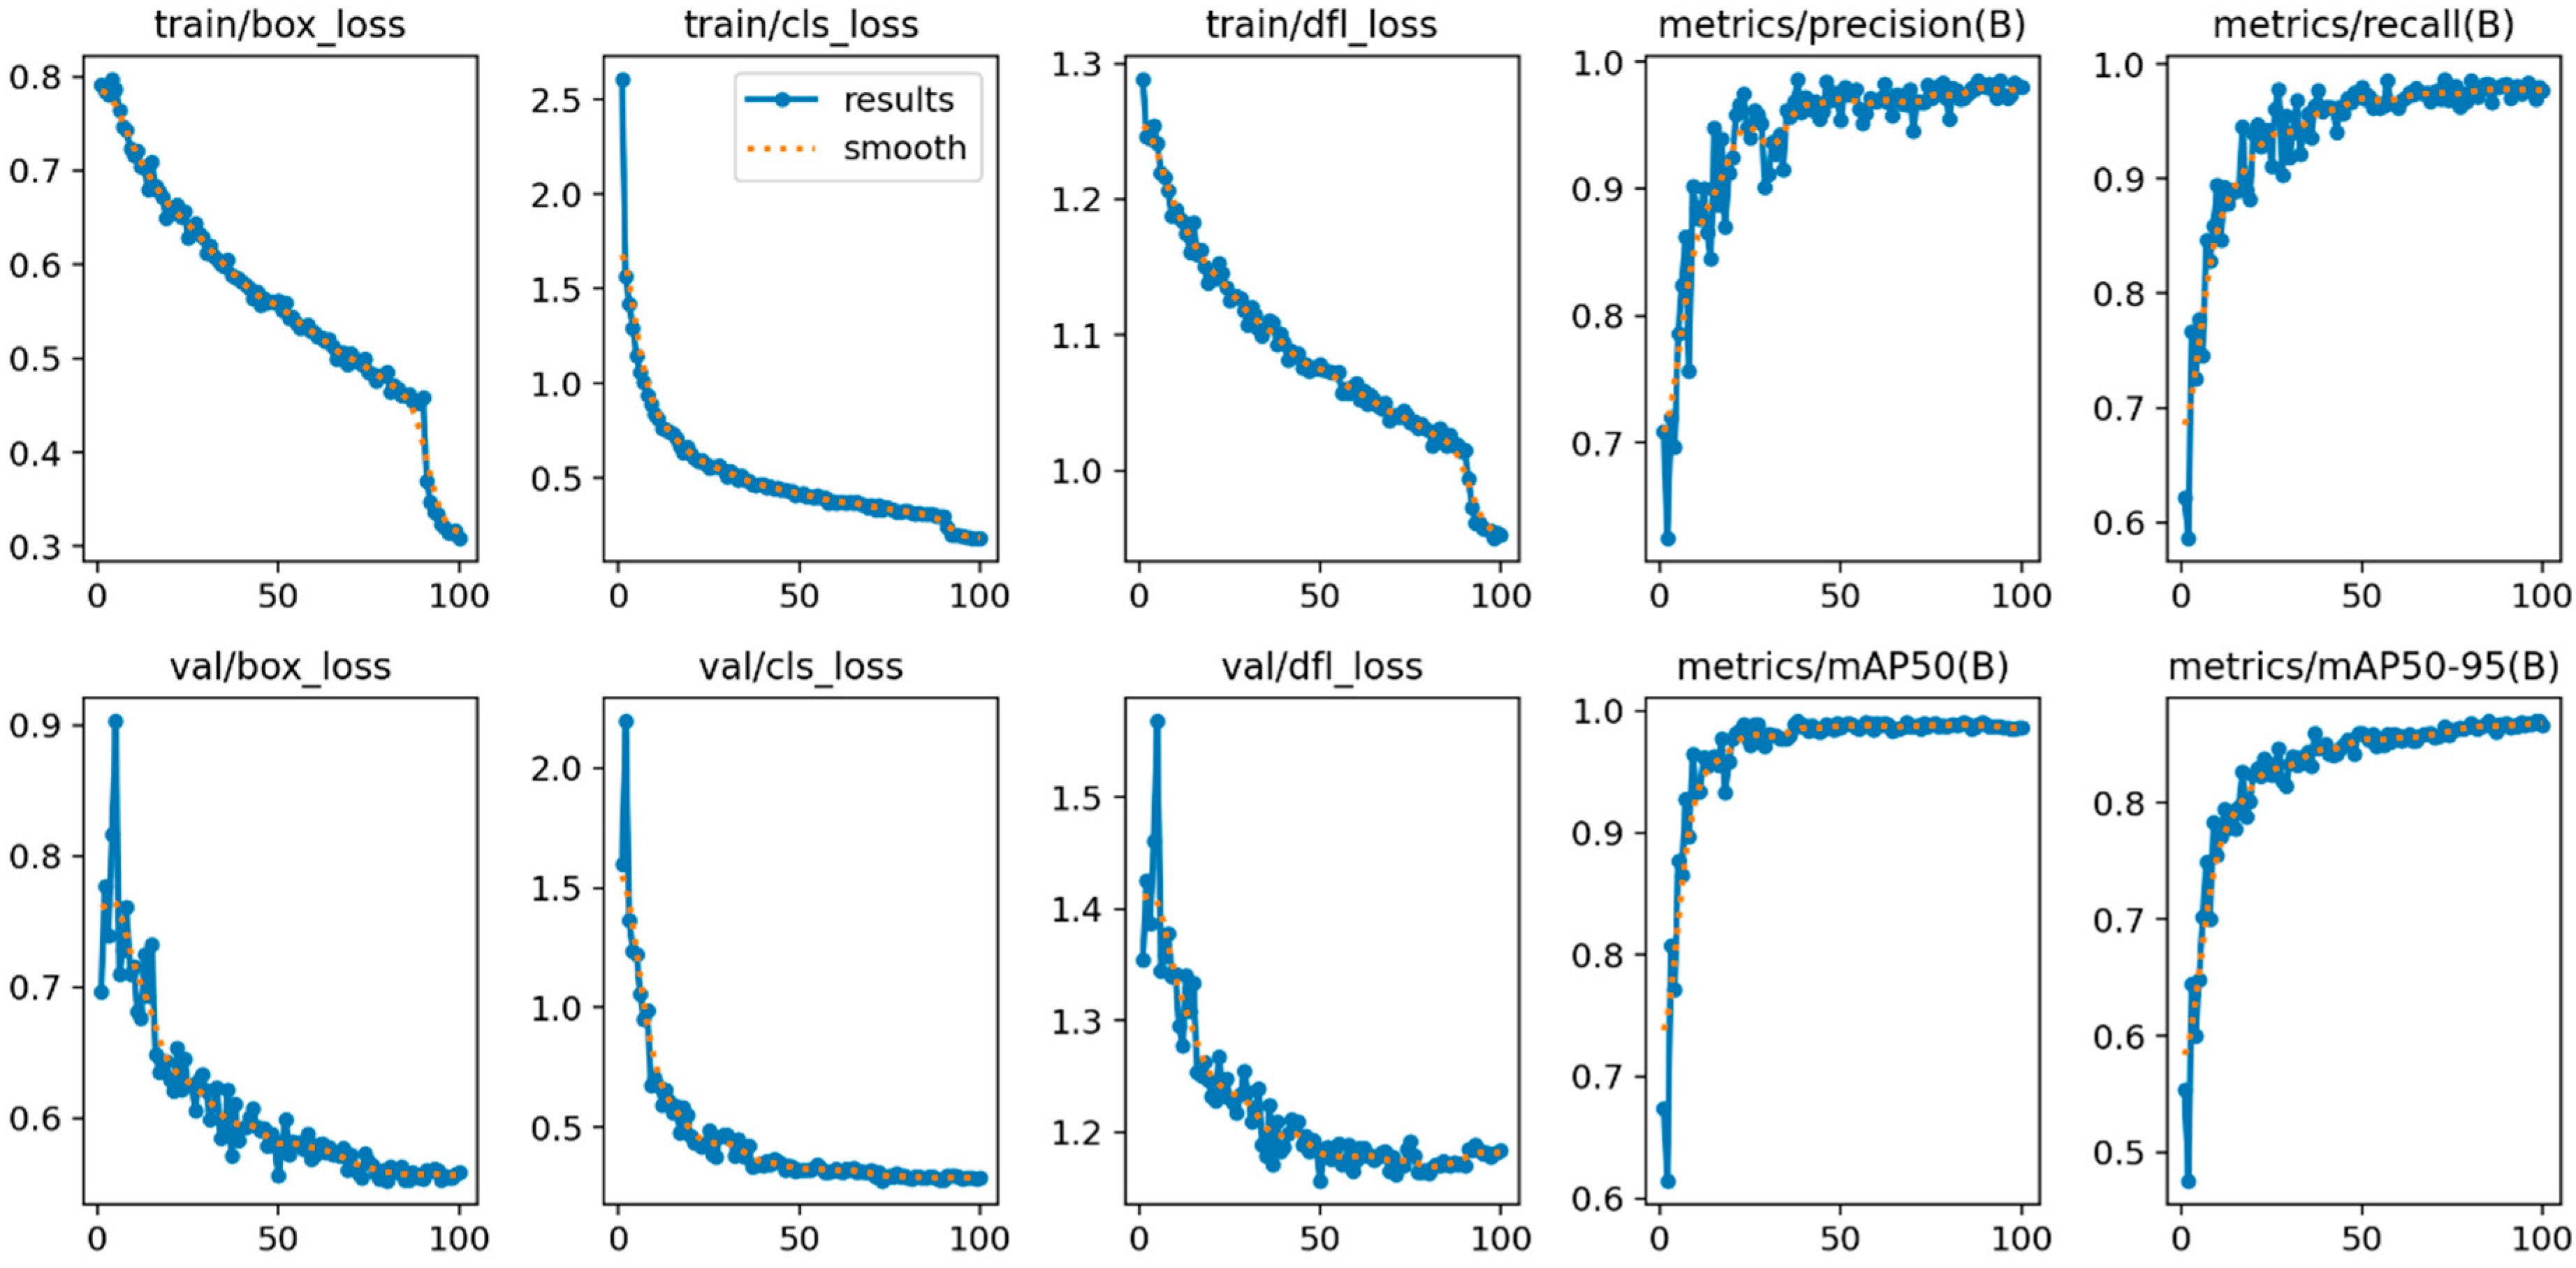
- Model training
3.2. Analysis of Target Detection Results
3.2.1. Evaluation Indicator
3.2.2. Attention Mechanism Experiment
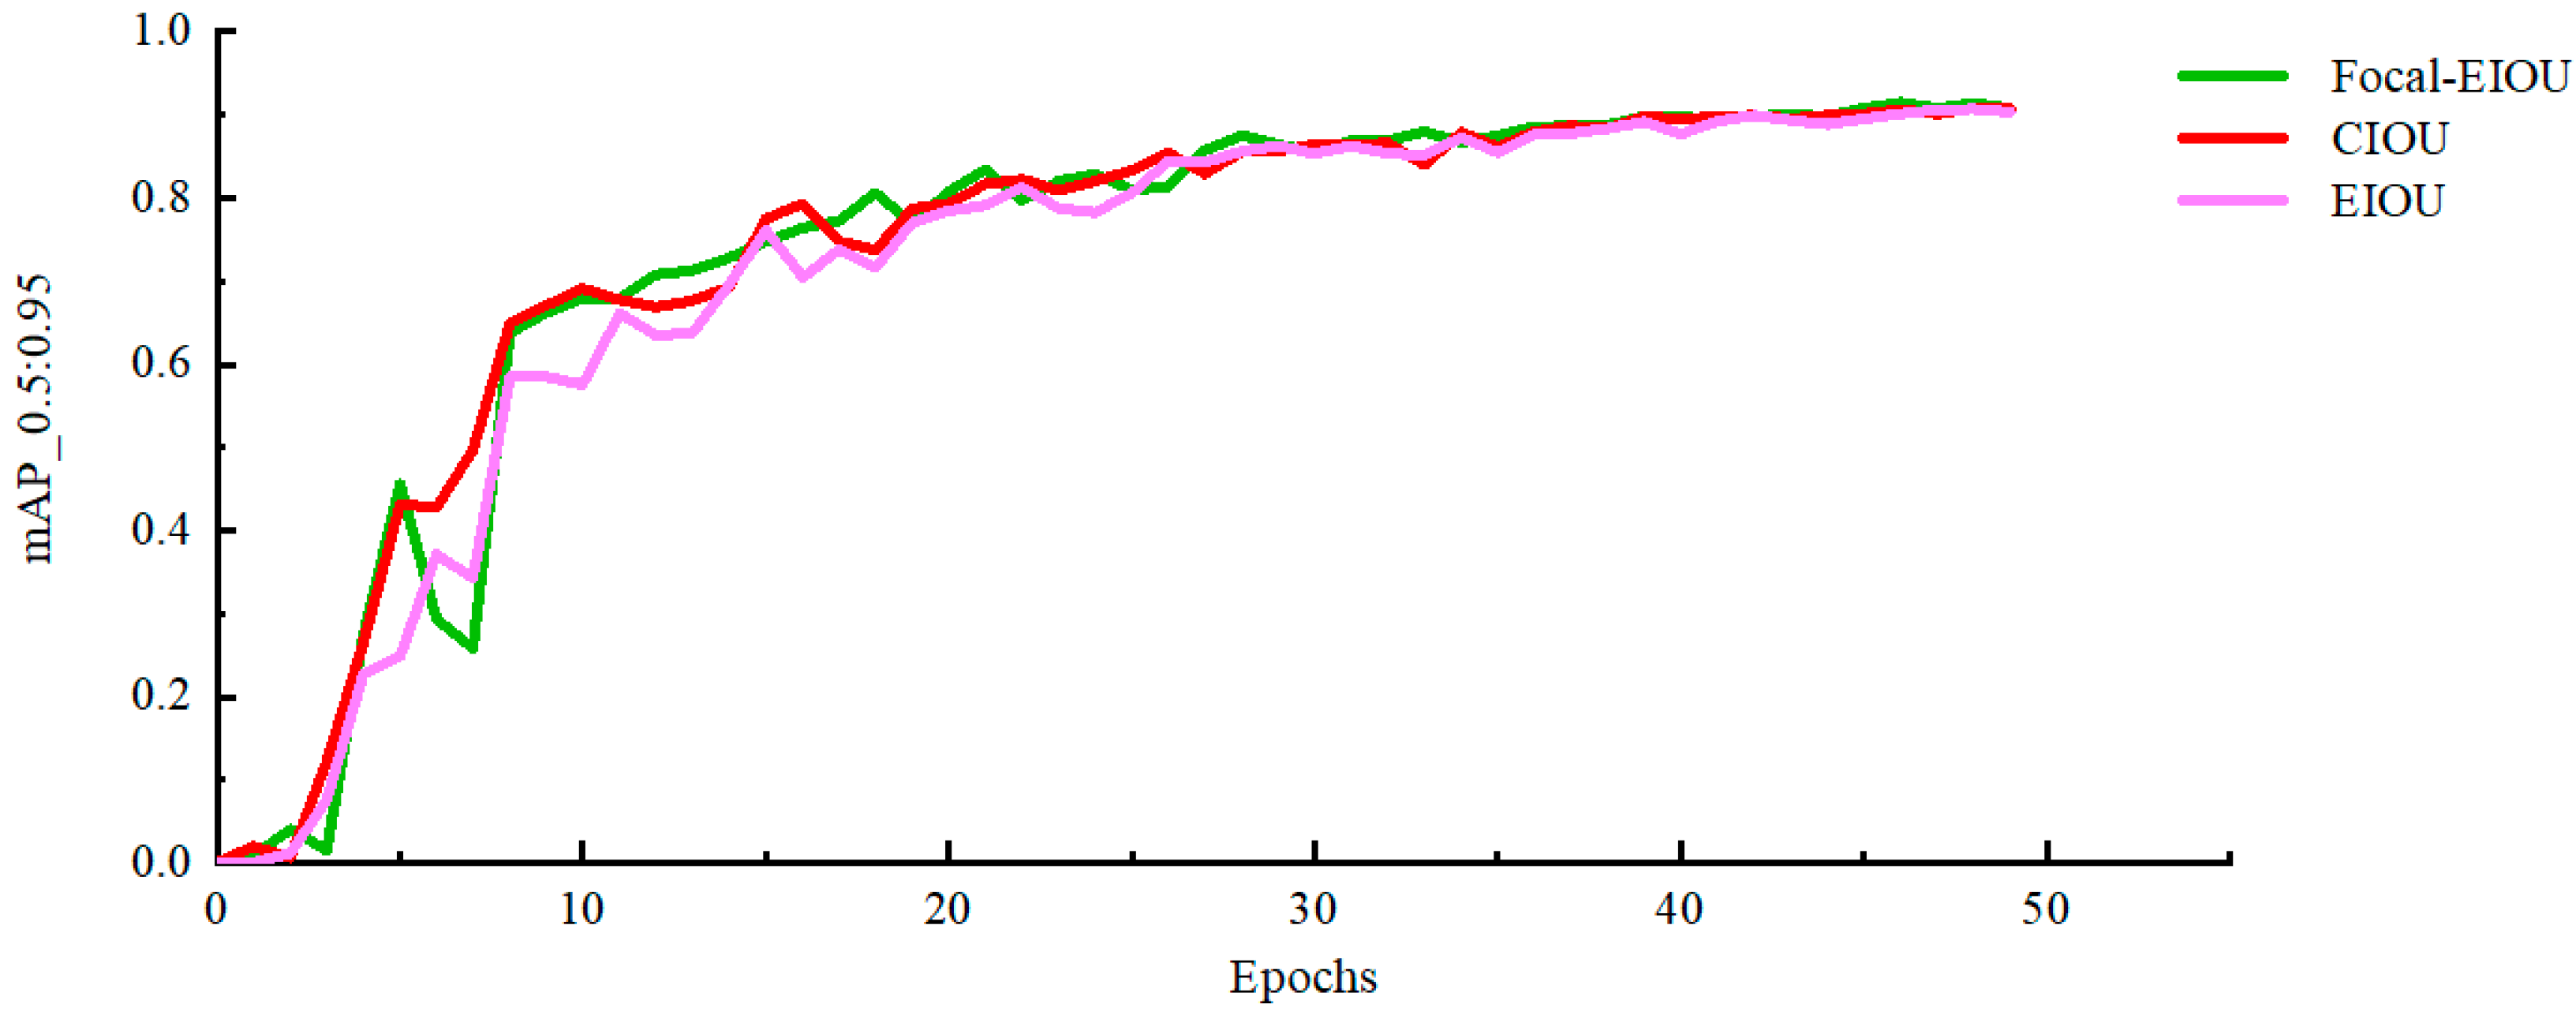
3.2.3. Loss Function Experiment
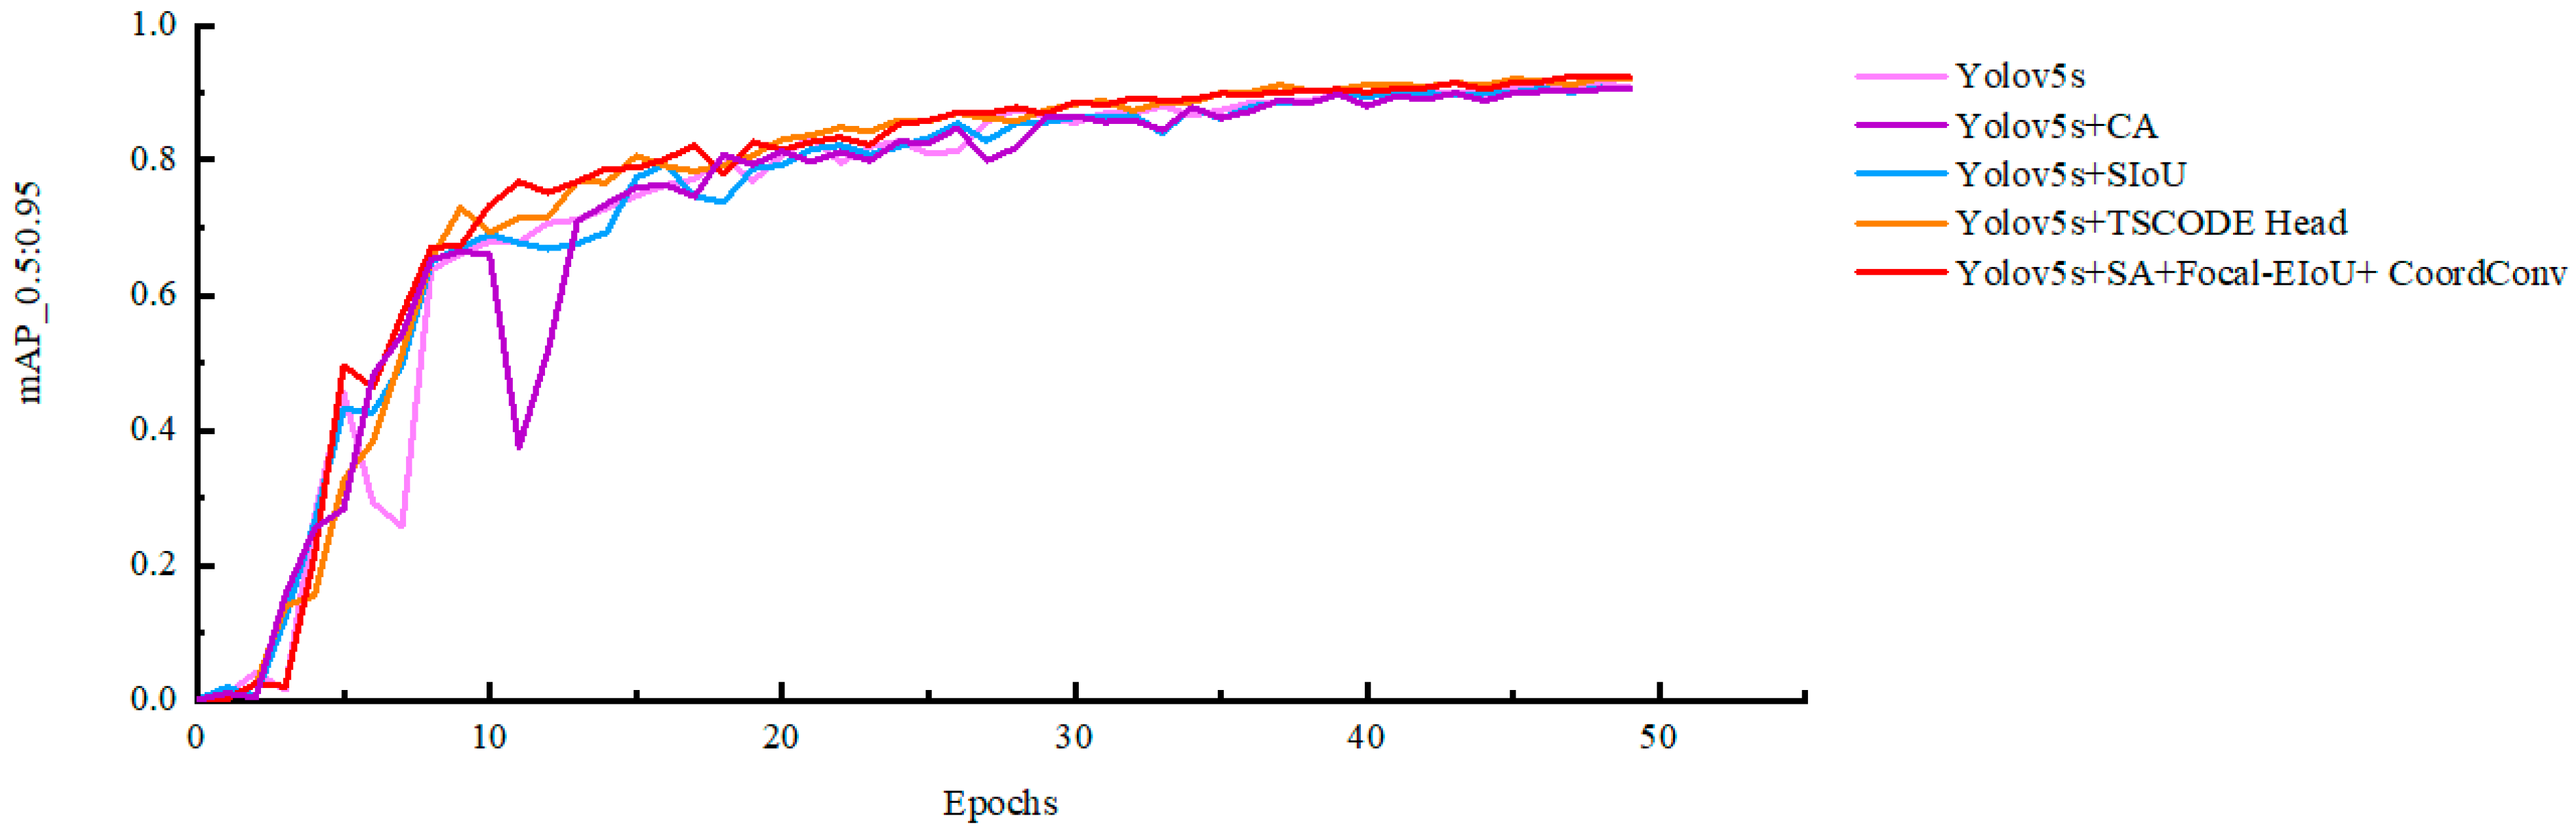
3.2.4. Ablation Experiment
3.2.5. Contrast Experiment
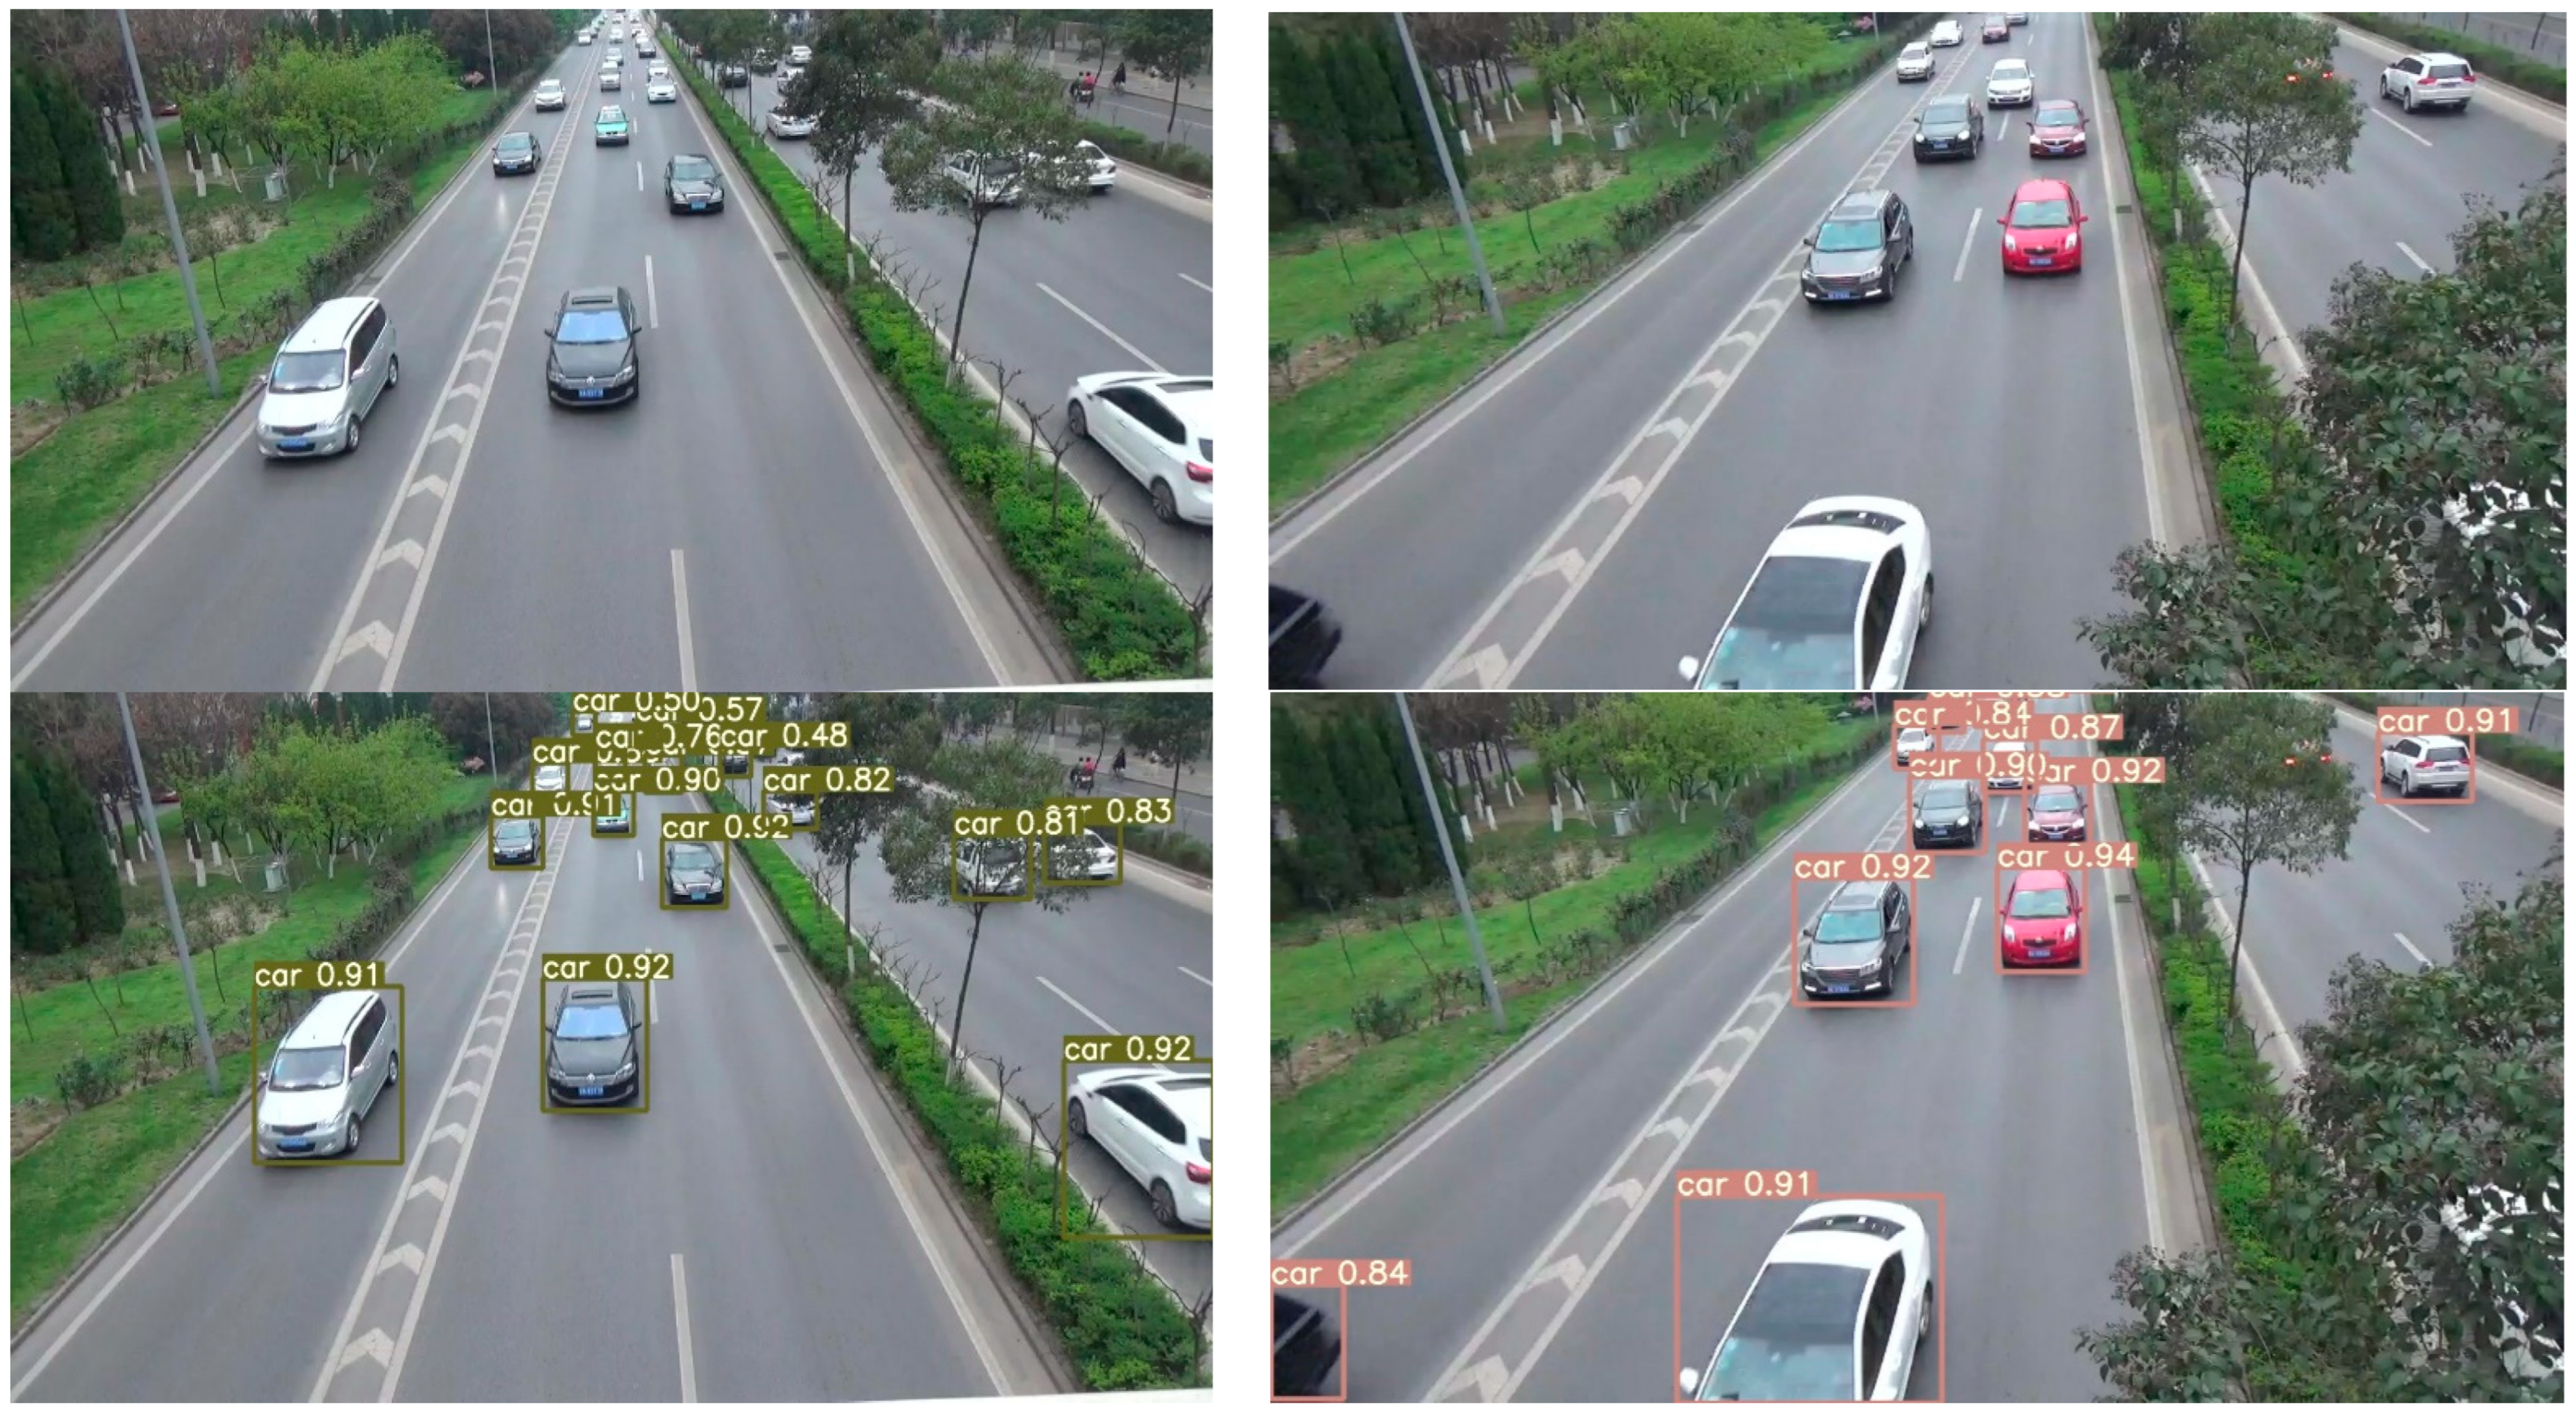
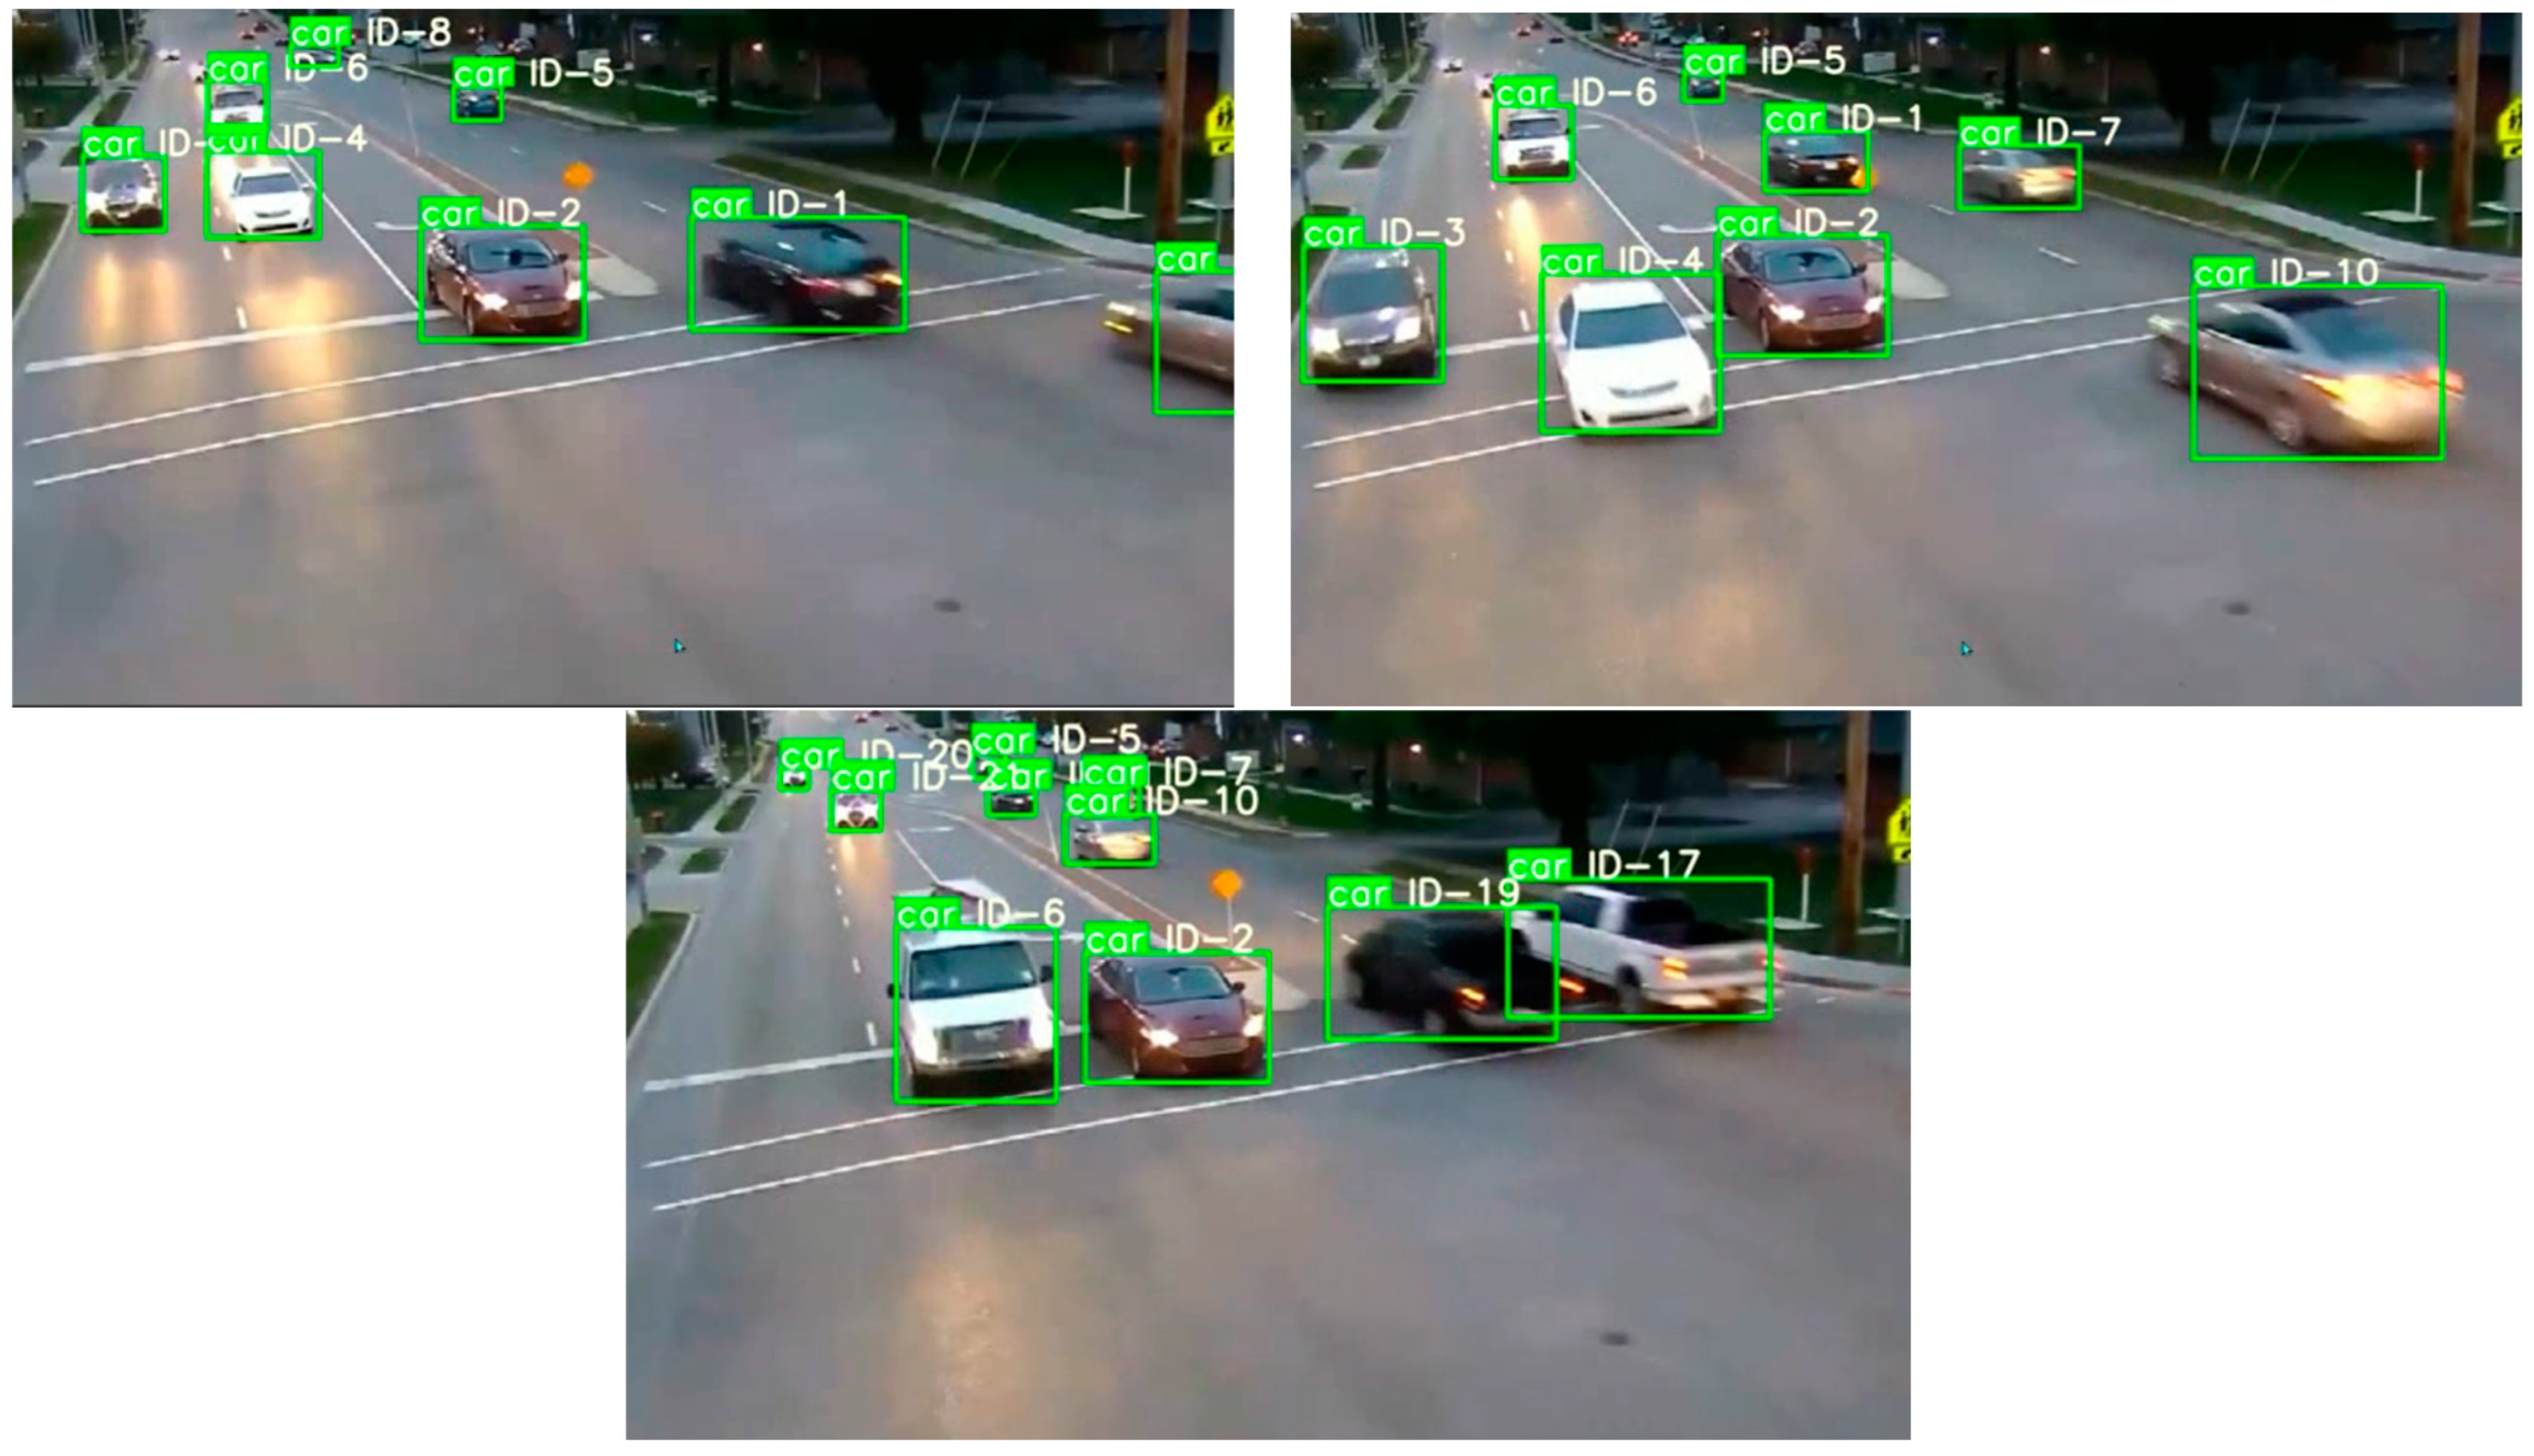
3.3. Identify Processes and Operational Results
4. Conclusions
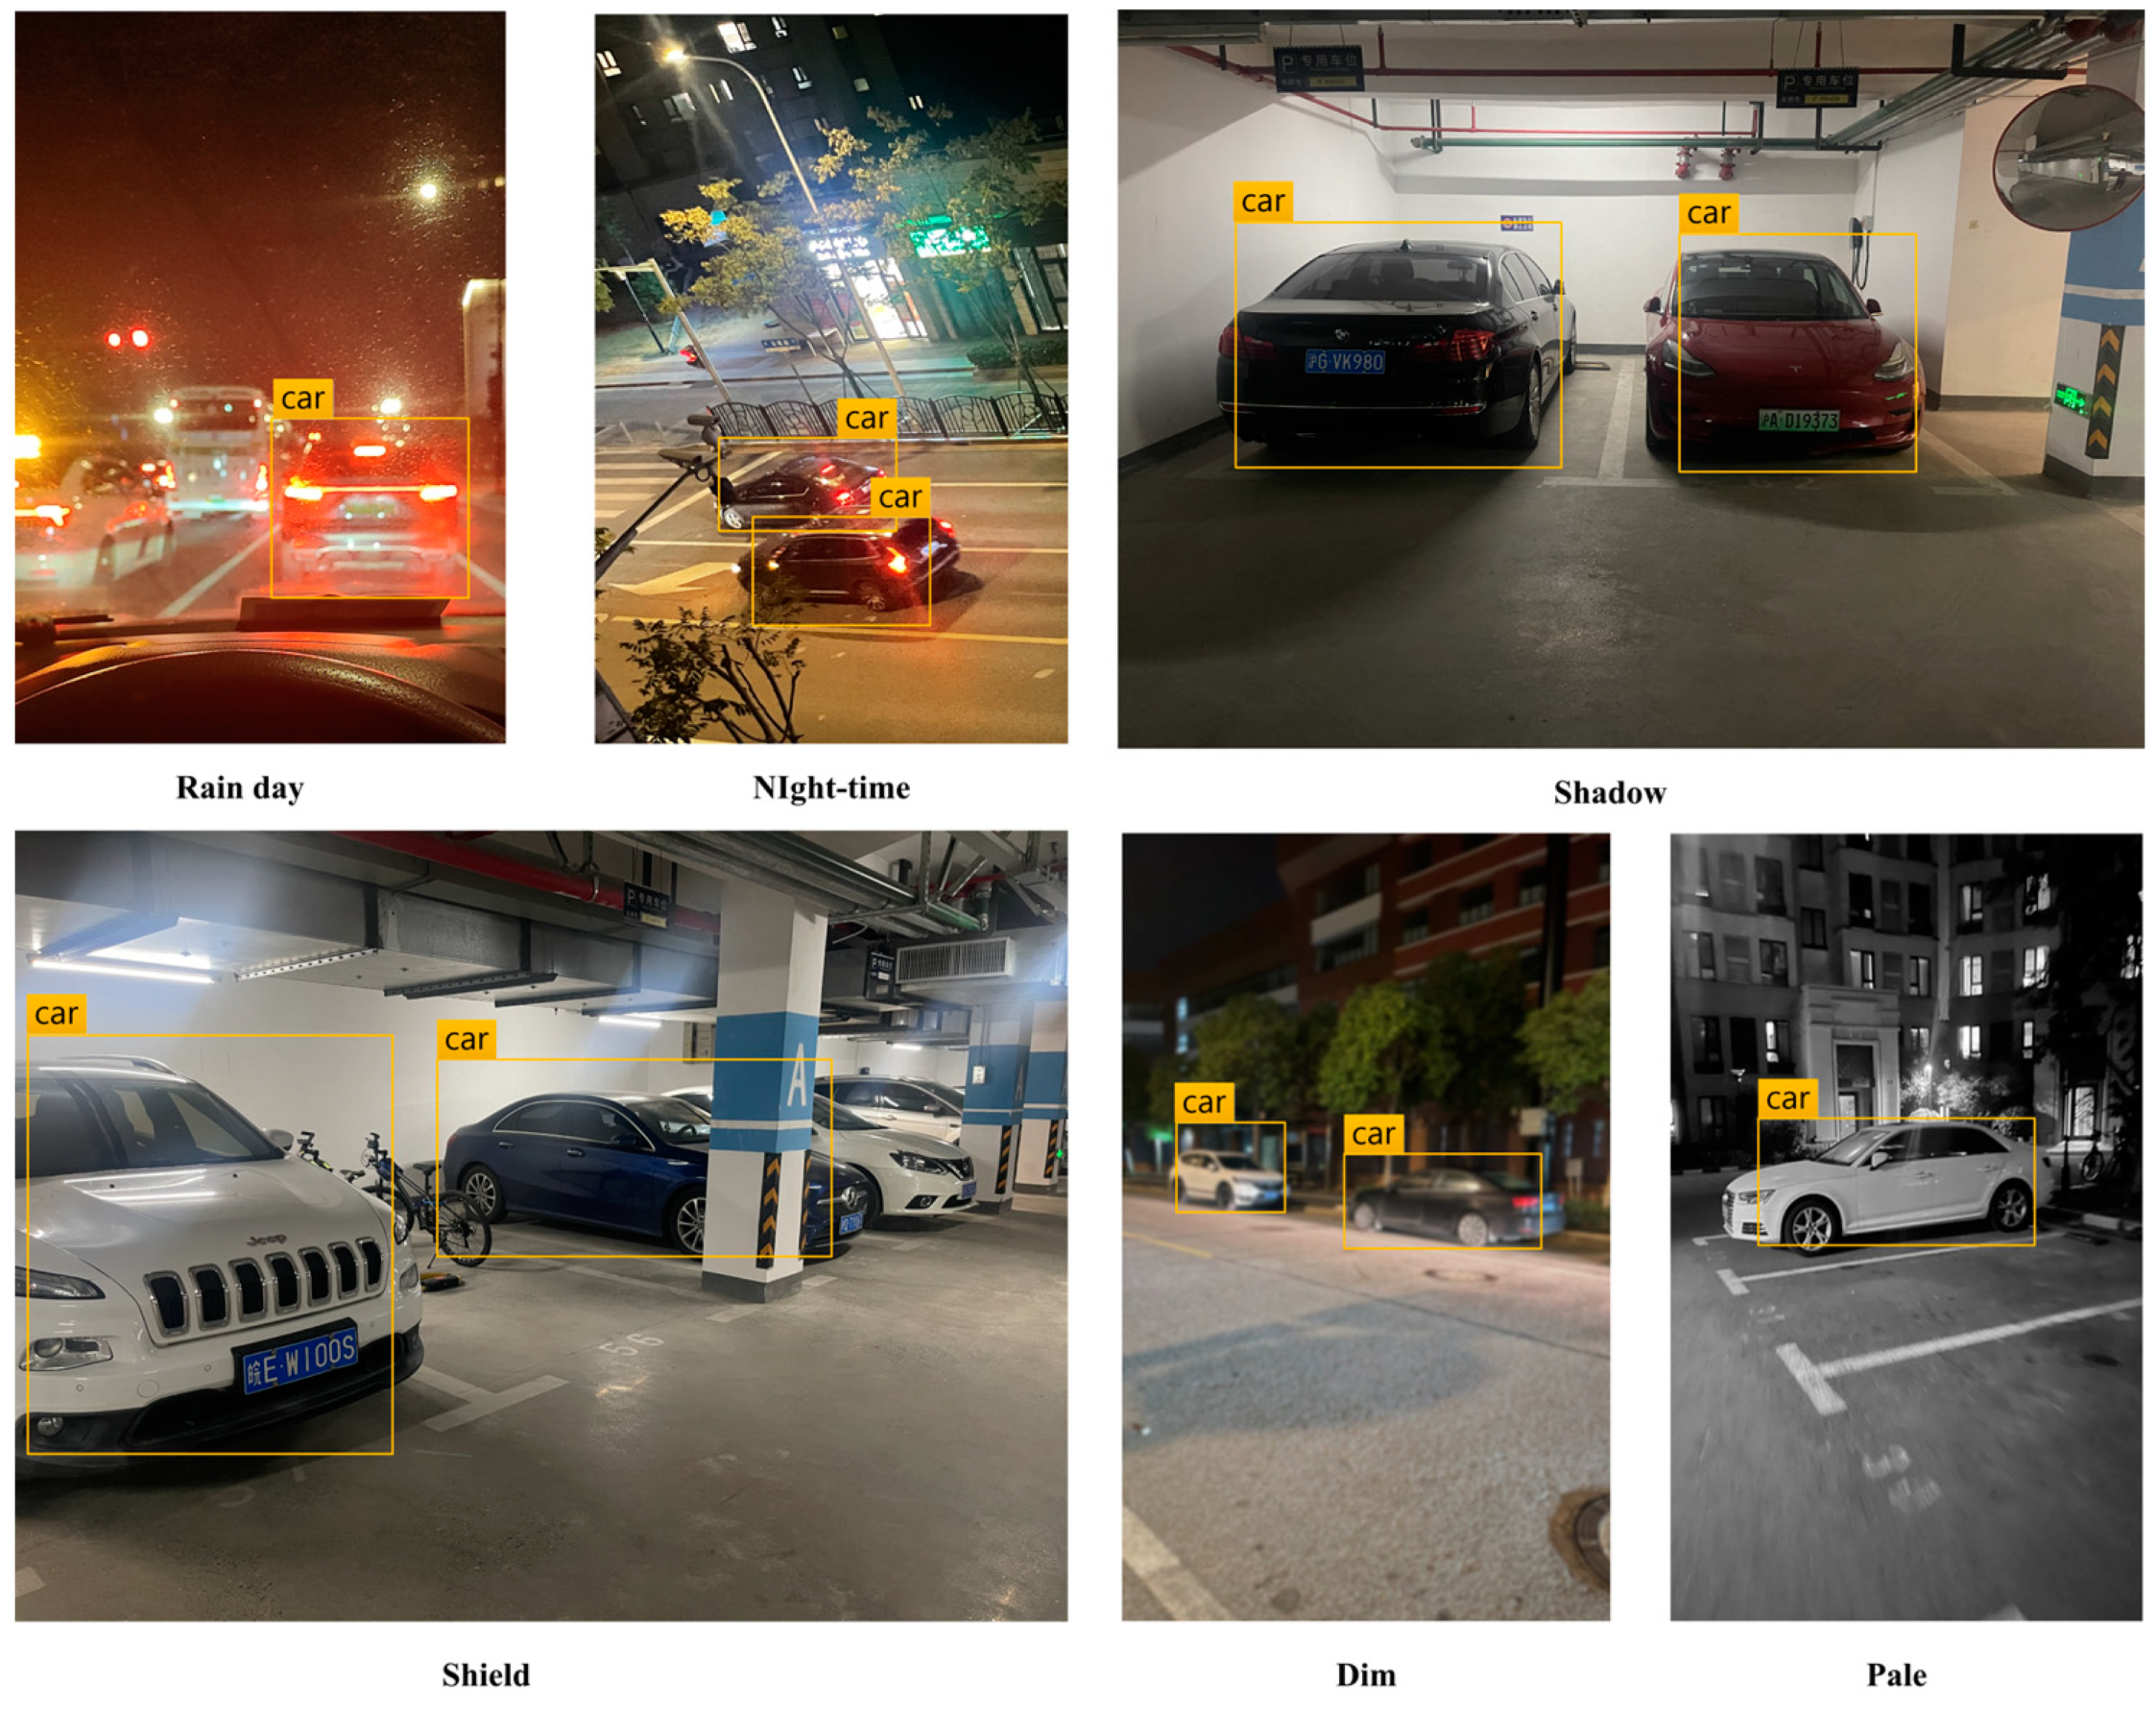
Discussion of Model Limitations
Funding
Data Availability Statement
Conflicts of Interest
References
- Ge, G.-y.; Yao, X.-f.; Xiang, W.-j.; Chen, Y.-p. Vehicle detection and tracking based on video image processing in intelligent transportation system. Neural Comput. Appl. 2022, 35, 2197–2209. [Google Scholar] [CrossRef]
- Wang, J.; Dong, Y.; Zhao, S.; Zhang, Z. A High-Precision Vehicle Detection and Tracking Method Based on the Attention Mechanism. Sensors 2023, 23, 724. [Google Scholar] [CrossRef] [PubMed]
- Peng, Y. Deep learning for 3D object detection and tracking in autonomous driving: A brief survey. arXiv 2023, arXiv:2311.06043. Available online: https://arxiv.org/pdf/2311.06043 (accessed on 24 November 2024).
- Li, C.; Ge, L. A Lightweight Low-illumination Object Detection Algorithm Based on YOLOv7. Laser Optoelectron. Prog. 2024, 61, 1437004. [Google Scholar]
- Li, D.; Jiang, G.; Yang, J.; Bai, Y.; Xie, Y.; Wang, C. Detection and Tracking Algorithm for Hypoxic Stress Behavior of Fish Based on Computer Vision. Trans. Chin. Soc. Agric. Mach. 2023, 54, 399–406. [Google Scholar]
- Lin, T.Y.; Dollár, P.; Girshick, R.; He, K.; Hariharan, B.; Belongie, S. Feature Pyramid Networks for Object Detection. In Proceedings of the 2017 IEEE Conference on Computer Vision and Pattern Recognition (CVPR), Honolulu, HI, USA, 21–26 July 2017; pp. 936–944. [Google Scholar]
- Redmon, J.; Divvala, S.; Girshick, R.; Farhadi, A. You Only Look Once: Unified, Real-Time Object Detection. In Proceedings of the 2016 IEEE Conference on Computer Vision and Pattern Recognition (CVPR), Las Vegas, NV, USA, 27–30 June 2016; pp. 779–788. [Google Scholar]
- Redmon, J.; Farhadi, A. YOLO9000: Better, Faster, Stronger. In Proceedings of the 2017 IEEE Conference on Computer Vision and Pattern Recognition (CVPR), Honolulu, HI, USA, 21–26 July 2017; pp. 7263–7271. [Google Scholar]
- Redmon, J.; Farhadi, A. YOLOv3: An Incremental Improvement. arXiv 2018, arXiv:1804.02767. [Google Scholar]
- Bochkovskiy, A.; Wang, C.Y.; Liao, H. YOLOv4: Optimal Speed and Accuracy of Object Detection. arXiv 2020, arXiv:2004.10934. [Google Scholar]
- Jocher, G. YOLOv5s[EB/OL]. Available online: https://github.com/ultralytics/yolov5 (accessed on 24 November 2024).
- Zhan, W.; Sun, C.; Wang, M.; She, J.; Zhang, Y.; Zhang, Z.; Sun, Y. An improved YOLOv5s real-time detection method for small objects captured by UAV. Soft Comput. 2022, 26, 361–373. [Google Scholar] [CrossRef]
- Liu, R.; Lehman, J.; Molino, P.; Petroski Such, F.; Frank, E.; Sergeev, A.; Yosinski, J. An intriguing failing of convolutional neural networks and the CoordConv solution. arXiv 2018, arXiv:1807.03247. [Google Scholar]
- Rezatofighi, H.; Tsoi, N.; Gwak, J.; Sadeghian, A.; Reid, I.; Savarese, S. Generalized Intersection Over Union: A Metric and a Loss for Bounding Box Regression. In Proceedings of the IEEE/CVF Conference on Computer Vision and Pattern Recognition (CVPR), Long Beach, CA, USA, 15–20 June 2019; pp. 658–666. [Google Scholar]
- Zheng, Z.; Wang, P.; Liu, W.; Li, J.; Ye, R.; Ren, D. Distance-IoU Loss: Faster and Better Learning for Bounding Box Regression. In Proceedings of the AAAI Conference on Artificial Intelligence, New York, NY, USA, 7–12 February 2020; Volume 34, pp. 12993–13000. [Google Scholar]
- Wojke, N.; Bewley, A.; Paulus, D. Simple Online and Realtime Tracking with a Deep Association Metric. arXiv 2017, arXiv:1703.07402. [Google Scholar]


| Calculation Formula | Advantage | Disadvantage | |
|---|---|---|---|
| IOU | Scale invariance, non-negative; identity; symmetry; triangular inequity | When IOU calculates two non-adjacent frames, is empty, IOU = 0 | |
| GIOU | Solves the problem that loss equals 0 when the detection frame and the real frame do not overlap | The calculation is relatively complex compared to IOU. | |
| DIOU | Direct regression of the Euclidean distance between the center points of the two frames accelerates convergence. | Directly minimizing the distance between the center point of the predicted frame and the real frame accelerates the convergence of the loss. | |
| CIOU | The loss of the length and width is increased, such that the prediction frame will be more consistent with the real frame. | The calculation complexity is relatively high, which may increase the computational cost during training. | |
| EIOU | The difference values of width and height were calculated separately instead of as an aspect ratio, and Focal Loss was introduced to solve the problem of unbalance of difficult and easy samples. |
| Parameters | Value |
|---|---|
| Weight | Yolov5s.pt |
| Batch size | 8 |
| Origin learning rate | 0.01 |
| Epochs | 50 |
| Momentum | 0.937 |
| Non-maximum suppression (NMS) | 0.6 |
| Network Model | Attention Mechanism | mAP_0.5/% | mAP_0.5:0.95/% |
|---|---|---|---|
| Yolov5s | SA | 99.497 | 90.633 |
| Yolov5s | CA | 99.500 | 90.526 |
| Yolov5s | SE | 99.500 | 90.407 |
| Yolov5s | SimAM | 99.497 | 90.410 |
| Network Model | Loss Function | Box_Loss | mAP_0.5/% | mAP_0.5:0.95/% |
|---|---|---|---|---|
| Yolov5s | Focal-EIoU | 0.015 | 99.508 | 90.833 |
| Yolov5s | CIoU | 0.015 | 99.483 | 90.701 |
| Yolov5s | EIoU | 0.017 | 99.457 | 90.341 |
| Network Model | Precision/% | Recall/% | mAP_0.5/% | mAP_0.5:0.95/% |
|---|---|---|---|---|
| YOLOv5s | 99.518 | 99.660 | 99.497 | 90.628 |
| YOLOv5s + CA | 99.323 | 99.809 | 99.500 | 90.633 |
| Yolov5s + SIoU | 98.919 | 1.000 | 99.493 | 90.681 |
| Yolov5s + TSCODE Head | 99.475 | 99.660 | 99.497 | 92.136 |
| Yolov5s + SA + Focal-EIoU + CoordConv | 100.000 | 99.529 | 99.500 | 92.211 |
| Network Model | Backbone | Detection Time/s | mAP_0.5/% | mAP_0.5:0.95/% |
|---|---|---|---|---|
| Yolov5s | CSPDarknet | 0.025 | 99.497 | 90.628 |
| Faster R-CNN | ResNet50 | 4.968 | 1.000 | 91.300 |
| Optimized Yolov5s | CSPDarknet | 0.059 | 99.500 | 92.221 |
Disclaimer/Publisher’s Note: The statements, opinions and data contained in all publications are solely those of the individual author(s) and contributor(s) and not of MDPI and/or the editor(s). MDPI and/or the editor(s) disclaim responsibility for any injury to people or property resulting from any ideas, methods, instructions or products referred to in the content. |
© 2024 by the author. Licensee MDPI, Basel, Switzerland. This article is an open access article distributed under the terms and conditions of the Creative Commons Attribution (CC BY) license (https://creativecommons.org/licenses/by/4.0/).
Share and Cite
Dong, Z. Vehicle Target Detection Using the Improved YOLOv5s Algorithm. Electronics 2024, 13, 4672. https://doi.org/10.3390/electronics13234672
Dong Z. Vehicle Target Detection Using the Improved YOLOv5s Algorithm. Electronics. 2024; 13(23):4672. https://doi.org/10.3390/electronics13234672
Chicago/Turabian StyleDong, Zhaopeng. 2024. "Vehicle Target Detection Using the Improved YOLOv5s Algorithm" Electronics 13, no. 23: 4672. https://doi.org/10.3390/electronics13234672
APA StyleDong, Z. (2024). Vehicle Target Detection Using the Improved YOLOv5s Algorithm. Electronics, 13(23), 4672. https://doi.org/10.3390/electronics13234672