Abstract
COVID-19 has disproportionately impacted communities based on sociodemographic and environmental factors. Previous studies have largely focused on traditional statistical models to investigate these disparities with limited attention to within-city variations. This research addresses this gap by employing advanced machine learning models to predict COVID-19 case counts at the neighborhood level within Toronto. Using algorithms such as Support Vector Regression, Random Forest, Gradient Boosting, and XGBoost, along with SHAP (SHapley Additive exPlanations) analysis, we identify key factors impacting COVID-19 transmission, including air pollution, socioeconomic status, and racialized group membership. Our results demonstrate that sociodemographic factors significantly influence sporadic cases, while environmental factors, particularly air pollutants, are critical in outbreak cases. This study highlights the value of machine learning in understanding complex interactions between risk factors with implications for targeted public health interventions to mitigate COVID-19 disparities.
1. Introduction
The COVID-19 pandemic has highlighted significant disparities in infection rates and outcomes across various sociodemographic, environmental, and economic factors. Early in the pandemic, it became apparent that infection risk and severity of outcomes were not evenly distributed within populations with certain groups bearing a disproportionate burden of disease. These disparities have raised concerns about the intersection of public health, environmental exposure, and social inequities, as they underscore the need to better understand how these factors contribute to vulnerability in different communities.
Several studies have investigated the relationship between environmental conditions, such as air pollution, and COVID-19 outcomes. For instance, research has found that long-term exposure to pollutants like particulate matter () and nitrogen dioxide () is associated with higher COVID-19 incidence and mortality rates. Pollutants are known to exacerbate respiratory and cardiovascular conditions, which in turn increase the risk of severe outcomes from respiratory infections, including COVID-19 [1,2,3]. At the same time, socioeconomic status (SES) and racialized group membership have been shown to influence both exposure to COVID-19 and the severity of its impact [4,5,6,7]. Marginalized populations are often more likely to live in high-density housing, use public transportation, and work in essential services, which increases their exposure to the virus [8].
These studies, while valuable, have primarily been led by researchers in environmental science [4], social studies [6], and statistics [8], with much of the research relying on traditional statistical methods, such as linear regression and other basic modeling techniques [2,9,10]. These models are useful in exploring direct relationships between variables, but they may oversimplify the complexity of the interactions between sociodemographic and environmental factors. For example, linear models often assume a static, linear relationship between predictors and outcomes, and they may not account for non-linear relationships or the temporal dynamics of disease spread. Moreover, the interrelationships between variables like air pollution, socioeconomic status, and racial disparities often require more sophisticated techniques to unravel.
Recent advances in machine learning (ML) offer robust tools for predicting COVID-19 cases and analyzing feature importance. Support Vector Regression (SVR) and Random Forest (RF) models are commonly used for their effectiveness in capturing non-linear relationships [11,12]. Gradient Boosting (GB) and XGBoost have gained popularity for their strong performance in structured datasets and are optimized for high accuracy [13,14]. Multi-Layer Perceptrons (MLPs) are neural networks capable of learning complex patterns, though susceptible to overfitting [15]. Negative Binomial Regression (NBR) effectively models count data, addressing overdispersion common in epidemiological data [16]. SHAP (SHapley Additive exPlanations) provides insights into feature importance, allowing for interpretable ML outcomes by quantifying each feature’s contribution to predictions [17]. Our study leverages these models to enhance prediction accuracy and explain the influence of sociodemographic and environmental factors on COVID-19 incidence.
The objective of this research is to leverage advanced machine learning algorithms to analyze neighborhood-level COVID-19 incidence in Toronto. Based on the existing literature and observed disparities in COVID-19 impacts across different communities, this study is guided by the following hypothesis:
- Hypothesis 1: Sociodemographic factors, including crowded housing, education levels, and racialized group membership, are significant predictors of sporadic COVID-19 cases within Toronto neighborhoods.
- Hypothesis 2: Environmental factors, such as air pollution indicators (e.g., , ) and reactive oxygen species (ROS) levels, play a larger role in predicting outbreak cases than sociodemographic factors.
These hypotheses aim to clarify the distinct roles that sociodemographic and environmental factors play in COVID-19 transmission, allowing for a more targeted analysis of factors contributing to disparities in infection rates and outcomes. The remainder of this paper tests these hypotheses through machine learning analysis and interpretable models. By employing a variety of models, including Support Vector Regression (SVR), Random Forest, Gradient Boosting, Multi-Layer Perceptron (MLP), XGBoost, and Negative Binomial Regression (NBR), we aim to improve the accuracy of predictions and gain a clearer understanding of the key factors driving COVID-19 transmission at the neighborhood level. In particular, we focus on the role of sociodemographic characteristics, such as socioeconomic status, racialized group membership, and environmental exposures like air pollution. Furthermore, we use SHAP (SHapley Additive exPlanations) analysis to assess the importance of different features in the model predictions, providing insights into the relative influence of various factors.
Toronto serves as an ideal case study for this analysis due to its diverse population and unique environmental and sociodemographic characteristics. The city is home to a wide range of socioeconomic statuses, ethnic backgrounds, and varying levels of exposure to air pollution, making it a rich dataset for investigating how these factors intersect with COVID-19 outcomes. The dataset used in this study was sourced from multiple Canadian institutions and includes COVID-19 case data, environmental exposure measures, and sociodemographic indicators across 140 neighborhoods in Toronto. Key variables include concentrations of pollutants such as and , unemployment rates, education levels, income distribution, racialized group membership, and additional risk factors like public transit use and crowded housing. Reactive oxygen species (ROS) estimates were also calculated to assess the environmental impact on health.
In this study, we evaluated the performance of different models using metrics such as Mean Squared Error (MSE) and R-squared (). Predictive modeling revealed that NBR, XGBoost, and SVR performed particularly well for sporadic cases, with NBR standing out due to its capacity to handle overdispersion in the data. XGBoost and SVR models also proved effective for predicting outbreak cases, whereas MLP regression struggled, which was possibly due to overfitting in smaller datasets. Notably, MSE values were higher when predicting outbreak cases, reflecting greater variability in the data. SHAP analysis provided further insight into the key factors influencing these cases, revealing that sociodemographic factors such as crowded housing, education levels, and racial background were particularly influential in sporadic cases. In contrast, environmental factors played a larger role in outbreak cases, suggesting distinct dynamics between different types of COVID-19 spread.
By employing these advanced methods, we aim to contribute to the growing body of research on the interplay between sociodemographic, environmental, and health factors in the context of COVID-19. Our findings have important public health implications, as they can inform targeted interventions and policies to reduce disparities in COVID-19 outcomes. The use of machine learning models not only enhances predictive accuracy but also provides a framework for analyzing complex, multi-faceted problems in public health.
The remainder of this paper is organized as follows: Section 2 provides an overview of related work in this area, distinguishing our contributions from existing studies. Section 3 describes the dataset used in our study, detailing the sociodemographic and environmental variables collected. Section 4 outlines our methodology, including the predictive models employed and the SHAP analysis used to interpret feature importance. Section 5 presents the experimental results along with observations and analysis of the findings. Finally, Section 6 concludes the paper by summarizing key insights and suggesting directions for future research.
2. Related Work
2.1. Sociodemographic and Environmental Factors
Recent research has emphasized the role of structural racism and socioeconomic disparities in shaping COVID-19 outcomes. Racialized communities, such as Black and Hispanic populations, have been disproportionately affected due to overrepresentation in frontline roles, crowded living conditions, and limited healthcare access [6,7,18]. Socioeconomic factors like unemployment, low income, and lower education levels have also been linked to higher infection rates and worse health outcomes [19,20].
Structural racism and economic disadvantage often intersect, compounding COVID-19 risks for vulnerable communities. For instance, Chowkwanyun and Reed (2020) highlighted that racial and economic inequalities reinforce one another, resulting in heightened exposure to COVID-19 and its adverse impacts [21]. Systematic reviews have found that marginalized groups experienced higher infection, hospitalization, and mortality rates compared to their White counterparts [22,23].
Air pollution has also been a significant factor contributing to COVID-19 disparities. Studies have shown that exposure to pollutants such as and is linked to increased COVID-19 incidence and severity [2,24]. Stieb et al. (2021) demonstrated that ROS from air pollution exacerbated health disparities especially in areas with higher proportions of racialized and low-SES residents [1]. ROS is a novel indicator in human lung epithelial lining fluid (ELF) attributable to transition metals in fine particulate matter (particulate matter with an aerodynamic diameter); thus, we use it as the primary exposure variable to address the lack of evidence pertaining to exposure metrics specifically reflecting oxidative stress.
2.2. Machine Learning in COVID-19 Analysis
Machine learning (ML) has been extensively applied to analyze COVID-19 data with several state-of-the-art reviews summarizing its applications. Studies have employed ML models such as Bayesian neural networks, Support Vector Regression (SVR), Random Forests, and LSTMs to forecast COVID-19 cases, mortality rates, and recoveries across different regions [25,26,27]. While these models have demonstrated their capability in handling complex, non-linear relationships and predicting trends in COVID-19 spread, the focus has primarily been on regional or national datasets with limited exploration of within-city variations.
ML models, including SVR, RF, and Bayesian neural networks, have shown promise in predicting COVID-19 trends and understanding key factors affecting disease spread. SVR is favored for handling non-linear data, while RF models excel in variable-rich environments [25,27]. Bayesian neural networks provide probabilistic insights into uncertainties, which is crucial for healthcare predictions, whereas Long Short-Term Memory (LSTM) networks capture temporal dependencies effectively [26]. Despite these advancements, limited studies apply ML to neighborhood-level variations. This research builds on these models by incorporating SHAP analysis to interpret complex data relationships specific to urban COVID-19 dynamics.
Our Contribution: Unlike previous studies that have mainly used traditional regression models or ML models focused on regional or country-level data, our research explores within-city variables in Toronto to understand their impact on COVID-19 incidence. We systematically compare several machine learning methods for predicting COVID-19 cases and employ SHAP analysis to understand the influence of specific features. This approach provides a more detailed analysis of the factors contributing to COVID-19 disparities at the neighborhood level, highlighting the role of sociodemographic and environmental factors in the spread of the virus.
3. Materials and Methods
3.1. Dataset
The data were obtained from the Toronto Open Data portal, McGill University, the University of Toronto, the Canadian Urban Environmental Health Research Consortium (CANUE), and Statistics Canada [28]. It covers data on sporadic and outbreak-related COVID-19 cases through 12 October 2020.
The dataset comprises 140 records representing distinct neighborhoods across Toronto with data aggregated at the neighborhood level to capture area-specific variations. This aggregation allows for a detailed examination of disparities in sociodemographic and environmental factors, accurately reflecting differences in air pollutants, racial demographics, and income distribution. The dataset includes 25 features categorized into sociodemographic and environmental factors. Sociodemographic factors encompass unemployment rate, education level, income, racialized group membership, public transit usage, and crowded housing. Environmental factors include concentrations of and , reactive oxygen species (ROS) levels, and green space (NDVI) measures, all of which are important predictors of respiratory health risks. ROS estimates were calculated using a model of ROS generation in lung lining fluid, accounting for iron and copper content in through a land-use regression approach. Summary statistics for these features are presented in Table 1 and Table 2.

Table 1.
Features of COVID-19 cases.
Table 2.
Distribution of cases, environmental exposures, and sociodemographic factors across Toronto neighborhoods.
There were 23,061 confirmed cases of COVID-19 in Toronto through 12 October 2020. Of these, 16,415 (71%) were considered sporadic and 6646 (29%) were considered outbreak related. Characteristics of cases are summarized in Table 1. The fatality rate was considerably higher for outbreak-related cases than for sporadic cases, whereas the hospitalization rate was only slightly higher. Rates of intensive care admission and intubation were slightly higher for sporadic cases. Men and women were equally represented among sporadic cases, whereas there was a preponderance of women among outbreak-related cases. The majority of sporadic cases were less than 50 years of age, whereas the majority of outbreak-related cases were 50 years of age or older. The distribution of cases, environmental exposures, and sociodemographic characteristics by neighborhood is shown in Table 2.
3.2. Methodology
3.2.1. Predictive Models
In this study, we employed several machine learning models to predict COVID-19 incidence based on sociodemographic, environmental, and health-related factors. The models were chosen based on their ability to handle complex, non-linear relationships, and their suitability for tabular data. We grouped the models into the following categories:
- Tree-Based Ensemble Models:
- −
- Random Forest (RF) is an ensemble of decision trees, where each tree is trained on a different subset of the data. It provides robust predictions by averaging multiple tree outputs, which reduces overfitting and increases generalizability [12].
- −
- Gradient Boosting (GB) and XGBoost are boosting-based ensemble methods that build decision trees sequentially, where each new tree attempts to correct the errors made by the previous ones. XGBoost is an optimized version of GB that provides better performance and faster training [13,14].
- Support Vector Machine-Based Model:
- −
- Support Vector Regression (SVR) is a powerful model for regression tasks that uses hyperplanes to map the input features into a higher-dimensional space. It works well with non-linear data and can capture complex relationships using kernel functions [11].
- Neural Network-Based Model:
- −
- Multi-Layer Perceptron (MLP) is a feedforward artificial neural network with one or more hidden layers. It can learn complex non-linear relationships between the input features and output, making it suitable for tasks involving highly correlated variables [15].
- Generalized Linear Model:
- −
- Negative Binomial Regression (NBR) is a statistical regression model often used for count data where the variance is greater than the mean, which is a scenario known as overdispersion. In contrast to standard linear regression models, which assume homoscedasticity (constant variance), NBR is more powerful because it directly accounts for and models the heteroscedastic nature of count data. It has been used extensively in epidemiological studies to model count-based outcomes like disease incidence, where the occurrence rates can vary greatly across different populations or regions [16,29,30].
These models were selected for their complementary strengths in capturing different types of relationships within the data. Tree-based ensemble models like Random Forest and XGBoost excel at capturing non-linear interactions and handling mixed data types, whereas SVR and MLP provide strong performance for more complex, non-linear data patterns. NBR is particularly effective in situations where the dependent variable exhibits significant variance, which cannot be adequately captured by a normal linear model.
3.2.2. SHAP Analysis
To interpret the predictions made by the machine learning models, we used SHapley Additive exPlanations (SHAP) [31]. SHAP is a game theory-based approach that explains individual model predictions by computing the contribution of each feature to the predicted outcome. The main idea behind SHAP is to fairly distribute the difference between a model’s prediction and the average prediction among all input features, which is based on Shapley values from cooperative game theory. The SHAP value for a feature i is computed as
where S represents a subset of all features N that does not include feature i, and is the model prediction using only the features in subset S. The SHAP value represents the contribution of feature i to the difference between the model’s prediction and the average prediction.
SHAP has been used extensively in related works to interpret complex models and identify important features in various domains, including healthcare and environmental studies [17,32]. By applying SHAP, we aim to provide insights into how different sociodemographic and environmental factors contribute to the incidence of COVID-19, allowing for a better understanding of the model’s decision-making process and identifying key drivers of COVID-19 transmission at the neighborhood level.
4. Experiments
The experiments were conducted using three target variables: sporadic COVID-19 cases in August, sporadic COVID-19 cases in October, and outbreak-related COVID-19 cases in October. Our study chose to focus on outbreak-related cases data from October rather than 31 August due to the increased case variability and density in October, which provided a more representative sample for analyzing outbreak dynamics. August data showed lower outbreak rates, which limited the ability to assess patterns for predictive modeling. Each model was evaluated using MSE and , where MSE measures the average squared difference between observed and predicted values, indicating the prediction error, while represents the proportion of variance explained by the model, assessing its goodness of fit.
4.1. Experimental Settings
For our experiments, we conducted extensive hyperparameter tuning using grid search with cross-validation to optimize the performance of each predictive model. Specifically, we used a 5-fold cross-validation strategy to ensure robustness and mitigate overfitting. The grid search was performed over a predefined set of hyperparameters for each model:
- Random Forest: Number of trees in the forest () was varied from 100 to 500, and the maximum depth of each tree () was adjusted from 10 to 50.
- Gradient Boosting/XGBoost: Learning rate () was selected from 0.01, 0.1, and 0.2, and the number of estimators () was varied from 100 to 500. Additionally, the maximum depth of trees was optimized from 3 to 10.
- SVR: The regularization parameter (C) was selected from 0.1, 1, and 10, and kernel functions such as linear, rbf, and poly were considered.
- MLP: The number of hidden layers and units was varied, with configurations such as (50), (100), and (100, 50). The activation function was chosen from relu, tanh, and logistic.
- Negative Binomial Regression: The regularization parameter was varied from 0, 0.1, 0.5, to 1.0 to address overdispersion and improve model fit.
The grid search was implemented using the GridSearchCV function from the scikit-learn library, and computational efficiency was achieved by parallelizing the search using multiple cores. Table 3 shows the best parameters on each dataset.
Table 3.
Best parameters for models.
4.2. Packages Used
The following packages were used to implement the predictive models and SHAP analysis:
- Scikit-learn [33]: Used for implementing Random Forest, Gradient Boosting, SVR, and MLP models. It also provided tools for preprocessing, hyperparameter tuning, and evaluation (e.g., GridSearchCV).
- XGBoost [14]: The xgboost package was used to implement the XGBoost model, taking advantage of its scalability and performance optimization features.
- SHAP [17]: The shap package was used for SHAP value calculation and visualization to interpret the contribution of each feature in the predictive models.
4.3. Experimental Design
In this study, we conducted three groups of experiments to evaluate and understand the relationships between various sociodemographic and environmental factors and COVID-19 incidence.
- Performance Evaluation of Predictive Models: The first group focused on evaluating the performance of the predictive models using two evaluation metrics: MSE and . We then compared the models based on their best performance in predicting COVID-19 incidence.
- Comparative Analysis Between Different Scenarios: The second group was to construct different models to compare the differences between various scenarios:
- Sporadic Cases on Two Dates: We compared models built for predicting sporadic COVID-19 cases on two different dates (31 August and 12 October) to understand temporal changes in the predictors and their impact on model performance.
- Sporadic vs. Outbreak Cases on the Same Date: We also constructed models for sporadic and outbreak-related cases on the same date (12 October) to gain a better understanding of how the nature of the cases (sporadic vs. outbreak) impacts the relationships between features and COVID-19 incidence.
- SHAP Analysis for Feature Importance: Finally, we conducted SHAP analysis on the best model reported from the previous experiments for each of the three dates. The purpose of this analysis was to understand the evolution of important features over time and under different scenarios. By examining how feature importance changes, we aimed to identify which sociodemographic and environmental factors were more relevant to COVID-19 incidence under different conditions.
5. Results and Discussions
5.1. Results
Our experiments provided key insights into the influence of sociodemographic and environmental factors on COVID-19 incidence across Toronto neighborhoods. Predictive models such as XGBoost, Support Vector Regression (SVR), and Negative Binomial Regression (NBR) achieved notable accuracy, particularly in capturing the complexity of sporadic and outbreak COVID-19 cases at the neighborhood level.
For sporadic cases, NBR, XGBoost, and SVR performed particularly well with NBR standing out due to its capacity to handle overdispersion in the data. XGBoost and SVR also proved effective in predicting outbreak cases, whereas MLP regression struggled, which was possibly due to overfitting, particularly on smaller datasets. Notably, the Mean Squared Error (MSE) values were higher when predicting outbreak cases, reflecting the greater variability and unpredictability in the data for these cases (see Figure 1). The scores further highlighted model performance with NBR, XGBoost, and SVR consistently providing high accuracy for sporadic cases (see Figure 2).
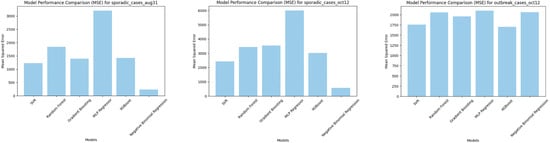
Figure 1.
Comparison of different predicative models (MSE).
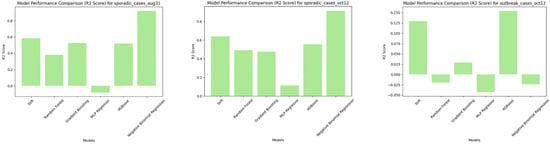
Figure 2.
Comparison of different predicative models ().
SHAP (SHapley Additive exPlanations) analysis revealed the importance of specific features within each case type. For sporadic cases, sociodemographic factors, particularly crowded housing, education levels, and racialized group membership, consistently ranked among the top predictors. In contrast, environmental factors such as , , and ROS levels, while relevant, appeared to play a secondary role, particularly in outbreak cases. SHAP scores showed that sociodemographic factors had consistently higher importance scores compared to environmental factors, reinforcing the critical role of these social determinants (see Figure 3).
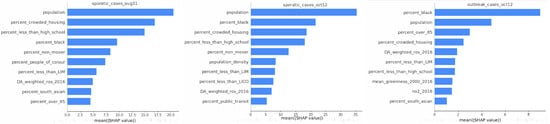
Figure 3.
Feature importance.
The ranking of specific features varied between sporadic and outbreak cases. For sporadic cases, the top features included crowded housing, racialized group membership, education level, and ROS levels. For outbreak cases, while similar sociodemographic factors ranked highly, the importance of ROS levels and concentrations was notably lower, suggesting that the outbreak dynamics might be less influenced by immediate environmental factors.
5.2. Discussion
5.2.1. Verification of Hypothesis 1: Sociodemographic Factors and Sporadic COVID-19 Cases
Hypothesis 1.
posited that sociodemographic factors, including crowded housing, education levels, and racialized group membership, would be significant predictors of sporadic COVID-19 cases. The results from our models support this hypothesis. SHAP analysis revealed that sociodemographic factors, particularly crowded housing and education levels, consistently ranked among the top predictors for sporadic cases. The influence of racialized group membership was also substantial, aligning with previous research that highlights the disproportionate burden of COVID-19 among marginalized communities.
These findings indicate that sporadic COVID-19 cases are closely tied to social and economic conditions that impact daily exposure risks, such as residential density and occupational settings, which are often influenced by education and socioeconomic status. This suggests that public health interventions focused on addressing sociodemographic disparities—particularly in high-density, low-income neighborhoods—may be effective in reducing sporadic COVID-19 transmission.
5.2.2. Verification of Hypothesis 2: Environmental Factors and Outbreak COVID-19 Cases
Hypothesis 2.
proposed that environmental factors, such as , , and reactive oxygen species (ROS) levels, would play a larger role in predicting outbreak cases than sociodemographic factors. However, our findings indicate the opposite: sociodemographic factors, particularly crowded housing, racialized group membership, and education levels, emerged as stronger predictors of outbreak cases than environmental factors.
This outcome suggests that social and economic vulnerabilities, including residential density, community structure, and socioeconomic status, have a more direct impact on outbreak dynamics compared to environmental exposures. Although environmental factors like air pollution are still relevant, their influence appears secondary to that of sociodemographic factors within the context of outbreak cases.
These findings imply that public health interventions aimed at mitigating COVID-19 outbreaks should prioritize sociodemographic vulnerabilities, focusing efforts on high-density and socioeconomically disadvantaged neighborhoods. While environmental factors should not be disregarded, these results underscore the importance of targeted social policies, such as support for housing infrastructure and essential workers, to effectively reduce transmission risks in outbreak-prone areas.
5.2.3. Implications of Findings
These findings underscore the complex interplay between sociodemographic and environmental factors in shaping COVID-19 transmission dynamics. While sporadic cases appear to be more strongly influenced by social determinants, outbreak cases also show significant ties to these factors with environmental factors playing a supportive, yet secondary, role. This distinction suggests that a multi-faceted approach to public health interventions—addressing both sociodemographic and environmental risks—is critical for effectively managing COVID-19 spread across diverse neighborhoods.
6. Conclusions
6.1. Theoretical and Practical Implications
This study advances theoretical understanding of the interaction between sociodemographic and environmental factors in shaping COVID-19 transmission. Our findings highlight the importance of considering neighborhood-level disparities in both public health and machine learning research, especially in urban settings. The use of advanced machine learning models, such as XGBoost, SVR, and NBR, demonstrates their effectiveness in capturing complex interactions between social determinants and COVID-19 incidence, offering a practical framework for identifying high-risk areas. Previous research has also highlighted the role of socioeconomic factors in public health disparities, underscoring our findings that factors like crowded housing and racialized group membership are critical in predicting COVID-19 spread [4,7]. This analysis contributes to a growing body of work in epidemiology that applies machine learning to enhance predictive accuracy and public health responses.
6.2. Limitations
While this study offers valuable insights, it has several limitations. The use of aggregated neighborhood-level data may obscure individual-level variations, which could lead to overgeneralized findings. Moreover, focusing exclusively on Toronto limits the broader applicability of results to other urban or rural settings with distinct sociodemographic and environmental profiles. Studies on public health have highlighted that individual mobility patterns and personal health data play a critical role in accurately modeling disease spread, which was not possible in our study due to data constraints [2,8]. Future studies could address these limitations by integrating individual-level data for more precise predictions.
6.3. Future Work
Future research should focus on incorporating real-time data on individual mobility, socioeconomic activities, and vaccination rates to capture finer-grained patterns of COVID-19 transmission. Additionally, expanding this research to other cities would help validate our findings and enhance the generalizability of results across different sociodemographic contexts. Machine learning approaches such as ensemble modeling that combine strengths of different algorithms could further optimize predictive accuracy, providing a more robust tool for public health planning and intervention. Recent studies have shown that combining multiple predictive models can improve performance in complex, multi-factor epidemiological scenarios [14,16], which supports this direction for future work.
Author Contributions
Methodology, B.A.Y.; Formal analysis, B.A.Y.; Investigation, B.A.Y.; Data curation, B.A.Y.; Writing—original draft, B.A.Y.; Writing—review & editing, Q.V.H.; Visualization, B.A.Y.; Supervision, Q.V.H.; Project administration, Q.V.H.; Funding acquisition, Q.V.H. All authors have read and agreed to the published version of the manuscript.
Funding
This research was funded by NSERC Discovery Grant and NSERC Collaborative Research and Training Experience program.
Data Availability Statement
Data are contained within the article.
Conflicts of Interest
The authors declare no conflicts of interest.
References
- Stieb, D.M.; Evans, G.J.; To, T.M.; Lakey, P.S.; Shiraiwa, M.; Hatzopoulou, M.; Minet, L.; Brook, J.R.; Burnett, R.T.; Weichenthal, S.A. Within-city variation in reactive oxygen species from fine particle air pollution and COVID-19. Am. J. Respir. Crit. Care Med. 2021, 204, 168–177. [Google Scholar] [CrossRef] [PubMed]
- Wu, X.; Nethery, R.C.; Sabath, M.B.; Braun, D.; Dominici, F. Air pollution and COVID-19 mortality in the United States: Strengths and limitations of an ecological regression analysis. Sci. Adv. 2020, 6, eabd4049. [Google Scholar] [CrossRef] [PubMed]
- Brandt, E.; Beck, A.F.; Mersha, T.B. Air pollution, racial disparities, and COVID-19 mortality. J. Allergy Clin. Immunol. 2020, 146, 61–63. [Google Scholar] [CrossRef] [PubMed]
- Frontera, A.; Cianfanelli, L.; Vlachos, K.; Landoni, G.; Cremona, G. Severe air pollution links to higher mortality in COVID-19 patients: The “double-hit” hypothesis. J. Infect. 2020, 81, 255–259. [Google Scholar] [CrossRef]
- Ciencewicki, J.; Jaspers, I. Air pollution and respiratory viral infection. Inhal. Toxicol. 2007, 19, 1135–1146. [Google Scholar] [CrossRef]
- Kim, S.J.; Bostwick, W. Social vulnerability and racial inequality in COVID-19 deaths in Chicago. Health Educ. Behav. 2020, 47, 509–513. [Google Scholar] [CrossRef]
- Millett, G.A.; Jones, A.T.; Benkeser, D.; Baral, S.; Mercer, L.; Beyrer, C.; Honermann, B.; Lankiewicz, E.; Mena, L.; Crowley, J.S.; et al. Assessing differential impacts of COVID-19 on black communities. Ann. Epidemiol. 2020, 47, 37–44. [Google Scholar] [CrossRef]
- Villeneuve, P.J.; Goldberg, M.S. Methodological considerations for epidemiological studies of air pollution and the SARS and COVID-19 coronavirus outbreaks. Environ. Health Perspect. 2020, 128, 95001. [Google Scholar] [CrossRef]
- Liang, D. Urban air pollution may enhance COVID-19 case-fatality and mortality rates in the United States. Innovation 2020, 1, 100047. [Google Scholar]
- Adhikari, A.; Yin, J. Short-term effects of ambient ozone, PM2.5, and meteorological factors on COVID-19 confirmed cases and deaths in Queens, New York. Int. J. Environ. Res. Public Health 2020, 17, 4047. [Google Scholar] [CrossRef]
- Drucker, H.; Burges, C.J.; Kaufman, L.; Smola, A.J.; Vapnik, V. Support vector regression machines. Adv. Neural Inf. Process. Syst. 1997. Available online: https://api.semanticscholar.org/CorpusID:743542 (accessed on 13 November 2024).
- Breiman, L. Random forests. Mach. Learn. 2001, 45, 5–32. [Google Scholar] [CrossRef]
- Friedman, J.H. Greedy function approximation: A gradient boosting machine. Ann. Stat. 2001, 29, 1189–1232. [Google Scholar] [CrossRef]
- Chen, T.; Guestrin, C. Xgboost: A scalable tree boosting system. In Proceedings of the 22nd ACM SIGKDD International Conference on Knowledge Discovery and Data Mining, San Francisco, CA, USA, 13–17 August 2016; pp. 785–794. [Google Scholar]
- Rumelhart, D.E.; Hinton, G.E.; Williams, R.J. Learning Representations by Back-Propagating Errors; Nature Publishing Group: London, UK, 1986. [Google Scholar]
- Hilbe, J.M. Negative Binomial Regression, 2nd ed.; Cambridge University Press: Cambridge, UK, 2011. [Google Scholar]
- Lundberg, S.M.; Lee, S.I. A unified approach to interpreting model predictions. Adv. Neural Inf. Process. Syst. 2017, 30, 4765–4774. [Google Scholar]
- Richardson, L.; Norris, M. COVID-19 and the impact of structural racism on health. J. Racial Ethn. Health Disparities 2021, 8, 138–144. [Google Scholar]
- Patel, J.A.; Nielsen, F.B.H.; Badiani, A.A.; Assi, S.; Unadkat, V.A.; Patel, B.; Ravindrane, R.; Wardle, H. Poverty, inequality, and COVID-19: The forgotten vulnerable. Public Health 2021, 183, 110–111. [Google Scholar] [CrossRef]
- Bambra, C.; Riordan, R.; Ford, J.; Matthews, F. The COVID-19 pandemic and health inequalities. J. Epidemiol. Community Health 2020, 74, 964–968. [Google Scholar] [CrossRef]
- Chowkwanyun, M.; Reed, A.L. Racial health disparities and COVID-19—Caution and context. N. Engl. J. Med. 2020, 383, 201–203. [Google Scholar] [CrossRef]
- Smith, J.; Lee, K. A systematic review of racial/ethnic and socioeconomic disparities in COVID-19. Int. J. Equity Health 2023, 22, 10–25. [Google Scholar]
- Scott, L.; Thompson, P. COVID-19 work-related health outcomes among racialized frontline workers: A scoping review. BMC Public Health 2023, 23, 132. [Google Scholar]
- Hernandez Carballo, I.; Bakola, M.; Stuckler, D. The impact of air pollution on COVID-19 incidence, severity, and mortality: A systematic review of studies in Europe and North America. Environ. Res. 2022, 215, 114155. [Google Scholar] [CrossRef] [PubMed]
- Shahid, F.; Zameer, A.; Muneeb, M. Predictions for COVID-19 with deep learning models: A state-of-the-art survey. Chaos Solitons Fractals 2020, 140, 110218. [Google Scholar] [CrossRef] [PubMed]
- Rustam, F.; Reshi, A.A.; Mehmood, A.; Ullah, S.; Asghar, M.; Bilal, M.; Choi, G.S. COVID-19 future forecasting using supervised machine learning models. IEEE Access 2020, 8, 101489–101499. [Google Scholar] [CrossRef]
- Alzahrani, A.; Alharbi, E.; Alghamdi, J. Machine learning applications for understanding the spread and impact of COVID-19: A review. Int. J. Environ. Res. Public Health 2023, 20, 3102. [Google Scholar]
- Government of Canada. Toronto Open Data Portal: COVID-19 Cases and Sociodemographic Data. 2023. Available online: https://open.canada.ca/data/en/dataset/2d86f026-10b4-44ac-a68b-80a9dd5dd390 (accessed on 13 October 2024).
- Cameron, A.C.; Trivedi, P.K. Regression Analysis of Count Data; Econometric Society Monographs; Cambridge University Press: Cambridge, UK, 1998; Volume 30. [Google Scholar]
- Long, J.S. Regression Models for Categorical and Limited Dependent Variables; Advanced Quantitative Techniques in the Social Sciences; Sage Publications: Thousand Oaks, CA, USA, 1997; Volume 7. [Google Scholar]
- Kraev, E.; Koseoglu, B.; Traverso, L.; Topiwalla, M. Shap-Select: Lightweight Feature Selection Using SHAP Values and Regression. arXiv 2024, arXiv:2410.06815. [Google Scholar]
- Molnar, C. Interpretable Machine Learning; Lulu.com: Morrisville, NC, USA, 2020. [Google Scholar]
- Pedregosa, F.; Varoquaux, G.; Gramfort, A.; Michel, V.; Thirion, B.; Grisel, O.; Blondel, M.; Prettenhofer, P.; Weiss, R.; Dubourg, V.; et al. Scikit-learn: Machine learning in Python. J. Mach. Learn. Res. 2011, 12, 2825–2830. [Google Scholar]
Disclaimer/Publisher’s Note: The statements, opinions and data contained in all publications are solely those of the individual author(s) and contributor(s) and not of MDPI and/or the editor(s). MDPI and/or the editor(s) disclaim responsibility for any injury to people or property resulting from any ideas, methods, instructions or products referred to in the content. |
© 2024 by the authors. Licensee MDPI, Basel, Switzerland. This article is an open access article distributed under the terms and conditions of the Creative Commons Attribution (CC BY) license (https://creativecommons.org/licenses/by/4.0/).