1. Introduction
In today’s digital information age, tables, as an important way to store structured information, have been widely used to organize, present and analyze data, whether in business, science or government. Additionally, due to some reliability and security requirements such as handwritten signatures in sensitive scenarios, the use of paper tables remains unavoidable. However, a large number of paper tables or image tables make it difficult for the information contained within them to be directly utilized by computer systems. Consequently, the development of table recognition has become crucial.
As we all know, table recognition tasks are primarily divided into three major tasks: table area detection, table structure recognition and table content recognition. Existing table area detection methods have already achieved relatively ideal results, including methods based on object detection [
1,
2,
3], methods based on image segmentation [
4,
5,
6], and methods based on features extraction [
7,
8,
9]. Table content recognition is mainly accomplished through optical character recognition(OCR) methods, with mainstream approaches including CRNN [
10], SVTR [
11], ABINet [
12] and MASTER [
13]. Table structure recognition is achieved by understanding the table layout and connecting the table area detection to the table content recognition. Existing table structure recognition methods can be roughly divided into three categories: object detection-based, image segmentation-based, and sequence prediction-based. Among these, the first two methods rely on visual features, such as separator lines, cells, text blocks, rows and columns. Specifically, the object detection-based method reconstructs the table structure based on the extracted visual feature, which requires extremely high positioning accuracy because if the predicted results of the object’s position are offset, even if they are very small, it will cause adhesion between adjacent elements. For instance, GTE [
9], TRACE [
8], LORE [
14] and GraphTSR [
15] are methods based on cell detection, while DeepTabStR [
16] is a method based on row-column detection. In addition, the segmentation-based method is actually pixel-level classification, which has a large amount of computation and consumes more resources. It specifically includes separator line-based methods such as SPLERGE [
17], RobustTabNet [
7], TSRFormer [
18], TRUST [
19], SEM [
20], and SEMv2 [
21], row-column-based methods such as DeepDeSRT [
1] and TableFCN [
22], and cell-based methods such as TGRNet [
23] and TabStructNet [
24]. The last method based on sequence prediction takes table images as input and outputs a table structure represented by a text markup language. It is the method least affected by the quality of table images among the three methods. Its main methods include VAST [
25], WSTabNet [
26], EDD [
27], MTLTabNet [
28] and TableMaster [
29].
Through the analysis and comparison of the above methods, this study believes that the row-column-based object detection method is the best solution. First, we choose the row-column-based method because visual features can be further divided into direct visual features and indirect visual features. The former includes features such as cells, separator lines, and text blocks, which often do not have structural prior features, so their missed detection will lead to serious errors in the table structure, while the latter includes row and column features, which have structural a priori features and are the first features that the human eye will notice when observing a table. They also have cell position alignment, structuring and other features. Therefore, we believe that rows and columns should be the best choice to describe cell features. Secondly, the method based on object detection is chosen because the row and column of the table are all rectangular structures, and the object detection method is better at locating the bounding box than segmentation. However, since this type of method has too high of a requirement for detection accuracy, even slight deviations in bounding boxes can cause them to stick together. At present, this type of method has not achieved the ideal effect and there is still room for improvement.
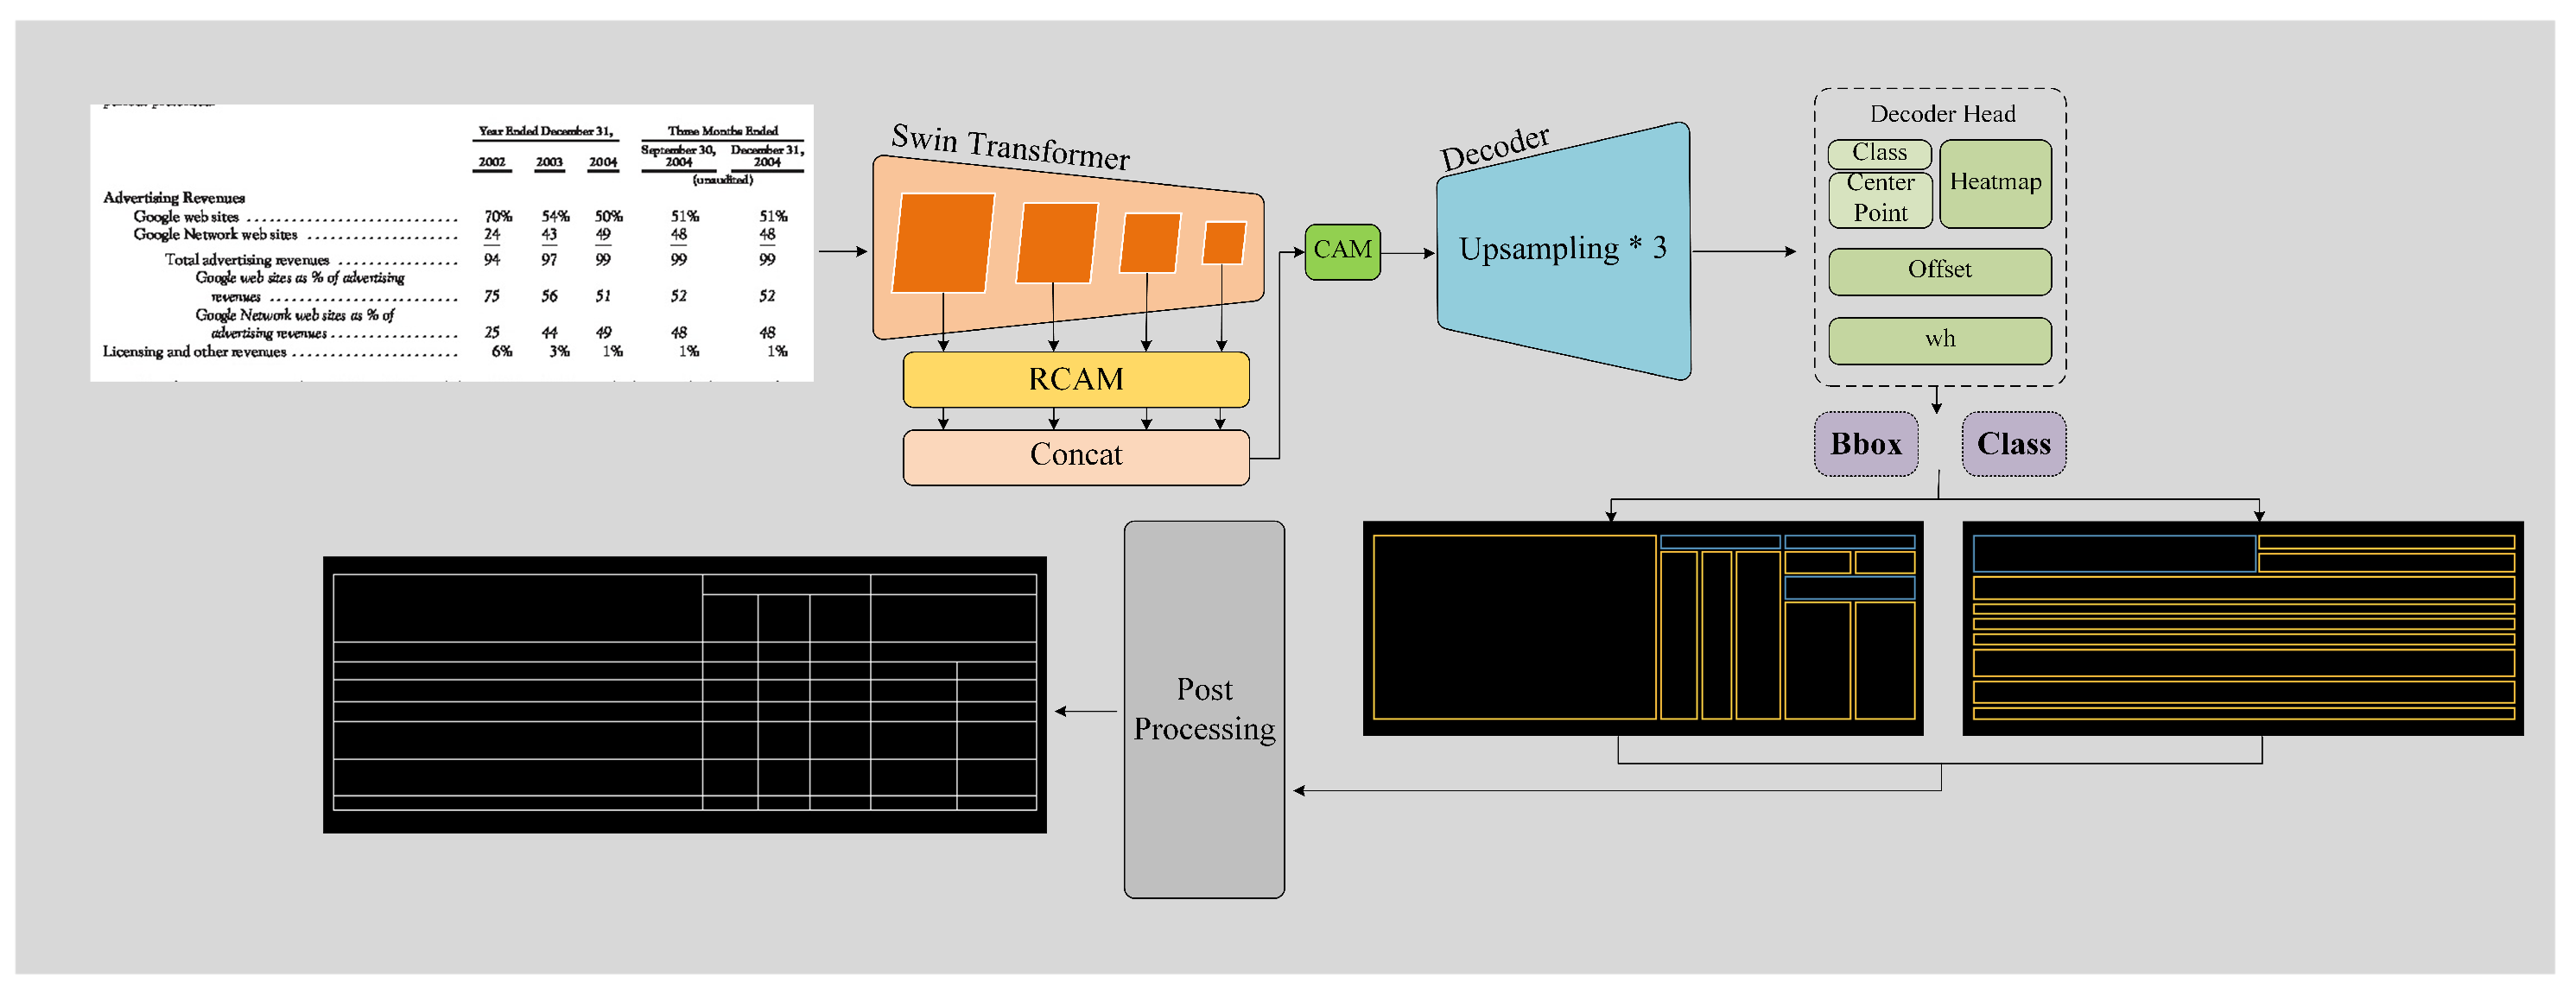
Based on the above analysis, this study proposes a new table structure recognition method based on row-column detection, TSRDet, which consists of two parts: SACNet (StripAttention-CenterNet) and post-processing. The former obtains the bounding boxes of rows and columns by improving CenterNet by combining hierarchical feature representation with a row-column attention mechanism. It is based on CenterNet, introduces Swin Transformer as the backbone, and then combines the proposed innovative module RCAM at multiple scales. The latter takes the intersection of the obtained row-column bounding boxes and corrects them to obtain the table structure.
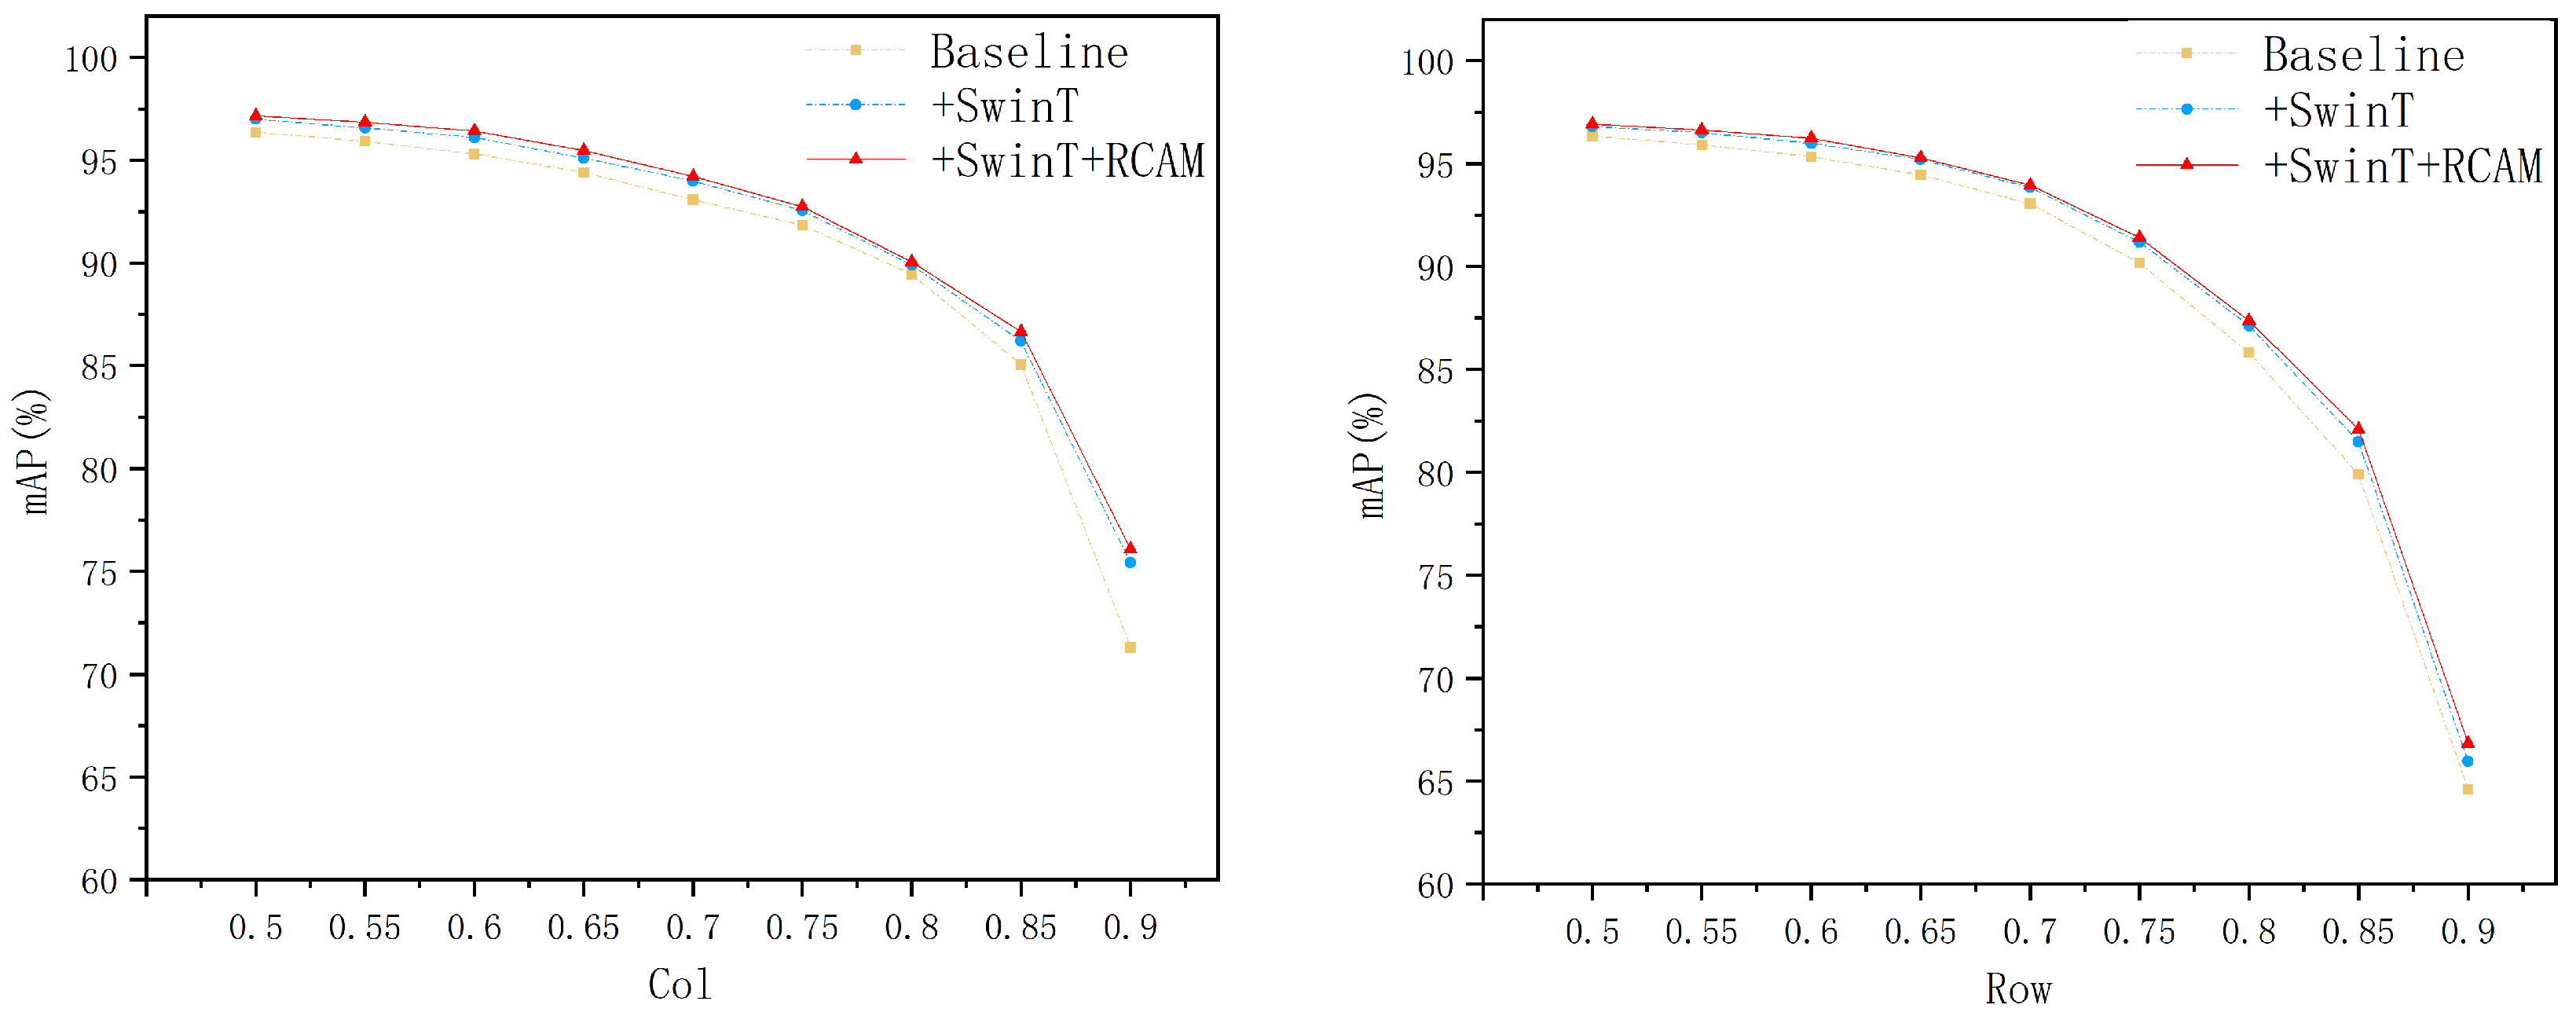
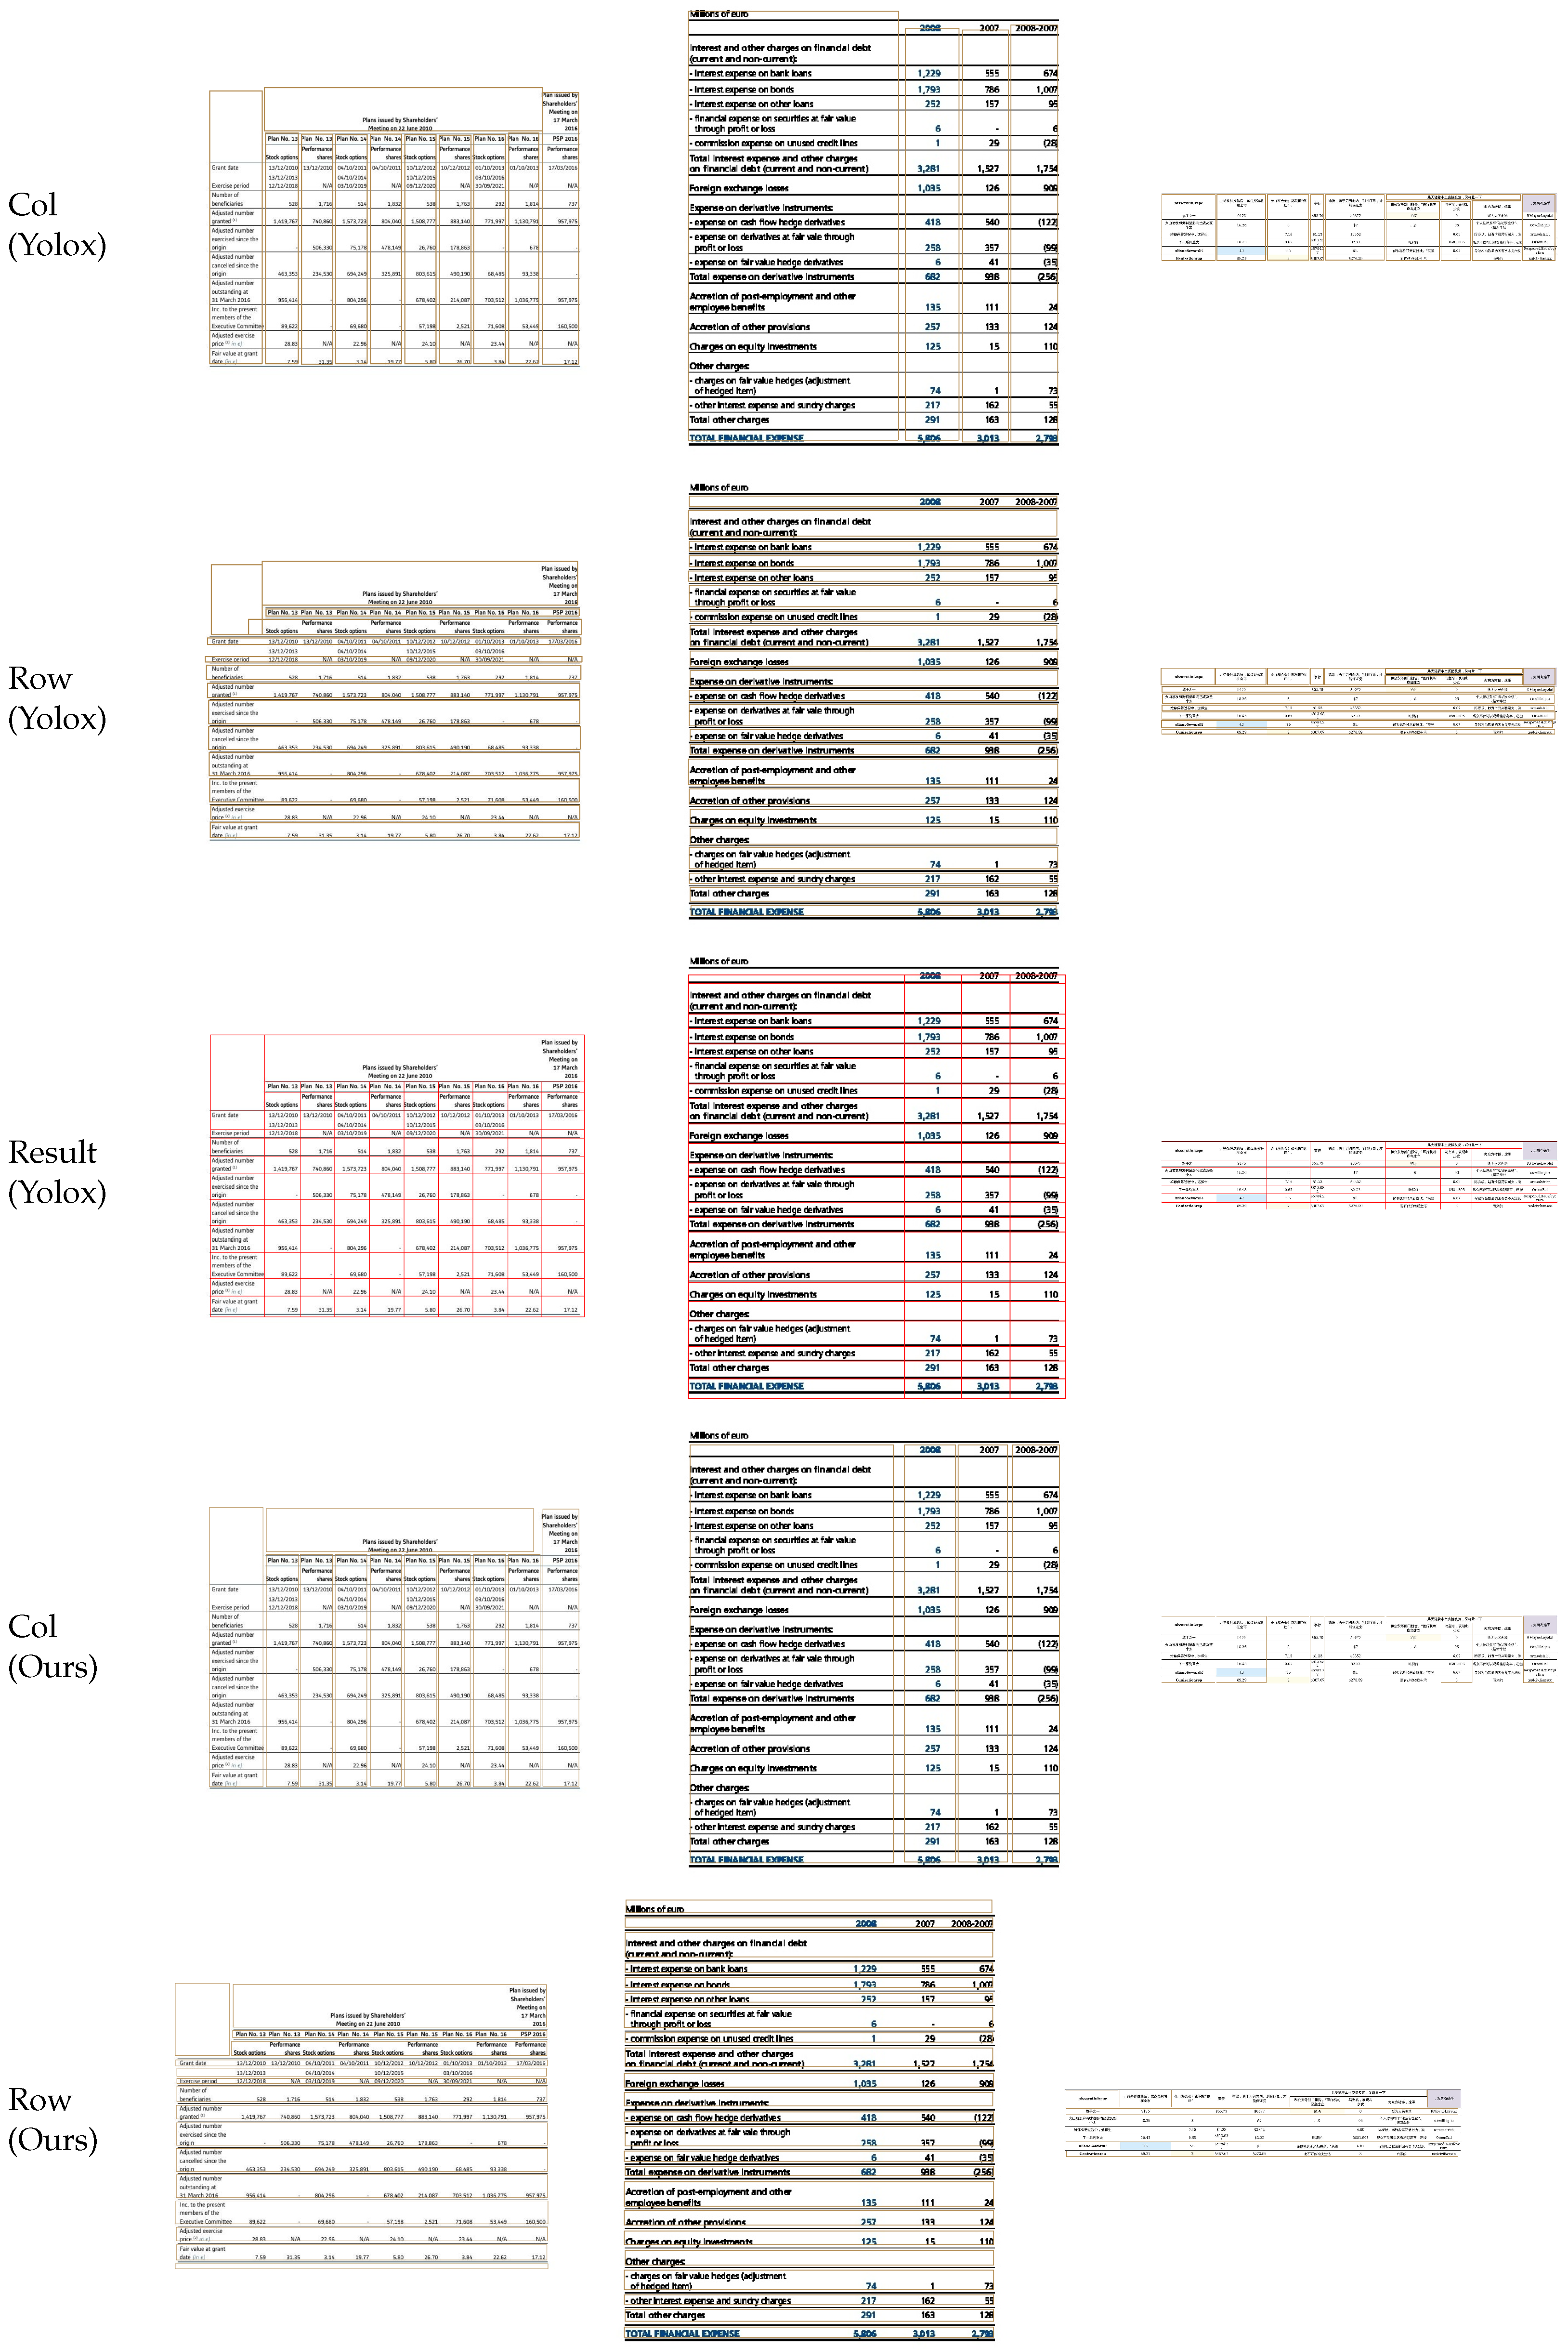
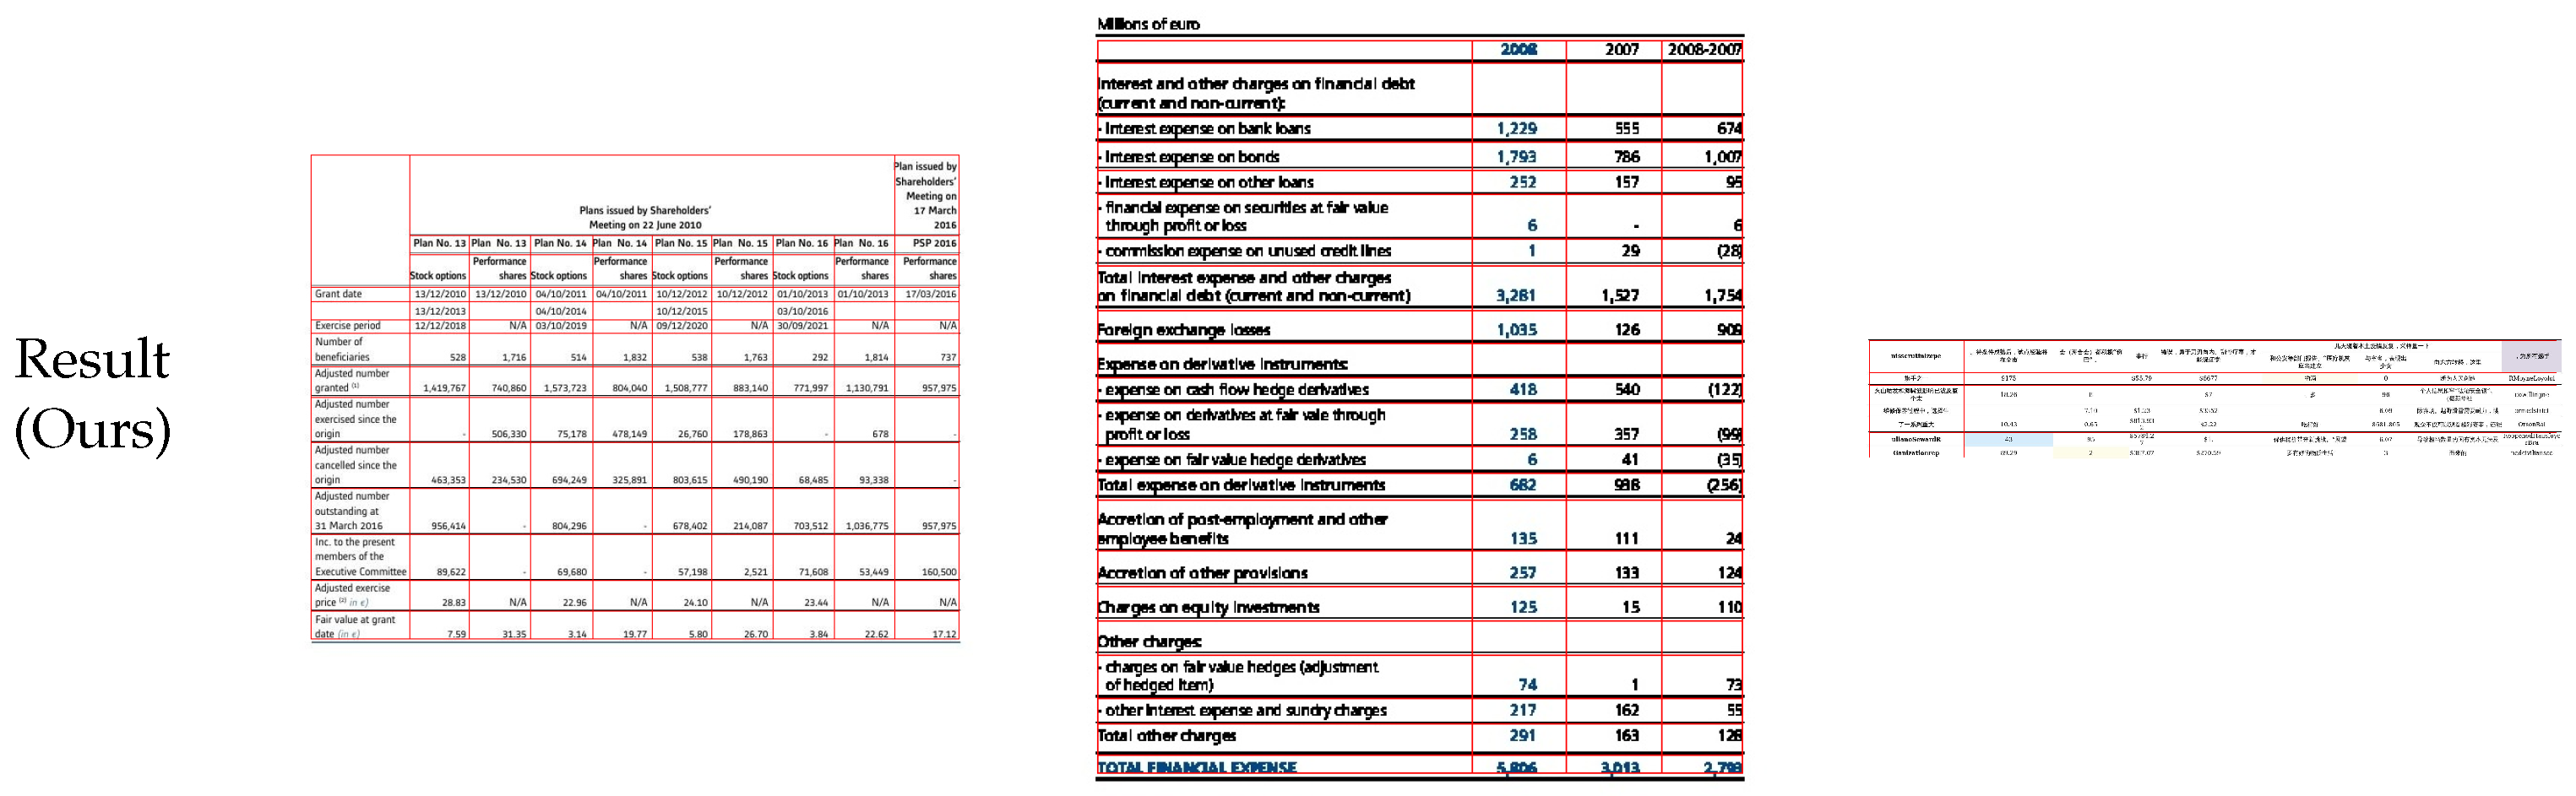
For the experimental results of row-column detection, this study uses the mAP value under different IoU thresholds for evaluation, while The IoU threshold is set from 0.5 to 0.9, and the value is taken every 0.05; for the experimental results of table structure recognition, this study uses TEDS-Struct and the IoU scores under different IoU thresholds for evaluation. The experimental results show that compared with existing methods, this method significantly improves the accuracy of row-column detection. In addition, it can effectively generate the correct table structure based on the detection results, thereby showing the ability to recognize the structure of various table types, with robust stability and good application prospects. In summary, the main contributions of this study can be summarized as follows:
We proposed a table structure recognition pipeline based on row and column detection. It consists of two parts: SACNet (StripAttention-CenterNet) and post-processing. The former adopts an improved CenterNet that combines hierarchical feature representation with row and column attention mechanism to detect row and column bounding boxes, while the latter intersects and corrects these bounding boxes to construct the table structure.
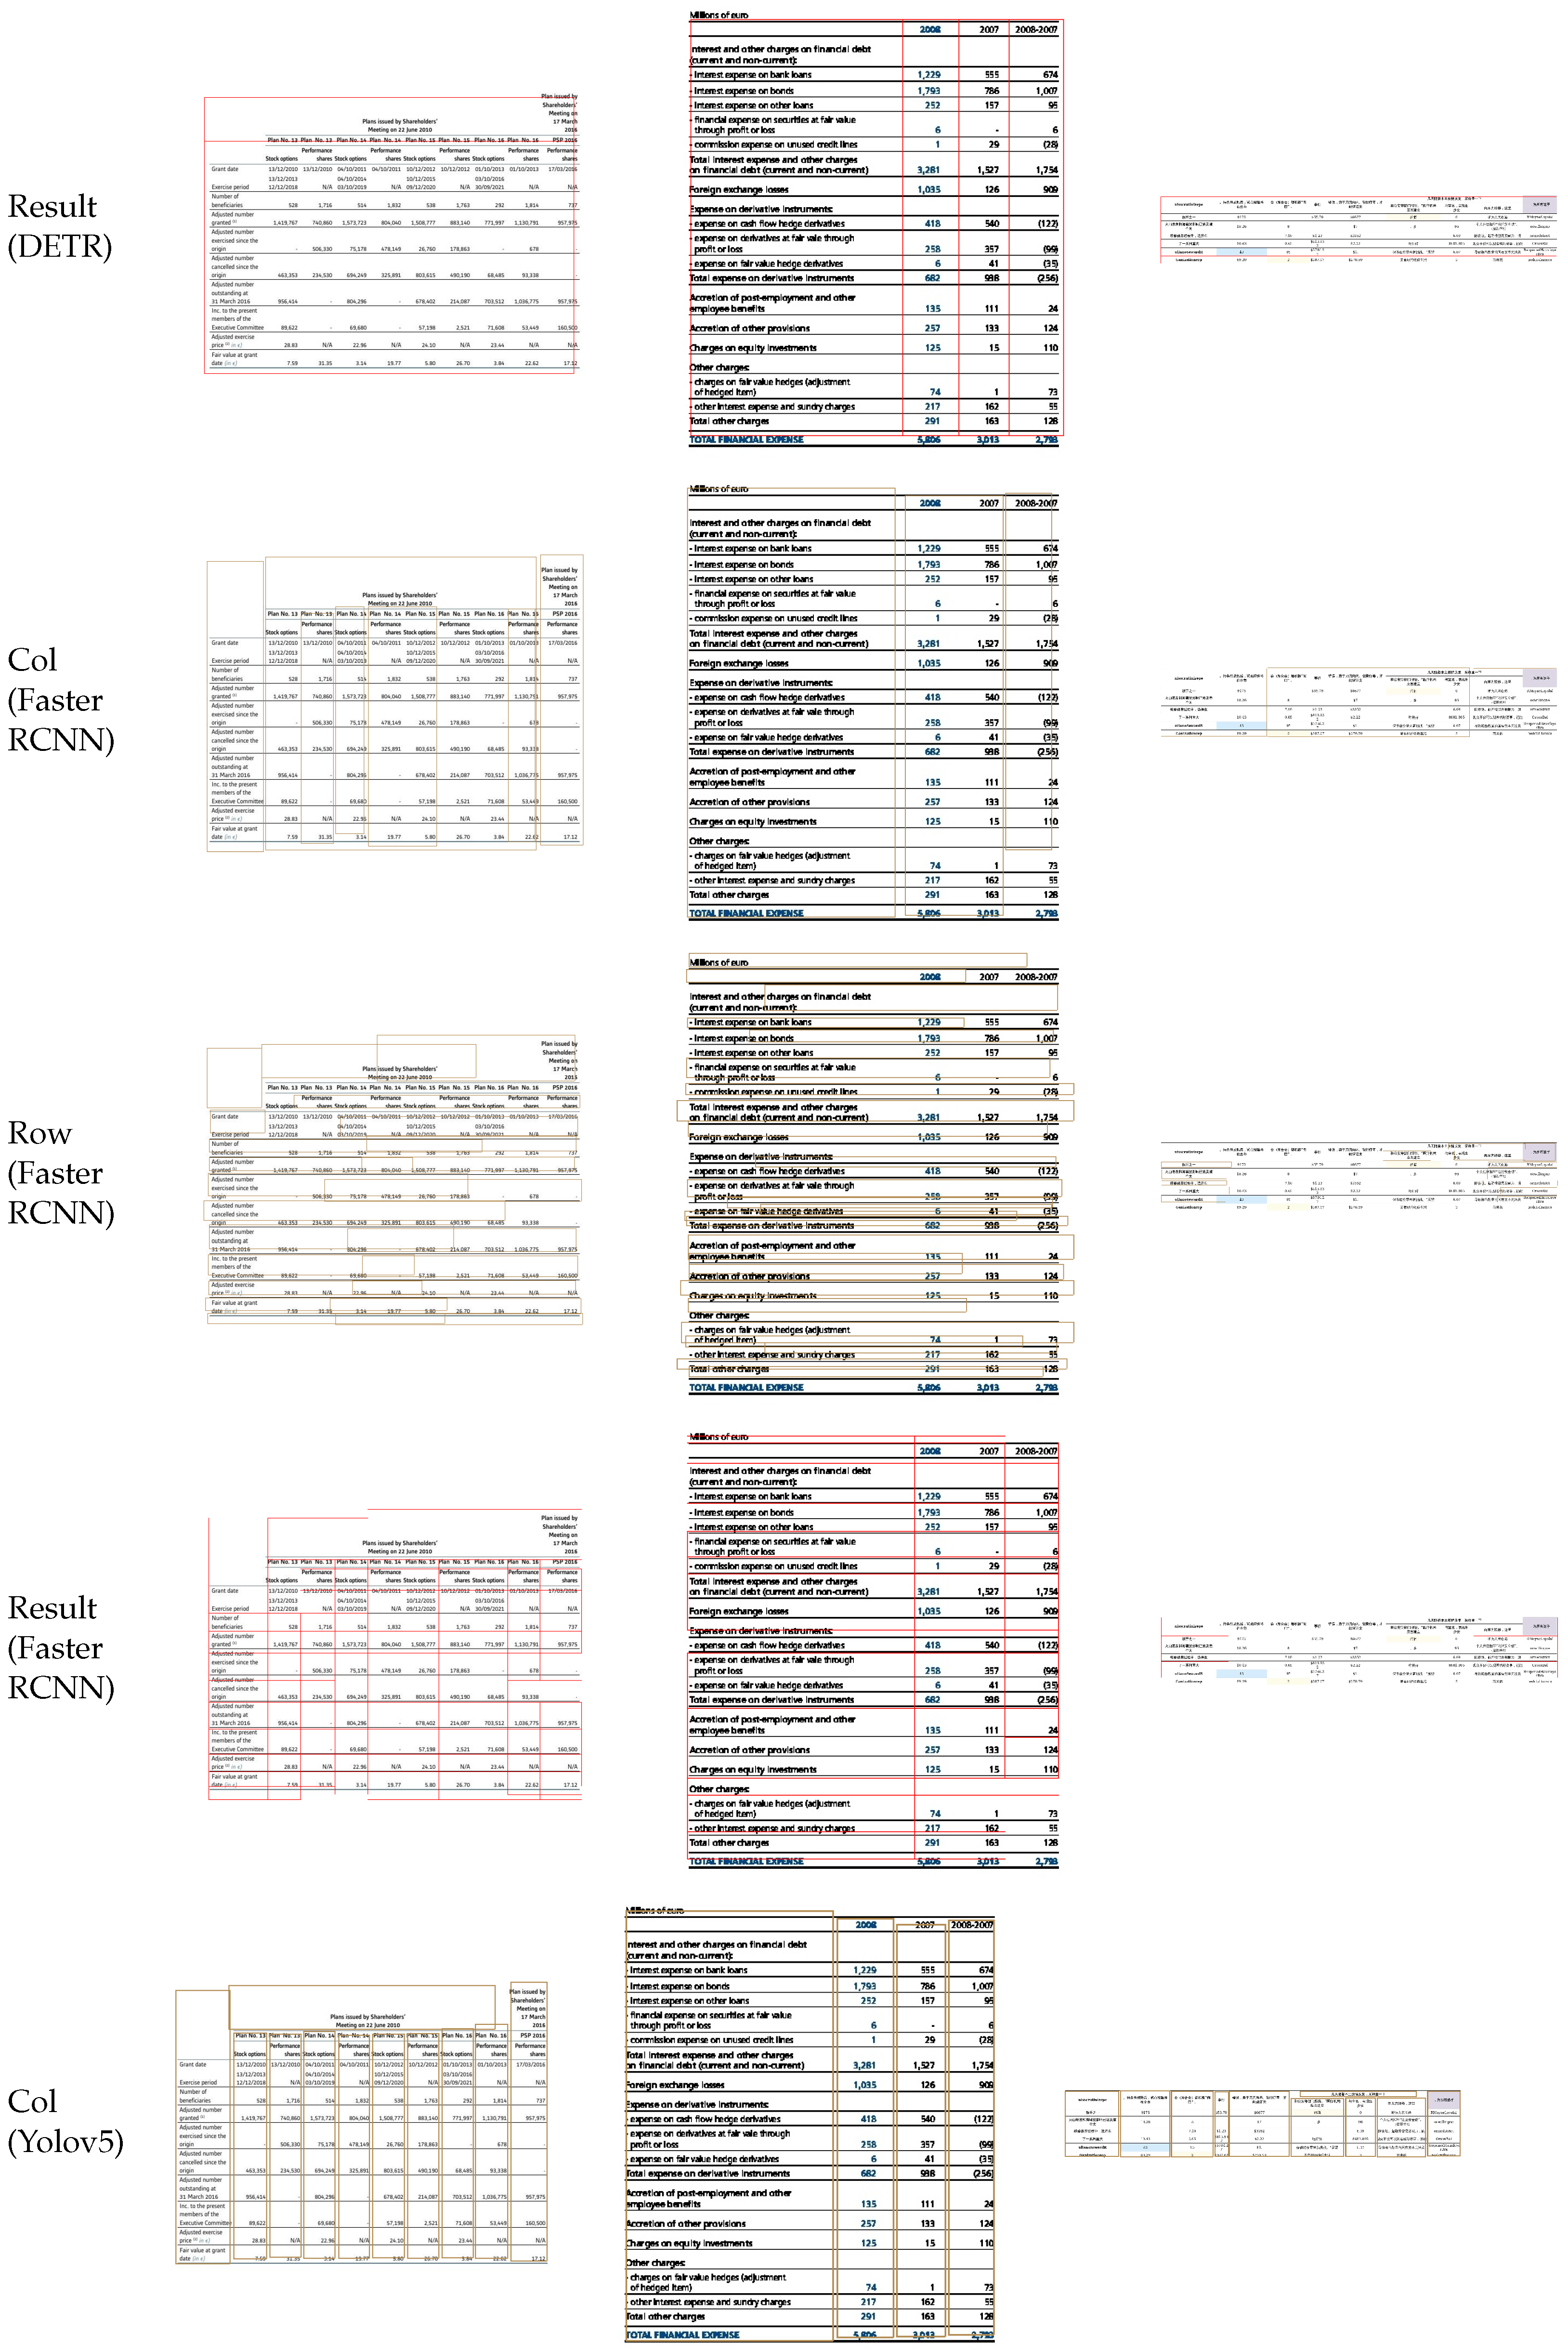
We compared the performance of existing object detection models on the row and column detection task and found that methods based on center point detection achieve higher localization accuracy and are more suitable for this task than anchor-based methods. This is attributed to the use of heatmaps in center point detection methods, which predict the centers of objects, reducing the likelihood of missing smaller objects, and eliminating the need for Non-Maximum Suppression (NMS), thereby speeding up detection.
We proposed a plug-and-play row-column attention module, denoted as RCAM, including a channel attention module and a row-column spatial attention module. This module improves the row-column detection accuracy by capturing long-range row-column feature maps in the image.
We proposed a novel row-column detection model named SACNet, derived from CenterNet, featuring Swin Transformer as its backbone. RCAM is combined at multiple scales in the encoder to improve the accuracy of row and column detection.
In the subsequent chapters of this article,
Section 2 briefly reviews the main methods of table structure recognition,
Section 3 elaborates on the specific details and structure of our proposed method TSRDet,
Section 4 introduces the experimental dataset, evaluation indicators and some equipment parameter information, and further describes three parts of experiments in detail in
Section 5. The first part explains the performance of our proposed method in the two experiments of row and column detection and table recognition, the second part conducts ablation experiments on our proposed method, and the third part also trains the selected comparison model and conducts evaluation of row and column detection and table structure recognition. Finally, in
Section 6, we summarize the effectiveness and contribution of the method proposed in this paper, and also point out the shortcomings, based on which we propose future work directions.
2. Related Works
In this chapter, we briefly review the main approaches to table structure recognition, which are divided into three categories, i.e., segmentation-based approaches, sequence prediction-based approaches, and detection-based approaches, each of which is represented as follows.
Segmentation-based Approaches. According to the different objects of segmentation, they are divided into separator lines-based and row-column-based. In the approach based on separator lines, Chris et al. proposed the split-merge model SPLERGE [
17], which initially forecasts the basic grid structure from input images and subsequently identifies which grids need to be merged to reconstruct cells across rows and columns, thereby achieving a comprehensive table structure. Zhang et al. designed SEM [
20] which decomposes the table structure recognition process into three stages. First, it conducts multilevel feature mapping utilizing ResNet34+FPN as the backbone. Next, it employs a splitter to predict the fine grid structure based on the backbone’s output. Finally, the merger combines the basic grid feature representations extracted by the embedder to derive the final grid structure. RobusTabNet [
7] proposed by Ma et al. utilizes a lighter backbone, ResNet18+FPN, compared with SEM. It integrates a spatial CNN-based separator line prediction module and a cell merging module to accurately predict and reconstruct the tabular structure. Lin et al. proposed TSRFormer [
18] by enhancing the RobusTabNet approach. While retaining RobusTabNet’s backbone unchanged, TSRFormer incorporates Spatial CNN after the backbone to augment feature representation. Subsequently, the predicted separator lines are extracted from the table image using SepRETR. Finally, the merged cells are reconstructed by integrating the output of ROI Align and Grid CNN to derive the table structure. In the approach based on row-column, Sebastian et al. proposed DeepDeSRT [
1], a method for extracting table structures based on the FCN-Xs [
30]. DeepDeSRT enhances FCN-8s by incorporating skip connections from the first and second layers, resulting in FCN-2s tailored for the completion of row-column segmentation tasks. Paliwal et al. proposed TableNet [
4], leveraging the interdependence between table detection and table structure tasks, it first segments the column regions, then conducts row regions extraction based on formulated segmentation rules derived from the identified table sub-regions. This method typically demonstrates good performance; however, its efficacy often hinges on image quality. Moreover, it does not directly acquire the table structure and necessitates intricate post-processing procedures. In the approach based on cells, TGRNet [
23] proposed by Xue et al., initially identifies the spatial positions of cells by extracting extensive feature maps, subsequently employing graph convolutional neural networks to ascertain their respective row and column coordinates; TabStructNet [
24] initially utilizes Mask RCNN to predict cell masks and subsequently computes the row-column adjacency matrix for these cells. In this matrix, cells that share the same row or column are assigned a value of 1, while all other relationships are designated a value of 0.
Sequence-based Approaches. This type of approach typically utilizes a “Single Encoder-Multi-Decoder” architecture to obtain a table structure represented by a text markup language. Due to the ability of this method to obtain table structures without post-processing and the resilience of text sequences to image distortion, many such methods have emerged in recent years. EDD [
27] is a single encoder dual decoder model that captures the visual features of input table images through an encoder. It then reconstructs the table structure and recognizes the content of cells through a structure decoder As and a cell decoder Ac, respectively, and finally obtains an HTML representation of the input table image. TableMaster [
29] also adopts a single encoder dual decoder architecture, where the encoder converts images into sequences and then encodes them. The dual decoders correspond to two learning tasks: regression of cell boxes and prediction of table structure sequences. They, respectively, output the positional coordinates of the cell boxes and sequences of table structures annotated with hypertext syntax rules. VAST [
25] follows a similar framework, extracting feature maps through a CNN image encoder, and then obtaining HTML sequences and bounding boxes of non-empty cells through an HTML sequence decoder. This information is sent to the coordinate sequence decoder, which decodes the position information of the unit cells in a sequence from top left to bottom right. MTLTabNet [
28] stands out from other methods by employing a single shared encoder and decoder to address three table recognition tasks through three decoders: Cell-box decoder, Cell content decoder and Structure decoder. These decoders predict cell positions, text content, and HTML structure tags, respectively. The cell texts are then integrated into the corresponding HTML tags to generate the final HTML code of the table image. While this method effectively identifies table structures directly, its efficacy heavily depends on the volume of trainable data, particularly for text recognition. Recognition results are further constrained by sequence length and tag numbers, leading to unsatisfactory accuracy. Additionally, this method frequently struggles to accurately pinpoint cell locations.
Detection-based Approaches. In general, these methods can be categorized into two groups: cell-based and row-column based. The former entails generating a table structure by predicting cell positions and their logical relationships. Chi et al. proposed an approach where they initially extract the content and bounding boxes of cells directly from PDF documents through preprocessing. Subsequently, they construct the table as an undirected graph based on these cells and utilize their proposed GraphTSR [
15] for predicting cell relationships. This method is further enhanced with post-processing to restore the table structure. GTE [
9] eliminates the need for post-processing by incorporating a dedicated GTE-Cell unit for cell detection. The model classifies table images by detecting six graphical table lines and feeds them into a cell detection network. Subsequently, it employs post-processing techniques to correct anomalies in the detections. Notably, GTE-Cell relies on the table boundaries provided by GTE-Table to generate specific cell structures for each table. LORE [
14], redefines the task of identifying cell spatial positions by prioritizing the identification of the center point of each cell. It achieves this through a combination of cell center point recognition and coordinate regression, enabling LORE to extract the corner coordinates of cells. The model utilizes a CNN backbone to extract visual features from table cells and employs two regression heads to predict their spatial and logical locations. The fundamental concept of row-column detection is to construct a table structure by predicting the positions of rows and columns. DeepTabStR [
16], leveraging deformable convolution, is built upon Faster RCNN and ResNet101. It begins by generating candidate object boxes via RPN, classifies these boxes using ROI Pooling and Classifier layers, and ultimately derives a table structure by intersecting the classified row and column regions. Overall, these approaches rely on visual features and typically exhibit superior performance and faster inference compared to segmentation-based approaches. However, they demand higher detection accuracy concerning cells and rows. Even minor offsets can lead to issues such as sticking or overlapping, posing challenges and limitations, particularly in intricate table structures.
Among the prevailing methods for table structure recognition, those based on object detection are widely utilized. However, techniques focusing specifically on row-column detection remain notably scarce. Recognizing that rows and columns, as basic elements of tables, implicitly combine the structural properties and alignment properties of cells, this study proposes a new method centered on row-column detection. The details of this method are elaborated in
Section 3.
3. Methods
In this chapter, we elucidate the specifics of our proposed method, named TSRDet, consisting of two primary components: SACNet (a novel row-column detection model) and the corresponding post-processing. Initially, in
Section 3.1, we comprehensively outline the design blueprint of SACNet, CenterNet. Subsequently, in
Section 3.2, in order to improve the model’s local grasp of more global row-column information, we delve into the more powerful encoder Swin Transformer with a hierarchical structure. Following this, in
Section 3.3, to further enhance the model’s perception of row and column information, we propose the RCAM, which consists of a channel attention module and a row-column spatial attention module, which is a pivotal highlight of our proposed method. We then present SACNet’s architecture. Finally, in
Section 3.4, we introduce the post-processing for generating table structures. The overall process of the proposed method is illustrated in
Figure 1.
3.1. CenterNet
CenterNet [
31], proposed by Zhou et al. in 2019, is an anchor-free object detection method that diverges from the conventional anchor-based methods utilized in popular methods such as Faster R-CNN [
32], SSD [
33], and the YOLO series [
34]. These traditional methods typically rely on a multitude of anchors to achieve a high Intersection Over Union (IoU) with ground truth, requiring manually designed anchor boxes of specific sizes and aspect ratios.
Differing from the aforementioned methods, CenterNet performs object detection by predicting the centers, widths, and heights of objects, without the need for non-maximum suppression (NMS). This approach achieves an average detection precision of 45.1% on the MS COCO dataset [
35], while maintaining a high frame rate. In terms of model architecture, the model comprises three main components: an encoder for extracting visual feature maps, a high-resolution decoder that generates expanded feature maps at an 8x resolution, and a final segment containing three detection heads that predict different types of information. The first head is responsible for predicting the categories and centers of objects, the second predicts the widths and heights of objects corresponding to their centers, and the third predicts offsets of the center points. By decoding the outputs from CenterNet according to specific rules, the categories and locations of the predicted objects can be determined. CenterNet discussed is illustrated in
Figure 2. The key characteristics of this model are summarized as follows:
First, CenterNet introduces an object detection method based on a single central point. Traditional anchor-based detection methods require pre-defining a large number of potential bounding box sizes and ratios, which not only increases the computational burden but also adds to the model’s complexity. Meanwhile, other keypoint estimation-based object detection methods, such as CornerNet [
36] and ExtremeNet [
37], set two bounding box corners and the extremities (top, bottom, left, right, and center) of all objects as keypoints, respectively. This necessitates grouping and post-processing after detection. In contrast, CenterNet simplifies the process and reduces computational overhead by directly predicting the center points and dimensions (width and height) of objects, thereby enhancing efficiency.
Secondly, CenterNet employs keypoint heatmaps to denote the probable center points of objects. Each pixel in the heatmap represents the likelihood of that pixel being the object’s center, thereby facilitating precise object localization. Mathematically, if
denotes the coordinates of an object’s center point, then the value
y at any point
on the heatmap is given by Equation (
1):
Here, represents the standard deviation, which scales with the object’s size, modulating the spatial spread of the heatmap peak centered at . This formulation allows for a more precise localization of the center points, particularly for objects of varying sizes. The adaptive standard deviation, , ensures that the spatial resolution of the heatmap peak is proportional to the object’s dimensions, thereby enhancing accuracy in center point detection across diverse object scales.
3.2. Swin Transformer
The migration of Transformers from NLP (Natural Language Processing) to the field of computer vision faces two main challenges. First, the scale of entities involved in the two domains differs; in NLP, the scale of entities is standardized and fixed, while in CV (Computer Vision), the scale of entities varies significantly. Second, CV requires a higher resolution than NLP, and the computational complexity of using Transformers in CV is proportional to the square of the image size, leading to excessively large computational demands.
In 2021, Liu et al. proposed an innovative visual Transformer architecture known as Swin Transformer [
38], designed to enhance the efficiency and accuracy of image recognition tasks by constructing a hierarchical Transformer network. To address the aforementioned challenges, the Swin Transformer gradually merges image patches to construct a hierarchical Transformer as the network depth increases, making it a versatile visual backbone network suitable for tasks such as object detection. It adopts a hierarchical building approach commonly used in convolutional neural networks and introduces the concept of locality, performing self-attention calculations within non-overlapping windows. This approach ensures that the computational complexity is linearly proportional to the input image size, thereby improving efficiency. Additionally, it enables the model to capture broader contextual information while maintaining locality over larger regions, which is highly suitable for row-column detection tasks. The overall structure of the model is shown in
Figure 3. The key features of the model are summarized as follows:
Hierarchical Transformer Network. The Swin Transformer constructs a hierarchical network that processes images at multiple scales, enhancing the model’s ability to handle various object sizes and improving its applicability to different vision tasks. This hierarchical approach, inspired by the pyramidal structure common in convolutional neural networks, progressively merges adjacent patches to form feature maps at reduced resolutions, allowing for efficient high-resolution image processing.
Window self-attention mechanism. The Swin Transformer significantly reduces computational complexity by confining self-attention computations to fixed-size windows. Specifically, with a window size of , the complexity of self-attention decreases from to , where N represents the number of pixels in the image. Compared to traditional Transformer models, this method not only lowers computational complexity but also enhances the model’s focus on local features by restricting the attention scope to local areas. Additionally, this window-based approach maintains computational efficiency by reducing the number of pixel pairs involved in the attention calculation.
Shifted Window Strategy. To maintain the efficiency of local window calculations while introducing cross-window information exchange, the Swin Transformer employs a shifted window mechanism. By alternating the partitioning of windows between successive Transformer layers, the Swin Transformer facilitates cross-window self-attention computation. This strategy enables the model to capture broader contextual information, maintaining locality over larger regions, while also avoiding the complexity of global attention calculations.
Enhanced Performance on Standard Benchmarks. The Swin Transformer sets new state-of-the-art performance benchmarks on several key datasets:
Image Classification on ImageNet-1K: Achieved a top-1 accuracy of 87.3%, which is a notable improvement over previous models.
Semantic Segmentation on ADE20K: Demonstrated a box Average Precision (AP) of 58.7 and a mask AP of 51.1, surpassing prior state-of-the-art models by margins of +2.7 box AP and +2.6 mask AP, respectively.
Object Detection and Instance Segmentation on COCO: Recorded a mean Intersection-Over-Union (mIoU) of 53.5, which is an improvement of +3.2 mIoU over the best previous results.
3.3. RCAM
According to the experimental outcomes presented by Sanghyun et al. [
39], the synergy between channel attention and spatial attention mechanisms demonstrably amplifies the performance of convolutional neural networks in detection tasks. More crucially, this synergy enables more precise object localization through an enhanced attention distribution, effectively reducing the influence of extraneous elements. Recognizing the critical importance of row and column information within feature maps for precise detection tasks, we introduce the Row-Column Attention Module (RCAM). This module comprises two components: the Row-Column Spatial Attention Module (RCSAM) and the Channel Attention Module (CAM), detailed in
Section 3.3.1 and
Section 3.3.2, respectively. Furthermore, a comprehensive exposition of the SACNet’s architecture is thoroughly provided in
Section 3.3.3.
3.3.1. CAM
Channel Attention Module (CAM), a channel-based attention mechanism introduced by Sanghyun et al. [
39] in 2018, enhances the inter-channel relationship of features within convolutional neural networks. CAM operates by assessing the significance of different feature maps across channels, and is designed to be a plug-and-play component that can seamlessly integrate with existing network architectures, as depicted in
Figure 4.
According to the above,
Figure 4 shows the processing of CAM. Specifically, Given an input feature map
, the process begins with the application of global MaxPooling and AveragePooling across the channels to produce two separate context vectors. These vectors are then fed into a shared multi-layer perceptron (MLP) with a hidden layer configured as (
, 1, 1), where
r is the reduction ratio aiming to minimize parameter overhead while maintaining performance. This MLP outputs two Channel Attention Vectors, which are combined using element-wise summation followed by a sigmoid activation to produce the final channel attention map
, which can be calculated by Equation (
2):
This attention map is then element-wise multiplied with the original feature map F to yield a refined feature map, emphasizing informative features while suppressing less useful data.
3.3.2. RCSAM
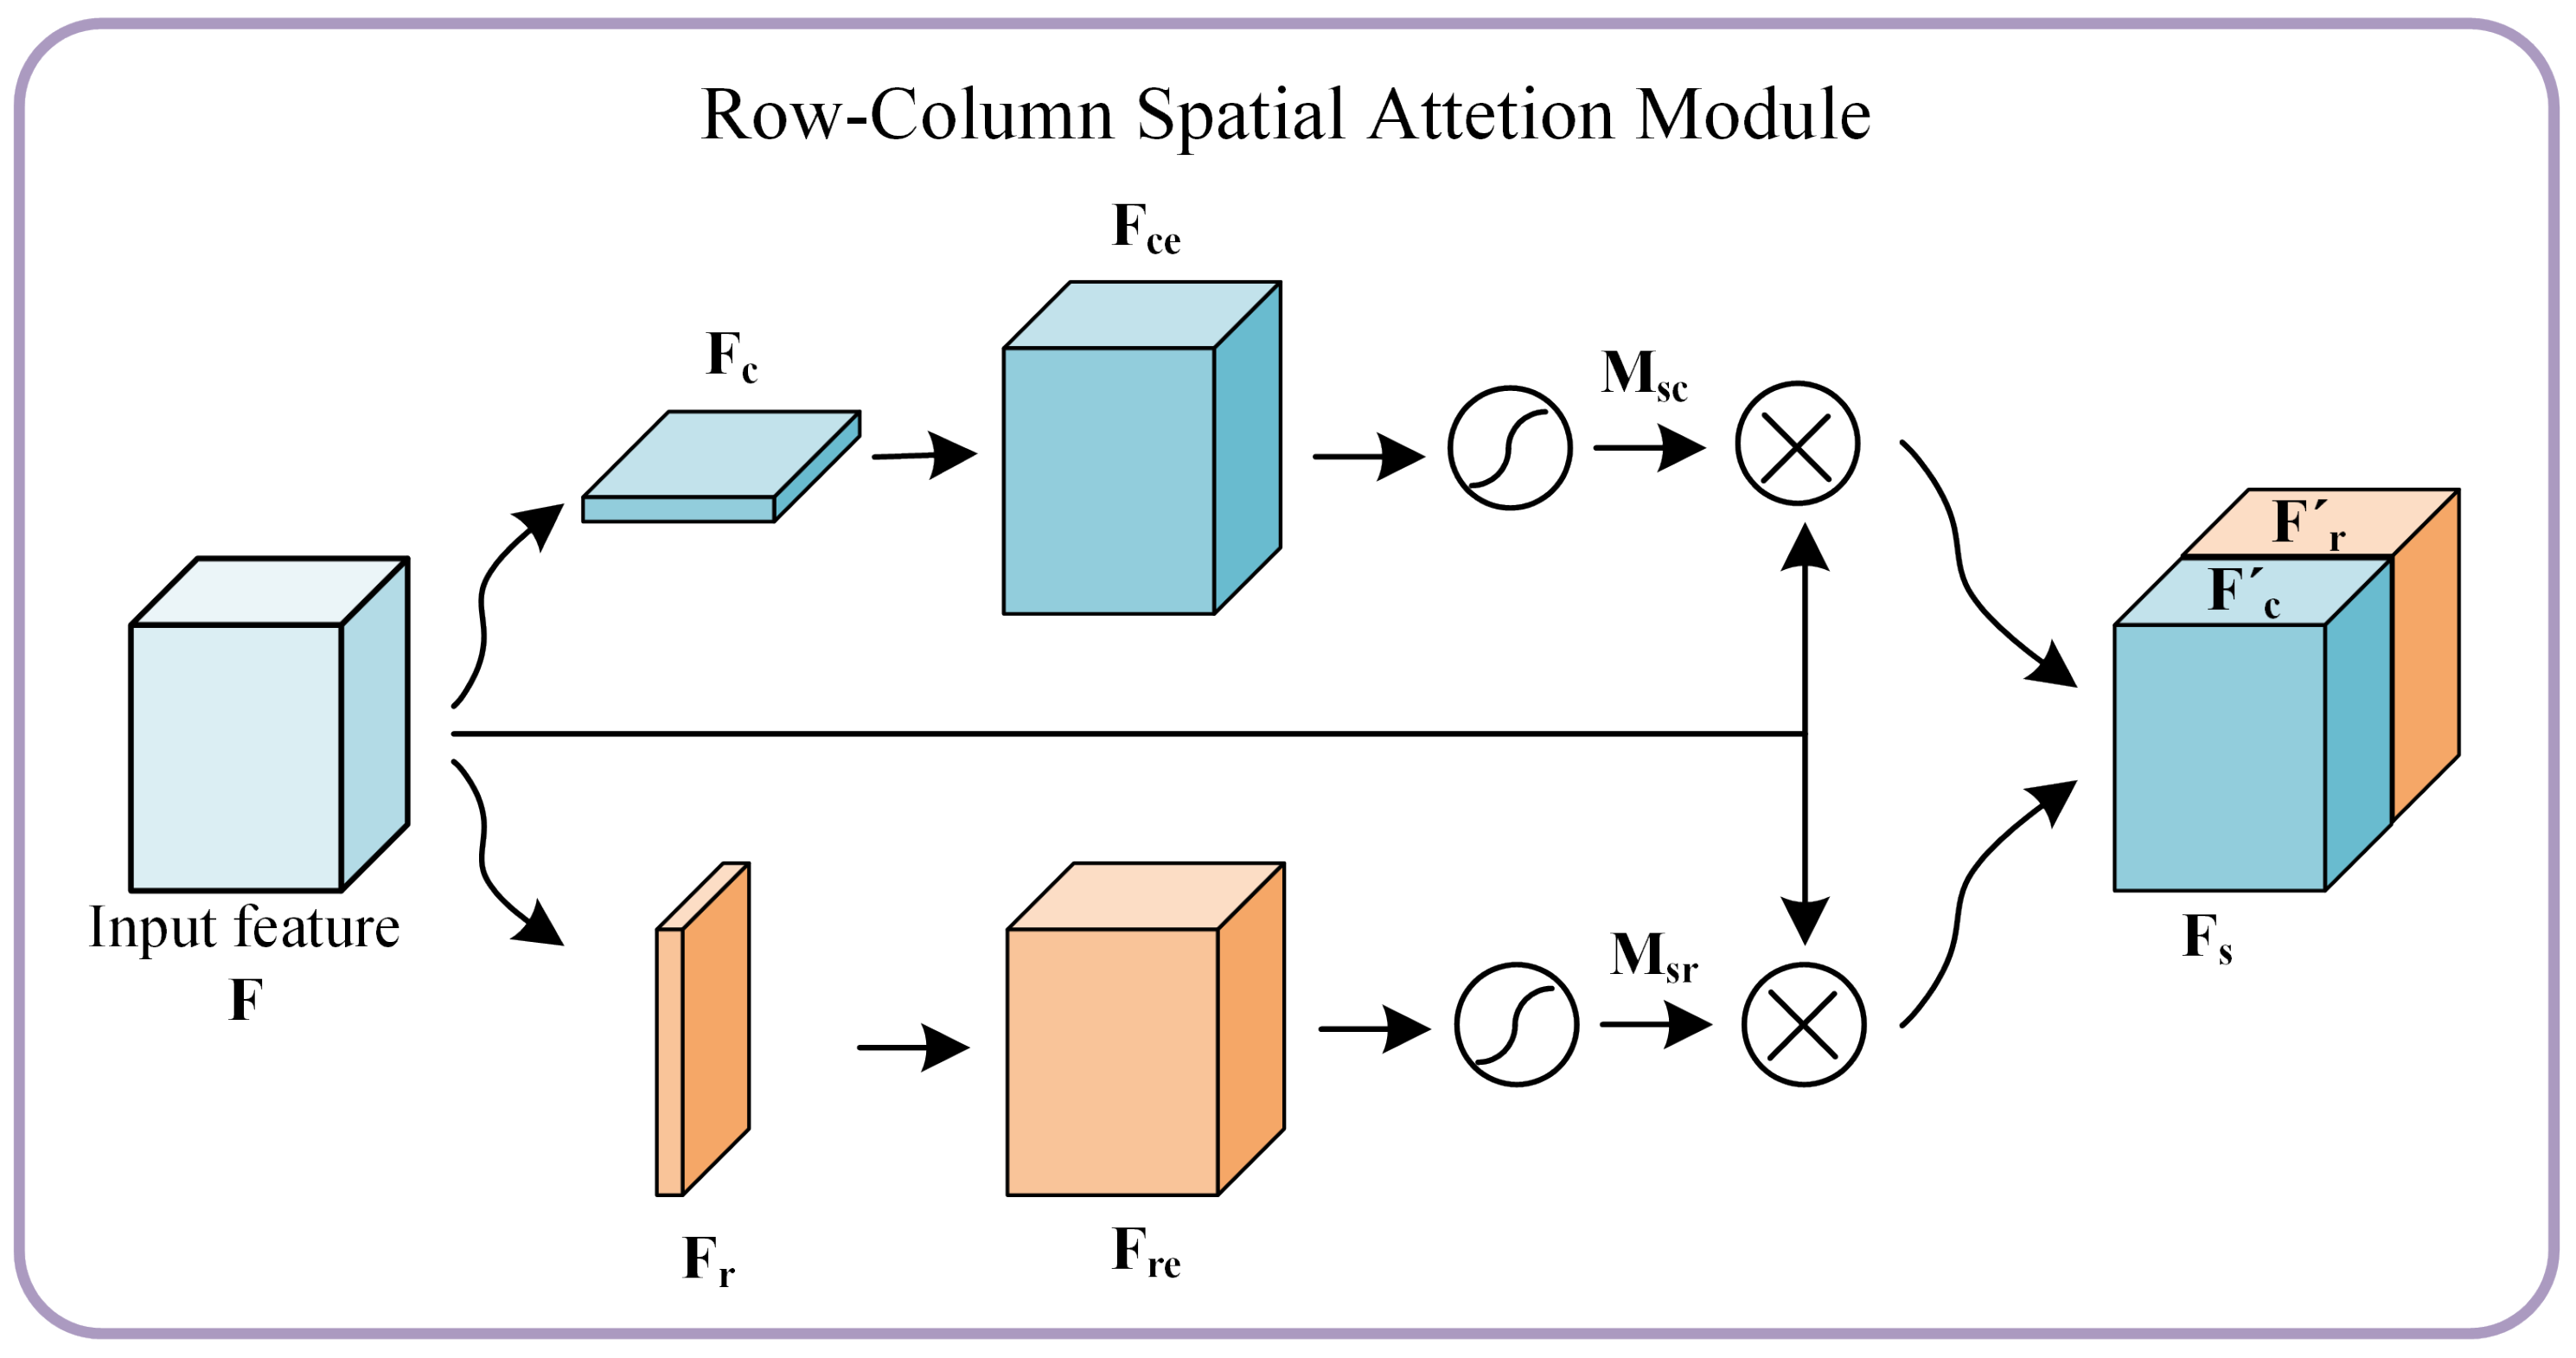
The Row-Column Spatial Attention Module (RCSAM) proposed herein is an innovative architecture designed to enhance specific features within rows and columns of a feature map.
Figure 5 illustrates the structure of RCSAM, which encompasses an input feature map, attention generation, feature recalibration, and fusion operations. The process is detailed as follows:
Input Feature Map: Let the input feature map be denoted as , where C, H, and W represent the number of channels, height, and width, respectively.
Feature Aggregation: Initially, the input feature map is globally aggregated along the vertical and horizontal directions using average pooling, extracting two distinct feature representations. The vertical aggregation generates a matrix , representing the average features for each channel along the row dimension. Similarly, horizontal aggregation produces a matrix , representing the average features for each channel along the column dimension.
Feature Restoration: To restore the aggregated feature matrices to the same resolution as the input feature map, 1D convolution is applied to both and :
For , a 1D convolution is applied along the column dimension, capturing row-wise features and restoring the matrix to shape , resulting in the restored matrix .
For , a 1D convolution is applied along the column dimension, capturing row-wise features and restoring the matrix to shape , resulting in the restored matrix .
Activation and Normalization: The restored matrices and are then passed through a Sigmoid activation function, producing the normalized attention weight maps and . Here, represents the attention weights along the column dimension, while represents the attention weights along the row dimension.
Feature Recalibration: The attention maps and are applied to the original input feature map F by element-wise multiplication, resulting in recalibrated feature maps and . This step selectively enhances or diminishes features based on their importance.
Fusion Operation: The recalibrated feature maps and are concatenated along the channel dimension to produce the final output , which combines the attributes of both attention mechanisms.
3.3.3. SACNet
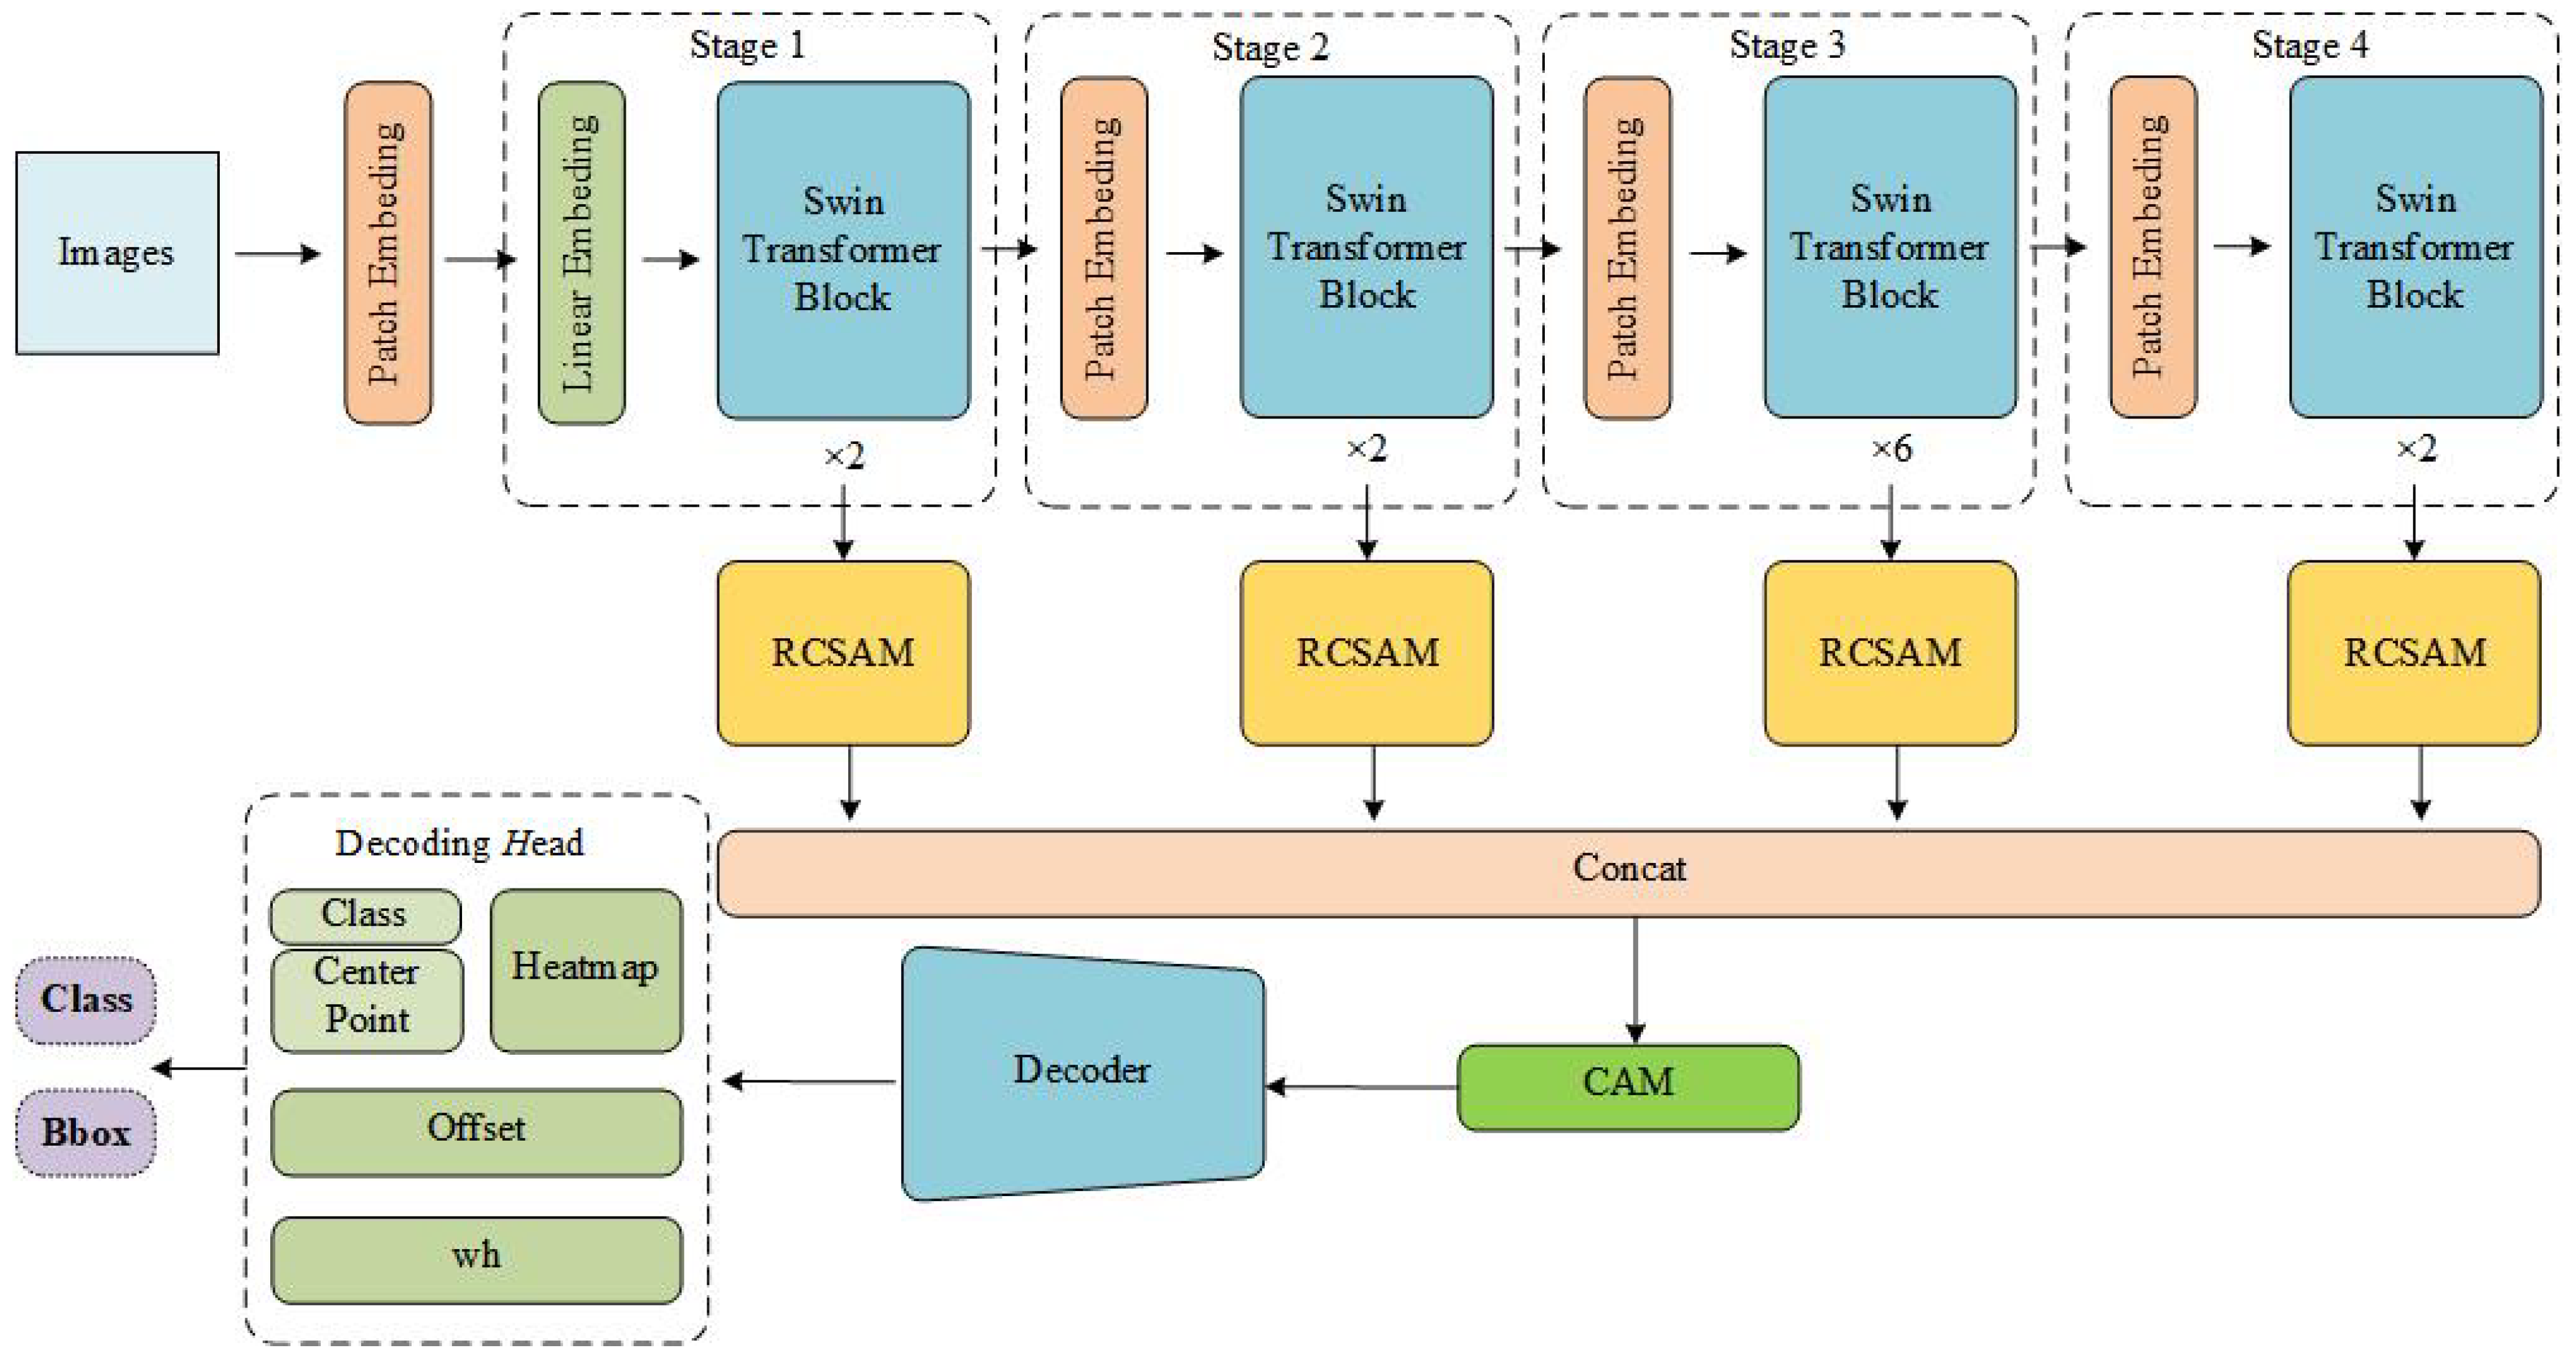
The structure of SACNet proposed in this study is shown in
Figure 6. It consists of an encoder, a decoder, and detection heads. The encoder is based on the Swin Transformer and includes four stages, each containing 2, 2, 6, and 2 Swin Transformer blocks, respectively. The output channel numbers for each stage are C, 2C, 4C, and 8C. While the spatial dimensions of the input features remain unchanged in the first stage, they are reduced by half with each subsequent stage.
Additionally, after the output of each stage in the Swin Transformer, we integrate the RCSAM module proposed in this study. The parallel outputs of the four RCSAM modules are concatenated and passed through a CAM module before being sent to the decoder. The decoder and detection heads retain the design of CenterNet. The decoder consists of three serial deconvolution layers, which double the spatial dimensions of the feature maps while reducing the number of channels. The channel numbers are fixed and sequentially decrease from the initial input to 256, 128, and 64.
Finally, SACNet outputs a heat map through three detection heads, including the objects’ categories, center point coordinates, width and height, and the offsets of the center point. With this information, the bounding box of the object can be accurately determined.
3.4. Post-Processing
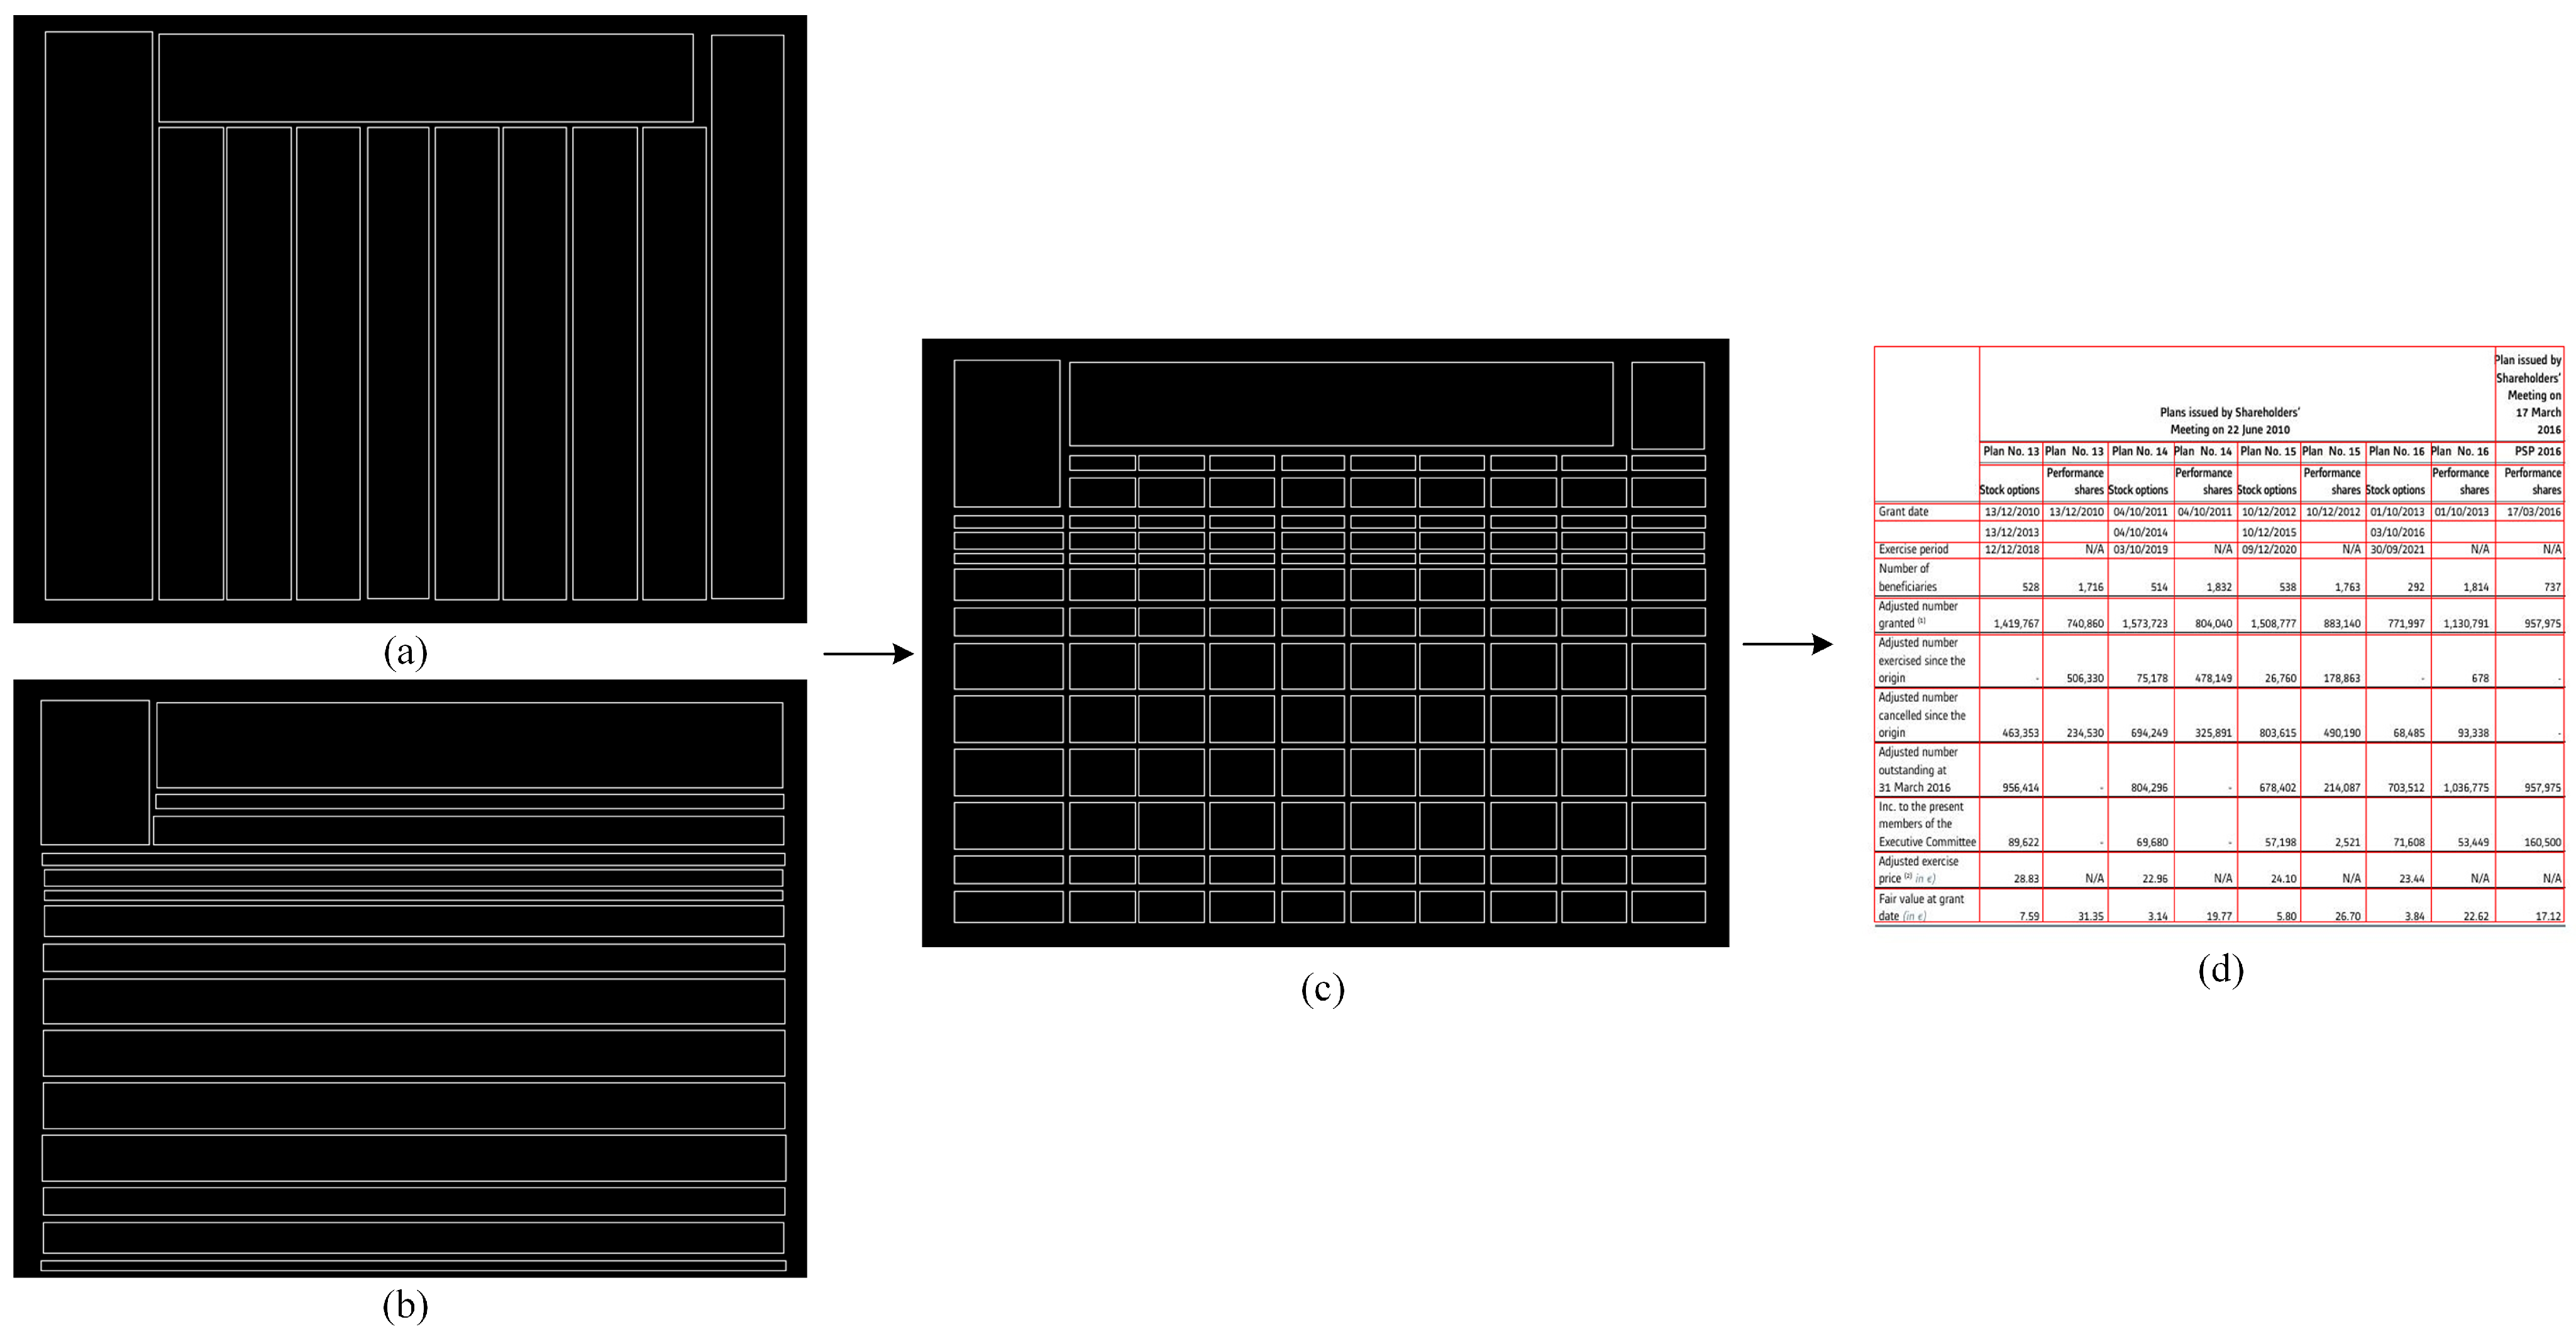
Based on the above, we know that SACNet can only predict row and column bounding boxes in table images. Therefore, the objective of this section is to introduce a post-processing algorithm that utilizes image-processing techniques to derive the table structure from these bounding boxes. The specific steps are as follows:
First, we obtain the cells by performing intersection operations on the rows and columns. At this stage, the cells may appear irregular, such as misalignments and offsets within the same row or column, as shown in
Figure 7. This can result in incorrect row and column position calculations. To address this issue, we apply a position adjustment operation to correct the cells and obtain a standardized table structure. Specifically, the position adjustment operation involves performing one erosion and dilation operation on the horizontal and vertical lines using convolution kernels of size
and
, respectively, where cols and rows are the width and height of the image, and
is set to 5, thereby aligning the row and column positions. The flowchart of the post-processing algorithm is shown in
Figure 7.
6. Discussion
This paper introduces TSRDet, a groundbreaking method for table structure recognition that leverages the capabilities of SACNet for detecting rows and columns, coupled with subsequent post-processing to elucidate the table structure. Notably, TSRDet employs the Swin Transformer and an innovative RCAM as encoders to enhance detection precision, effectively navigating the complexity and variability inherent in table structures. This methodology is particularly adept at capturing detailed and expansive feature maps, markedly boosting the accuracy of row and column detection. Experimental validation confirms TSRDet’s superior performance, achieving a mean average precision (mAP) exceeding 91% at a stringent IoU threshold of 0.75. Moreover, TSRDet surpasses existing object detection models with a TEDS-Struct score of 95.7%, underscoring its competitive edge in table structure recognition. Overall, TSRDet significantly advances the field of image-based table recognition, offering a robust and precise solution for decoding complex table structures.
In addition, since the dataset used in this paper is a table image containing complex tables, such as tables with merged cells, missing lines, and wireless tables, it does not include table images with distortion and environmental factors, such as distorted tables and table images with different lighting, nor does it include images with multiple tables or multiple types of elements. This limits the application scenarios of TSRDet so that it can only process tables with complex structures but not images with too many interference factors and can only complete efficient and accurate table structure recognition after table area detection. Based on the current shortcomings, future work can be divided into the following three points:
Further design and adaptation of methods can be conducted for distorted tables.
More new table structure recognition methods can be studied, and efficient and useful modules can be used to further improve the universality and robustness of the method.
Large language models can be used to further implement tasks such as fact verification and question answering of tables.


