1. Introduction
In recent years, the increasing popularity of self-service technologies (SSTs) has transformed various service industries, including cinemas. Their use enabled customers to perform tasks independently without direct employee involvement [
1]. Initially, the most significant advantage of SSTs was cost reduction. However, in sectors such as cinemas, SSTs now offer more than financial benefits since they enhance customer convenience, streamline operations, and contribute to an overall improved user experience. For example, self-service ticket machines, online booking systems, automated kiosks for food and drinks, and even digital loyalty programs have revolutionized how cinemagoers interact with cinema services [
2]. The integration of these systems into the cinemagoing experience is intended to reduce wait times, offer greater flexibility in purchasing decisions, and allow consumers more control over their interaction with the service environment.
Despite these benefits, successful SST implementation is not guaranteed as it depends on customer acceptance. Factors such as ease of use, perceived control, situational factors, and the availability of alternatives play an important role in whether cinemagoers embrace these technologies [
3,
4]. In the context of cinemas, SST adoption may vary depending on consumer expectations regarding service interactions. Cinemagoers may prefer self-service options for tasks that are perceived as low-involvement like purchasing tickets or refreshments, while still seeking personal interactions for more complex services.
Rogers’ Diffusion of Innovations theory suggests that forcing customers to adopt new technologies (e.g., removing traditional service options) could hinder the acceptance of SSTs, mainly among older or less technologically adept cinemagoers [
5,
6,
7,
8]. Similarly, Ajzen’s Theory of Planned Behavior shows that customer attitudes, subjective norms, and perceived behavioral control can shape the acceptance of SSTs in cinemas [
9,
10]. Also, the acceptance of and preference for SSTs can vary between individuals. Considine and Cormican highlighted that individual differences such as demographics and prior experience with technology play a critical role in determining whether a customer accepts or resists these innovations [
11]. Similarly, Curran and Meuter found that perceived usefulness and ease of use are the keys to SST adoption. However, these factors are mediated by customer demographics and context-specific variables [
12]. Therefore, the challenge lies in balancing the convenience of automation with the varying needs and preferences of a diverse audience.
The specific application of SSTs in cinemas remains underexplored compared to other service sectors like retail, banking, and hospitality [
13,
14]. There is a need to better understand how SSTs influence the cinemagoing experience. It is important to understand regarding how these technologies cater to different demographic groups and enhance or detract from the overall experience. Therefore, the aim of this paper is to understand how cinemagoers feel about the use of SSTs in cinemas. For this goal, two research questions are proposed and answered in this study. These two research questions deal with the acceptance of SSTs and understanding future trends about them.
This paper is structured as follows: a literature review is conducted in
Section 2; the research questions are shown in
Section 3, materials and methods, as well as the steps of the research are presented in
Section 4; and the results are presented in
Section 5 and discussed in
Section 6. Conclusions are made in
Section 7.
2. Literature Review
The concept of SSTs dates back to the late 20th century, and since then, they have been widely researched across various service industries with early studies focusing on cost-saving automation benefits for businesses [
13]. Another early research study by Dabholkar laid the groundwork for understanding customer interactions with technology-based self-service options [
15]. Subsequent studies expanded on this by showing how these technologies could enhance services across different sectors. This included retail [
1,
16], banking [
12,
17], and hospitality sectors [
18,
19,
20]. In the retail sector, SSTs such as self-checkout kiosks can enhance customer satisfaction by reducing wait times and increasing convenience [
21]. Similarly, in the banking industry, the use of automated teller machines (ATMs) and online banking services has increased customer engagement and also reduced operational costs [
22]. In the hospitality sector, STTs have also increased guest satisfaction [
23]. SSTs like automated check-in systems have transformed the experience of guests by streamlining processes and allowing for greater personalization [
24].
While the number of SSTs has increased through the years, their number greatly increased due to the COVID-19 pandemic [
25,
26]. For this reason, SSTs have become more widespread, sometimes even fully replacing interaction with staff members. Meanwhile, recent studies have increasingly examined how these technologies improve customer experience, including in cinema settings. For instance, SSTs such as self-service kiosks, online booking platforms, and mobile applications have become standard in cinemas. They can offer cinemagoers the ability to purchase tickets, select seating, and order refreshments without requiring the help of the staff [
2]. These technologies can enhance the overall cinemagoing experience by reducing queues and providing more personalized options for customers. In the meantime, their satisfaction and loyalty can be improved.
The success of self-service systems lies mainly in whether consumers accept and use them. For example, the placement of self-service kiosks is crucial for their accessibility since open areas are generally more accepted [
27,
28,
29]. In contrast, crowds and time constraints can induce anxiety when using SSTs [
30]. Additionally, Curran and Meuter emphasized the need to consider the specific service environment during SST adoption [
12]. The study of Considine and Cormican found that while SSTs are generally viewed positively in terms of functionality and security, there are significant concerns regarding the design and customization of these technologies [
11]. The study suggests that while SST adoption is context-dependent, greater attention to user-centric design and personalization could enhance their effectiveness in business environments. Therefore, a properly designed and functioning system can increase customer satisfaction and improve customer loyalty in the long term. Using self-service systems can lead to reaching new consumer groups; e.g., instead of using services that are normally tied to a geographic location, using internet-based systems may increase the number of customers (e.g., online banking services) [
31,
32].
Studies have also started to explore the impact of human characteristics on SST adoption. Gender differences have also been observed in the adoption of SSTs. According to Venkatesh and Morris, males are often more willing to use technology-based services than females [
33]. Lee and Allaway found that younger consumers are generally more open to using SSTs, likely due to their greater familiarity with technology [
34]. In contrast, older consumers may experience higher levels of technological anxiety [
35]. These ideas were also strengthened by other studies [
36,
37,
38]. One study examined the link between the service environment and users’ intentions to adopt SSTs [
39], while another explored how consumers’ perceptions of the quality of SST influence their emotional and cognitive reactions [
40]. When focusing specifically on older individuals, one study analyzed their participation in the creation and use of SST from a service management viewpoint [
41]. Additionally, research has looked into the factors influencing older consumers’ intentions to adopt SSTs while taking into account both chronological and subjective age as well as future time perspective [
42]. Other studies have explored the determinants of self-service kiosk usage among older consumers in fast-food settings and self-checkout systems [
43,
44,
45]. Therefore, the target groups have to be known when creating SSTs in certain services.
Several theoretical models have been proposed to explain the adoption of SSTs. However, the Technology Acceptance Model (TAM) was one of the most widely used frameworks. According to TAM, the perceived ease of use and perceived usefulness are the main determinants of technology adoption [
46]. The results show in the literature that the ease of use and usefulness significantly affect the acceptance of SSTs by customers [
47,
48]. SSTs can provide positive benefits for employees as well, although some jobs may be removed due to their use (such as administration). In contrast, employees can focus on other tasks that improve consumer convenience. For example, if arriving guests check into hotels through kiosks, the reception staff can focus on welcoming them instead [
49,
50]. In addition, self-service systems can offer customers advice or recommendations in the future. These can improve service quality.
In addition to TAM, other factors such as perceived control, need for interaction, and technological anxiety have been identified as critical components of SST adoption [
1,
35]. Perceived control refers to the extent to which customers feel that they can effectively use certain technology without assistance. This factor is closely related to the overall confidence of people using SSTs [
34]. The need for interaction and technological anxiety highlights the importance of considering individual differences in technology use [
3,
51].
Therefore, based on the previously mentioned studies in this section, the following factors contribute to customer satisfaction when using self-service systems:
Solving problems in intense situations (e.g., withdrawing cash from an ATM in an emergency);
Being better than alternative options (e.g., no need for personal contact, time-saving, no location restrictions);
Saving money (e.g., discounts on tickets bought at kiosks);
Providing an experiential advantage.
In contrast, the following factors cause dissatisfaction when using self-service systems:
Technological errors;
Process errors;
Design problems (e.g., complicated user interface);
Mistakes made by the consumer (which can lead to dissatisfaction projected onto the company);
Lack of alternative options (leading to a feeling of being forced into using SSTs);
Inappropriate behavior of support staff.
In a study by Cao et al., the following three methods for the practical introduction of self-service systems were discussed [
2]:
Employing human staff to assist customers in using self-service kiosks. Multiple self-service options can be offered simultaneously to increase customers’ freedom of choice. For example, airlines might offer offline check-in kiosks, online check-in applications, and on-site check-in;
Designing self-service equipment to work based on existing technical characteristics and interfaces that customers may already know, such as ATMs. For example, newer banking systems can incorporate additional features into existing ATMs, such as cash deposits, which were not initially available;
Implementing anthropomorphized systems with human-like physical and virtual characteristics, such as human voice, gestures, and facial expressions. This can reduce the sense of dealing with “non-human equipment,” increasing customer trust and reducing negative feelings and experiences.
Similarly, according to Cao et al. [
2], the ideal scenario is to simultaneously integrate the above strategies by complementing anthropomorphized equipment with human staff and interdependent innovation of technologies. However, in practice, companies often have to compromise based on their resources and financial budget.
As can be seen, while SST adoption has been studied in retail, banking, and hospitality, limited research exists on how demographic factors influence SST preferences in the cinema industry. This study aims to fill this gap by examining the relationship between demographic variables and SST adoption in Hungarian cinemas. However, during this study, we diverge from TAM by placing a greater emphasis on human characteristics (such as gender, age, place of residence, and frequency of cinema attendance) instead of focusing on technology acceptance factors. This is due to the fact that younger audiences might prefer new technologies more due to their familiarity with digital interfaces [
37], while older demographics might show some resistance due to certain habits or a preference for human interaction [
36,
38].
3. Research Questions
Therefore, in order to understand the SST preference of cinemagoers and its relationship with demographic factors, the following two research questions (RQs) are formed:
RQ1: Is there a relationship between the demographic characteristics of respondents (gender; age group; where people live; cinema attendance) and their preferences for SSTs in cinemas?
RQ2: Based on the investigated relationships, what predictions could be made for SST preference of future cinemagoers?
The goal of RQ1 is to identify significant relationships between these aforementioned factors and SST preferences. This can provide an understanding of which demographic groups are more or less likely to prefer SSTs in cinemas. Then, by building on the results regarding RQ1, the answer to RQ2 aims to predict future trends in SST preferences among cinemagoers who have similar demographic backgrounds. The results can enable the services of cinemas to remain relevant and appeal to future audiences.
4. Materials and Methods
Therefore, in 2022, an online questionnaire was created to understand the opinions on SSTs in Hungary’s cinemas. Our aim with the questionnaire was to gather opinions about how people perceive SSTs in cinemas, focusing on their effect on the cinemagoing experience. The questionnaire was posted on Facebook and could be filled out for a month. It was shared in multiple groups, which included university groups and Hungarian communities of cinemagoers.
The users were also asked to share the questionnaire with their friends. Participants could complete the questionnaire voluntarily. They had the option to withdraw at any time. No monetary compensation or incentives were provided for participation in the survey. This was stated to the participants beforehand on social media to minimize any potential influence on their responses. The questionnaire was conducted purely on a voluntary basis, and participants were encouraged to share their genuine experiences and opinions without external pressure or rewards. It was also indicated in the questionnaire that by filling it, participants were giving informed consent for data collection, analysis, and publication. No data that could allow for participant identification were gathered. The questionnaire included a variety of questions designed to assess the frequency of cinema visits and the opinion about SSTs. The whole questionnaire (translated to English from Hungarian) can be found in
Appendix A. In total, 202 people filled out the questionnaire.
After the data were gathered, the responses of the participants were downloaded from Google Forms with a click of a button. At the same time, an XLSX file was also created. This file was imported into the statistical program package R (version: 4.3.2) for further analysis. Naturally, the data had to be preprocessed as some techniques required various data frame structures. For this process, the tidyr and dplyr packages for used. After preprocessing, the investigation started. For it, an of 0.05 was selected. Since the gathered data were categorical, the test was used to assess the relationship between the investigated variables. In the cases where the sample size was too small, the log likelihood ratio (G-test) test of independence was used instead. Cramér’s V was also calculated to understand the strengths of the effects. A function was used for calculating Cramér’s V, and it could be found in the DescTools package. To create models of the preference of SSTs, ordinal logistic regression was used from the MASS package. For plotting, the ggplot2 package was used. When presenting the numerical data in the study, V refers to Cramér’s V, and G refers to the results of the G-test. Cramér’s V can be interpreted the following way:
: There is little to no association between the variables.
: There is a moderate association between the variables.
: There is a strong association between the variables.
: There is a very strong association between the variables.
If the results of Cramér’s V is , that means that the value could not be computed. Also, when presenting the results of the G-test, the following format is used: . Here, stands for the degrees of freedom, x is the size of sample N, is the test statistic, and y is the value of p. In the case of the test, the results are presented in a similar fashion.
5. Results
This section is split into five subsections. In
Section 5.1, the general information can be observed about the results. In
Section 5.2, the relationship between gender and SST preference is investigated. Afterward, the relationship between age groups and SST preference is assessed in
Section 5.3. Next, the relationship between the places of residence and SST preference is investigated in
Section 5.4. Lastly, in
Section 5.5, the relationship between cinema attendance frequency and SST preference is examined.
5.1. General Results
Out of the 202 respondents, 51 were male and 151 female. Out of males, 3.92%, 17.65%, and 78.43% preferred SSTs only, human-staff only, and hybrid systems, respectively. In the case of females, these percentages were 3.31%, 17.22%, and 79.47%, respectively. This suggests that both males and females had similar opinions about their preferences.
The respondents were grouped by multiple factors below. First, they are grouped by age in
Table 1.
As can be seen in
Table 1, the largest number of respondents was between the ages of 18 and 25. On the contrary, the smallest number of respondents was above the age of 50. No respondent was below the age of 18.
Similarly, the general results regarding the respondents’ place of residence were also investigated. These general results can be observed in
Table 2.
According to the data presented in
Table 2, a significant proportion of male respondents (54.17%) live in a county seat, whereas female respondents are more evenly distributed. Still, the distribution of respondents living in villages is similar between males and females (18.75% and 19.21%, respectively).
Lastly, the general results were grouped by cinema attendance. They are observable in
Table 3.
As can be observed from the percentage-based data in
Table 3, males have a higher proportion in the most frequent attendance category (“At least 2–3 times a month”). However, females still show higher percentages in some of the moderate and infrequent categories.
5.2. Relationship between Gender and SST Preference
First, the relationship between gender and SSTs was assessed. For the start, all three investigated SSTs were assessed with the
test. According to the results, gender and SST preference are independent of each other,
,
. Still, the various SSTs and the effect on cinema attendance were also analyzed. The preference of males and females is shown in
Figure 1.
As can be observed in
Figure 1, both males and females prefer the three SSTs. In addition, their results also show that the use of SSTs in cinemas does not change their cinema attendance. However, gender and each investigated category were independent of each other. The statistical results regarding this fact are the following:
Gender and self-service ticket machine ();
Gender and self-service popcorn and soft drink vending machine (, );
Gender and automated entry system ();
Gender and change in cinema attendance (, ).
As mentioned in the previous section, ordinal logistic regression was used to estimate the odds of being in a higher category of the dependent variable based on the independent variable. The results of this analysis are shown in
Table 4.
The positive coefficient (0.083) suggests that females are slightly more likely than males to prefer SSTs. However, the effect size is small and not significant. Regarding the threshold coefficients, the negative value between “do not prefer” and “maybe” indicates that it is less likely to observe someone in the “do not prefer” category compared to “maybe”. A similar observation can be made between “maybe” and “prefer”, since people are less likely to say maybe than to say they prefer it.
To better understand this phenomenon, a prediction was made using the model mentioned in
Table 4. The prediction is shown in
Figure 2. Here, the horizontal axis represents different observations (predictions) for possible future responses, while the vertical axis represents the probabilities of possible future respondents not preferring or maybe preferring or preferring SSTs.
Due to readability and since there were no significant differences between males and females, the groups for males and females are not shown in
Figure 2. Overall, it can be stated that the majority of the observations have nearly identical predicted probabilities: approximately 16.87% for “do not prefer”, 15.68% for “maybe”, and 67.44% for “prefer”. A smaller set of observations has slightly different probabilities: about 18.08% for “do not prefer”, 16.34% for “maybe”, and 65.58% for “prefer”. Therefore, the predicted probabilities of 65.58% and 67.44% suggest that for future users, there is approximately a 65.58% to 67.44% chance that they would “prefer” the investigated SSTs based on the model’s current predictions.
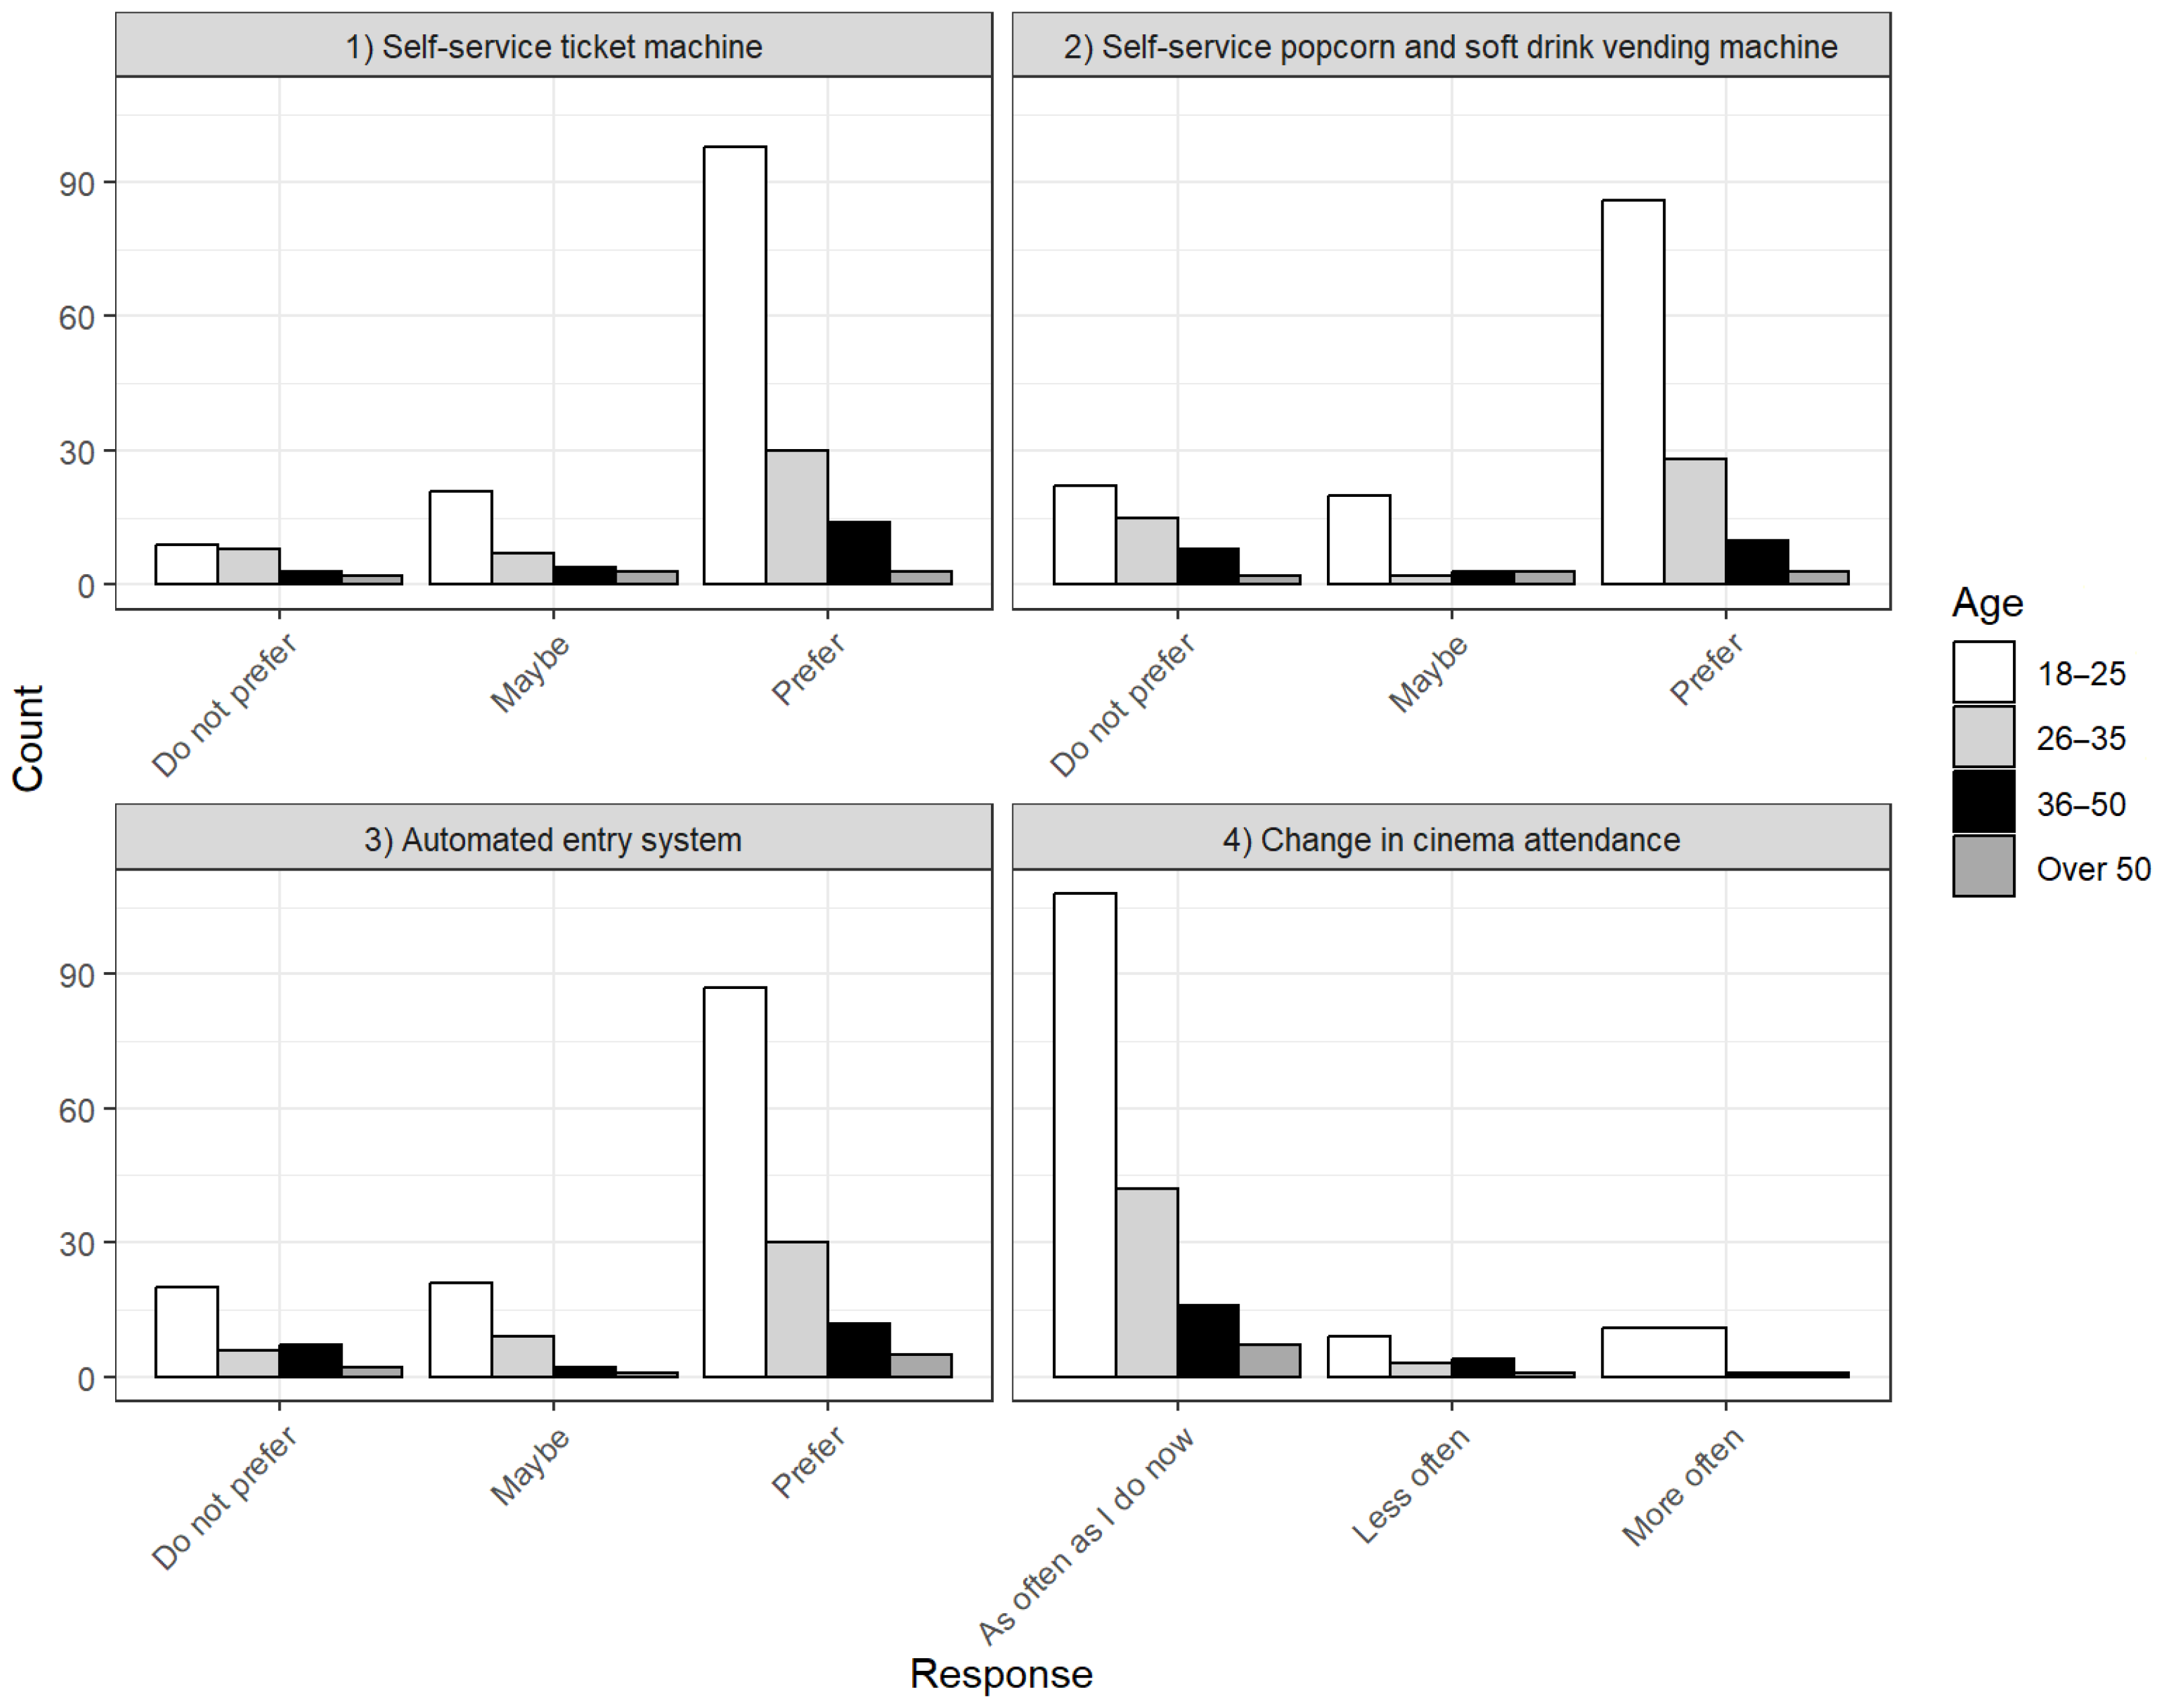
5.3. Relationship between Age Groups and SST Preference
Similarly to the previous subsection, the overall preference of the three investigated SSTs was first investigated. However, the results show that age groups and SST preferences were independent of each other,
. Afterward, the various SSTs and the effect on cinema attendance were also analyzed. The preference of the various age groups is shown in
Figure 3.
The relationship between every age group and SST preference was also assessed, and the results were as follows.
Ages 18–25 and SST preference were independent of each other ();
Ages 26–35 and SST preference were dependent of each other ();
Ages 36–50 and SST preference were independent of each other ();
Ages over 50 and SST preference were independent of each other ().
Next, similarly to the previous subsection, the preferences were also assessed with ordinal logistic regression. The results of the analysis are shown in
Table 5.
According to the results presented in
Table 5, the coefficient of −0.317 suggests that respondents aged 26–35 are less likely to “prefer” SSTs compared to the reference group (ages 18–25). However, the effect is not very strong. The coefficient of −0.688 is more negative than for the 26–35 group. This suggests that respondents aged 36–50 are even less likely to “prefer” SSTs compared to the reference group. The coefficient of −0.920 is the most negative, indicating that respondents over 50 are the least likely to “prefer” SSTs compared to the reference group. Regarding preference, those who do not prefer or maybe prefer SSTs are less likely to start preferring them.
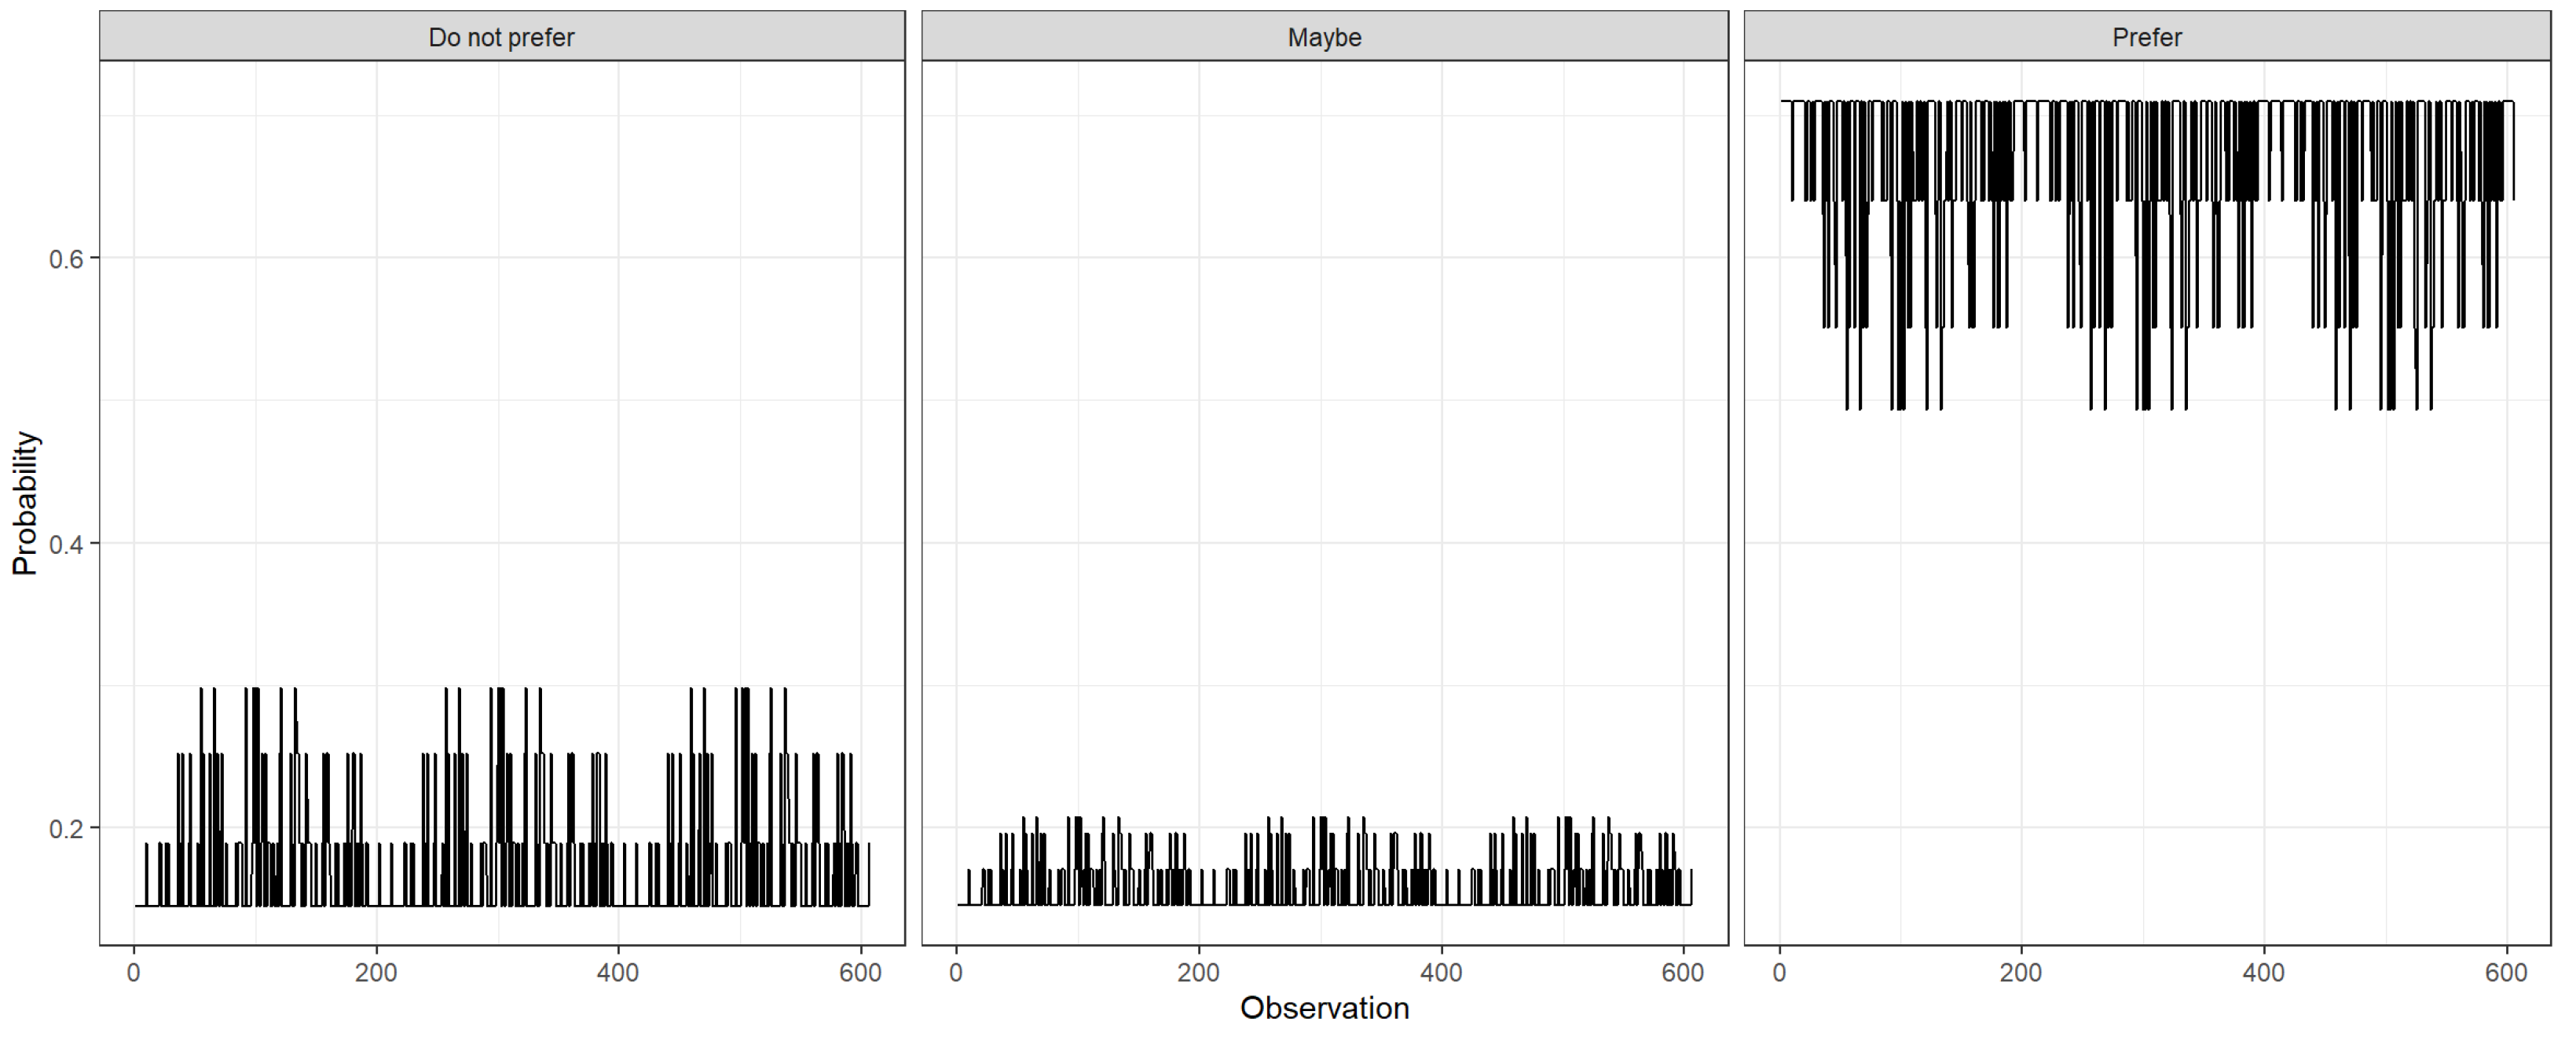
To better understand this phenomenon, a prediction was made using the model mentioned in
Table 5. The prediction is shown in
Figure 4.
The model seen in
Figure 4 predicts a strong likelihood of age groups preferring SSTs. The probabilities for “prefer” are often around 70.98%, although in some cases they could be around 55.13%. In contrast, the probabilities for “do not prefer” and “maybe” are much lower, both around 14.50% in most cases. However, in some cases, they could reach 29.86% and 20.79%, respectively. Overall, this implies that if this model were applied to future data, most people would be expected to have a positive response regarding SSTs.
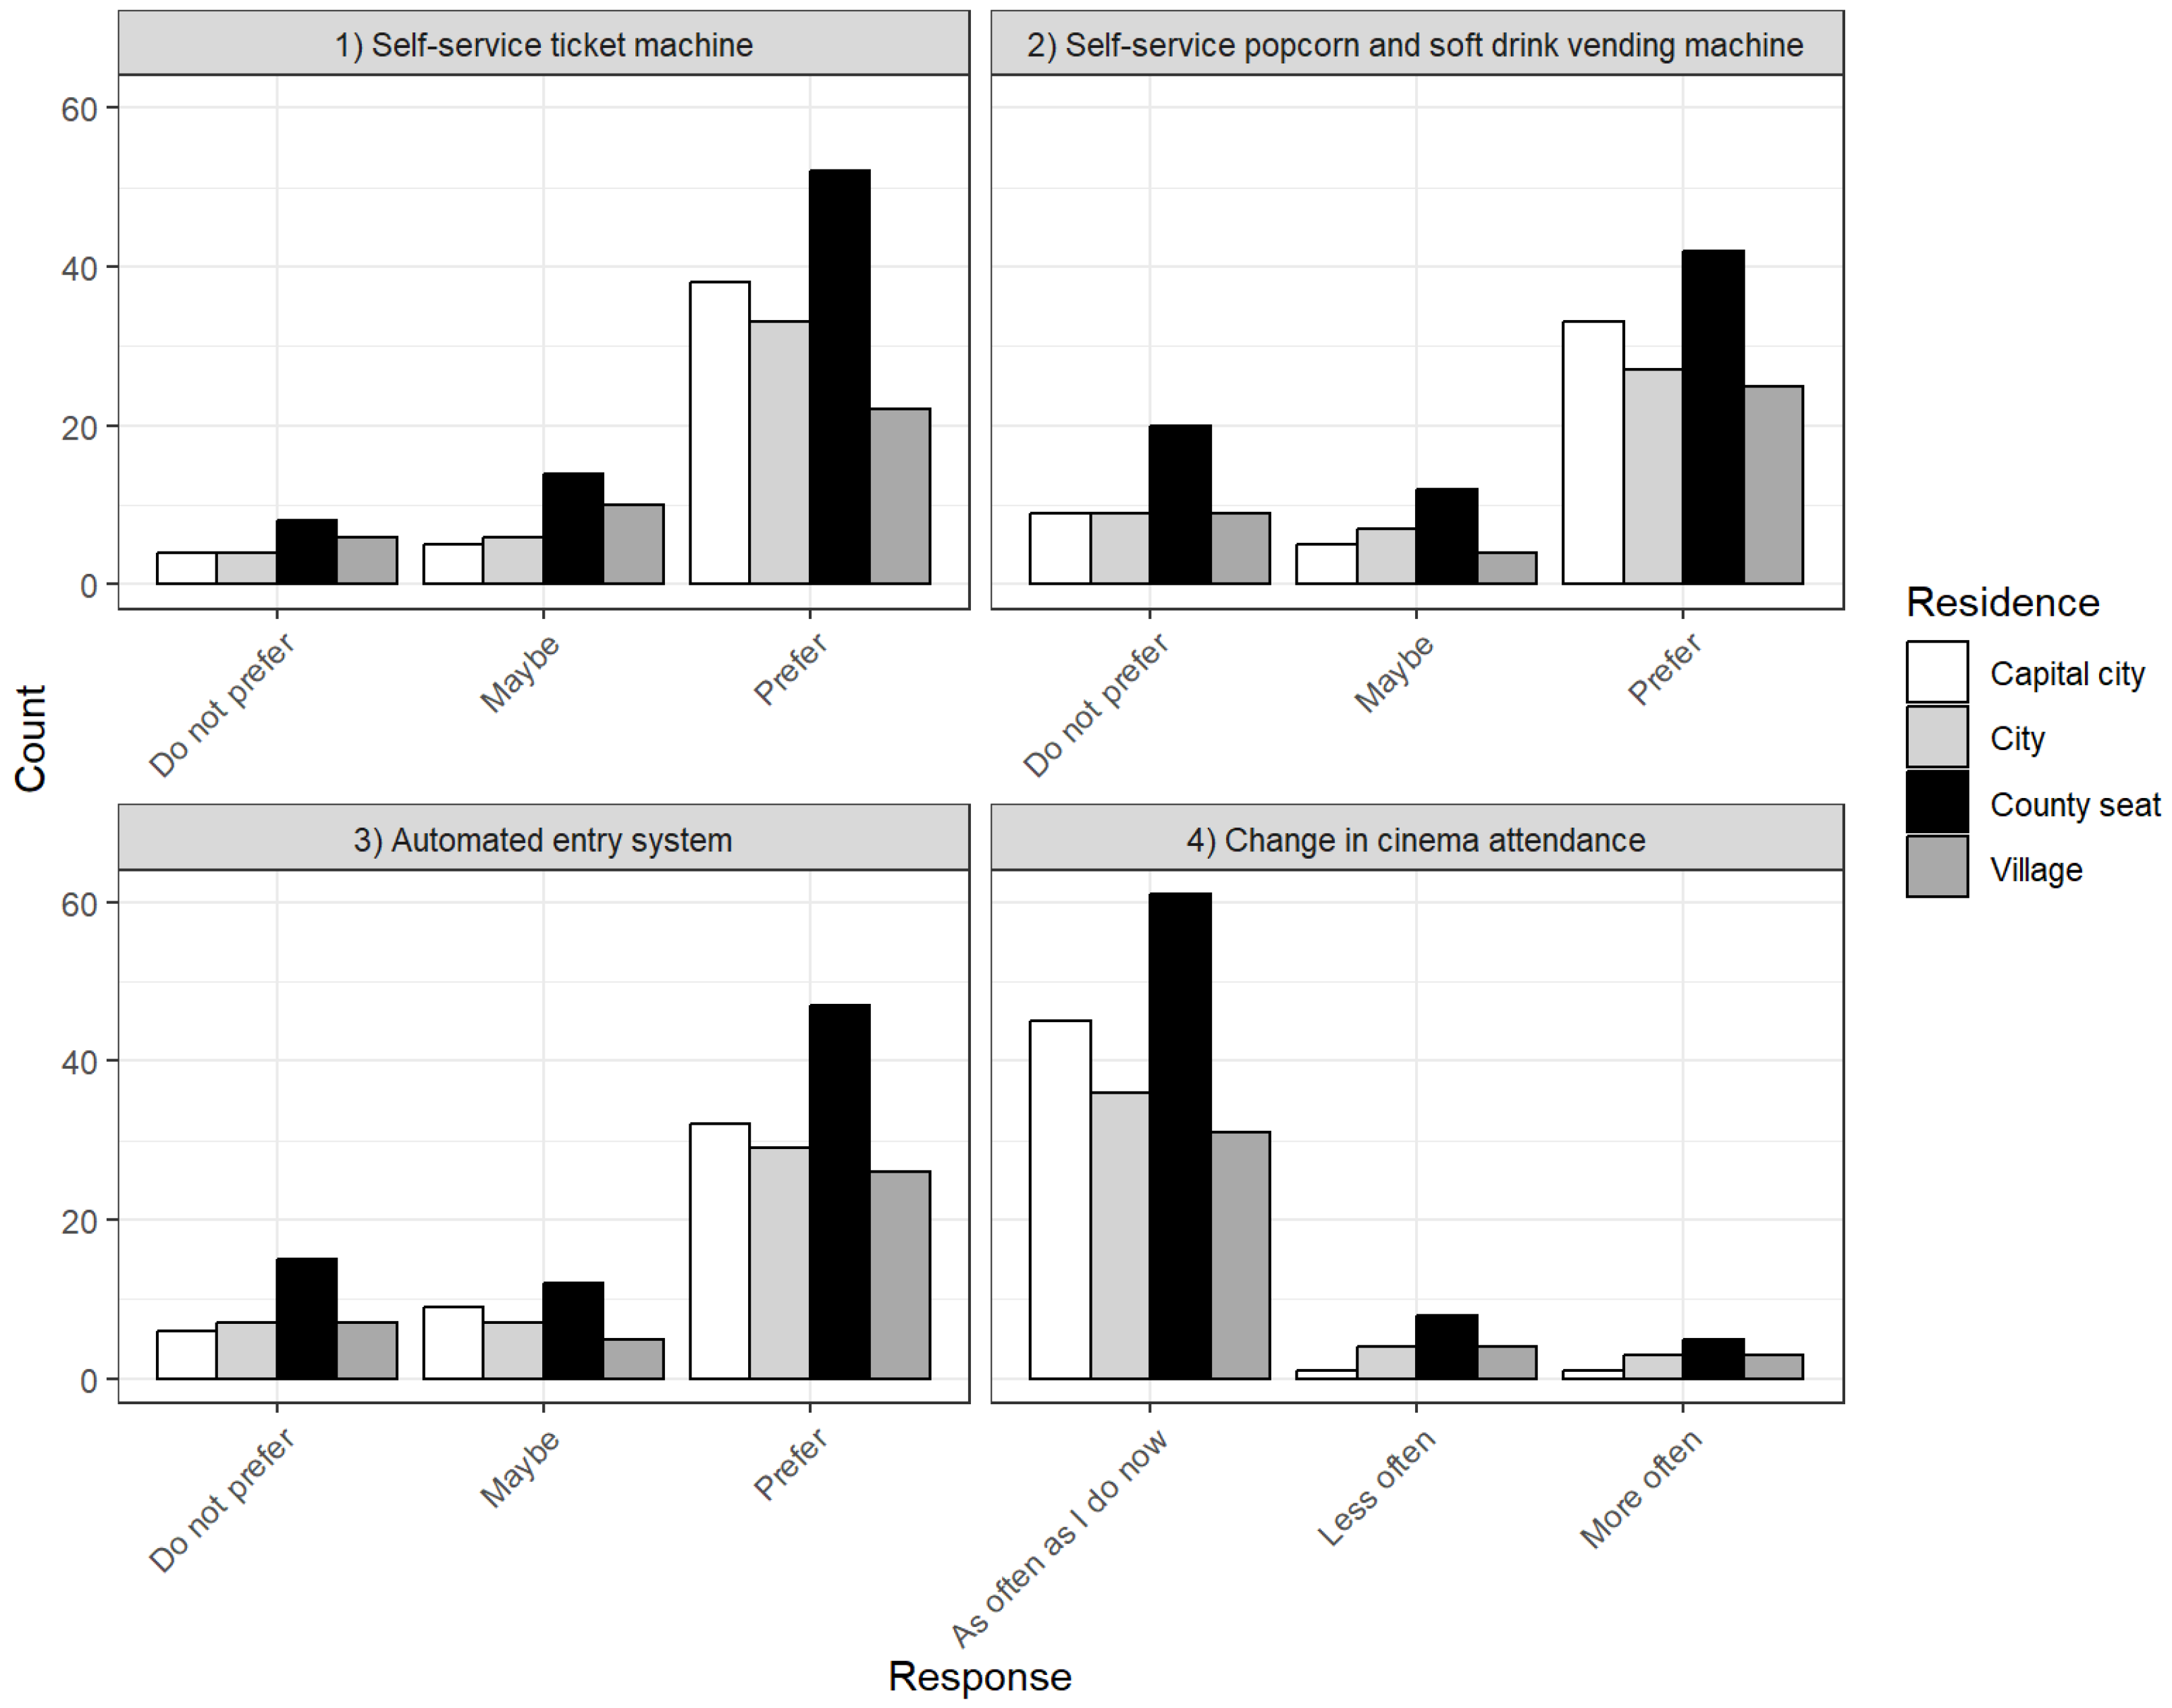
5.4. Relationship between Place of Residence and SST Preference
Next, the relationship between place of residence and SST preference was examined. Similarly, first, all three were investigated. The results show that the place of residence and SST preference are independent of each other,
. Next, each SST and the influence on cinema attendance were also analyzed. The preferences of people with various places of residence are shown in
Figure 5.
It can be stated, that SST preference is higher in the case of all places of residence. Also, the use of SSTs does not seem to change how often people go to cinemas. Regarding their relationships, the following statements could be made:
There is no relationship between place of residence and self-service ticket machine preference: ;
There is no relationship between place of residence and self-service popcorn or soft drink vending machine preference: ;
There is no relationship between place of residence and automated entry system preference: ;
There is no relationship between place of residence and change in cinema attendance: .
Again, the preferences were analyzed with ordinal logistic regression. The results of the examination are presented in
Table 6.
The regression analysis results in
Table 6 indicate that the place of residence does not have a statistically significant effect on the likelihood of respondents preferring SSTs when compared to the reference group (which is the village). Still, respondents in the capital city or cities are more likely to “prefer” SSTs compared to the reference group. In contrast, respondents in country seats are less likely to prefer SSTs. Regarding preference, the thresholds are statistically significant. This indicates that the model is effective in differentiating between the three different levels of preference.
As mentioned previously, to better understand this phenomenon, a prediction was made using the model mentioned in
Table 6. The prediction is shown in
Figure 6.
As seen in
Figure 6, in almost all cases, the probability of falling into the “prefer” category is the highest. For example, probabilities like 63.51%, 69.08%, or even 73.02% suggest that a majority of the respondents are predicted to have a strong preference for SSTs. The “maybe” category has probabilities around 15.14% or 17.10%. This shows a moderate likelihood for respondents to be uncertain about their preferences. The “do not prefer” category has the lowest predicted probabilities. Values such as 19.37%, 15.76%, and 13.38% indicate that respondents are less likely to fall into this category.
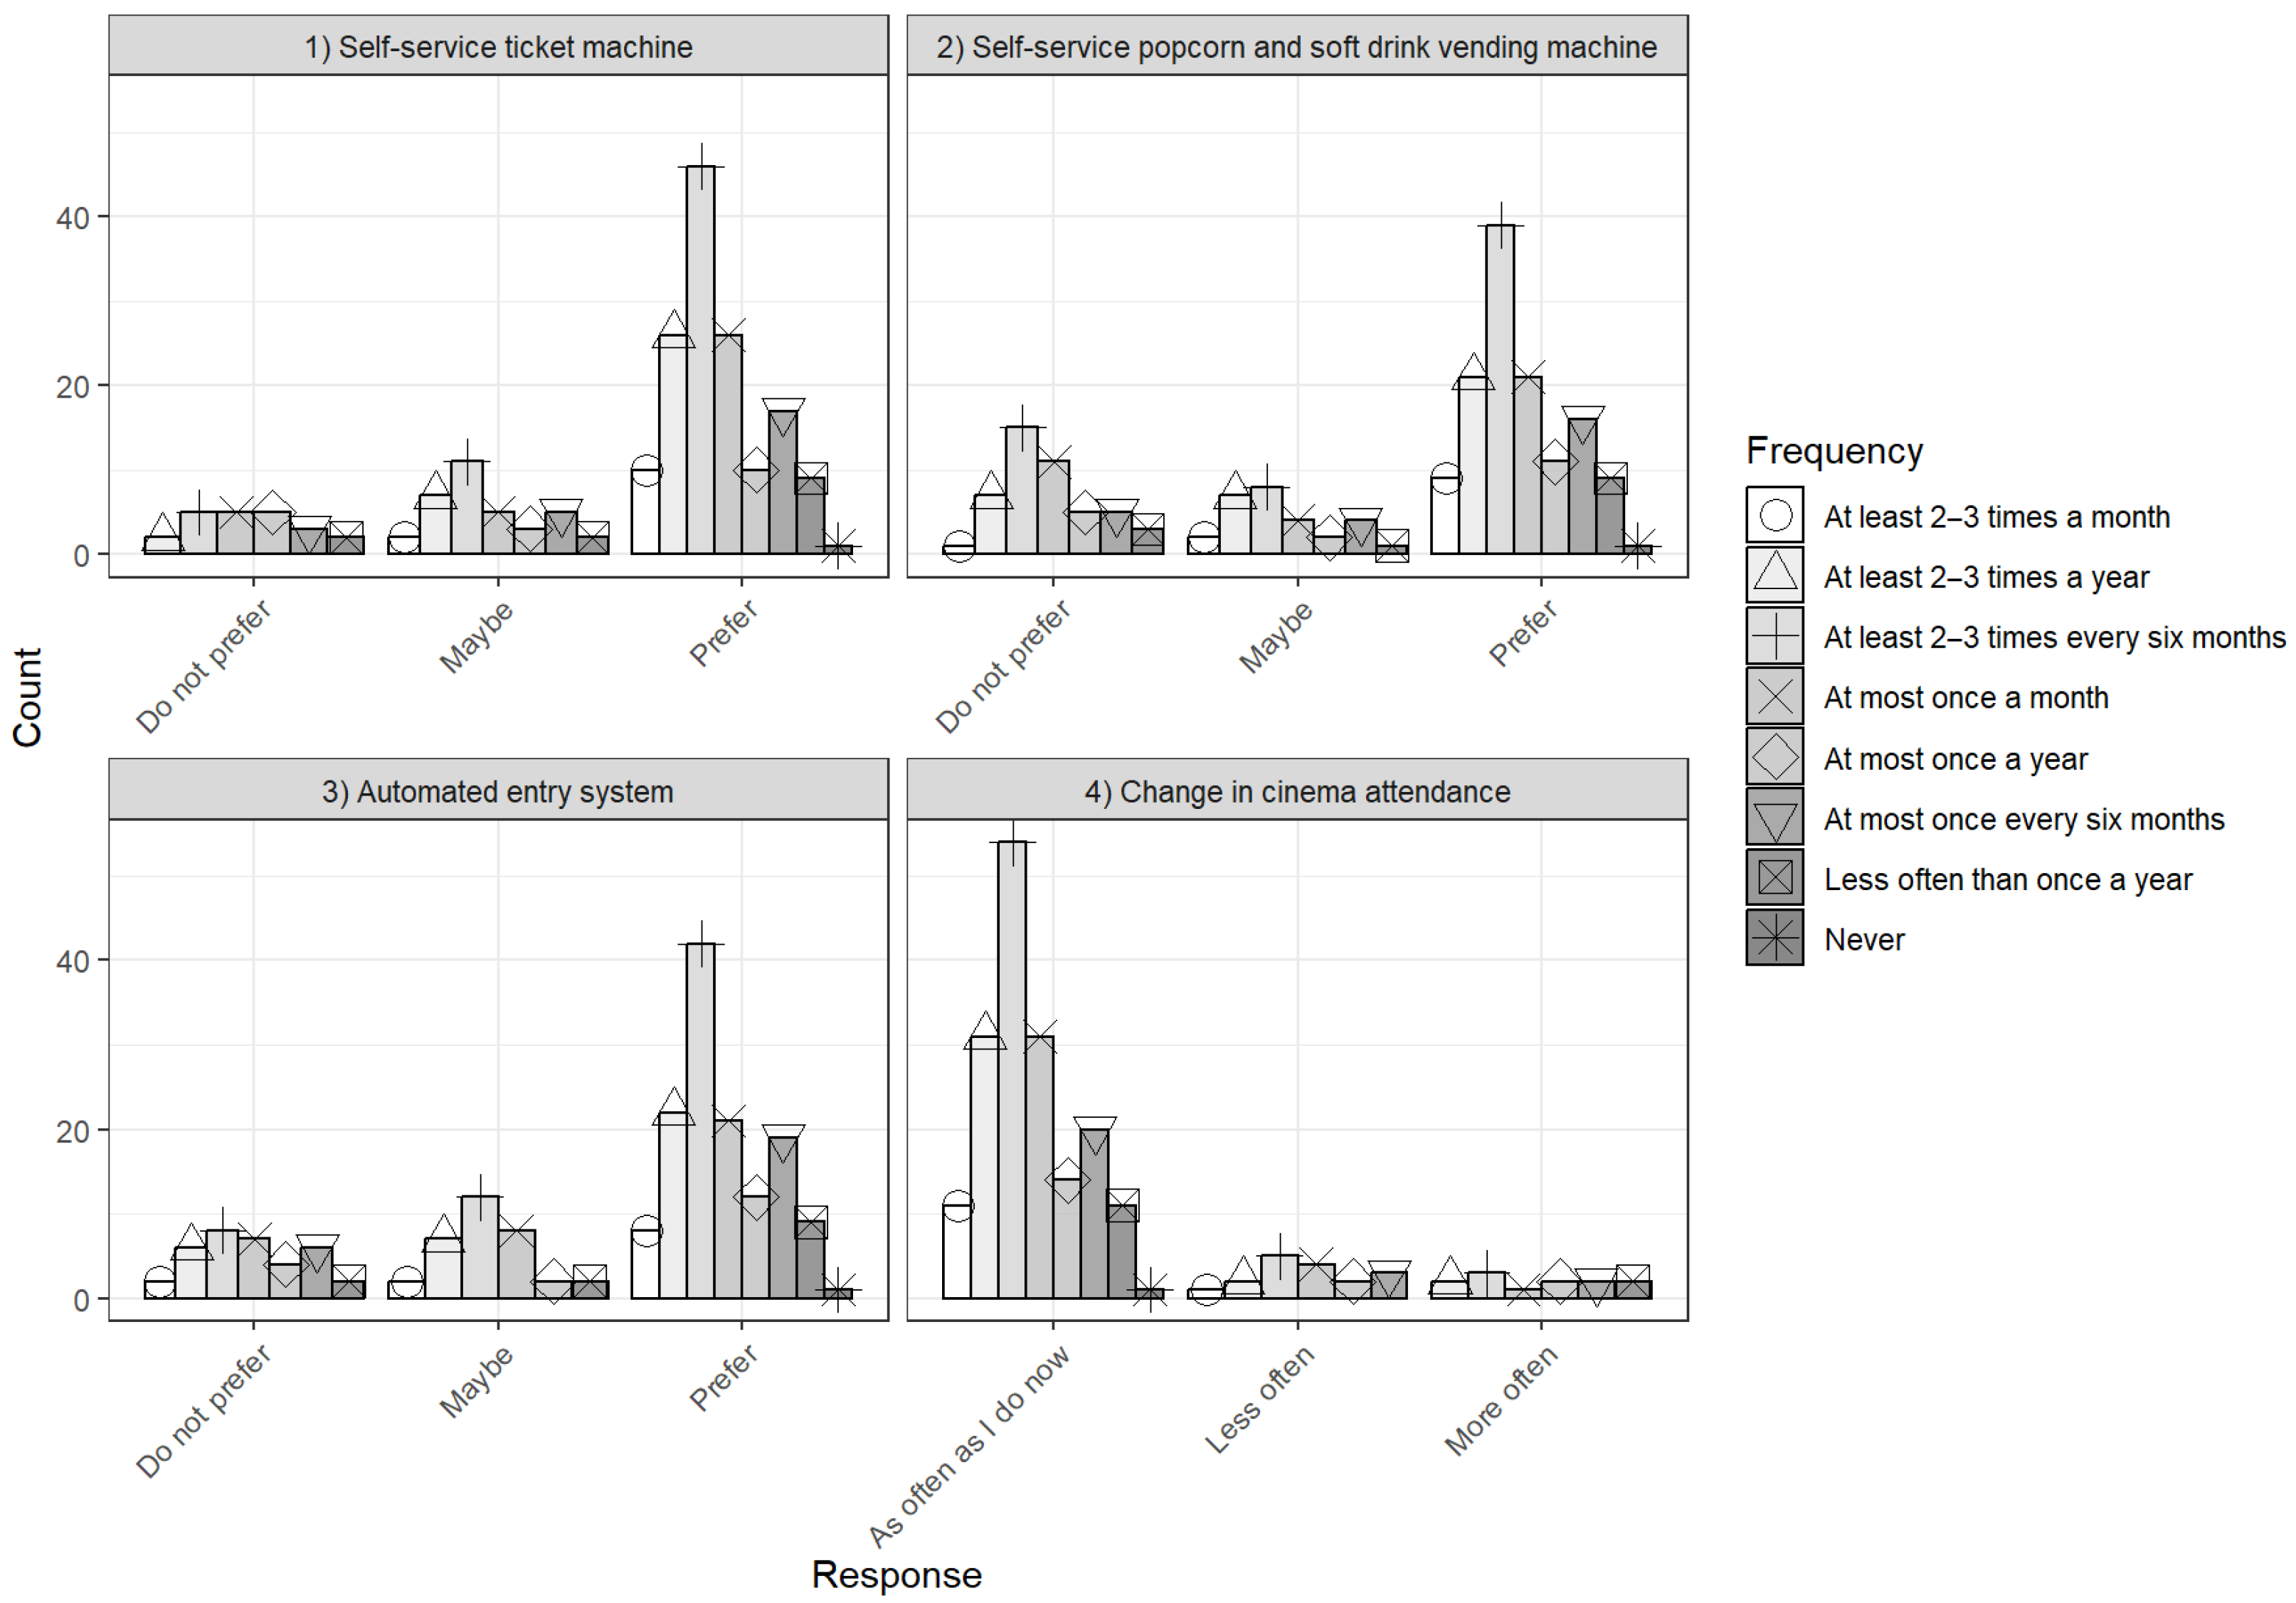
5.5. Relationship between Cinema Attendance Frequency and SST Preference
Lastly, the relationship between cinema attendance frequency and SST preference was assessed. As mentioned previously, all investigated SSTs were examined. The results show that cinema attendance and SST preference are independent of each other,
. Next, each SST and the influence on cinema attendance frequency were also analyzed. The preference of the various people with different cinema attendance frequencies is illustrated in
Figure 7.
While most people in each group prefer SSTs, according to the analysis, no significant relationships could be found between cinema attendance frequency and the investigated factors. Overall, the results are as follows:
Cinema attendance frequency and self-service ticket machine preference are independent of each other ();
Cinema attendance frequency and self-service popcorn and soft drink vending machine preference are independent of each other ();
Cinema attendance frequency and automated entry systems preference are independent of each other ();
Cinema attendance frequency and the change in it are independent of each other ().
As mentioned previously, the preferences were analyzed with ordinal logistic regression. The results of the assessment are shown in
Table 7.
Compared to the base category (which is “At least 2–3 times a year”), the cinema attendance frequency categories do not show statistically significant relationships with SST preferences. However, the statistically significant thresholds between the preference categories show that there is a clear distinction in SST preference among respondents, regardless of their cinema attendance frequency.
Lastly, to better understand this phenomenon, a prediction was made using the model presented in
Table 7. The results of the prediction are illustrated in
Figure 8.
As shown in
Figure 8, the highest predicted probabilities for the “prefer” category range from around 59.20% to 75.90% in most cases. However, there are a few extreme cases where the probability of “prefer” is 99.99%. Overall, this indicates that there is a strong likelihood that respondents prefer SSTs. The “maybe” category has the second highest probability, from around 15% to 18%. This suggests some uncertainty or indecision among respondents, although it is still less likely than “prefer”. The “do not prefer” category has similar predicted probabilities to “maybe”. All in all, this pattern suggests that there is a clear preference among respondents, and consequently, future cinemagoers could have the same preferences regarding SSTs.
6. Discussion
At the beginning of the study, two RQs were proposed in
Section 3. These questions were answered based on the results presented in this study. The discussion of the results is as follows.
The goal of RQ1 was to identify the relationships between four factors and preferences for SSTs. The results from the tests and G-tests indicated that gender, age group, place of residence, and cinema attendance frequency had only a minimal influence on SST preferences. For example, the preference for SSTs was slightly higher among females, younger respondents (particularly those aged 18–25), and those who reside in capital cities or larger urban areas. However, these differences were not statistically significant. This indicates that preferences for SSTs are generally consistent between the various groups. Since SSTs have a broad and uniform appeal, cinemas can confidently implement SSTs knowing that they are likely to be accepted by a wide range of customers, regardless of their age, gender, or where they live. However, given this broad acceptance, cinemas should focus on designing systems that are user-friendly and accessible to all customers. It should be ensured that SSTs are easy to use for people of all ages and technical abilities.
Regarding RQ2, it aimed to predict possible future trends in SST preferences based on current data. The ordinal logistic regression model suggested a strong likelihood that future cinemagoers will prefer SSTs, regardless of their investigated demographic background. The model’s predictions indicated that the probability of respondents preferring SSTs ranging between 65.58% and 75.90% in most cases. Only a small percentage of respondents were uncertain about or opposed to using SSTs. These results suggest that cinemas should consider integrating SSTs into their service offerings. As the preference for SSTs is expected to grow, cinemas that adopt these technologies will be better prepared to meet future demand.
These answers also have the implication that by implementing SSTs, cinemas would be able to collect data on customer preferences and behavior. These data can be used to offer personalized experiences, such as movie recommendations or promotions. Consequently, this study has the following theoretical (T) and managerial (M) contributions:
T1: This study enhances the understanding of consumer behavior related to SSTs by showing how the convenience offered by these technologies can affect user satisfaction. The results show the need to consider user-specific factors when evaluating SST adoption.
T2: The results present a further need to explore SST preferences across different cultural contexts. This could lead to more generalized theories regarding technology adoption in leisure and entertainment environments.
M1: Given the various preferences identified among different demographic groups, the managers of cinemas should consider a targeted approach to the implementation of SSTs. For instance, they could design self-service kiosks and automated systems that cater specifically to the preferences of younger audiences while also ensuring that options remain accessible for older cinemagoers who may prefer traditional service models.
M2: To help with the successful adoption of SSTs, cinema managers should invest in training staff to assist customers who may be less familiar with technology. By offering support or providing informational materials on using self-service systems, potential anxieties can be alleviated and customer satisfaction could be enhanced.
M3: Managers should strive to create a seamless integration of SSTs into the overall cinema experience. This includes ensuring that the physical layout supports the use of SSTs and that the technology is user-friendly. Enhancing the user interface and streamlining processes can lead to increased efficiency and improved customer satisfaction.
M4: Understanding demographic preferences for SSTs could allow for more strategic marketing efforts. Cinemas can target specific audiences with promotions or campaigns that highlight the convenience and benefits of using SSTs. In this way, they could potentially attract new customers while retaining existing ones.
Naturally, there are several limitations that should be acknowledged regarding this study. First is the sample size of 202 respondents. Although it is sufficient for exploratory analysis, it may not fully capture the diversity of the general population of cinemagoers. In particular, there was an imbalance between gender groups (51 males and 151 females) that could skew the results and affect the reliability of generalizations. Future studies could benefit from a larger and more balanced sample to yield more accurate results.
Second, the use of an online questionnaire introduces potential sampling bias due to the fact that it was posted on social media platforms and shared in universities and groups of cinemagoers. This likely attracted younger proplr who like technology, and the reliance on snowball sampling may have amplified this bias. While we recognize that relying solely on Facebook may introduce some bias, the platform’s reach and efficiency made it the most viable option given the constraints of the study. Future research could aim to diversify the distribution strategy to include other social media platforms and offline methods to reach a broader and more representative sample. Additionally, the study was conducted in Hungary, and cultural differences may influence the acceptance and preference for SSTs. Therefore, the results may not be directly applicable to other countries with different technological adoption rates and consumer behavior patterns.
Third, the study focused on self-reported data that were collected online rather than in real-world cinema settings. This limits the understanding of how respondents would actually engage with SSTs in practice, as real-world factors like kiosk convenience, crowd dynamics, or stress levels might influence their preferences. Observational studies or experiments conducted directly at cinemas would provide more objective measures of SST usage and its effect on the cinemagoing experience. Such studies could include physical and situational factors. In the meantime, they could offer a more comprehensive understanding of how the environment impacts SST adoption.
While conducting surveys at cinemas could have provided real-time data on SST interactions, logistical and resource constraints prevented this approach. Obtaining permission from multiple cinema chains, coordinating staff for on-site surveys, and collecting data from a sufficiently large and diverse sample at various locations presented significant challenges during the project timeline. Moreover, cinemas at the time were still adjusting to post-pandemic operating procedures, limiting access to research activities. Future studies could address these limitations by incorporating both observational and survey data to capture a more complete picture of SST preferences and usage in real-world contexts. The use of alternative contactless methods, such as QR codes distributed in physical locations, could have provided a more diverse pool of respondents. Incorporating such methods in future studies could enhance the reliability of the data by minimizing the potential bias associated with self-selection through online platforms.
Future research could explore several other directions to build on the results presented in this study. One such direction is to conduct longitudinal studies to track changes in SST preferences over time, mainly when newer technologies appear and become more integrated into daily life. Additionally, future studies could investigate the specific features of SSTs that are most valued by cinemagoers, such as ease of use, speed, or personalization options. Another important area for future research is the exploration of potential barriers to SST adoption, mainly in the case of older people or individuals who do not use technology every day. Understanding these barriers could help cinemas design more inclusive and user-friendly SSTs. Finally, cross-cultural studies could provide a better understanding of how preferences for SSTs vary across different cultures. This can also help cinemas to customize their services for various customers.
7. Conclusions
This study investigated the relationship between SSTs and cinemagoing experiences while focusing on how demographic factors such as gender, age, place of residence, and frequency of cinema attendance affect SST preferences in Hungarian cinemas. It is important to note that these findings are based on data collected from Hungarian participants, and as such, cultural factors unique to Hungary, including attitudes towards technology and cinemagoing habits, could have influenced the results. Consequently, generalizing these findings to other countries or regions should be approached with caution, as cultural biases could affect the acceptance and use of SSTs in a different way. Future research could expand this study by conducting cross-cultural comparisons to evaluate how cultural differences shape preferences for SSTs in cinemas.
To understand the cinemagoing experiences of Hungarians, an online questionnaire was created and filled out by 202 respondents. The tests, G-tests and ordinal logistic regression showed that gender, age, place of residence, and frequency of cinema attendance had only a small influence on SST preferences. However, based on the regression model mentioned, the overall trend suggests a strong likelihood that future cinemagoers will prefer SSTs.
The results imply that cinemas could benefit from integrating SSTs as part of their service offerings since they are likely to be well received by the majority of their audience. This could enhance the user experience by providing more convenient and personalized services. Consequently, this could potentially lead to increased customer satisfaction.
Author Contributions
Conceptualization, J.S.; methodology, J.S.; software, T.G.; validation, J.S. and T.G.; formal analysis, T.G.; investigation, T.G.; resources, J.S.; data curation, J.S. and T.G.; writing—original draft preparation, J.S. and T.G.; writing—review and editing, J.S. and T.G.; visualization, T.G.; supervision, J.S.; project administration, J.S. All authors have read and agreed to the published version of the manuscript.
Funding
This research received no external funding.
Institutional Review Board Statement
All subjects gave their informed consent for inclusion before they participated in the study. Ethics approval is not required for this type of study. The study has been granted exemption by the Institutional Review Board (or Ethics Committee) of the University of Pannonia. The exemption is due to the fact that the study does not involve human clinical or psychological research.
Informed Consent Statement
Informed consent was obtained from all subjects involved in the study. Informed consent has been obtained from the respondents to publish this paper.
Data Availability Statement
The data presented in this study are available on request from the corresponding author.
Acknowledgments
This work has been implemented by the TKP2021-NVA-10 project with the support provided by the Ministry of Culture and Innovation of Hungary from the National Research, Development and Innovation Fund, financed under the 2021 Thematic Excellence Programme funding scheme.
Conflicts of Interest
The authors declare no conflicts of interest. The funders had no role in the design of the study; in the collection, analyses, or interpretation of data; in the writing of the manuscript; or in the decision to publish the results.
Abbreviations
The following abbreviations are used in this manuscript:
| ATM | Automatic teller machine |
| RQ | Research question |
| SST | Self-service technology |
| TAM | Technology Acceptance Model |
Appendix A
Here, the online questionnaire is detailed. The questionnaire was originally in Hungarian, but it was translated to be presented in this manuscript.
Before starting the questionnaire, the participants are greeted with the following information.
This questionnaire is designed to gather public opinions regarding the use of self-service technologies and automated entry systems in cinemas. We are interested in understanding how users feel about the integration of such technologies in cinemas.
Your responses to this questionnaire are completely confidential. The data collected are anonymous. We ensure that no personally identifiable information will be linked to your responses. Only aggregated data will be analyzed and reported. The information you provide will be used only for research purposes.
Participation in this survey is entirely voluntary. You have the right to decline participation or to withdraw from the survey at any point without any consequence. Your decision to participate or not will have no impact on current or future relationships with researchers or associated institutions. By completing and submitting this questionnaire, you acknowledge that you have read and understood the information provided. You consent to participate in this survey and agree to the use of your anonymized responses in scientific research. Furthermore, you consent to the publication of the research results which can include your anonymized data. The results of this survey may be published in a scientific journal or presented at academic conferences. The published results cannot be traced back to any participant.
“Thank you for your participation in this research!
If you consent to this study, press the ‘Next’ button, and the questionnaire will begin”.
Then, the participants had to answer questions regarding their cinemagoing experience.
How often do you go to the cinema? (Mark only one answer)
At least 2–3 times a month
At most once a month
At least 2–3 times every six months
At most once every six months
At least 2–3 times a year
At most once a year
Less often than once a year
Never
How do you purchase your ticket? (Mark only one answer)
At the ticket counter
Online
When you visit the cinema, do you also buy something at the cafe?
After the completion of this section, the participants were greeted with some information about self-serving technologies and automatic entry systems. This was as follows.
By self-service ticket technologies are devices equipped with a touch screen that allow you to choose which screening you want to buy a ticket for and with which discount. Afterward, the machine prints the ticket on the spot.
You have probably already encountered self-service drink technologies, for example, in fast food restaurants; the popcorn machine would operate on a similar principle.
The automated entry system would allow you to enter through the gate based on the QR code on your ticket.
Afterward, the participants had to answer questions about these technologies mentioned above. These questions were as follows.
Would you be willing to use self-service ticket technologies in the cinema? (Mark only one answer)
Would you be willing to use self-service popcorn and drink technologies at the cinema’s cafe? (Mark only one answer)
Would you like to see an automated entry system in the cinema? (Mark only one answer)
Would your cinemagoing habits be affected if only self-service options were available at the cinema? (Mark only one answer)
I would go to the cinema more often.
I would go to the cinema as often as I do now.
I would go to the cinema less often.
Which option would you prefer?
The current system (with human staff)
Only self-service systems
A hybrid system (combination of both)
Lastly, the participants had to answer the following demographic questions.
Your gender
Your place of residence
Capital city
County capital
City
Village
Your age range
Below 18
18–25
26–35
36–50
Over 50
After answering the demographic questions and pressing the finish button, the questionnaire ends.
References
- Meuter, M.L.; Ostrom, A.L.; Roundtree, R.I.; Bitner, M.J. Self-service technologies: Understanding customer satisfaction with technology-based service encounters. J. Mark. 2000, 64, 50–64. [Google Scholar] [CrossRef]
- Cao, Z.; Xiao, Q.; Zhuang, W.; Wang, L. An empirical analysis of self-service technologies: Mediating role ofcustomer powerlessness. J. Serv. Mark. 2022, 36, 129–142. [Google Scholar] [CrossRef]
- Dabholkar, P.A.; Bagozzi, R.P. An attitudinal model of technology-based self-service: Moderating effects of consumer traits and situational factors. J. Acad. Mark. Sci. 2002, 30, 184–201. [Google Scholar] [CrossRef]
- Meuter, M.L.; Bitner, M.J.; Ostrom, A.L.; Brown, S.W. Choosing among alternative service delivery modes: An investigation of customer trial of self-service technologies. J. Mark. 2005, 69, 61–83. [Google Scholar] [CrossRef]
- Rogers, E.M.; Singhal, A.; Quinlan, M.M. Diffusion of innovations. In An Integrated Approach to Communication Theory and Research; Routledge: Oxfordshire, UK, 2014; pp. 432–448. [Google Scholar]
- Sahin, I. Detailed review of Rogers’ diffusion of innovations theory and educational technology-related studies based on Rogers’ theory. Turk. Online J. Educ. Technol. 2006, 5, 14–23. [Google Scholar]
- Aizstrauta, D.; Ginters, E.; Eroles, M.A.P. Applying theory of diffusion of innovations to evaluate technology acceptance and sustainability. Procedia Comput. Sci. 2015, 43, 69–77. [Google Scholar] [CrossRef]
- Scherer, A.; Wünderlich, N.V.; Von Wangenheim, F. The value of self-service. MIS Q. 2015, 39, 177–200. [Google Scholar] [CrossRef]
- Ajzen, I. Understanding Attitudes and Predictiing Social Behavior; Prentice-Hall: Englewood Cliffs, NJ, USA, 1980. [Google Scholar]
- Mathieson, K. Predicting user intentions: Comparing the technology acceptance model with the theory of planned behavior. Inf. Syst. Res. 1991, 2, 173–191. [Google Scholar] [CrossRef]
- Considine, E.; Cormican, K. Self-service technology adoption: An analysis of customer to technology interactions. Procedia Comput. Sci. 2016, 100, 103–109. [Google Scholar] [CrossRef]
- Curran, J.M.; Meuter, M.L. Self-service technology adoption: Comparing three technologies. J. Serv. Mark. 2005, 19, 103–113. [Google Scholar] [CrossRef]
- Bitner, M.J.; Ostrom, A.L.; Meuter, M.L. Implementing successful self-service technologies. Acad. Manag. Perspect. 2002, 16, 96–108. [Google Scholar] [CrossRef]
- Pantano, E.; Di Pietro, L. Understanding consumer’s acceptance of technology-based innovations in retailing. J. Technol. Manag. Innov. 2012, 7, 1–19. [Google Scholar] [CrossRef]
- Dabholkar, P.A. Consumer evaluations of new technology-based self-service options: An investigation of alternative models of service quality. Int. J. Res. Mark. 1996, 13, 29–51. [Google Scholar] [CrossRef]
- Wisastra, A.L.; Ardianyah, A.E.; Hermanto, B.A.; Luhukay, D. The Influence of Self-Service Kiosks on Customer Experience in Retail Stores. In Proceedings of the 2024 International Electronics Symposium (IES), Denpasar, Indonesia, 6–8 August 2024; IEEE: Piscataway, NJ, USA, 2024; pp. 365–370. [Google Scholar] [CrossRef]
- Hassan, M.U.; Iqbal, Z. Technology acceptance in self-service banking of Pakistan: The role of innovative and individual attributes. Int. J. Electron. Bus. 2024, 19, 311–341. [Google Scholar] [CrossRef]
- Dixon, M.; Freeman, K.; Toman, N. Stop trying to delight your customers. Harv. Bus. Rev. 2010, 88, 116–122. [Google Scholar]
- Wongyai, P.H.; Ngo, T.; Wu, H.; Tsui, K.; Nguyen, T.H. Self-Service Technology in Aviation: A Systematic Literature Review. J. Air Transp. Res. Soc. 2024, 2, 100016. [Google Scholar] [CrossRef]
- Arici, H.E.; Saydam, M.B.; Koseoglu, M.A. How do customers react to technology in the hospitality and tourism industry? J. Hosp. Tour. Res. 2024, 48, 1081–1096. [Google Scholar] [CrossRef]
- Demoulin, N.T.; Djelassi, S. An integrated model of self-service technology (SST) usage in a retail context. Int. J. Retail Distrib. Manag. 2016, 44, 540–559. [Google Scholar] [CrossRef]
- Yen, H.R. An attribute-based model of quality satisfaction for internet self-service technology. Serv. Ind. J. 2005, 25, 641–659. [Google Scholar] [CrossRef]
- Li, S. The impact of service quality, self-service technology, and the corporate image on customer satisfaction and customer revisit intention among luxury hotels in Kuala Lumpur, Malaysia. Int. J. Serv. Econ. Manag. 2020, 11, 48–70. [Google Scholar] [CrossRef]
- Kim, M.; Qu, H. Travelers’ behavioral intention toward hotel self-service kiosks usage. Int. J. Contemp. Hosp. Manag. 2014, 26, 225–245. [Google Scholar] [CrossRef]
- Nam, J.; Kim, S.; Jung, Y. Elderly users’ emotional and behavioral responses to self-service technology in fast-food restaurants. Behav. Sci. 2023, 13, 284. [Google Scholar] [CrossRef]
- Kim, G.; Park, S.A. Understanding restaurant users’ attitudes towards self-service ordering via kiosks during the COVID-19 pandemic: An application of the theory of anxiety. Tour. Hosp. Res. 2024, 24, 80–94. [Google Scholar] [CrossRef]
- Meuter, M.L.; Ostrom, A.L.; Bitner, M.J.; Roundtree, R. The influence of technology anxiety on consumer use and experiences with self-service technologies. J. Bus. Res. 2003, 56, 899–906. [Google Scholar] [CrossRef]
- Gelderman, C.J.; Paul, W.; Van Diemen, R. Choosing self-service technologies or interpersonal services—The impact of situational factors and technology-related attitudes. J. Retail. Consum. Serv. 2011, 18, 414–421. [Google Scholar] [CrossRef]
- Collier, J.E.; Moore, R.S.; Horky, A.; Moore, M.L. Why the little things matter: Exploring situational influences on customers’ self-service technology decisions. J. Bus. Res. 2015, 68, 703–710. [Google Scholar] [CrossRef]
- Gelbrich, K.; Sattler, B. Anxiety, crowding, and time pressure in public self-service technology acceptance. J. Serv. Mark. 2014, 28, 82–94. [Google Scholar] [CrossRef]
- Johnson, D.S.; Bardhi, F.; Dunn, D.T. Understanding how technology paradoxes affect customer satisfaction with self-service technology: The role of performance ambiguity and trust in technology. Psychol. Mark. 2008, 25, 416–443. [Google Scholar] [CrossRef]
- Liu, S. The impact of forced use on customer adoption of self-service technologies. Comput. Hum. Behav. 2012, 28, 1194–1201. [Google Scholar] [CrossRef]
- Venkatesh, V.; Morris, M.G. Why don’t men ever stop to ask for directions? Gender, social influence, and their role in technology acceptance and usage behavior. MIS Q. 2000, 24, 115–139. [Google Scholar] [CrossRef]
- Lee, J.; Allaway, A. Effects of personal control on adoption of self-service technology innovations. J. Serv. Mark. 2002, 16, 553–572. [Google Scholar] [CrossRef]
- Parasuraman, A. Technology Readiness Index (TRI) a multiple-item scale to measure readiness to embrace new technologies. J. Serv. Res. 2000, 2, 307–320. [Google Scholar] [CrossRef]
- Castillo-Manzano, J.I.; López-Valpuesta, L. Check-in services and passenger behaviour: Self service technologies in airport systems. Comput. Hum. Behav. 2013, 29, 2431–2437. [Google Scholar] [CrossRef]
- Chow, M.M.; Yeow, J.A.; See, C.K. Factors affecting generation Z’s intention to use self-service technology (SST). J. Bus. Manag. Account. 2022, 12, 81–96. [Google Scholar] [CrossRef]
- Kumalasari, R.A.D.; Rahardjo, K.; Kusumawati, A.; Sunarti. Self-Service Technology Use by Older Adults: Moderating Effects of Need for Interaction. KnE Soc. Sci. 2024, 9, 307–323. [Google Scholar] [CrossRef]
- Guan, X.; Xie, L.; Shen, W.G.; Huan, T.C. Are you a tech-savvy person? Exploring factors influencing customers using self-service technology. Technol. Soc. 2021, 65, 101564. [Google Scholar] [CrossRef]
- Ahn, J.A.; Seo, S. Consumer responses to interactive restaurant self-service technology (IRSST): The role of gadget-loving propensity. Int. J. Hosp. Manag. 2018, 74, 109–121. [Google Scholar] [CrossRef]
- Nicholls, R. ‘Consumption as Work’-Questioning the Meaning of ‘Retirement’in the Self-Service Economy. J. Popul. Ageing 2022, 15, 493–513. [Google Scholar] [CrossRef]
- Park, J.; Kim, D.; Hyun, H. Understanding self-service technology adoption by “older” consumers. J. Serv. Mark. 2021, 35, 78–97. [Google Scholar] [CrossRef]
- Na, T.K.; Lee, S.H.; Yang, J.Y. Moderating effect of gender on the relationship between technology readiness index and consumers’ continuous use intention of self-service restaurant kiosks. Information 2021, 12, 280. [Google Scholar] [CrossRef]
- Lee, H.J.; Lyu, J. Exploring factors which motivate older consumers’ self-service technologies (SSTs) adoption. Int. Rev. Retail. Distrib. Consum. Res. 2019, 29, 218–239. [Google Scholar] [CrossRef]
- Ha, J.H.; Kim, S.I. A study on the increase of kiosk user experience in Non-face-to-face Era for the Elderly-Focused on the McDonald Kiosk. J. Digit. Converg. 2021, 19, 285–292. [Google Scholar]
- Davis, F.D. Perceived usefulness, perceived ease of use, and user acceptance of information technology. MIS Q. 1989, 13, 319–340. [Google Scholar] [CrossRef]
- Venkatesh, V.; Davis, F.D. A theoretical extension of the technology acceptance model: Four longitudinal field studies. Manag. Sci. 2000, 46, 186–204. [Google Scholar] [CrossRef]
- Venkatesh, V.; Morris, M.G.; Davis, G.B.; Davis, F.D. User acceptance of information technology: Toward a unified view. MIS Q. 2003, 27, 425–478. [Google Scholar] [CrossRef]
- Kokkinou, A.; Cranage, D.A. Using self-service technology to reduce customer waiting times. Int. J. Hosp. Manag. 2013, 33, 435–445. [Google Scholar] [CrossRef]
- Oh, H.; Jeong, M.; Baloglu, S. Tourists’ adoption of self-service technologies at resort hotels. J. Bus. Res. 2013, 66, 692–699. [Google Scholar] [CrossRef]
- Curran, J.M.; Meuter, M.L.; Surprenant, C.F. Intentions to use self-service technologies: A confluence of multiple attitudes. J. Serv. Res. 2003, 5, 209–224. [Google Scholar] [CrossRef]
| Disclaimer/Publisher’s Note: The statements, opinions and data contained in all publications are solely those of the individual author(s) and contributor(s) and not of MDPI and/or the editor(s). MDPI and/or the editor(s) disclaim responsibility for any injury to people or property resulting from any ideas, methods, instructions or products referred to in the content. |
© 2024 by the authors. Licensee MDPI, Basel, Switzerland. This article is an open access article distributed under the terms and conditions of the Creative Commons Attribution (CC BY) license (https://creativecommons.org/licenses/by/4.0/).


