Article

PatchRLNet: A Framework Combining a Vision Transformer and Reinforcement Learning for The Separation of a PTFE Emulsion and Paraffin

1
School of Mathematical Science, University of Electronic Science and Technology of China, Chengdu 611731, China
2
Yangtze Delta Region Institute (Quzhou), University of Electronic Science and Technology of China, Quzhou 324003, China
3
School of Computer Science and Engineering, University of Electronic Science and Technology of China, Chengdu 611731, China
*
Author to whom correspondence should be addressed.
Electronics 2024, 13(2), 339; https://doi.org/10.3390/electronics13020339
Submission received: 4 December 2023 / Revised: 3 January 2024 / Accepted: 5 January 2024 / Published: 12 January 2024
(This article belongs to the Special Issue Advances in Artificial Intelligence Engineering)

Abstract

:
During the production of a PolyTetraFluoroEthylene(PTFE) emulsion, it is crucial to detect the separation between the PTFE emulsion and liquid paraffin in order to purify the PTFE emulsion and facilitate subsequent polymerization. However, the current practice heavily relies on visual inspections conducted by on-site personnel, resulting in not only low efficiency and accuracy, but also posing potential threats to personnel safety. The incorporation of artificial intelligence for the automated detection of paraffin separation holds the promise of significantly improving detection accuracy and mitigating potential risks to personnel. Thus, we propose an automated detection framework named PatchRLNet, which leverages a combination of a vision transformer and reinforcement learning. Reinforcement learning is integrated into the embedding layer of the vision transformer in PatchRLNet, providing attention scores for each patch. This strategic integration compels the model to allocate greater attention to the essential features of the target, effectively filtering out ambient environmental factors and background noise. Building upon this foundation, we introduce a multimodal integration mechanism to further enhance the prediction accuracy of the model. To validate the efficacy of our proposed framework, we conducted performance testing using authentic data from China’s largest PTFE material production base. The results are compelling, demonstrating that the framework achieved an impressive accuracy rate of over 99% on the test set. This underscores its significant practical application value. To the best of our knowledge, this represents the first instance of automated detection applied to the separation of the PTFE emulsion and paraffin.

1. Introduction

PTFE emulsion, a water-based suspension renowned for its outstanding non-stick, corrosion-resistant, and electrical insulating properties, plays a crucial role in various fields such as automotive, electrical insulation, and fiber processing. In the production process of the PTFE emulsion, it is imperative to achieve effective separation between the PTFE emulsion and liquid paraffin to enhance the purity of the PTFE emulsion and facilitate subsequent polymerization [1]. Current technologies often rely on visual inspection conducted by on-site personnel, sometimes necessitating direct contact. However, given that the PTFE emulsion and paraffin solution in this process are typically present at elevated temperatures (ranging from 90 to 100 degrees Celsius), the on-site paraffin vapor may cause harm or irreversible damage to the human respiratory system. Furthermore, if solidified deposits in the pipeline are not promptly cleared, this may even lead to pipeline explosions, posing a significant threat to the life safety of workers. Therefore, achieving the automated detection of paraffin separation in the PTFE emulsion is of paramount research and practical significance. To the best of our knowledge, our research team was the first to accomplish the automated detection of PTFE emulsion–paraffin separation and has successfully applied it in practical production activities.
Artificial intelligence (AI) is a burgeoning discipline aimed at enabling machines to perform complex tasks that traditionally require human intelligence [2,3,4,5]. Among these, deep learning stands out as a key area in AI research, achieving breakthroughs in numerous practical production activities [6,7]. Leveraging deep learning for the automated detection of PTFE emulsion and paraffin separation can circumvent on-site personnel contact, thereby enhancing the production efficiency and product quality of PTFE materials. According to studies, vision transformer networks have proven to be one of the most promising architectures for addressing computer-vision tasks. They can capture not only the global features of the target, but also learn long-distance relationships between features, finding extensive research and application in industrial automation [8,9]. However, due to their lack of local inductive biases, vision transformer networks are often challenging to train and exhibit a higher dependence on training data. This leads to high challenges in the practical application of using vision transformer networks for the automatic detection of paraffin separation. Building upon this foundation, in real-world PTFE emulsion production environments, the collected video image data is frequently subject to substantial interference from background environments and noise. This further exacerbates the challenges associated with model training. In instances of insufficient data volume, it may even result in the inability to train the vision transformer model. Performing key feature selection on video images allows the vision transformer model to focus more on the crucial features of the target while disregarding surrounding environmental backgrounds or noise. Research indicates that this not only enhances the efficiency of model training but also enables the targeted learning of critical objectives, thereby significantly improving model performance [10,11,12]. Therefore, the most critical challenge in this study lies in achieving key feature selection for the vision transformer network.
Reinforcement learning has been demonstrated as one of the most effective methods for achieving optimal and efficient policy selection [13,14]. By leveraging the interaction between an agent and its environment, reinforcement learning can formulate optimal strategies based on environmental feedback [15,16,17]. In this study, we establish a reinforcement learning framework with the vision transformer classification model serving as the environment. The process involves considering the selection of key features as the benchmark for rewards, where the weight generator embedded in the model’s embedding layer is designated as the agent. The primary objective of this framework is to optimize the extraction of key features via the reinforcement learning process. The agent dynamically generates attention weights for the input patches based on the input image. Subsequently, these patches, enriched with attention weights, undergo positional and class embeddings. This amalgamated information then serves as the input to the Transformer encoder, influencing the prediction scores generated by the vision transformer classifier. The reinforcement learning process can be viewed as an interactive interplay between the vision transformer classifier and the weight generator, autonomously selecting the crucial features of the target. Therefore, this paper proposes a paraffin separation automated detection framework named PatchRLNet, which combines the vision transformer and reinforcement learning. This framework constrains the vision transformer network to adaptively perform key feature selection for model input, stabilizes the training dynamics of the vision transformer network, reduces its dependence on data, and enhances its overall performance.
Building upon this foundation and considering various interferences present in real PTFE emulsion production scenarios, such as occluded monitoring cameras and insufficient illumination, which may significantly diminish the detection performance of the model and even render it inoperable, we introduce a multimodal integration mechanism. This mechanism allows the PTFE emulsion automated detection model to gather more comprehensive information from two different perspectives [18,19]. By adopting this strategy, we enable the model to acquire target feature information from different angles; this can effectively reduce the impact of potential interference on the performance of detection models in real scenarios, improve the model’s ability to cope with and adapt to complex work scenarios, and ensure the sustained and stable operation of the proposed PTFE emulsion and paraffin separation detection framework.
To the best of our knowledge, there is currently no work within the community that combines deep learning for the automated detection of PTFE emulsion and paraffin separation. This implies that we are the first to undertake the task of PTFE emulsion and paraffin separation automated detection using deep learning technology. Based on real industrial scenarios in PTFE emulsion production, we have validated the performance of the proposed framework and further applied it to practical production activities. Through these efforts, we have not only addressed a research gap in this field but have also provided an innovative solution for the automated detection of PTFE emulsion and paraffin separation in industrial production. The contributions of this paper include the following: 1. A large sample and high-definition multi-mode PTFE emulsion–paraffin separation and detection research queue was collected and constructed in the production base of Quzhou Juhua Fluoropolymer Company. As far as we know, this is the only relevant dataset available in the community at present. 2. Combining the vision transformer and reinforcement learning, we have constructed a PTFE emulsion–paraffin separation framework PatchRLNet, with high precision and high generalization ability, and encapsulated it as an operational system. 3. At the production base of Quzhou Jusheng Fluorine Chemical Co., Ltd., we applied the proposed model for the separation of the PTFE emulsion and paraffin in actual production processes, achieving an accuracy exceeding 99%. This thoroughly demonstrates the effectiveness of our proposed framework and the feasibility of reinforcement learning in the key feature selection of vision transformer networks. Furthermore, the research results indicate that our proposed framework has substantial practical application value in the actual industrial production of the PTFE emulsion.

2. Related Work

Currently, works involving the automatic detection of liquids using deep learning based on videos or images primarily fall into two types: those based on traditional convolutional neural networks(CNNs) and those based on vision transformer models. Each of these types has its own advantages and disadvantages.
According to relevant research, the use of convolutional neural networks can better and more automatically analyze optical visible phenomena, thereby broadening the scope of non-invasive measurement. At the same time, because additional process parameters can be monitored, this allows for additional sensors based on convolutional neural networks to control data via more accurate process control. Therefore, Laura Neuendorf et al. [20] proposed a method of analyzing a single rising droplet to determine its physical characteristics. In the field of flow mode recognition, the determination of streaming type is vital to predicting the prediction of non-stable flow parameters and directly affects the integrity management of multi-phase current pipelines. Haobin Chen et al. [21] proposed a non-invasive and robust convolutional neural network flow pattern recognition method based on FIV analysis. The method involves the simultaneous analysis of collected FIV signals and high-speed videos, conducting experimental studies on FIV in horizontal gas–liquid pipe flows under various flow patterns and extracting their features. Finally, a neural network architecture trained by GoogLeNet is employed for the pattern recognition of the flow, achieving an accuracy exceeding 95%. In addition, Dongming Liu et al. [22] proposed a lightweight hazardous liquid detection method based on the depth-based canolate convolution for X-ray safety inspection. In this study, dual-energy X-ray data, instead of pseudo-colored images, are used as the object to be tested. Researchers have proposed a new detection framework by designing a lightweight object positioning network and lightweight hazardous liquid classification network based on the depth separation of convolution and squeezing incentive modules to reduce the cost of calculation and achieve the parallel operation of detection and imaging. In [23], considering the generalization and feature extraction capabilities of convolutional neural networks, they were applied to computational applications for liquid flow velocity. Under the conditions of large-scale data with different soil properties and various solid-phase fractions, using normalized electrical resistivity tomography images as an input to the network, and the corresponding flow rates as an output, the study utilized convolutional neural networks to calculate the fluid flow velocity, resulting in an average accuracy improvement of approximately 21%.
While CNNs have been widely applied in automatic liquid detection, they face potential challenges due to their common use of fixed-sized convolutional kernels, particularly when confronted with liquids of varying scales. Moreover, CNNs often exhibit local inductive biases, making them susceptible to the impact of noise in the environment. In contrast, vision transformer networks incorporate a self-attention mechanism, enhancing their ability to model long-range relationships between features. This capability proves notably effective in globally capturing image relationships, offering a distinct advantage for liquid detection tasks in complex environments. Furthermore, the vision transformer demonstrates heightened flexibility compared to CNNs when handling information across different scales and hierarchical levels.
Therefore, the vision transformer has also been applied to the detection of liquid states. Sesame oil (SO), as a high-value edible oil, is often subject to counterfeiting and adulteration. Zhilei Zhao et al. [24] proposed a novel approach based on Excitation Emission Matrix Fluorescence (EEMF) and a Total Synchronous Fluorescence (TSyF) spectral stereogram. This method utilizes a vision transformer network for the recognition of sulfur dioxide (SO) quality. Basic samples including pure, counterfeit, and adulterated SO were characterized via fluorescence spectroscopy. At the same time, for a small amount of sample learning, the data enhancement strategies including linear interpolation, displacement, and noise injection were selected. Finally, the author designed and trained a ViT network architecture based on an attention mechanism, thereby establishing four SO quality recognition models. In [25], Hongliang Li et al. demonstrated a liquid recognition scheme based on the vision transformer network, which combines an optical flow-controlled refractive index sensor with visual intelligence algorithms and does not require a spectrometer and precise metasurface mediation, further demonstrating the role of the vision transformer network in liquid-state detection. In addition, You Wu et al. [26] proposed a dataset for detecting liquid content in transparent containers (LCDTC), leading to an innovative task involving transparent container detection and liquid content estimation. The dataset proposed by the author developed two baseline detectors, called LCD-YOLOF and LCD-YOLOX, and further proposed a Swin Transformer Integration (WISTE) method for automatically identifying the water index of water bodies. Firstly, a dual-branch encoder architecture was devised for the Swin Transformer, leveraging the aggregation of a fully convolutional network (FCN) and a multi-head self-attention mechanism to capture global semantic information and pixel neighborhood relationships of the target. Secondly, to prevent the Swin Transformer from disregarding multispectral information, the authors constructed a prediction map integration module. Finally, based on the Swin Transformer and the Normalized Difference Water Index (NDWI), the accurate identification of water indices was achieved.
Inspired by the work on liquid detection using traditional Convolutional Neural Networks and vision transformer models, we introduce deep learning models into two distinct industrial scenarios involving the separation of different types of liquids. To the best of our knowledge, this study represents the first application of deep learning models to the separation of the Polytetrafluoroethylene emulsion and high-temperature liquid paraffin. In our work, the separation scenarios of the PTFE emulsion and high-temperature liquid paraffin are intricate, encompassing multiple pipelines, each with a stochastic operational state. Concurrent operation of multiple pipelines is also a possibility. We undertake the task of liquid-state pattern recognition by analyzing the morphological color of the liquid flowing out of the operational pipelines and the splash patterns when the liquid comes into contact with the paraffin reservoir. When comparing liquid-state recognition models based on CNNs and the vision transformer, it is observed that the CNN-based approach achieves higher accuracy when the liquid state is clear and there is minimal environmental noise. This is attributed to its ability to utilize local inductive biases to better capture the local details of the target, thereby enhancing detection accuracy while reducing sample dependency. However, in our dataset, characterized by abundant environmental backgrounds and noise, employing CNNs as the primary framework may lead to the misinterpretation of noise as valid image features or the masking of valid features by noise, resulting in reduced detection performance. In contrast, the self-attention mechanism in the vision transformer network enables effective modeling of critical features, capturing long-range relationships between features and, consequently, global information about the target. This process proves efficient in mitigating the impact of background and noise on the model. This motivates our adoption of the vision transformer network for the task of PTFE emulsion and paraffin separation automatic detection. However, existing vision transformer methods still face challenges in terms of reliability and effectiveness, particularly in more complex scenarios. This difficulty stems from the intricate nature of background environments and noise within the PTFE emulsion–paraffin separation detection scene, coupled with a relatively sparse presence of target content. Additionally, the limited sample size poses challenges for vision transformer methods in effectively modeling crucial features.

3. Materials and Methods

3.1. Research Queue and Data Augmentation

The research data for this study were obtained from the actual production processes of the Fluoropolymer Division within Ju Sheng Fluorochemical Co., Ltd., a subsidiary of Zhejiang Juhua Co., Ltd., located in the city of Quzhou, Zhejiang Province, China. Zhejiang Juhua Co., Ltd. stands as the largest and most influential enterprise in the field of fluorine chemical research and manufacturing in China, and it is also situated in the city of Quzhou, Zhejiang Province. The research data included in this study were collected from the authentic production processes of the PTFE emulsion–paraffin separation equipment within the PTFE Production Unit of the Fluoropolymer Division from 18 October 2023 to 23 October 2023. Two Hikvision MV-CU050-60GM 5-megapixel industrial area-scan cameras were employed to comprehensively capture the entire process of PTFE emulsion–paraffin separation from two distinct perspectives. The lens used in this setup is the ZX-SF0820C, an 8 mm fixed-focus industrial vision lens. We collected a total of 463 video segments from two perspectives and randomly divided them into training and testing sets in a 7:3 ratio. To ensure the reliability of the collected data, the videos were captured in a single-channel AVI format with a resolution of 2592×1944 and a capture rate of 30 frames per second. To ensure the continuous and stable operation of the PTFE emulsion–paraffin separation detection system in an industrial setting, the labels for video images included four categories: “occlusion”, “paraffin”, “emulsion”, and “idle”. The “occlusion” label refers to instances where the camera view of the paraffin pipeline is completely covered by personnel or other objects, potentially triggering an alarm mechanism in the system when such a condition persists over an extended period. To ensure the reliability of the data, all labels were annotated by four personnel with more than three years of work experience. Subsequently, two additional personnel, each with more than five years of work experience, conducted a review of the annotations. Finally, we obtained 10,548 obstructed images, 49,030 paraffin images, 77,134 emulsion images, and 99,418 idle images from the two perspectives.
To enhance the model’s processing speed for real-world scenarios, we initially resize video images to a standard size of 224 × 224. To address the issue of imbalanced sample quantities across different states leading to a long-tail problem, we perform oversampling on classes with fewer samples to balance the quantity of different state samples in the training queue. This helps mitigate the impact of data imbalance on model training, ensuring effective learning across various states. To prevent oversampling from causing overfitting on the training data and a decrease in generalization performance on unseen data, we employ data augmentation methods, including random cropping, random rotation, random noise, Random Erasing, random brightness, and random contrast. These methods diversify the training dataset, enhancing the model’s generalization performance. Specifically, in the industrial setting of wax emulsion, where complex noise surrounds the target pipes, random cropping enables the model to learn invariance to target positions, improving robustness across different target locations. In real production scenarios, where cameras are inevitably touched, leading to changes in the angle of captured images, random rotation assists the model in learning features from different angles, increasing robustness to rotational variations. Considering the high temperatures in real production environments that may cause solid condensation of PTFE on cameras, introducing random noise helps the model robustly handle real-world noise and interference. Although extended complete obstruction triggers an alarm mechanism, for inevitable short-term local obstructions, we utilize random erasing to simulate potential obstructions or missing information, aiding the model in learning robustness to partial information loss and improving its ability to handle incomplete information. Finally, to enable the model to adapt to varying lighting conditions in complex environments, we introduce random brightness and random contrast to simulate real-world scenarios. The aforementioned data augmentation techniques not only simulate various challenges the model may encounter in real scenarios, but it also provides the model with diverse data patterns, enhancing its generalization capabilities and effectively reducing the likelihood of overfitting issues.

3.2. Method

In PatchRLNet, the vision transformer model primarily consists of three key components: image partitioning and embedding, class embedding, positional encoding, and the vision transformer encoder. Specifically, the image partitioning and embedding stage involve segmenting the input image into a set of non-overlapping square patches, which are then embedded into a low-dimensional space to create the initial representation of the image. This process aims to extract local image features of the target. Building upon this foundation, the vision transformer network introduces positional encoding to the embedded image features. This incorporation of positional encoding establishes spatial relationships for the model’s understanding of the positional context of the image embeddings. This assists the model in comprehending the relative positions between different partitions of the image, thereby facilitating a more effective capture of global contextual relationships. Finally, the sequence of image features, after partitioning, embedding, and positional encoding, is input into the vision transformer encoder, which is composed of consecutive vision transformer encoding blocks. These encoding blocks, operating at different scales and levels, progressively extract high-level semantic features of the target. Throughout this process, the self-attention sub-layers within the vision transformer encoding blocks utilize a multi-head self-attention mechanism. This mechanism performs correlation calculations on different positions of the patches to capture relationships between features at both global and local levels.
Considering the various potential disturbances such as insufficient lighting, obstacles obstructing the view, and a cluttered background that may be present in real manufacturing processes, the vision transformer model might encounter challenges in feature extraction due to high-dimensional and complex features. As a result, it becomes challenging to efficiently extract and analyze critical information. To address this issue, unlike the conventional approach of directly concatenating each patch in the embedding layer in a sequential manner, we introduce reinforcement learning to provide an interpretable attention score for each patch in the encoding sequence. This allows the vision transformer model to focus more on crucial features while ignoring background environments and noise. This not only enhances the feature extraction efficiency of the vision transformer model in complex scenarios, but also incorporates a reinforcement learning framework tailored to the model input. In this process, a reinforcement learning framework oriented towards the model input is integrated into the internal structure of the vision transformer model. This framework dynamically adjusts attention scores for different patches, increasing sensitivity to critical information, and thus, is better at addressing background environments and noise interferences. This integrated reinforcement learning strategy enhances the adaptability and robustness of the vision transformer model, thereby improving the accuracy and stability of PTFE emulsion–paraffin separation automated detection. To provide a more comprehensive description of our proposed model, PatchRLNet, we will introduce our approach in two parts: reinforcement learning for enhancing key patch features and PatchRLNet model for the separation of PTFE emulsion and paraffin, as detailed below.

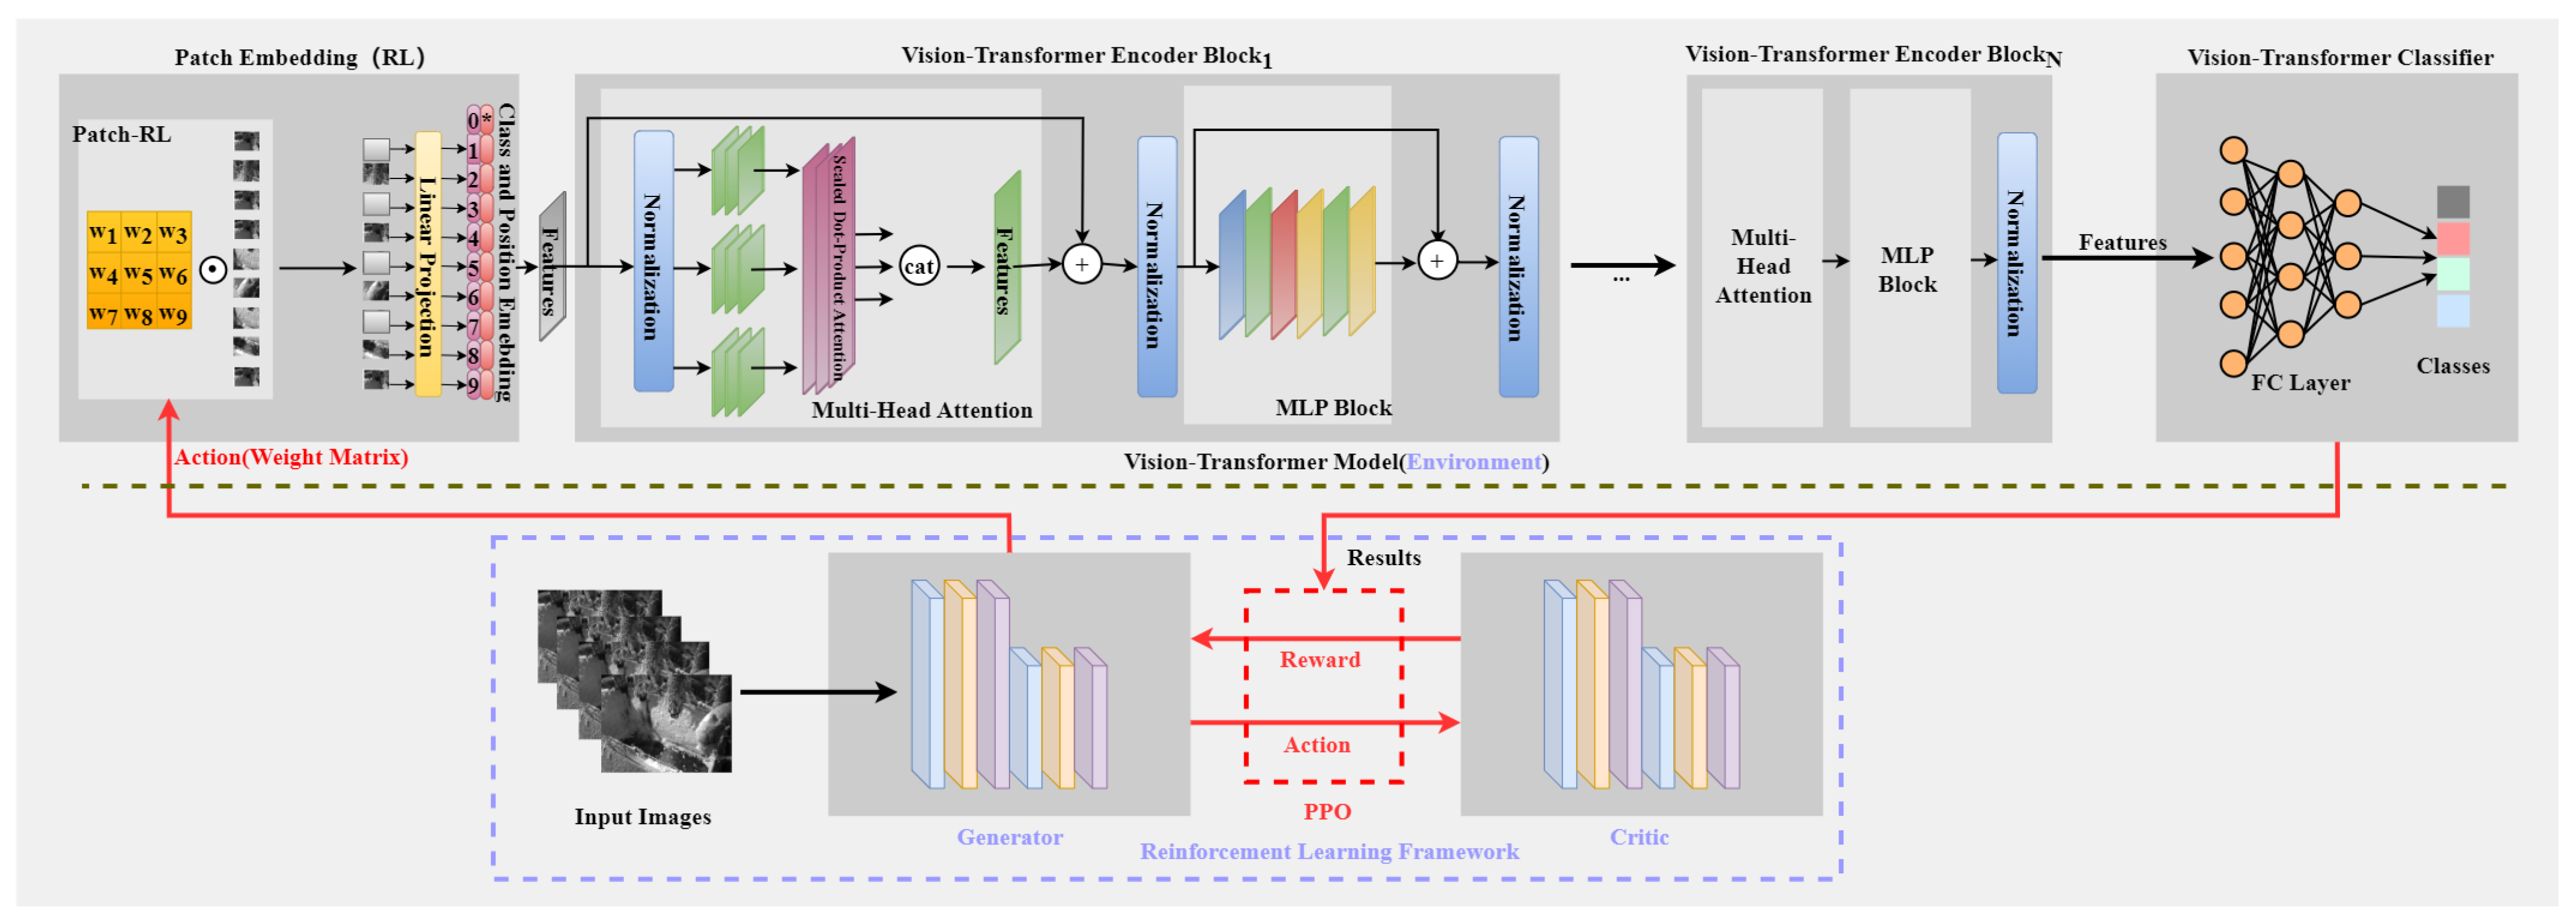
3.2.1. Reinforcement Learning for Enhancing Key Patch Features

Considering a standard Reinforcement Learning (RL) formulation, we can describe it using the tuple < S , A , T , r , π > , where S is the observation space, A is the action space, and T is the transition function that generates the next state from the current state–action pair. The function r represents the reward function, evaluating the value for the current action. The objective of this process is to learn a policy π that maximizes the expected return reward. Within our reinforcement learning framework, the vision transformer classification model operates as the environment, with a weight generator embedded in the vision transformer network’s embedding layer serving as the agent. The iterative process of reinforcement learning unfolds as an intricate interplay between the vision transformer classification model and the weight generator. In this framework, the input to the vision transformer model is conceptualized as the state, and the weight generator, influenced by the input state and the current environment, produces a weight matrix representing the action in the reinforcement learning process, aimed at selecting pertinent key features. In this dynamic setting, the vision transformer classification model provides actionable feedback to determine rewards. These rewards, derived from the output results of the vision transformer classifier, serve as the foundation for updating the weight generator. This configuration establishes a cyclical process where the weight generator refines its strategy based on the received rewards, ultimately influencing its actions in adapting to the evolving input states and environment. Represent the decision-making process of the agent (generator) using M = < S , A , T , r , π > . Similarly, express the classification process of the vision transformer classification model with the function of F ( Θ ; S a ) = < Θ ; S a ; r a > . In this context, the reward for the agent can be formalized as
r = r a b e n c h m a r k
where r a represents the feedback from the environment under action a, and the benchmark is employed to generate negative rewards.
The changes in other key elements can be expressed as follows:
π : S × A π A : A < r , π >
In this context, A < r , π > represents the decision made by the agent based on rewards and the previous policy. The state always corresponds to the input images for the vision transformer model, so the transformation function T remains constant and unaffected by actions. On the other hand, the transformer model operates on weighted patches, where μ represents the initial two-dimensional sequence obtained by partitioning and embedding the input image, and w denotes the weight distribution generated by the agent, so we can say that
S a = μ × w
Finally, S a is integrated into the vision transformer encoder along with positional embeddings and category information. This implies that the vision transformer model, leveraging the output from the weight generator, allocates attention scores to individual patches. These scores are then multiplied to amplify or attenuate the weight distribution of specific patches, thereby fulfilling the essential role of feature selection.

3.2.2. PatchRLNet for the Separation of PTFE Emulsion and Paraffin

Figure 1 illustrates the framework of PatchRLNet: Firstly, video images captured by the camera undergo data augmentation and are then converted into tensors, serving as the input for PatchRLNet. Within the model, the weight generator (Generator G) generates a weight matrix of n × n based on the input, where each weight represents the model’s attention to the corresponding patch in the embedding layer. The weight generator sends this weight matrix as an action to the embedding layer of the vision transformer network, multiplying it with the patch sequence of the corresponding image. After undergoing linear mapping and positional embedding, this processed data serve as the input to the vision transformer encoder, which is composed of multiple vision transformer encoding blocks. In each vision transformer encoding block, multiple multi-head attention sub-layers and multi-layer perceptron blocks are employed to extract features from the input image sequence. Finally, extract the class token from the last encoding block of the vision transformer and use it as input for the vision transformer classifier, facilitating the prediction of scores for each potential class.
The input to the vision transformer model is X i m a g e R c × h × w with a shape of h × w and a channel of c [27,28]. Due to the vision transformer encoder’s input being a two-dimensional sequence shaped like x 1 , x 2 , , x n , we divide the input image into n 2 patches and transform it into a sequence X = x 11 , x 12 , , x 1 n , , x n n , where x i j R c × h n × w n . We utilize reinforcement learning to obtain a weight matrix W that represents the attention levels for the n 2 patches.
W = G s t a t e
where the state is the input X i m a g e , and G is the generator network consisting of convolutional layers and pooling layers, W R n × n .
For sequence X = x 11 , x 12 , , x 1 n , , x n n , after applying reinforcement learning, it can be written as
X = X 11 , X 12 , , X 1 n , , X n n X i j = x i j + w i j x i j
where w i j represents the element in the i-th row and j-th column of W, between −1 and 1. When w i j = 1 , the values of elements in the patch will be set to 0. In this scenario, the model regards the content of this patch as background or noise and discards it. When w i j = 1 , the values of elements in the patch will be enhanced, at which point the model identifies the contents of this patch as crucial features and prioritizes the extraction and analysis of the features in this specific region.
Research suggests that utilizing a two-dimensional sequence X = ( X 11 , X 12 , , X 1 n , , X n n ) as the input for the vision transformer encoder effectively reduces the computational complexity of the model. However, due to the parallel nature of patches in the input sequence, unlike the sequential nature of RNN inputs, it is necessary to add positional and class embeddings to each dimension of the sequence X to obtain an optimized sequence Z.
Z = X 1 + P E 1 , X 2 + P E 2 , , X m + P E m , X c l a s s m 1 , 2 , , n 2 X c l a s s R C × h n × w n
where
P E k = P E p o s k , 0 , P E p o s k , 1 , , P E p o s k , d m o d e l 1 ; k 1 , 2 , , n 2
In this context, d m o d e l represents the dimensions of each X i , and p o s k indicates the patch at the k-th position.
P E p o s , 2 i = s i n p o s / 10 , 000 2 i / d m o d e l P E p o s , 2 i + 1 = c o s p o s / 10 , 000 2 i / d m o d e l
Thus, it can be inferred that for a specific dimension of the position vector of p o s k + m , it can be expressed as a linear combination of the positions of p o s k and m, indicating that the position vector encapsulates relative positional information. Hence, the vision transformer model can employ self-attention mechanisms to capture the relationships between global and local features when processing image patches.
Upon inputting the sequence Z, embedded with positional information into a series of interconnected vision transformer encoding blocks, we can say that
Z = M S A L N ( Z ) + Z Z = M L P L N ( Z ) + Z
In the multi-head self-attention (MSA) layer, the input sequence Z is individually mapped to three learnable weight matrices denoted as W Q , W K , and W V . This results in obtaining the corresponding variables Q = Z W Q , K = Z W K , and V = Z W V . Building upon this foundation, they are partitioned into h segments based on the number of heads, and each segment is fed into a separate self-attention mechanism. The results are then concatenated to obtain the final outcome. On this basis, Q, K, and V are further mapped to h different spaces based on the number of heads. Subsequently, they are individually input into self-attention mechanisms to extract features. Finally, the outcomes are consolidated to yield the ultimate result. The mathematical formulation for this process is as follows:
M S A Q , K , V = C o n c a t h e a d 1 , , h e a d h W O h e a d i = A t t e n t i o n Q W i Q , K W i K , V W i V A t t e n t i o n Q , K , V = s o f t m a x Q K T d k V
Here, d k represents the dimensionality of K.
The MLP layer primarily comprises two linear transformations and a GELU activation function, which indicates that the input of the vision transformer classifier defined as Y is the sum of the output of the MLP layer and Z. That is to say,
Y = M L P L N Z + Z
Finally, the vision transformer classifier is composed of a linear layer and a ReLU activation function. Similar to traditional vision transformer models, we utilize the category token γ ( 0 ) (i.e., X c l a s s ) instead of extracted image features as the input for the classifier. Training our network involves employing the cross-entropy (CE) loss between predictions and ground truth, which can be expressed as follows:
L C E = y l o g y ^ + ( 1 y ) l o g ( 1 y ^ )
where y is the true label, and y ^ is the predicted probability. The loss function captures the discrepancy between the true label and the predicted probability.
To ensure that the reinforcement learning framework can generate appropriate weight matrices for image sequences, similarly, the training of the weight generator and evaluation network follows the Proximal Policy Optimization-Clip (PPO-C) strategy. PPO is a novel class of policy gradient methods used in reinforcement learning. It samples data by interacting with the reinforcement learning environment, and it optimizes an alternative objective function using a backward stochastic gradient descent strategy. This strategy introduces a similarity constraint to prevent the distance between the output policy and the target policy from being too large in importance sampling. We summarize this similarity constraint as follows:
J P P O C θ k s t , a t min p θ a t s t p θ k a t s t A θ k s t , a t , c l i p p θ a t s t p θ k a t s t , 1 ε , 1 + ε A θ k s t , a t
By incorporating reinforcement learning into the embedding layer of the vision transformer network, we achieve a crucial feature selection process, mitigating the interference of environmental factors and noise. This ensures that the model can better capture global features of the target while focusing more on key features. Ultimately, this enhances the detection accuracy and performance of the model.

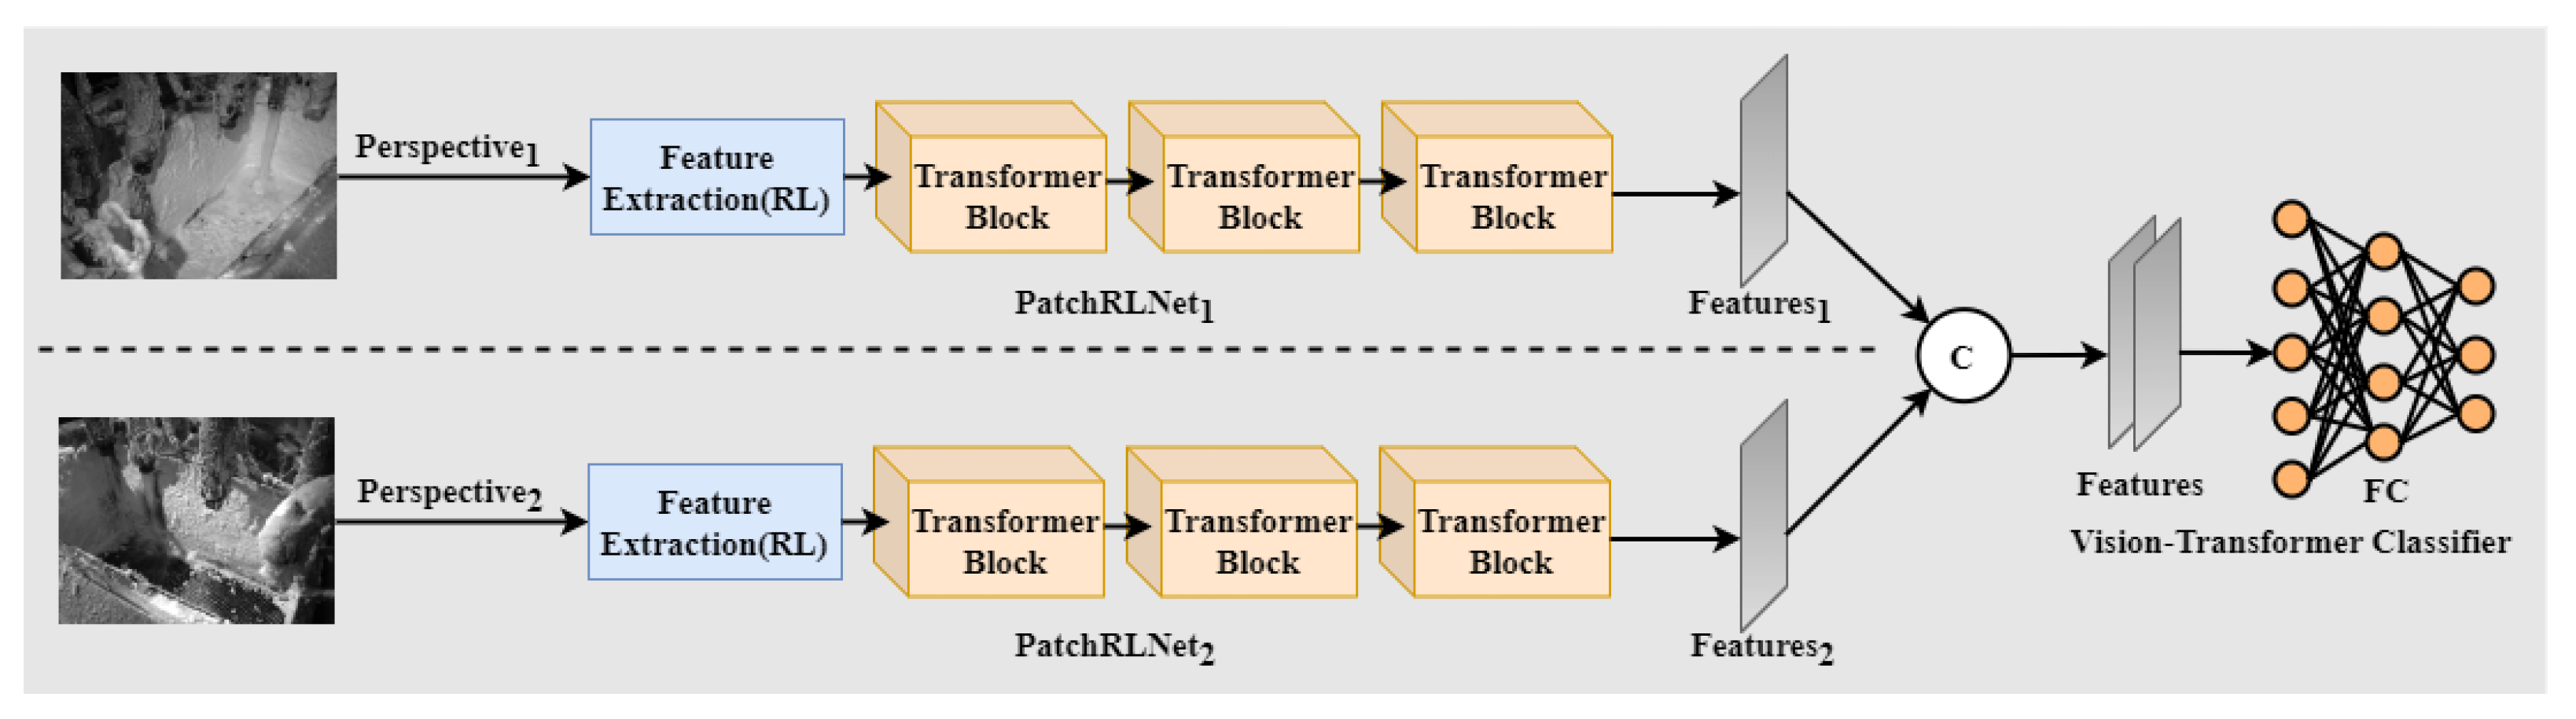
3.3. Detection for PTFE Emulsion–Paraffin Separation Based on Multimodality

3.3.1. Multimodality

Due to the substantial environmental backgrounds and noise interference present in real PTFE emulsion production scenarios, especially potential occlusion, there is a risk of significant impact on the model’s detection performance. To address this issue, we introduced a multimodal mechanism into the PTFE emulsion–paraffin separation automatic detection system to ensure the model’s consistent and stable operation. By capturing video images on both sides of the PTFE emulsion–paraffin separation device, we effectively mitigate the impact of various interferences on the model’s detection, thereby enhancing its robustness. Additionally, the combination of both modalities feeds more comprehensive information to the model. The integration of information from different perspectives allows the model to receive more data support for classification, thereby improving its detection performance.
Figure 2 illustrates the multimodal process for the automated detection of PTFE emulsion–paraffin separation. Image sequences X 1 and X 2 , acquired from two different viewpoints, serve as inputs for two PatchRLNet models—PatchRLNet 1 and PatchRLNet 2 . Both PatchRLNet 1 and PatchRLNet 2 share the same architecture and undergo independent training. Subsequently, by modifying the output of PatchRLNet, we use it as different branches for the classifier to achieve integration. Specifically, the latent representations obtained from the backbone structures of PatchRLNet 1 and PatchRLNet 2 are added, and the resulting new class token is input into the vision transformer classifier to obtain the final result.

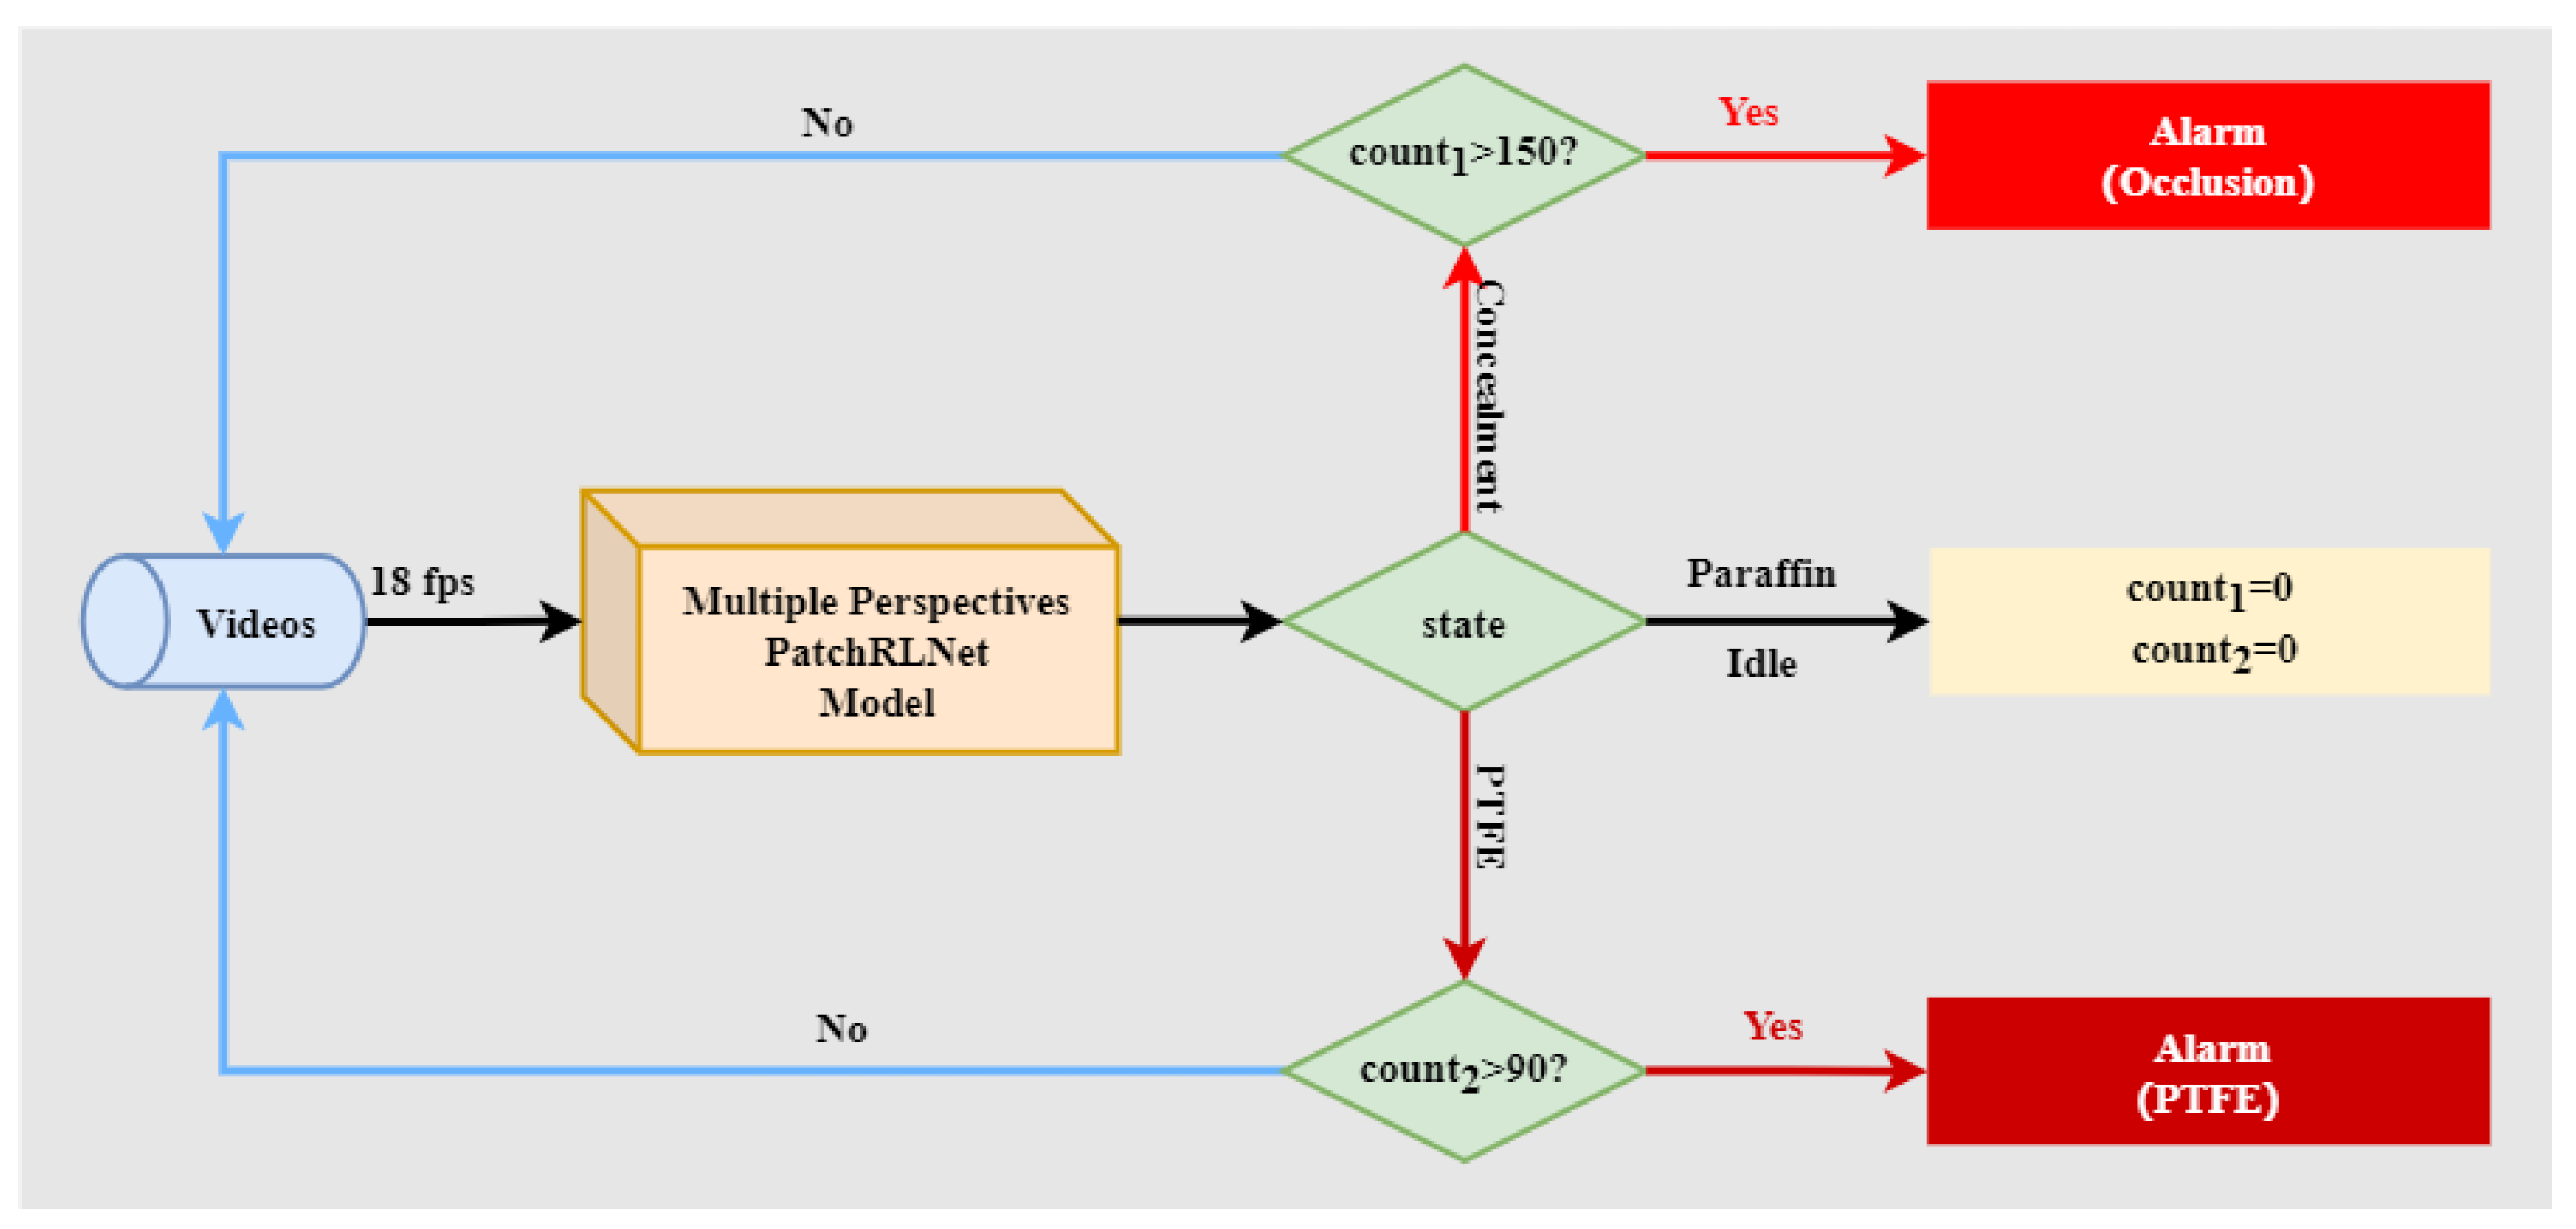
3.3.2. Engineering Control of Paraffin Separation from PTFE Emulsion

In accordance with the requirements of the PTFE emulsion production from the Fluoropolymer Division of Ju Sheng Fluorine Chemical Co., Ltd., we encapsulated the proposed PTFE emulsion–paraffin separation automatic detection model into a deployable system and utilized it in real production processes. Figure 3 illustrates the operational workflow of the PTFE emulsion–paraffin separation detection system.
In the actual production process of the PTFE emulsion, occlusions may occur due to the operational needs of on-site personnel, potentially leading to brief interruptions in the camera view. To mitigate continuous alarms triggered by these momentary occlusions, we implemented a counting mechanism for occlusions. The system issues an alert only when the output state is occluded 150 consecutive times (within a 5 s interval), indicating an unexpected obstruction of the lens by some object. Otherwise, the model restarts the counting process. Similarly, the system issues an alert to personnel to close the valve only when the model detects continuous PTFE emulsion overflow for 3 s. All thresholds mentioned are set based on the actual requirements of the enterprise and can be adjusted as needed when applied to different scenarios.

4. Results

4.1. Performance Evaluation Method

We conducted a thorough validation of the proposed PTFE emulsion–paraffin separation detection system using accuracy, average accuracy, and Micro-average F 1 S c o r e metrics to ensure its reliable precision and generalization capabilities. In this context, A c c u r a c y is a straightforward and intuitive performance metric commonly employed in classification problems. It signifies the proportion of samples correctly predicted by the model out of the total number of samples. The calculation is expressed via the following Formula (14):
A c c u r a c y = N u m b e r o f C o r r e c t P r e d i c t i o n s T o t a l N u m b e r o f P r e d i c t i o n s
However, A c c u r a c y is easily influenced by the imbalance of sample categories. When the A c c u r a c y of a state with a larger number of samples is low, while the A c c u r a c y of the remaining states is high, the overall A c c u r a c y tends to be lower. Conversely, when a state with a larger number of samples has high A c c u r a c y , while the A c c u r a c y of the remaining samples is low, the overall A c c u r a c y may appear higher. Therefore, A c c u r a c y alone cannot fairly assess the performance of a model in the presence of imbalanced data. Instead, A v e r a g e A c c u r a c y is a crucial performance metric, particularly suitable for evaluating the overall effectiveness of a model in tasks such as classification or information retrieval. As a relative measure rather than an absolute one, it allows for a robust evaluation of model performance even in the presence of sample imbalance. It can be formalized as
A v e r a g e A c c u r a c y = i = 1 N ( C l a s s e s ) A c c u r a c y i N ( C l a s s e s )
where N ( C l a s s e s ) represent the number of classes (typically four in this study), and A c c u r a c y i corresponds to the A c c u r a c y of class i.
The Micro-average F 1 S c o r e is one of the performance evaluation metrics in multiclass classification problems. It calculates the F 1 S c o r e by comprehensively considering the sum of true positives, false positives, and false negatives for each class. The advantage of the Micro-average F 1 S c o r e lies in its equal treatment of each class and a stronger emphasis on the overall performance. This makes it suitable for multiclass classification problems with imbalanced class distributions, where the importance of certain classes may be greater than others. It can be formalized as
Micro-average F 1 S c o r e = T r u e P o s i t i v e s T r u e P o s i t i v e s + 1 2 ( F a l s e P o s i t i v e + F a l s e N e g a t i v e s )
In this context, T r u e P o s i t i v e s signify the cumulative count of correct positive predictions across all classes, while F a l s e P o s i t i v e s denote the total count of incorrect positive predictions across all classes. Similarly, F a l s e N e g a t i v e s represent the collective count of incorrect negative predictions across all classes. The Micro-average F 1 S c o r e serves as a comprehensive metric for assessing the model’s precision and recall, ensuring equal consideration for each class in the computation.

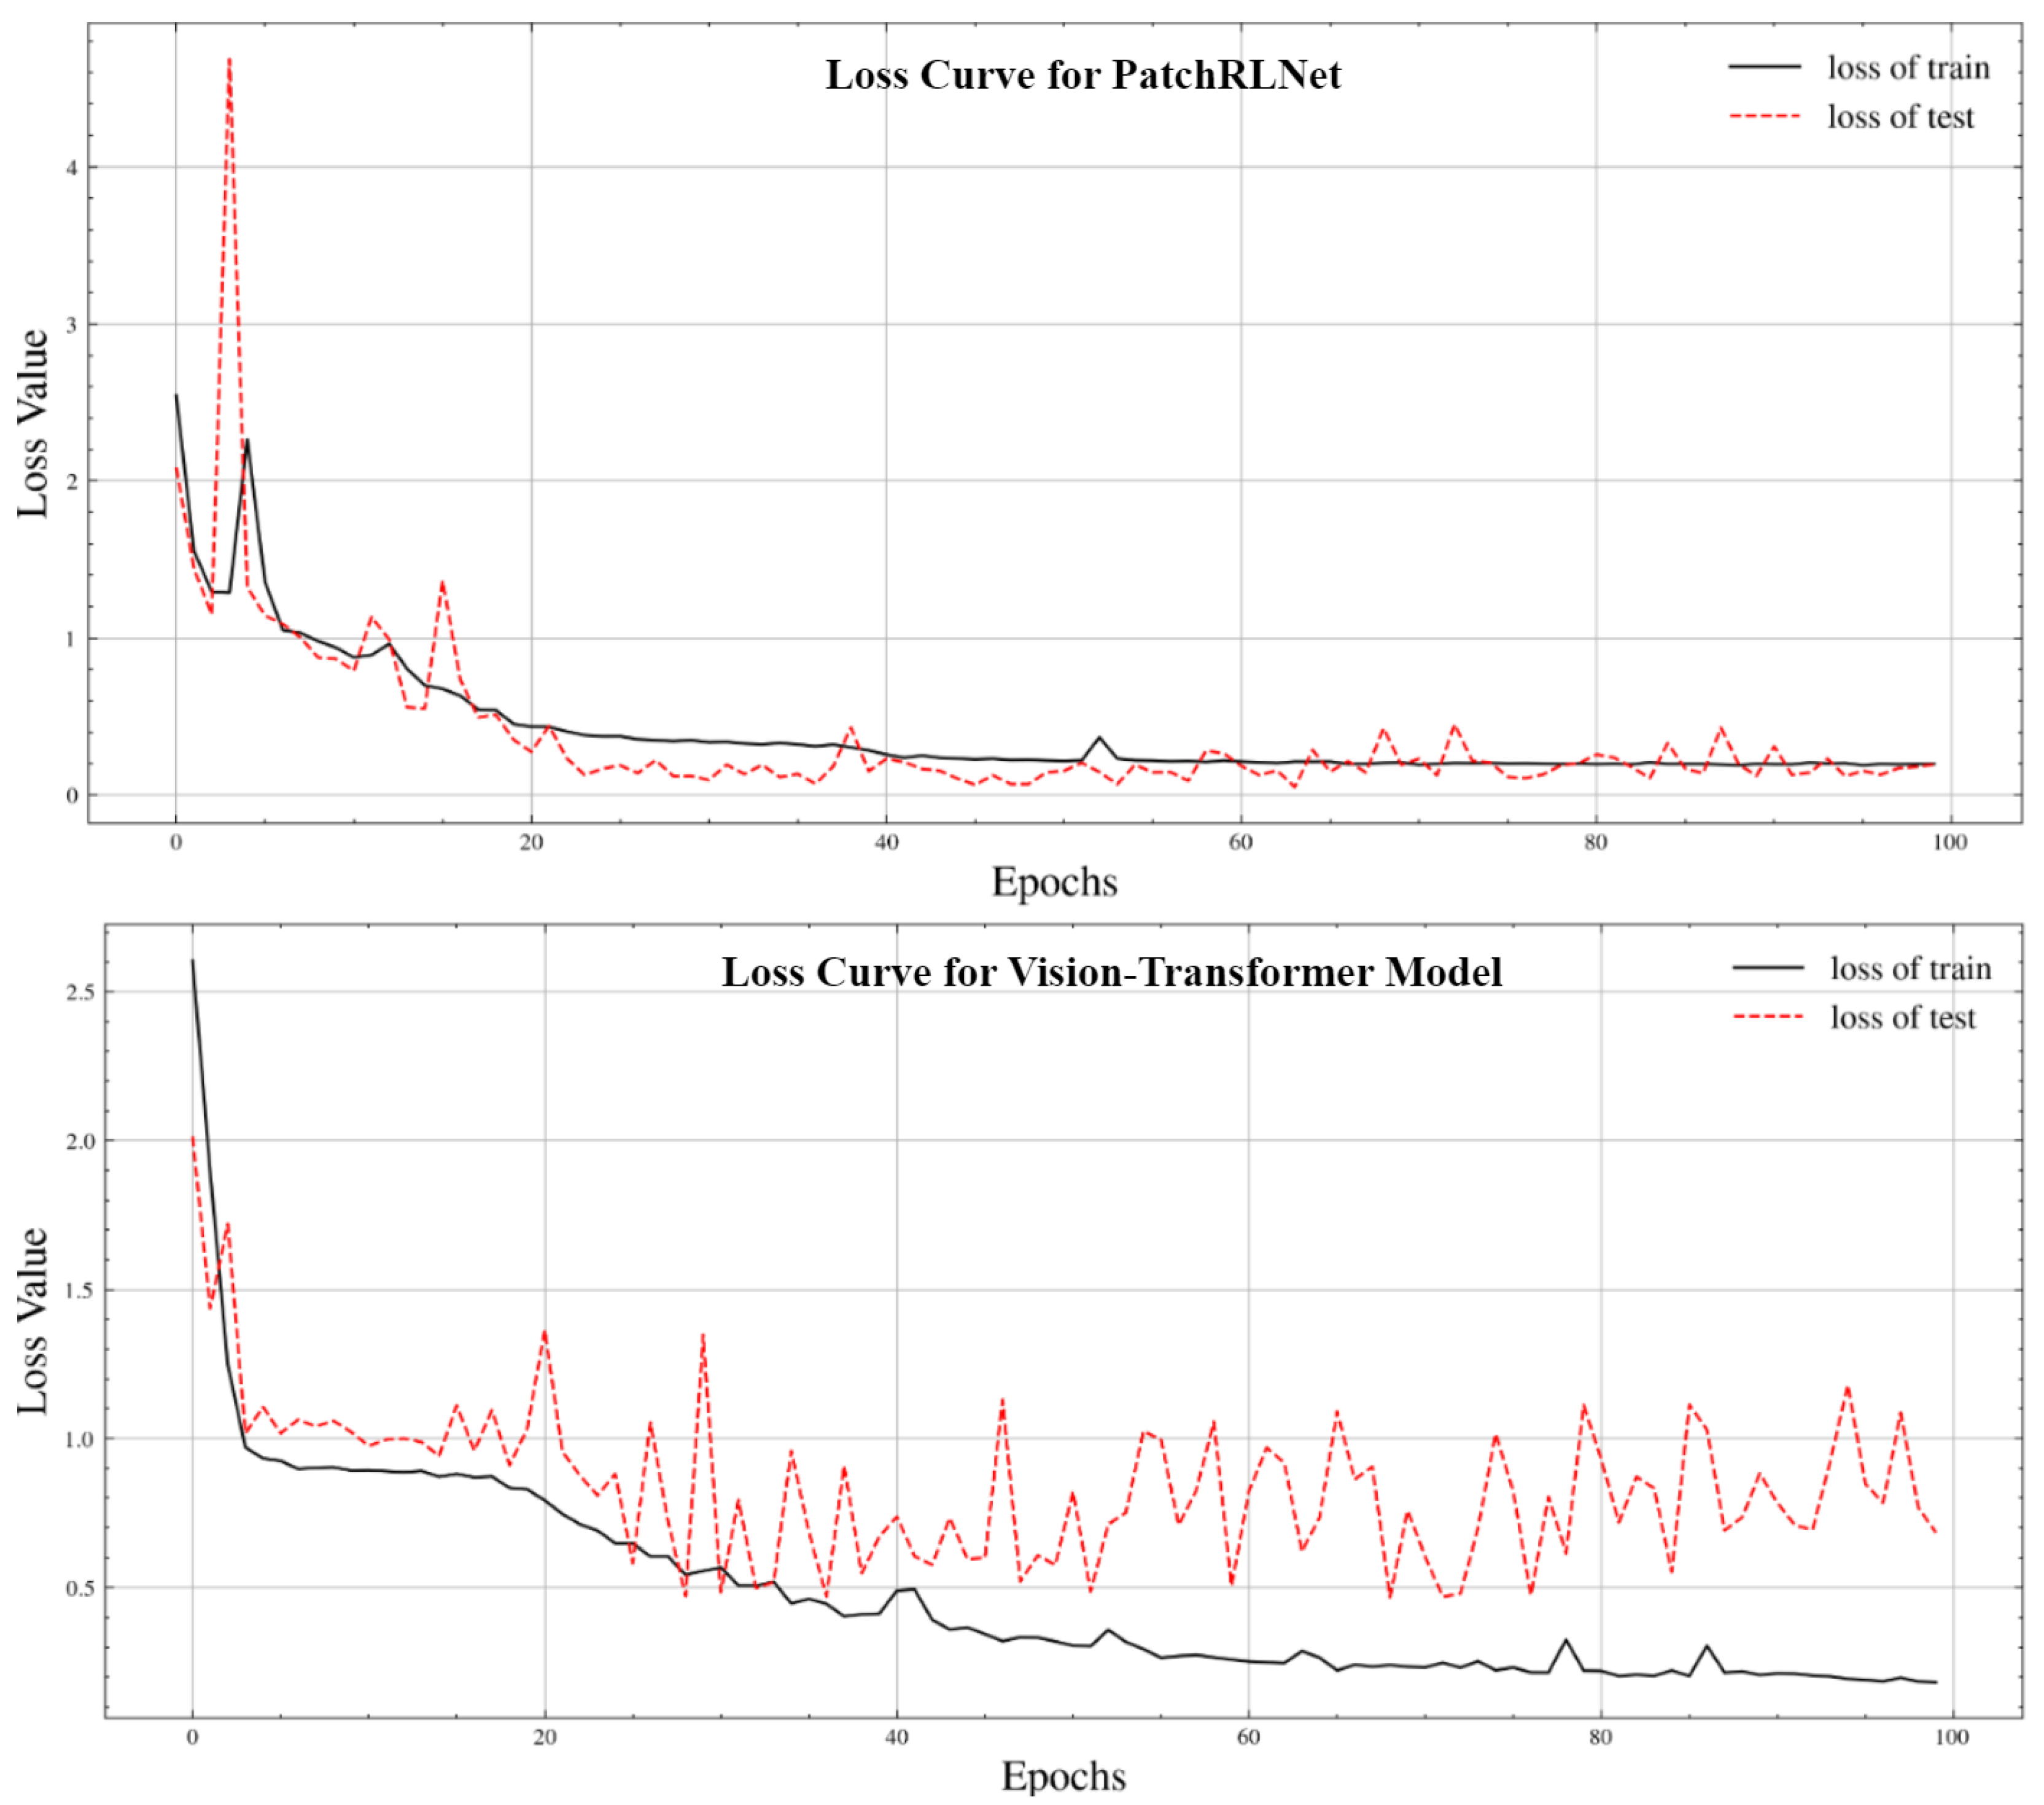
4.2. Performance Evaluation of the Vision Transformer

Table 1 and Table 2 present a comparison between the vision transformer model and current state-of-the-art convolutional neural networks on two distinct PTFE emulsion–paraffin separation test queues, including the first and second perspectives. The metrics used for comparison include Params, GFlops, Average Accuracy, Accuracy, and Micro-average F1 Score. In this context, smaller values for Params and GFlops indicate lower hardware requirements for the model, while higher Average Accuracy, Accuracy, and Micro-average F1 Score values signify better model performance.
It can be observed that whether using traditional convolutional neural network models or vision transformer models, the achieved Average Accuracy, Accuracy, and Micro-average F1 Score are relatively close. This suggests that effective data preprocessing can mitigate the challenges posed by sample imbalance. On the one hand, compared to traditional convolutional neural networks, vision transformer models generally achieve higher Accuracy and Average Accuracy. This implies that extracting more global features can significantly enhance the performance of the detection model in PTFE emulsion–paraffin separation. Across all convolutional neural network models, we obtained a minimum improvement of 5.06% in Average Accuracy, 4.81% in Accuracy, and 3.91% in Micro-average F1 Score. On the other hand, when comparing the results of VIT-L-16 and VIT-B-16, it is revealed that for PTFE emulsion–paraffin separation detection, excessively large models with a high number of parameters do not necessarily yield better results. This is because the task involves only four categories and the scene remains relatively fixed, making it challenging for the model to benefit from an excessively large number of parameters during training.

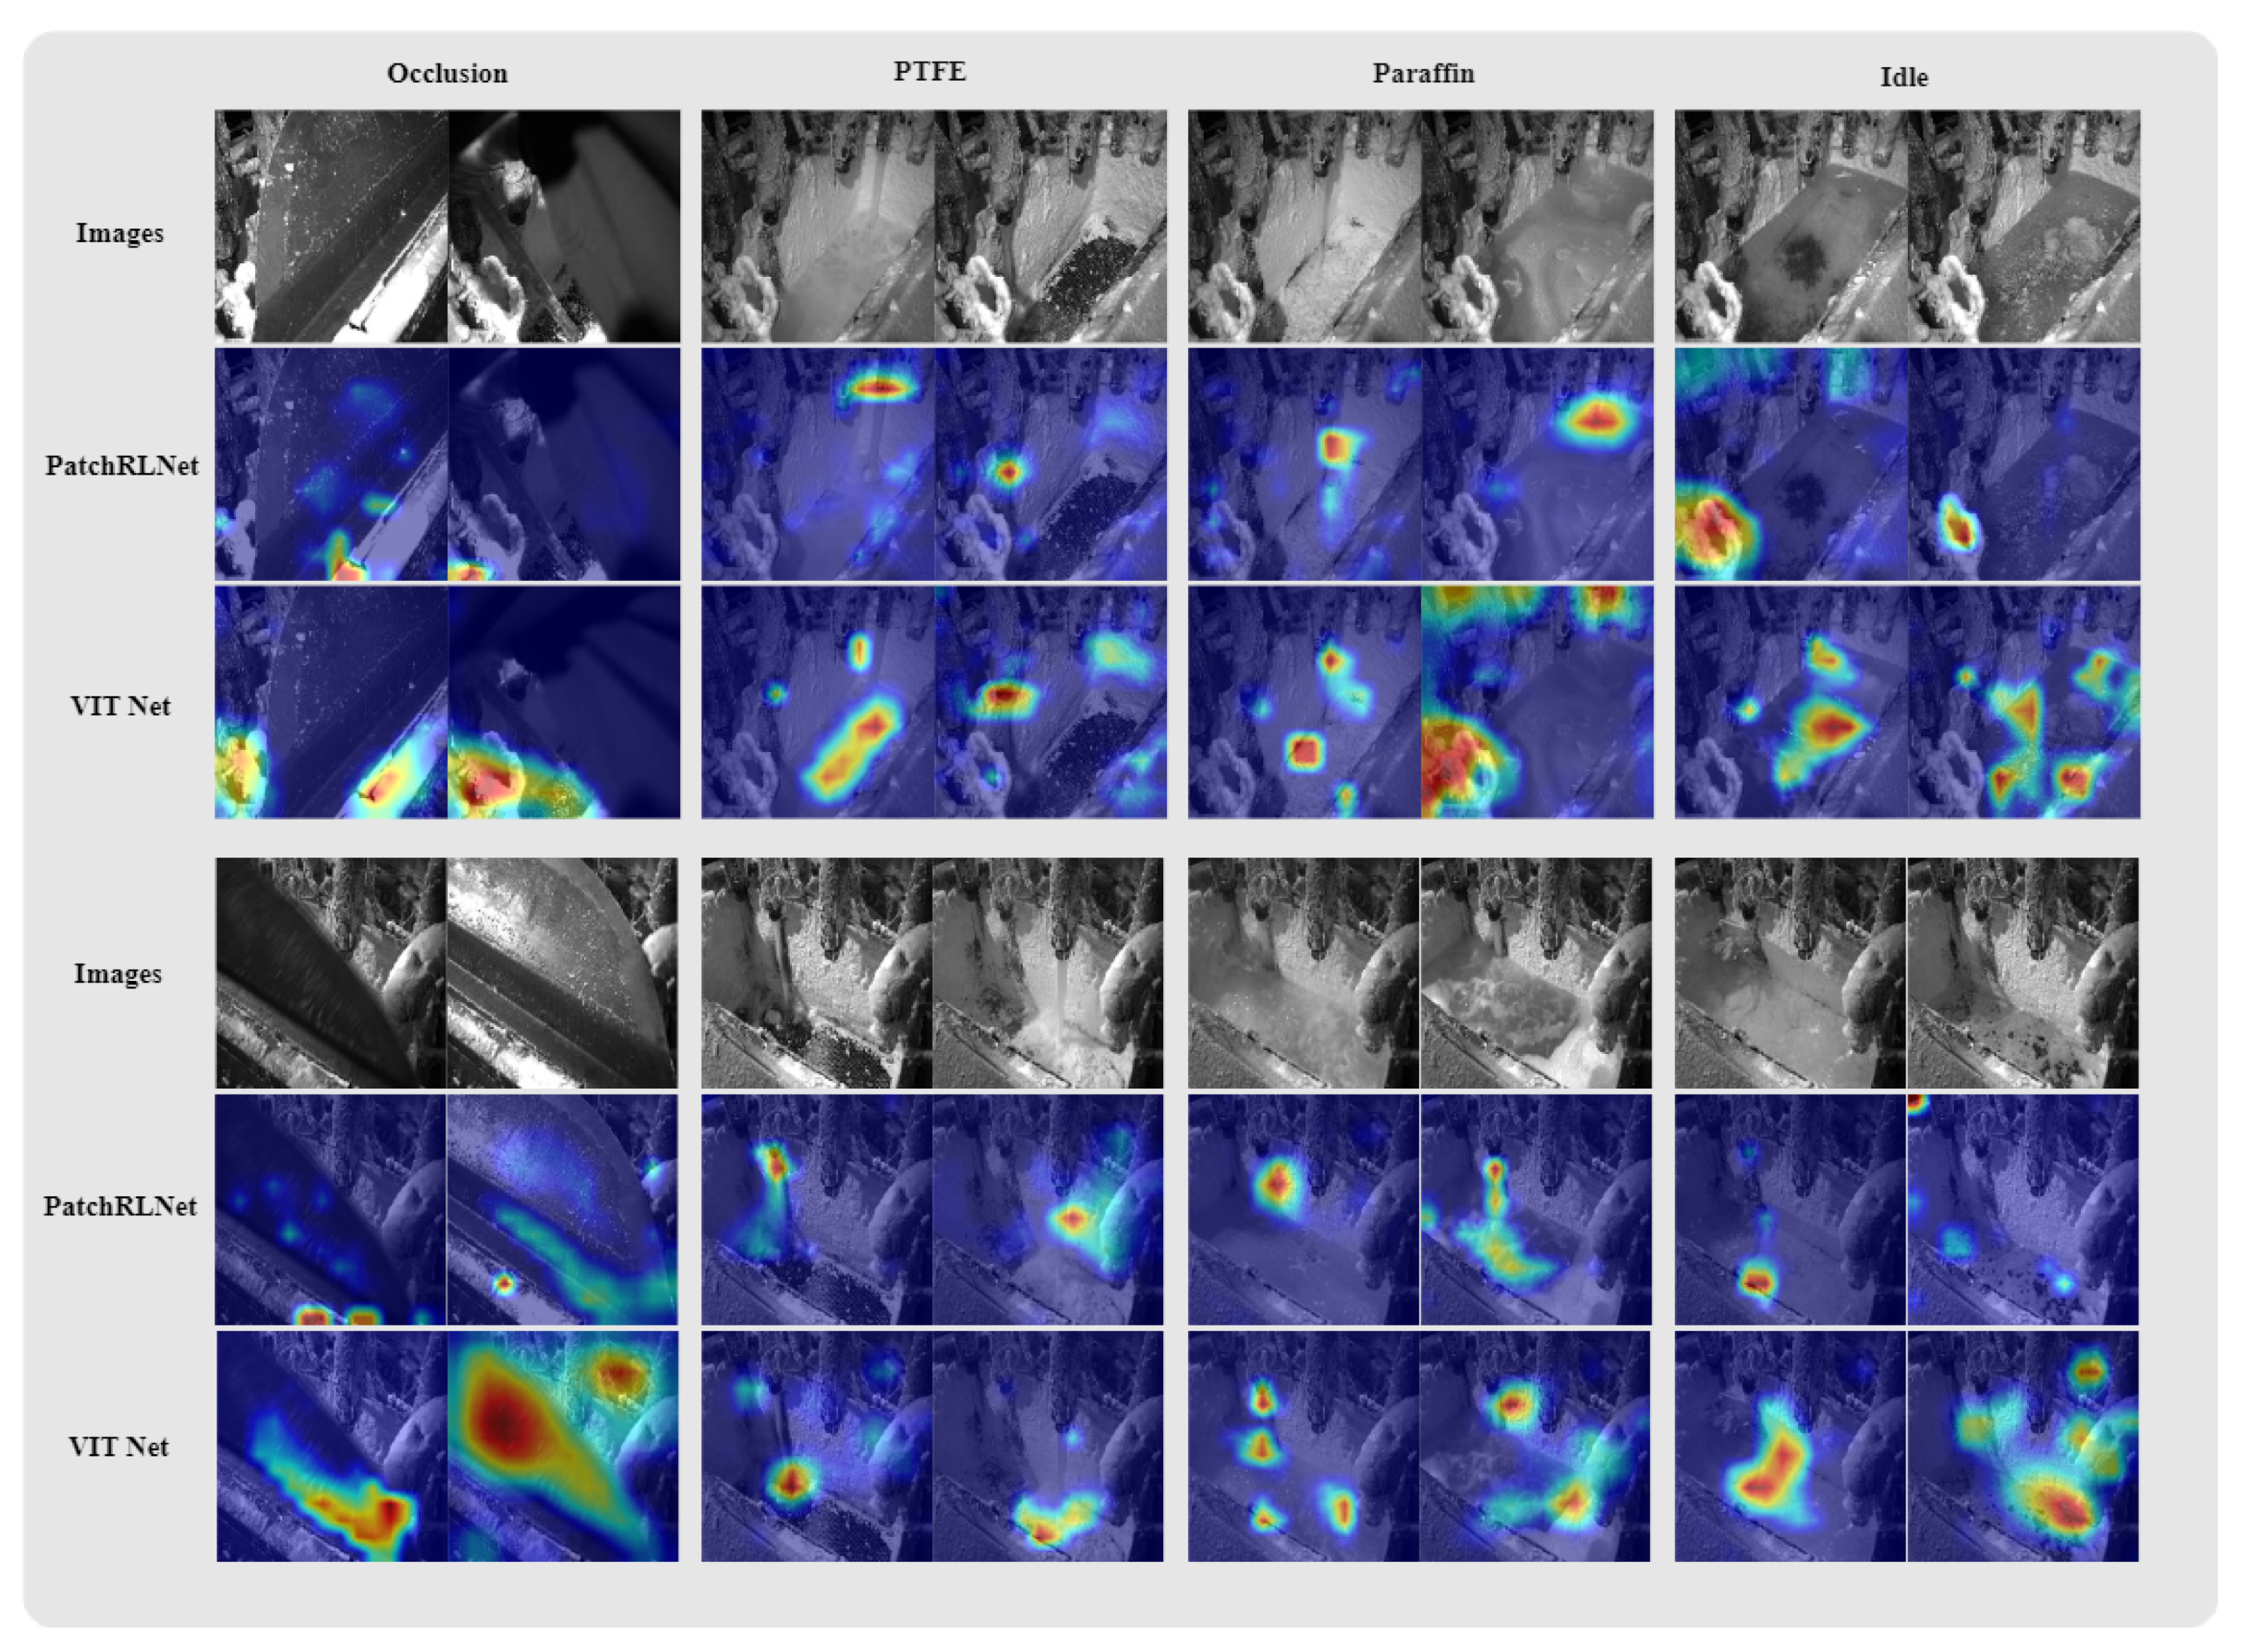
4.3. Performance Evaluation of PatchRLNet

Traditional convolutional neural networks and vision transformer models fall short of achieving sufficient accuracy in PTFE emulsion–paraffin separation detection. This is primarily due to the presence of abundant environmental backgrounds and noise in real industrial production scenarios, causing the model’s attention to be diverted towards other objects, thus significantly affecting its detection performance. To mitigate the impact of environmental backgrounds and noise on the model, we introduced a reinforcement learning framework into the embedding layer of the vision transformer network. We constructed a novel model, PatchRLNet, which aims to constrain the model’s focus on key region features by reinforcing or attenuating the weights of patches. Using VIT-B-16 as the baseline model, and based on the test queues for PTFE emulsion–paraffin separation detection including the first and second perspective, we validated the performance of the vision transformer model and PatchRLNet, with the results presented in Table 3 and Table 4.
With the parameter quantity held constant, PatchRLNet, compared to the original VIT-B-16, achieved improvements of 13.53% and 12.87% in average accuracy, 11.38% and 12.56% in accuracy, and 13.06% and 15.11% in micro-average F1 score across the two perspectives. Additionally, it is noteworthy that the stability of the model has significantly increased, which is evident from the reduced fluctuations in model accuracy. These results validate our hypothesis and underscore the potential application of reinforcement learning in critical feature selection.
Utilizing the cross-entropy loss function as the standard for evaluating model performance during training, we visualized the changes in the loss curves for the training and test research sets during the training process of PatchRLNet and the standard vision transformer model, as depicted in Figure 4.
Using an initial learning rate of 0.1 and applying learning rate reductions at the 35th and 70th epochs with a decay factor of 0.2, we observed that PatchRLNet, despite exhibiting initial training dynamics’ instability and lower test accuracy compared to the standard vision transformer model, quickly converged and surpassed the performance of the latter (PatchRLNet experienced transient increases in training loss in the first 10 epochs). On the one hand, this is due to the incorporation of reinforcement learning, meaning the model needs more time at the beginning of training to adjust its parameters, ensuring a well-balanced integration of the reinforcement learning framework and the vision transformer network. On the other hand, thanks to the reinforcement learning framework helping the vision transformer network avoid interference from environmental backgrounds and noise, PatchRLNet exhibits more stable training dynamics and better resilience to overfitting. It can be clearly observed that the training and testing curves of PatchRLNet are smoother and more stable, particularly in the later stages of training. The experimental results thoroughly demonstrate the effectiveness and reliability of our proposed algorithm, which combines reinforcement learning with a vision transformer. Not only does it enhance model accuracy, but it also stabilizes the training dynamics of the model.
Class Activation Mapping (CAM) [33] is a technique that visualizes attention on images by projecting the weights of the output layer back onto the feature maps. It provides a genuine reflection of the model’s focus areas. In this study, CAM was employed to visualize the results of PatchRLNet and vision transformer models on the PTFE emulsion–paraffin separation test queue, as illustrated in Figure 5. In the visualization, darker colors indicate higher attention from the model to the corresponding regions.
As shown in the figure, PatchRLNet predominantly focuses on the crucial target areas in the images, such as the outflow points of the PTFE emulsion and high-temperature paraffin solution, whereas the vision transformer exhibits attention in many irrelevant areas, such as the liquid surface and background noise, as is evident in the results presented in the second row of the second and third columns. For occlusion and idle states, PatchRLNet demonstrates nearly identical attention, for instance, towards the solidified PTFE emulsion and the edges of the paraffin reservoir, indicating its consistent focus on key features. In contrast, the attention points of the vision transformer vary widely, lacking a certain level of interpretability. The results of these experiments clearly demonstrate the efficacy of PatchRLNet proposed in this study in selecting critical features, reducing interference from background environments and noise and thereby meeting the high-precision pattern recognition requirements in complex scenarios.

4.4. Performance Evaluation of PTFE Emulsion–Paraffin Separation

Combining multimodal data, we validated the performance of our proposed PTFE emulsion–paraffin separation automatic detection system on the integrated PTFE emulsion–paraffin separation detection test queue. In the end, we achieved an accuracy of 99.12%, an average accuracy of 99.46%, and a micro-average F1 score of 99.23%. This indicates that our PTFE emulsion–paraffin separation detection model is applicable to real industrial production scenarios.
Finally, we encapsulated the PTFE emulsion–paraffin separation detection model into a system and applied it to the real production process at the production base of Ju Sheng Fluorine Chemical Co., Ltd., a subsidiary of Quzhou Juhua Group. This implementation aimed to achieve automated control of PTFE emulsion–paraffin separation. Through a survey and statistical analysis of the results of 7 days of production activities, we found that within the week, the system accurately detected all instances of occlusion and issued timely alerts. Simultaneously, the system also accurately identified all occurrences of the PTFE emulsion, providing timely alarms and replacing manual visual inspections, thereby enhancing the factory’s production efficiency. Regarding the paraffin state, the system experienced one false positive. This was attributed to instances where manual intervention closed valves after the appearance of emulsion in the collected data, resulting in situations where the liquid volume was too small to be reliably determined. In future work, similar errors can be mitigated by controlling the occurrence of manual interventions.

5. Conclusions

In this paper, we propose a novel framework, PatchRLNet, for the automated detection of PTFE emulsion–paraffin separation. The results demonstrate significant progress in the automatic detection of paraffin separation during PTFE emulsion production, achieved via the integration of a vision transformer and reinforcement learning. By incorporating the reinforcement learning framework into the embedding layer of a vision transformer, we successfully enhance the accuracy of paraffin separation, enabling the model to more precisely focus on the critical features of the target while ignoring surrounding environments and background noise. This framework also incorporates an adaptive feature selection mechanism, ensuring the model’s flexible adaptation to input data.
We constructed a large-scale research queue for the detection of PTFE emulsion–paraffin separation based on real data from China’s largest PTFE material production base. To our knowledge, this is the only work in the current research community using such a dataset. Leveraging this research queue, we conducted extensive testing and validation of the proposed method. The experimental results demonstrate remarkable performance with an accuracy exceeding 0.99, showcasing high reliability and practicality in real-world applications. Furthermore, our study represents the first application of reinforcement learning and a vision transformer to PTFE emulsion–paraffin detection and separation, providing new perspectives and methodologies for further research in related fields.
In practical applications, as mentioned in Section 4.4, we have recognized the potential adverse effects of human interference on our detection results. To further enhance the model’s detection performance in such scenarios, we have incorporated the consideration of human interference as a pivotal aspect into our new research agenda. This proactive step aims to adapt and optimize the model to address potential external disturbances comprehensively. In addressing situations with lower water flow, we are actively contemplating the introduction of a fine-grained recognition task mechanism. The objective of this strategy is to elevate the model’s performance, fostering stronger robustness and reliability across a broader range of scenarios. By exploring fine-grained recognition tasks in future work, we anticipate that the model will more precisely capture and distinguish different features, thereby further enhancing its overall performance. This avenue of research is poised to contribute to the model’s improved adaptability to diverse real-world environments, enabling it to excel under various complex conditions. Finally, we conducted tests and validations on additional PTFE emulsion–paraffin separation sites at the production facility. The results underscore that our model consistently demonstrates excellent detection capabilities, highlighting the robust generalization ability of our approach. This observation suggests a consistently high level of detection accuracy across various scenarios.
While our method demonstrates outstanding performance and reliable generalization capabilities, the incorporation of reinforcement learning significantly increases the training costs of the model, including computational expenses and time requirements. This, to some extent, impacts the applicability of the proposed method outlined in this paper. In our ongoing work, we are actively exploring ways to optimize the training process of the reinforcement learning framework, aiming to efficiently reduce the training costs associated with the proposed method and enhance its overall effectiveness.
Overall, the PatchRLNet has achieved significant success in improving separation detection accuracy and model interpretability, providing robust support for the automation and intelligence of PTFE emulsion production industries. Future research could further optimize the framework, expand its applicability, and delve into its potential applications in other industrial production processes.

Author Contributions

Conceptualization, X.W. and H.G.; methodology, X.W. and L.W.; software, B.H., X.Y., X.F., and M.L.; validation, S.W., K.C., J.M., M.L., and B.H.; formal analysis, X.W., L.W., X.F., and K.C.; investigation, B.H. and X.Y.; resources, H.G.; data curation, H.G.; writing, X.W.; funding acquisition, L.W. and H.G. All authors have read and agreed to the published version of the manuscript.

Funding

This work was supported by the China Postdoctoral Science Foundation Funded Project (2023M740519), Medico-Engineering Cooperation Funds from University of Electronic Science and Technology of China (No. ZYGX2021YGLH213, No. ZYGX2022YGRH016), Interdisciplinary Crossing and Integration of Medicine and Engineering for Talent Training Fund, West China Hospital, Sichuan University under Grant No.HXDZ22010, the Yuxi Normal University under Grant No. 202105AG070010, the Municipal Government of Quzhou (Grant 2022D018, Grant 2022D029, Grant 2023D007, Grant 2023D015, Grant 2023D033, Grant 2023D034, and Grant 2023D035), as well as the Zhejiang Provincial Natural Science Foundation of China under Grant No.LGF22G010009.

Institutional Review Board Statement

Not applicable.

Informed Consent Statement

Not applicable.

Data Availability Statement

The data that support the findings of this study are available from the corresponding author, Haigang Gong, upon reasonable request.

Conflicts of Interest

The authors declare no conflicts of interest.

Abbreviations

The following abbreviations are used in this manuscript:
PTFEPolyTetraFluoroEthylene
VITVision Transformer
CNNConvolutional Neural Networks
AIArtificial intelligence
FCNFully Convolutional Network
CAMClass Activation Mapping

References

  1. Dhanumalayan, E.; Joshi, G.M. Performance properties and applications of polytetrafluoroethylene (PTFE)—A review. Adv. Compos. Hybrid Mater. 2018, 1, 247–268. [Google Scholar] [CrossRef]
  2. Li, Y.; Liu, G.; Hou, J.; Sun, Y.; Yuan, Y. Application of artificial intelligence in computer network technology. In Application of Intelligent Systems in Multi-Modal Information Analytics, Proceedings of the 2021 International Conference on Multi-Modal Information Analytics (MMIA 2021), Huhehaote, China, 23–24 April 2021; Springer: Cham, Switzerland, 2021; Volume 1, pp. 523–528. [Google Scholar]
  3. Kaur, D.; Uslu, S.; Rittichier, K.J.; Durresi, A. Trustworthy artificial intelligence: A review. ACM Comput. Surv. (CSUR) 2022, 55, 1–38. [Google Scholar] [CrossRef]
  4. Liu, M.; Deng, J.; Yang, M.; Cheng, X.; Liu, N.; Liu, M.; Wang, X. Cost Ensemble with Gradient Selecting for GANs. In Proceedings of the Thirty-First International Joint Conference on Artificial Intelligence, IJCAI 2022, Vienna, Austria, 23–29 July 2022; pp. 1194–1200. [Google Scholar] [CrossRef]
  5. Lu, H.; Cheng, X.; Xia, W.; Deng, P.; Liu, M.; Xie, T.; Wang, X.; Liu, M. CyclicShift: A Data Augmentation Method For Enriching Data Patterns. In Proceedings of the MM ’22: The 30th ACM International Conference on Multimedia, Lisboa, Portugal, 10–14 October 2022; ACM: New York, NY, USA, 2022; pp. 4921–4929. [Google Scholar]
  6. Wang, K. An Overview of Deep Learning Based Small Sample Medical Imaging Classification. In Proceedings of the 2021 International Conference on Signal Processing and Machine Learning (CONF-SPML), Stanford, CA, USA, 14 November 2021; pp. 278–281. [Google Scholar]
  7. Deshmukh, V.M.; Rajalakshmi, B.; Krishna, G.B.; Rudrawar, G. An overview of deep learning techniques for autonomous driving vehicles. In Proceedings of the 2022 4th International Conference on Smart Systems and Inventive Technology (ICSSIT), Tirunelveli, India, 20–22 January 2022; pp. 979–983. [Google Scholar]
  8. Dosovitskiy, A.; Beyer, L.; Kolesnikov, A.; Weissenborn, D.; Zhai, X.; Unterthiner, T.; Dehghani, M.; Minderer, M.; Heigold, G.; Gelly, S.; et al. An image is worth 16 × 16 words: Transformers for image recognition at scale. arXiv 2020, arXiv:2010.11929. [Google Scholar]
  9. Han, K.; Wang, Y.; Chen, H.; Chen, X.; Guo, J.; Liu, Z.; Tang, Y.; Xiao, A.; Xu, C.; Xu, Y.; et al. A survey on vision transformer. IEEE Trans. Pattern Anal. Mach. Intell. 2022, 45, 87–110. [Google Scholar] [CrossRef] [PubMed]
  10. Molchanov, P.; Tyree, S.; Karras, T.; Aila, T.; Kautz, J. Pruning convolutional neural networks for resource efficient inference. arXiv 2016, arXiv:1611.06440. [Google Scholar]
  11. Khan, M.A.; Alqahtani, A.; Khan, A.; Alsubai, S.; Binbusayyis, A.; Ch, M.M.I.; Yong, H.S.; Cha, J. Cucumber leaf diseases recognition using multi level deep entropy-ELM feature selection. Appl. Sci. 2022, 12, 593. [Google Scholar] [CrossRef]
  12. Li, Y.; Gu, S.; Gool, L.V.; Timofte, R. Learning filter basis for convolutional neural network compression. In Proceedings of the IEEE/CVF International Conference on Computer Vision, Seoul, Republic of Korea, 27 October–2 November 2019; pp. 5623–5632. [Google Scholar]
  13. Mnih, V.; Kavukcuoglu, K.; Silver, D.; Graves, A.; Antonoglou, I.; Wierstra, D.; Riedmiller, M. Playing atari with deep reinforcement learning. arXiv 2013, arXiv:1312.5602. [Google Scholar]
  14. Lyu, L.; Shen, Y.; Zhang, S. The Advance of reinforcement learning and deep reinforcement learning. In Proceedings of the 2022 IEEE International Conference on Electrical Engineering, Big Data and Algorithms (EEBDA), Changchun, China, 25–27 February 2022; pp. 644–648. [Google Scholar]
  15. Shi, J.C.; Yu, Y.; Da, Q.; Chen, S.Y.; Zeng, A.X. Virtual-taobao: Virtualizing real-world online retail environment for reinforcement learning. In Proceedings of the AAAI Conference on Artificial Intelligence, Honolulu, HI, USA, 29–31 January 2019; Volume 33, pp. 4902–4909. [Google Scholar]
  16. Alrebdi, N.; Alrumiah, S.; Almansour, A.; Rassam, M. Reinforcement Learning in Image Classification: A Review. In Proceedings of the 2022 2nd International Conference on Computing and Information Technology (ICCIT), Tabuk, Saudi Arabia, 25–27 January 2022; pp. 79–86. [Google Scholar]
  17. Balamurugan, N.M.; Adimoolam, M.; Alsharif, M.H.; Uthansakul, P. A novel method for improved network traffic prediction using enhanced deep reinforcement learning algorithm. Sensors 2022, 22, 5006. [Google Scholar] [CrossRef] [PubMed]
  18. Ngiam, J.; Khosla, A.; Kim, M.; Nam, J.; Lee, H.; Ng, A.Y. Multimodal deep learning. In Proceedings of the 28th International Conference on Machine Learning (ICML-11), Bellevue, WA, USA, 28 June–2 July 2011; pp. 689–696. [Google Scholar]
  19. Baltrušaitis, T.; Ahuja, C.; Morency, L.P. Multimodal machine learning: A survey and taxonomy. IEEE Trans. Pattern Anal. Mach. Intell. 2018, 41, 423–443. [Google Scholar] [CrossRef] [PubMed]
  20. Neuendorf, L.; Müller, P.; Lammers, K.; Kockmann, N. Convolutional Neural Network (CNN)-Based Measurement of Properties in Liquid–Liquid Systems. Processes 2023, 11, 1521. [Google Scholar] [CrossRef]
  21. Chen, H.; Dang, Z.; Park, S.S.; Hugo, R. Robust CNN-based flow pattern identification for horizontal gas-liquid pipe flow using flow-induced vibration. Exp. Therm. Fluid Sci. 2023, 148, 110979. [Google Scholar] [CrossRef]
  22. Liu, D.; Liu, J.; Yuan, P.; Yu, F. A Lightweight Dangerous Liquid Detection Method Based on Depthwise Separable Convolution for X-Ray Security Inspection. Comput. Intell. Neurosci. 2022, 2022, 5371350. [Google Scholar] [CrossRef] [PubMed]
  23. Liu, N.; Yue, S.; Wang, Y. Flow Velocity computation in solid-liquid two-phase flow by convolutional neural network. In Proceedings of the 2023 IEEE International Instrumentation and Measurement Technology Conference (I2MTC), Kuala Lumpur, Malaysia, 22–25 May 2023; pp. 1–6. [Google Scholar]
  24. Zhao, Z.; Wu, X.; Liu, H. Vision transformer for quality identification of sesame oil with stereoscopic fluorescence spectrum image. LWT 2022, 158, 113173. [Google Scholar] [CrossRef]
  25. Li, H.; Kim, J.T.; Kim, J.S.; Choi, D.Y.; Lee, S.S. Metasurface-Incorporated Optofluidic Refractive Index Sensing for Identification of Liquid Chemicals through Vision Intelligence. ACS Photonics 2023, 10, 780–789. [Google Scholar] [CrossRef]
  26. Wu, Y.; Ye, H.; Yang, Y.; Wang, Z.; Li, S. Liquid content detection in transparent containers: A benchmark. Sensors 2023, 23, 6656. [Google Scholar] [CrossRef] [PubMed]
  27. Khan, S.; Naseer, M.; Hayat, M.; Zamir, S.W.; Khan, F.S.; Shah, M. Transformers in vision: A survey. ACM Comput. Surv. (CSUR) 2022, 54, 1–41. [Google Scholar] [CrossRef]
  28. Chen, Z.; Duan, Y.; Wang, W.; He, J.; Lu, T.; Dai, J.; Qiao, Y. Vision transformer adapter for dense predictions. arXiv 2022, arXiv:2205.08534. [Google Scholar]
  29. He, K.; Zhang, X.; Ren, S.; Sun, J. Deep residual learning for image recognition. In Proceedings of the IEEE Conference on Computer Vision and Pattern Recognition, Las Vegas, NV, USA, 27–30 June 2016; pp. 770–778. [Google Scholar]
  30. Huang, G.; Liu, Z.; Van Der Maaten, L.; Weinberger, K.Q. Densely connected convolutional networks. In Proceedings of the IEEE Conference on Computer Vision and Pattern Recognition, Honolulu, HI, USA, 21–26 July 2017; pp. 4700–4708. [Google Scholar]
  31. Chen, Y.; Li, J.; Xiao, H.; Jin, X.; Yan, S.; Feng, J. Dual path networks. In Proceedings of the Advances in Neural Information Processing Systems 30: Annual Conference on Neural Information Processing Systems 2017, Long Beach, CA, USA, 4–9 December 2017. [Google Scholar]
  32. Hu, J.; Shen, L.; Sun, G. Squeeze-and-excitation networks. In Proceedings of the IEEE Conference on Computer Vision and Pattern Recognition, Salt Lake City, UT, USA, 18–26 June 2018; pp. 7132–7141. [Google Scholar]
  33. Zhou, B.; Khosla, A.; Lapedriza, A.; Oliva, A.; Torralba, A. Learning Deep Features for Discriminative Localization. In Proceedings of the CVPR, Las Vegas, NV, USA, 27–30 July 2016. [Google Scholar]
Figure 1. The proposed framework for PatchRLNet, where all components are parameterized by neural networks.
Electronics 13 00339 g001
Figure 2. The proposed automatic detection process for PTFE emulsion–paraffin separation relies on a multimodal approach, employing two PatchRLNets designated as PatchRLNet 1 and PatchRLNet 2 .
Electronics 13 00339 g002
Figure 3. The workflow diagram of the PTFE emulsion–paraffin separation detection system. The system issues an alert when continuous PTFE emulsion or occlusion is detected, prompting the control center to take appropriate actions.
Electronics 13 00339 g003
Figure 4. The proposed automatic detection process for PTFE emulsion–paraffin separation based on multimodality, in which two PatchRLNets called PatchRLNets 1 and PatchRLNets 2 are used.
Electronics 13 00339 g004
Figure 5. Visualization results of attention. The first column represents blockage, the second column represents the PTFE emulsion, the third column represents paraffin wax, and the fourth column represents the idle state. The first and fourth rows depict the original input images. The second and third rows, as well as the fifth and sixth rows, respectively, showcase the comparison of attention between PatchRLNet and the Visual Transformer model for images corresponding to different states from two different perspectives.
Electronics 13 00339 g005
Table 1. The performance of various models utilizing convolutional neural networks or vision transformer blocks is assessed via a comparison of parameter quantity (Params), GFlops, Average Accuracy, Accuracy, and Micro-average F1 Score (F1 Score) as indicated by the results from the first perspective.
ModelsParamsGFlopsAverage AccuracyAccuracyF1 Score
ResNet152 [29]5.81 M11.6078.77 ± 3.9079.85 ± 4.0479.42 ± 5.02
DenseNet201 [30]18.10 M4.3980.92 ± 3.8480.40 ± 3.8379.78 ± 4.37
DPN131 [31]76.58 M16.1779.41 ± 3.5880.56 ± 3.7279.19 ± 4.49
SE_ResNet152 [32]64.78 M11.3980.41 ± 3.1582.50 ± 3.6779.13 ± 3.95
VIT-L-16 [8]303.31 M59.7382.34 ± 3.9884.17 ± 4.4381.50 ± 3.51
VIT-B-1685.80 M16.8885.47 ± 4.0987.31 ± 5.7385.65 ± 3.34
Table 2. The performance of various models utilizing convolutional neural networks or vision transformer blocks is assessed via a comparison of parameter quantity (Params), GFlops, Average Accuracy, Accuracy, and Micro-average F1 Score (F1 Score) as indicated by the results from the second perspective.
ModelsParamsGFlopsAverage AccuracyAccuracyF1 Score
ResNet1525.81 M11.6073.41 ± 3.4273.28 ± 4.0573.59 ± 3.84
DenseNet20118.10 M4.3974.12 ± 3.2574.11 ± 3.6674.83 ± 3.97
DPN13176.58 M16.1774.39 ± 4.1875.52 ± 3.9874.96 ± 3.70
SE_ResNet15264.78 M11.3976.37 ± 4.2378.93 ± 4.5877.12 ± 4.25
VIT-L-16303.31 M59.7378.81 ± 4.5282.03 ± 5.0180.61 ± 4.54
VIT-B-1685.80 M16.8882.15 ± 5.7683.95 ± 5.2281.03 ± 4.45
Table 3. Performance comparison was conducted between PatchRLNet and the standard vision transformer model in the context of the first perspective. The evaluation utilized four key metrics: parameter quantity (Params), GFlops, average accuracy, accuracy, and micro-average F1 score (F1 score).
ModelsParamsGFlopsAverage AccuracyAccuracyF1 Score
VIT-B-1685.80 M16.8885.47 ± 4.0987.31 ± 5.7385.65 ± 3.34
PatchRLNet85.80 M16.8898.00 ± 1.0498.69 ± 1.0698.71 ± 1.12
Table 4. Performance comparison was conducted between PatchRLNet and the standard vision transformer model in the context of the second perspective. The evaluation utilized four key metrics: parameter quantity (Params), GFlops, average accuracy, accuracy and micro-average F1 score (F1 score).
ModelsParamsGFlopsAverage AccuracyAccuracyF1 Score
VIT-B-1685.80 M16.8882.15 ± 5.7683.95 ± 5.2281.03 ± 4.45
PatchRLNet85.80 M16.8895.02 ± 2.8896.73 ± 2.4096.14 ± 2.08
Disclaimer/Publisher’s Note: The statements, opinions and data contained in all publications are solely those of the individual author(s) and contributor(s) and not of MDPI and/or the editor(s). MDPI and/or the editor(s) disclaim responsibility for any injury to people or property resulting from any ideas, methods, instructions or products referred to in the content.

