Abstract
Deep neural networks based on hyper-encoders play a critical role in estimating prior distributions in remote sensing image compression issues. However, most of the existing encoding methods suffer from a problem on the hyper-encoding side, namely the mismatch of extraction ability with the encoder. This ability bias results in likelihood features that fail to extract sufficient information from latent representations. To solve this problem, the feature extraction capabilities of the hyper-encoder are enhanced to better estimate the Gaussian likelihood of the latent representation in end-to-end network optimization. Specifically, residual blocks and a parameter estimation module are incorporated to balance the performance of the encoder and the hyper-encoder. Furthermore, it is observed that the well-trained compression model tends to generate a fixed pattern of latent representations. Therefore, we incorporate a nonlocal cross-channel graph (NCG) on the backside of the encoder. Specifically, it aggregates features between similar latent representations in a graphical manner to further enhance the side information extraction capability of the hyper-encoder. Considering the computational cost, a sparse graph strategy is further developed to dynamically select the most relevant latent representations for aggregation operations, which greatly reduces the computational effort. The proposed algorithm is named nonlocal cross-channel efficient graph (NCEG). A long-dependent residual network is selected as the backbone, and a sparse attention module is inserted into the encoder/decoder side to enhance the perceptual field of the network. The experimental results on two evaluation datasets demonstrate that the proposed method achieves satisfactory results compared to other learning-based methods.
1. Introduction
The 21st century has witnessed the rapid development of big data, which has introduced higher requirements for the storage and transmission of data; thus, the issue of remote sensing image compression is becoming increasingly significant. As a trade-off between bitrates and reconstruction quality, the objective of image compression is to recover high-fidelity images with as few binary streams as possible.
The classic image compression standards JPEG [1], JPEG2000 [2], and BPG [3] typically rely on hand-crafted compression modules to achieve a low redundancy data stream and high compression ratio. But with the increasing volume of data and the proliferation of high-resolution images, the existing compression standards are not adequate.
The development of deep learning has introduced more possibilities for remote sensing image compression. With the help of flexible nonlinear transformations, variable network structures, and diverse training strategies, learning-based image compression [4,5,6,7,8,9,10,11,12,13,14,15,16,17,18] has achieved satisfactory results. Specifically, the autoencoder-based architectures [4,5,6,7,8,9,10,19] introduce a more optimized performance; the image compression methods based on a generative adversarial network (GAN) [13,14,15] solve the problem of detail loss at extremely low bitrates, and the image compression methods based on a recurrent neural network (RNN) [11,16] alleviate the problems of arithmetic power consumption and excessive parameter size. Most of the remote sensing image compression methods typically employ a similar architecture to natural image compression by adapting the network architecture to be more suitable for the characteristics of remote sensing images [20].
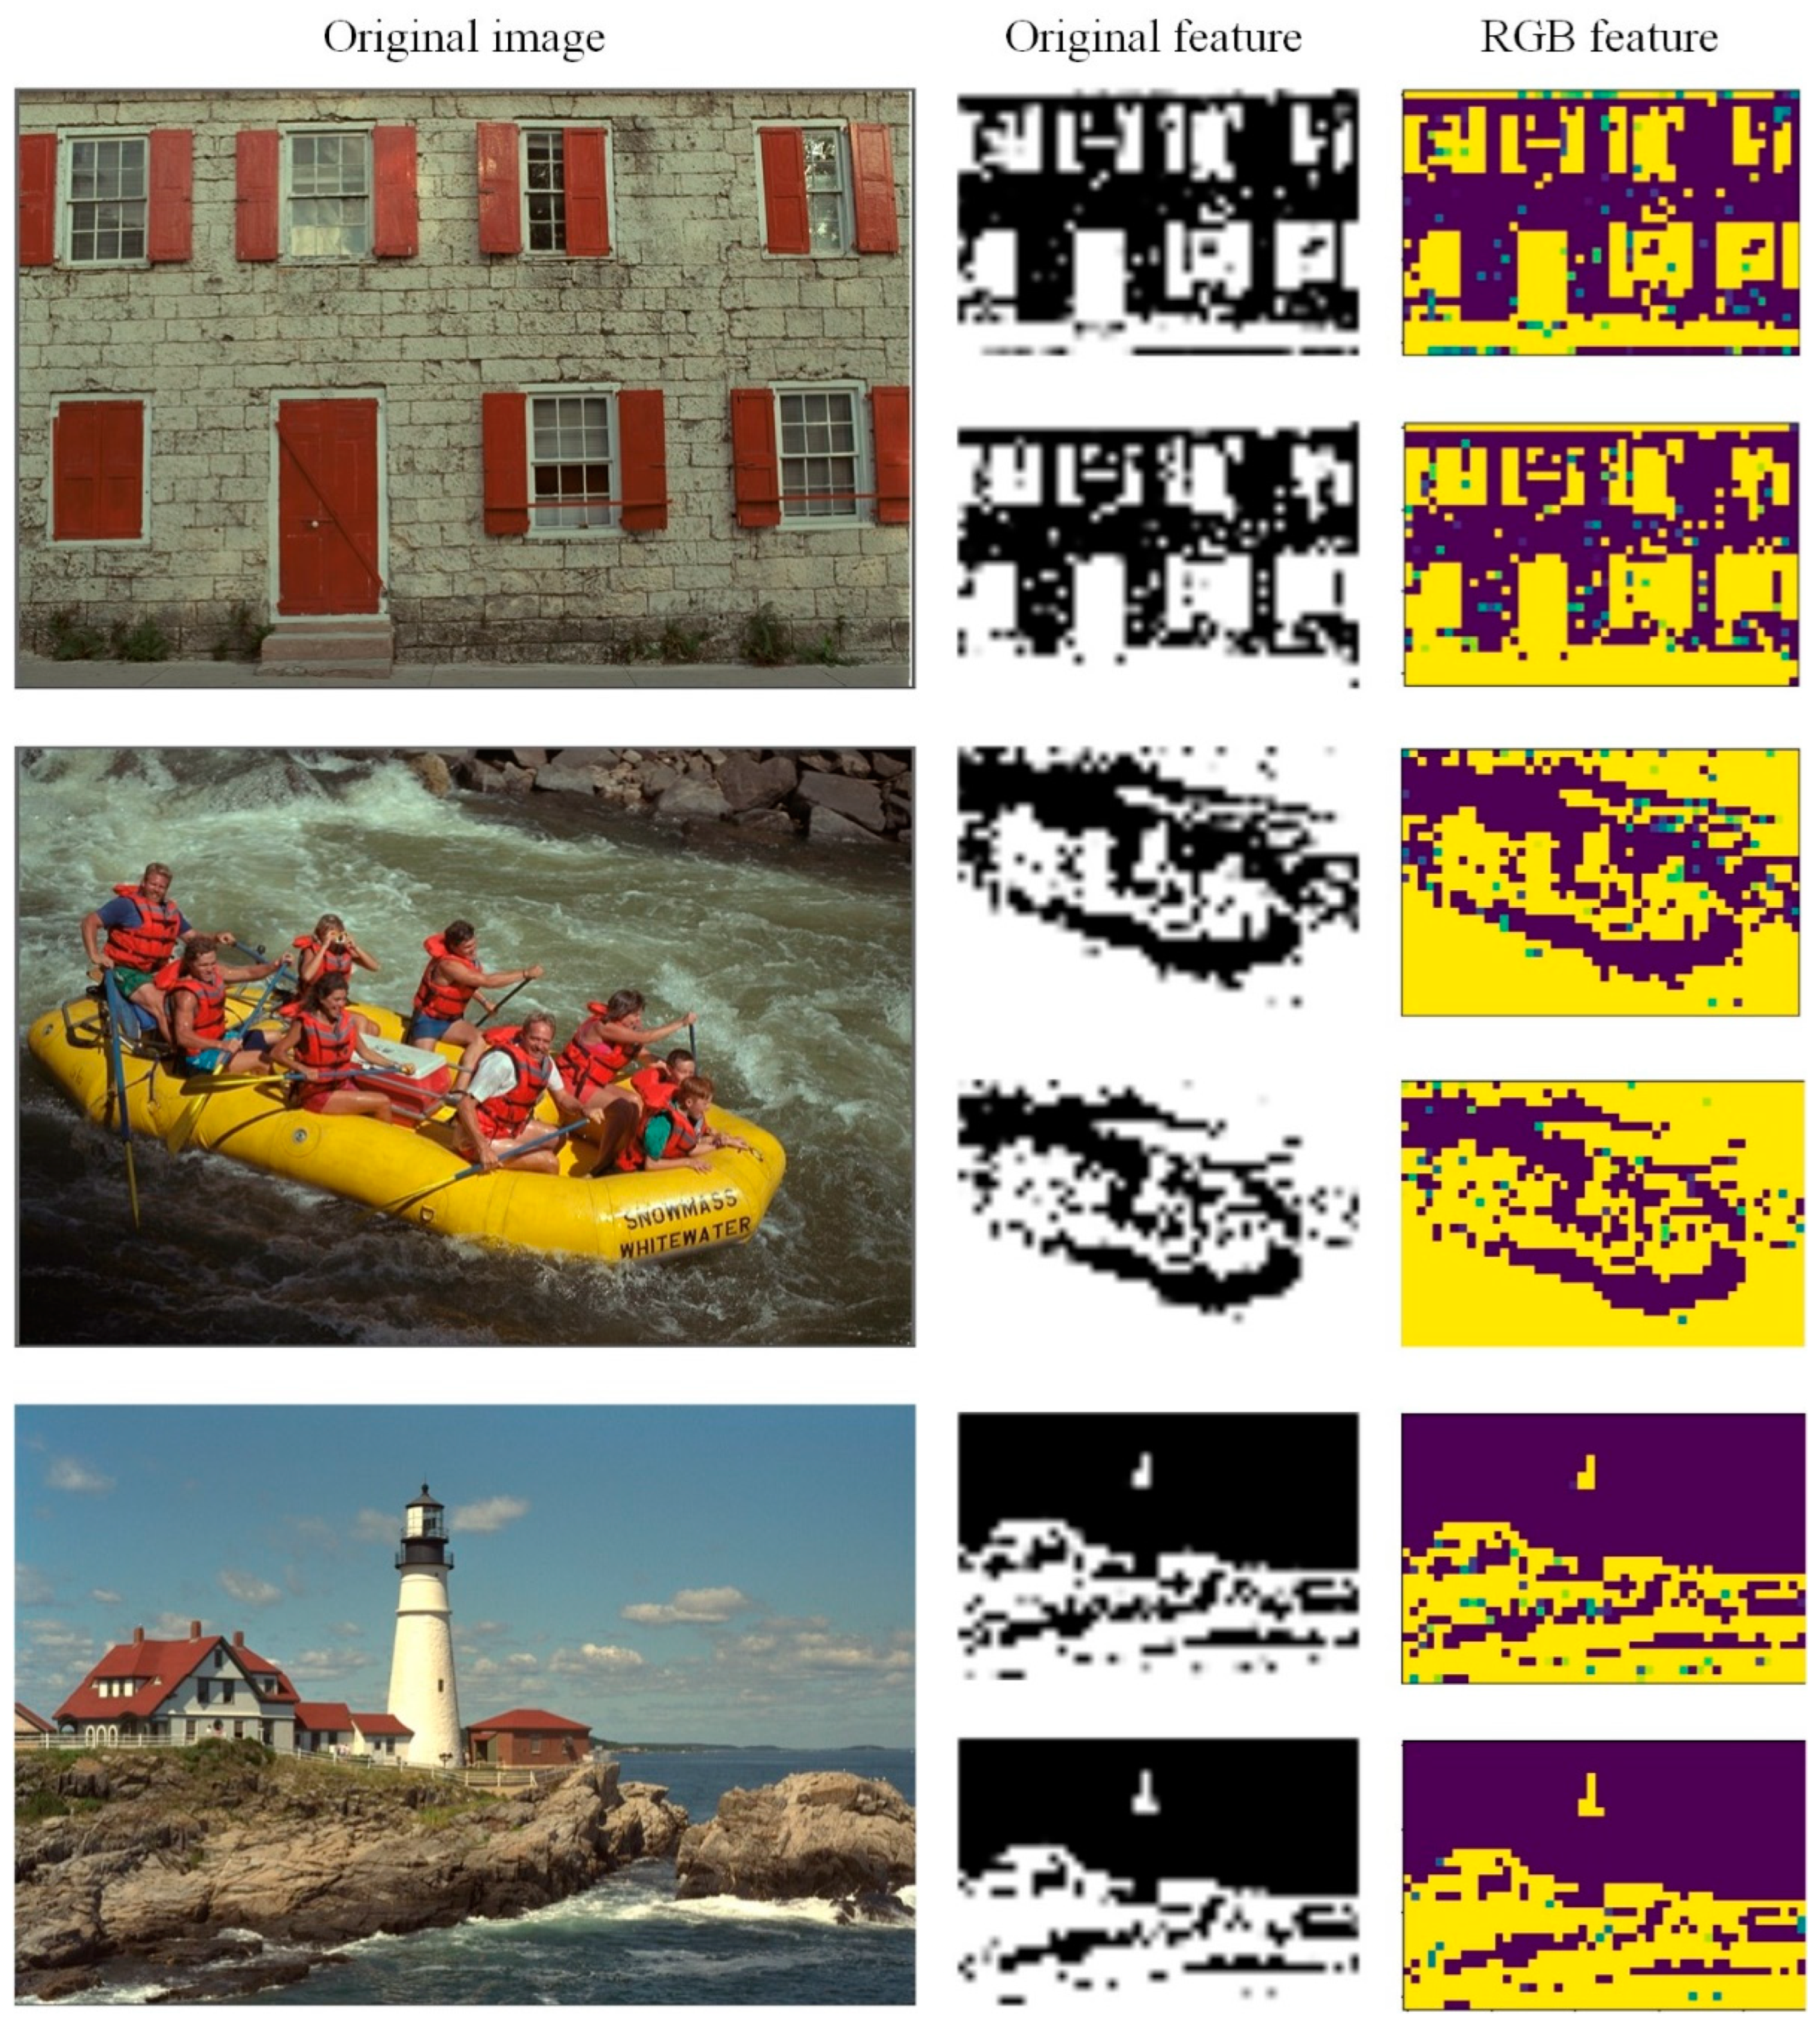
We researched the most commonly employed auto-encoder architectures [4,5,8,9] and found two main problems. First, there is an imbalance between the performance of the encoder and the hyperencoder. The role of the encoder is to reduce the dimensionality of the input data while converting the color domain data into feature domain data. The hyperencoder takes the output of the encoder as input and serves to extract the Gaussian likelihood of the latent representation. This modeling approach quantifies the compression rate as information entropy and thus can be used as a rate distortion loss function to optimize the network parameters. Similar to the training of GAN, after the encoder has extracted the image features, the performance of the hyperencoder is not sufficient to extract satisfactory Gaussian likelihood parameters. Second, the generated latent representation groups still contain eliminable redundant information from the same features (in this work, we characterize each element in the latent representation as a feature), as shown in Figure 1. However, due to the characteristics of the convolutional kernel, the convolutional operations cannot capture and eliminate this redundant information properly. To solve the limited perceptual field problem of convolutional operations, many nonlocal methods [21,22,23] have been proposed. Based on this, Wang et al. [24] propose a nonlocal neural network that was utilized in image compression by Chen et al. [25] to achieve improved results.

Figure 1.
Feature maps of three randomly selected sample images in 214-th and 223-th dimensions of the latent representation with 256 channels. It can be seen that the latent representation generated by the encoder has a fixed form, even if taking different images as inputs, the feature maps perform a similar style under the same channel, which is the basis for the construction of our non-local cross-channel efficient graph. We can create a generic graph for secondary processing of the generated feature maps. We use natural images as examples because objects inside remote sensing images occupy very limited pixels and it is difficult to tell the difference after extracting features.
In addition, the attention module, the core mechanism of the Transformer, has also been proven to capture the long-range dependencies of the data and fit large amounts of data. Different from convolutional operations with local properties, attention is a deep building block that can be utilized to capture the global perceptual field, and it enables the vision transformer to capture the long-range dependencies of the data. However, pairwise operator matching on spatial locations consumes a large amount of memory as well as computational complexity. To alleviate this problem, the sparse attention mechanism is proposed. The hand-designed matching method makes each query in the attention mechanism match only a portion of key-value pairs, where the local window and axial stripe implementations are explored. We believe that attention sampling only according to local windows and hand-designed stripes is suboptimal because the long-range context is not attended to, and such attention is usually not task-intelligent. In a coding task such as compression, it is more important to consider the global contextual information; based on this, the relevance search between features should be global, while sparsity is achieved by retaining the most relevant information and filtering out the sub-relevant information.
The development of graph neural networks (GNNs) [26,27,28,29,30,31,32,33,34,35] also provides more possibilities for nonlocal feature extraction and feature fusion; in addition, GNNs are more targeted and interpretable for secondary processing of latent representations in redundancy reduction. Due to the operation characteristics of the deep network, a well-trained compression model tends to generate fixed-pattern latent representations for different inputs (as shown in Figure 1). Therefore, we additionally incorporate a nonlocal cross-channel efficient graph in the encoder backend to further improve the compression performance of the network.
In addition, compared with previous approaches to enhance the perceptual field through an attention mechanism and graph attention mechanism [36], the proposed sparse attention module and NCEG focus on seeking correlations among similar features with long-range dependencies and thus achieve a more satisfactory rate-distortion performance. In other words, the proposed approach de-couples extending the receptive fields from feature aggregation, and the function of extending receptive fields is implemented in a long-dependent residual architecture.
Our contributions can be summarized as follows:
- (1)
- To address the extraction ability imbalance between the encoder and the hyperencoder, an enhanced image compression network that incorporates a residual block and a parameter estimation module on the hyper-encoding side is explored to reinforce the feature extraction performance of the hyper-encoder.
- (2)
- It has been discovered that there is a fixed pattern in the generation of latent representations by encoders. To address this problem, a NCEG is proposed for secondary processing of latent representations. Specifically, NCEG is divided into two processes, namely graph generation and graph aggregation. The NCEG module associates similar feature maps to further improve the side information extraction performance of the hyper-encoder.
- (3)
- A long-dependent residual network is selected as the backbone, and a sparse attention module is inserted into the encoder/decoder side to enlarge the perceptual field of the network. Note that without a matching hyper-encoder, simply replacing the original attention mechanism with a sparse attention mechanism will not improve the rate-distortion performance.
- (4)
- The overall performance of the proposed model is evaluated on two public datasets. The experimental results demonstrate that the proposed approach achieves optimal results on two evaluation datasets.
2. Related Works
In this section, we review key techniques of graph neural networks and techniques such as nonlocal processing and attention mechanisms that have been applied to image compression. Finally, we briefly describe traditional compression methods and several influential learning-based compression frameworks.
2.1. Graph Neural Network (GNN)
Traditional mathematical modeling (e.g., deep neural network, convolutional neural network, and recurrent neural network) cannot provide reliable solutions for logically complex tasks, and in order to explore deeper internal associations of objects in specific problems, graph neural networks based on graph theory have been proposed and have achieved positive results in various fields, such as natural language processing [26,27], recommending medication combinations [25,28], 3D scene analysis [30,31], and recommender systems [32,33]. Applications in image processing have also been explored, involving image denoising [34], image super-resolution [35], and image compression [36]. These studies demonstrate the critical role of graph neural networks in exploring the potential connections between instances.
2.2. Nonlocal Processing
Conventional filters that process data by adopting a weighted average of spatially adjacent elements suffer from a restricted field of perception. For image processing, a single convolution operation handles the local domain in both time and space domains, and long-distance data dependence is achieved by deep convolution [37]. The classical nonlocal means method first achieved good results in image denoising [38]; following this, more application areas and more efficient implementations of nonlocal methods have been explored. In particular, they are utilized in the internal coding of HEVC-based [39] screen content compression. Extensive research has demonstrated that nonlocal operations have been applied to the internal coding of deep learning, achieving significant performance gains.
2.3. Attention Mechanism
Attentional mechanisms have been popularized in deep-learning image vision. As an enhanced strategy, they play a vital role in the extraction and generation of adaptive features in images. The authors of [8,25] explored various possibilities in image compression using attention mechanisms. However, the fixed extraction property of deep learning models dictates that not all information needs to be taken into account, and excessive consideration of irrelevant data may also cause performance degradation. Researchers have explored the implementation of sparse attention in different visual tasks [40,41,42,43]. In this work, we also implement feature extraction using a sparse attention mechanism on the encoder/decoder side.
2.4. Hand-Crafted Compression
Existing compression standards such as JPEG [1], JPEG2000 [2], and BPG [3]. rely on hand-crafted modules. Specifically, most of them employ fixed transform and quantization coding frameworks, such as discrete cosine transform and discrete wavelet transform. Such approaches contain serious problems; for example, transform with image blocks tends to produce block effects as the compression steps are manually constructed based on a priori knowledge and thus lack flexibility. Choi et al. [44] replaced one process of the existing image compression (quantization) with deep learning, and they achieved satisfactory results.
2.5. Learned Compression
Deep learning-based compression methods have been widely studied in recent years and have achieved great success in terms of reconstruction quality and rate-distortion. To the best of our knowledge, there are three basic methods for deep learning compression.
The most applied method is the CNN-based auto-encoder architecture, which converts the original input at the pixel level to a latent space, which is more suitable for compression. After the feature extraction by the encoder, quantization and lossless entropy coding (arithmetic coding) are employed to generate the final code stream. In the decoding stage of compression, the reconstructed image is obtained after two decoding steps to complete the whole image compression and reconstruction process. For example, the authors of [4,5,6,7,8,9,10,19] all improved on this approach, yielding satisfactory results. Nevertheless, there is still room for improvement in the extraction of latent representations.
In addition to CNNs, recurrent neural networks [11,16] have also shown unique advantages in the field of image compression. This type of approach saves computational power and overhead in terms of the network parameters; however, the rate-distortion metric is lower than that of the CNN network architecture.
Finally, due to the training characteristics of GAN, these image compression methods [13,14,15] are mainly used for image compression problems at extremely low bit rates and achieve higher results than CNN-based methods on these. In addition, GAN-based methods are also used for intra-prediction in video coding [45].
3. Proposed Methods
3.1. Formulation of Learned Image Compression
Image compression, as a special form of image reconstruction, requires an additional bitrate restriction.
In deep learning, this Lagrangian multiplier-based rate-distortion optimization [8] can be expressed as follows:
where denotes the optimization objective, is the bitrate, and denotes the reconstruction loss between the original images and the reconstructed images . Then, performs as a Lagrangian multiplier to balance and .
In the current advanced autoencoder architecture, consists of two components, which can be formulated as follows:
where denotes the quantified latent representation and is the quantified side information. Because we make no prior for , a fully factorized density model is adopted [4]. In the transform coding process of the neural network, image compression can be expressed as:
where represents the latent representation, and is the quantizer. , , and () denote the parameters of the encoder, decoder, and hyper-encoder, respectively. is conditioned by the output of the hyper-decoder . We wish to discover more appropriate , , and to better evaluate the trade-off between the loss function in the end-to-end learning. commonly denotes the convolution using a non-linear process.
3.2. Sparse Attention Module
Traditional sparse attention is divided into two formats, sparse patterns based on manual design, and sparse forms that sample a subset of all key-value pairs obtained as attention. Inspired by [46], we employed a queriable attention mechanism that focuses on filtering out the most irrelevant key-value pairs in a coarse region and retaining the most important key-value pairs. The purpose of image compression is to eliminate potential redundant information in the image and retain only the most relevant and influential part of the information with the highest impact on the quality of the generated image, which is consistent with the principle of sparse attention. The sparse attention mechanism should not be implemented just to maintain sparsity, but to make the network more focused on critical information while ensuring sparsity.
Given a feature , the sparse attention module transfers to a high-level representation and in other domains. The process can be expressed as:
where represents the sequential execution of the flattening and transposition operations. and are the operations of the transformation, and typically, convolutional neural networks and activation functions are used to build the transformation process. Then, we utilize the Spherical Locality Sensitive Hashing (LSH) [28] on ; LSH is employed to match similar features. In this step, we generate a hash vector with m dimensions for each position in the feature space. By ranking H and performing a remainder operation, we can obtain the relevance ranking of the features in each of the m dimensions. Based on the ordering of the hash codes in m dimensions, we can extend and as and . The hash vectors are obtained based on the channels, and we obtain the degree of correlation in the spatial dimension to generate a matching score vector . The associated processes can be formulated as follows:
where denotes L2 regularization. We derive the correlation matrix of features in spatial locations by calculating the similarity. We triage similar features from irrelevant features using the SoftMax function. Sparsity is achieved by setting the value below to 0. In this paper, we set to 0.1 and it achieved the optimal experimental results.
Finally, the latent features with the same dimension as the input are employed for weighting and aggregation.
Here, is a constant acting as a residual factor, and it can be adjusted to control the gap between the features output by the attention mechanism and the input features. The function reshapes the input to the dimension of . For low-level vision tasks such as image compression, this form of output is not suitable; so, we employed the following organization (as illustrated in Figure 2):
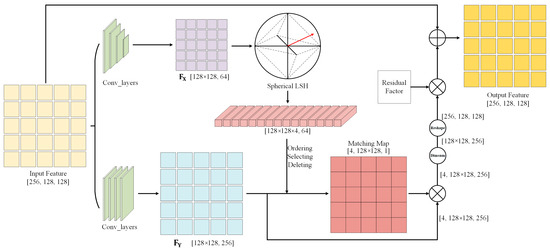
Figure 2.
The overall process of the sparse attention module.
3.3. Overall Network Architecture
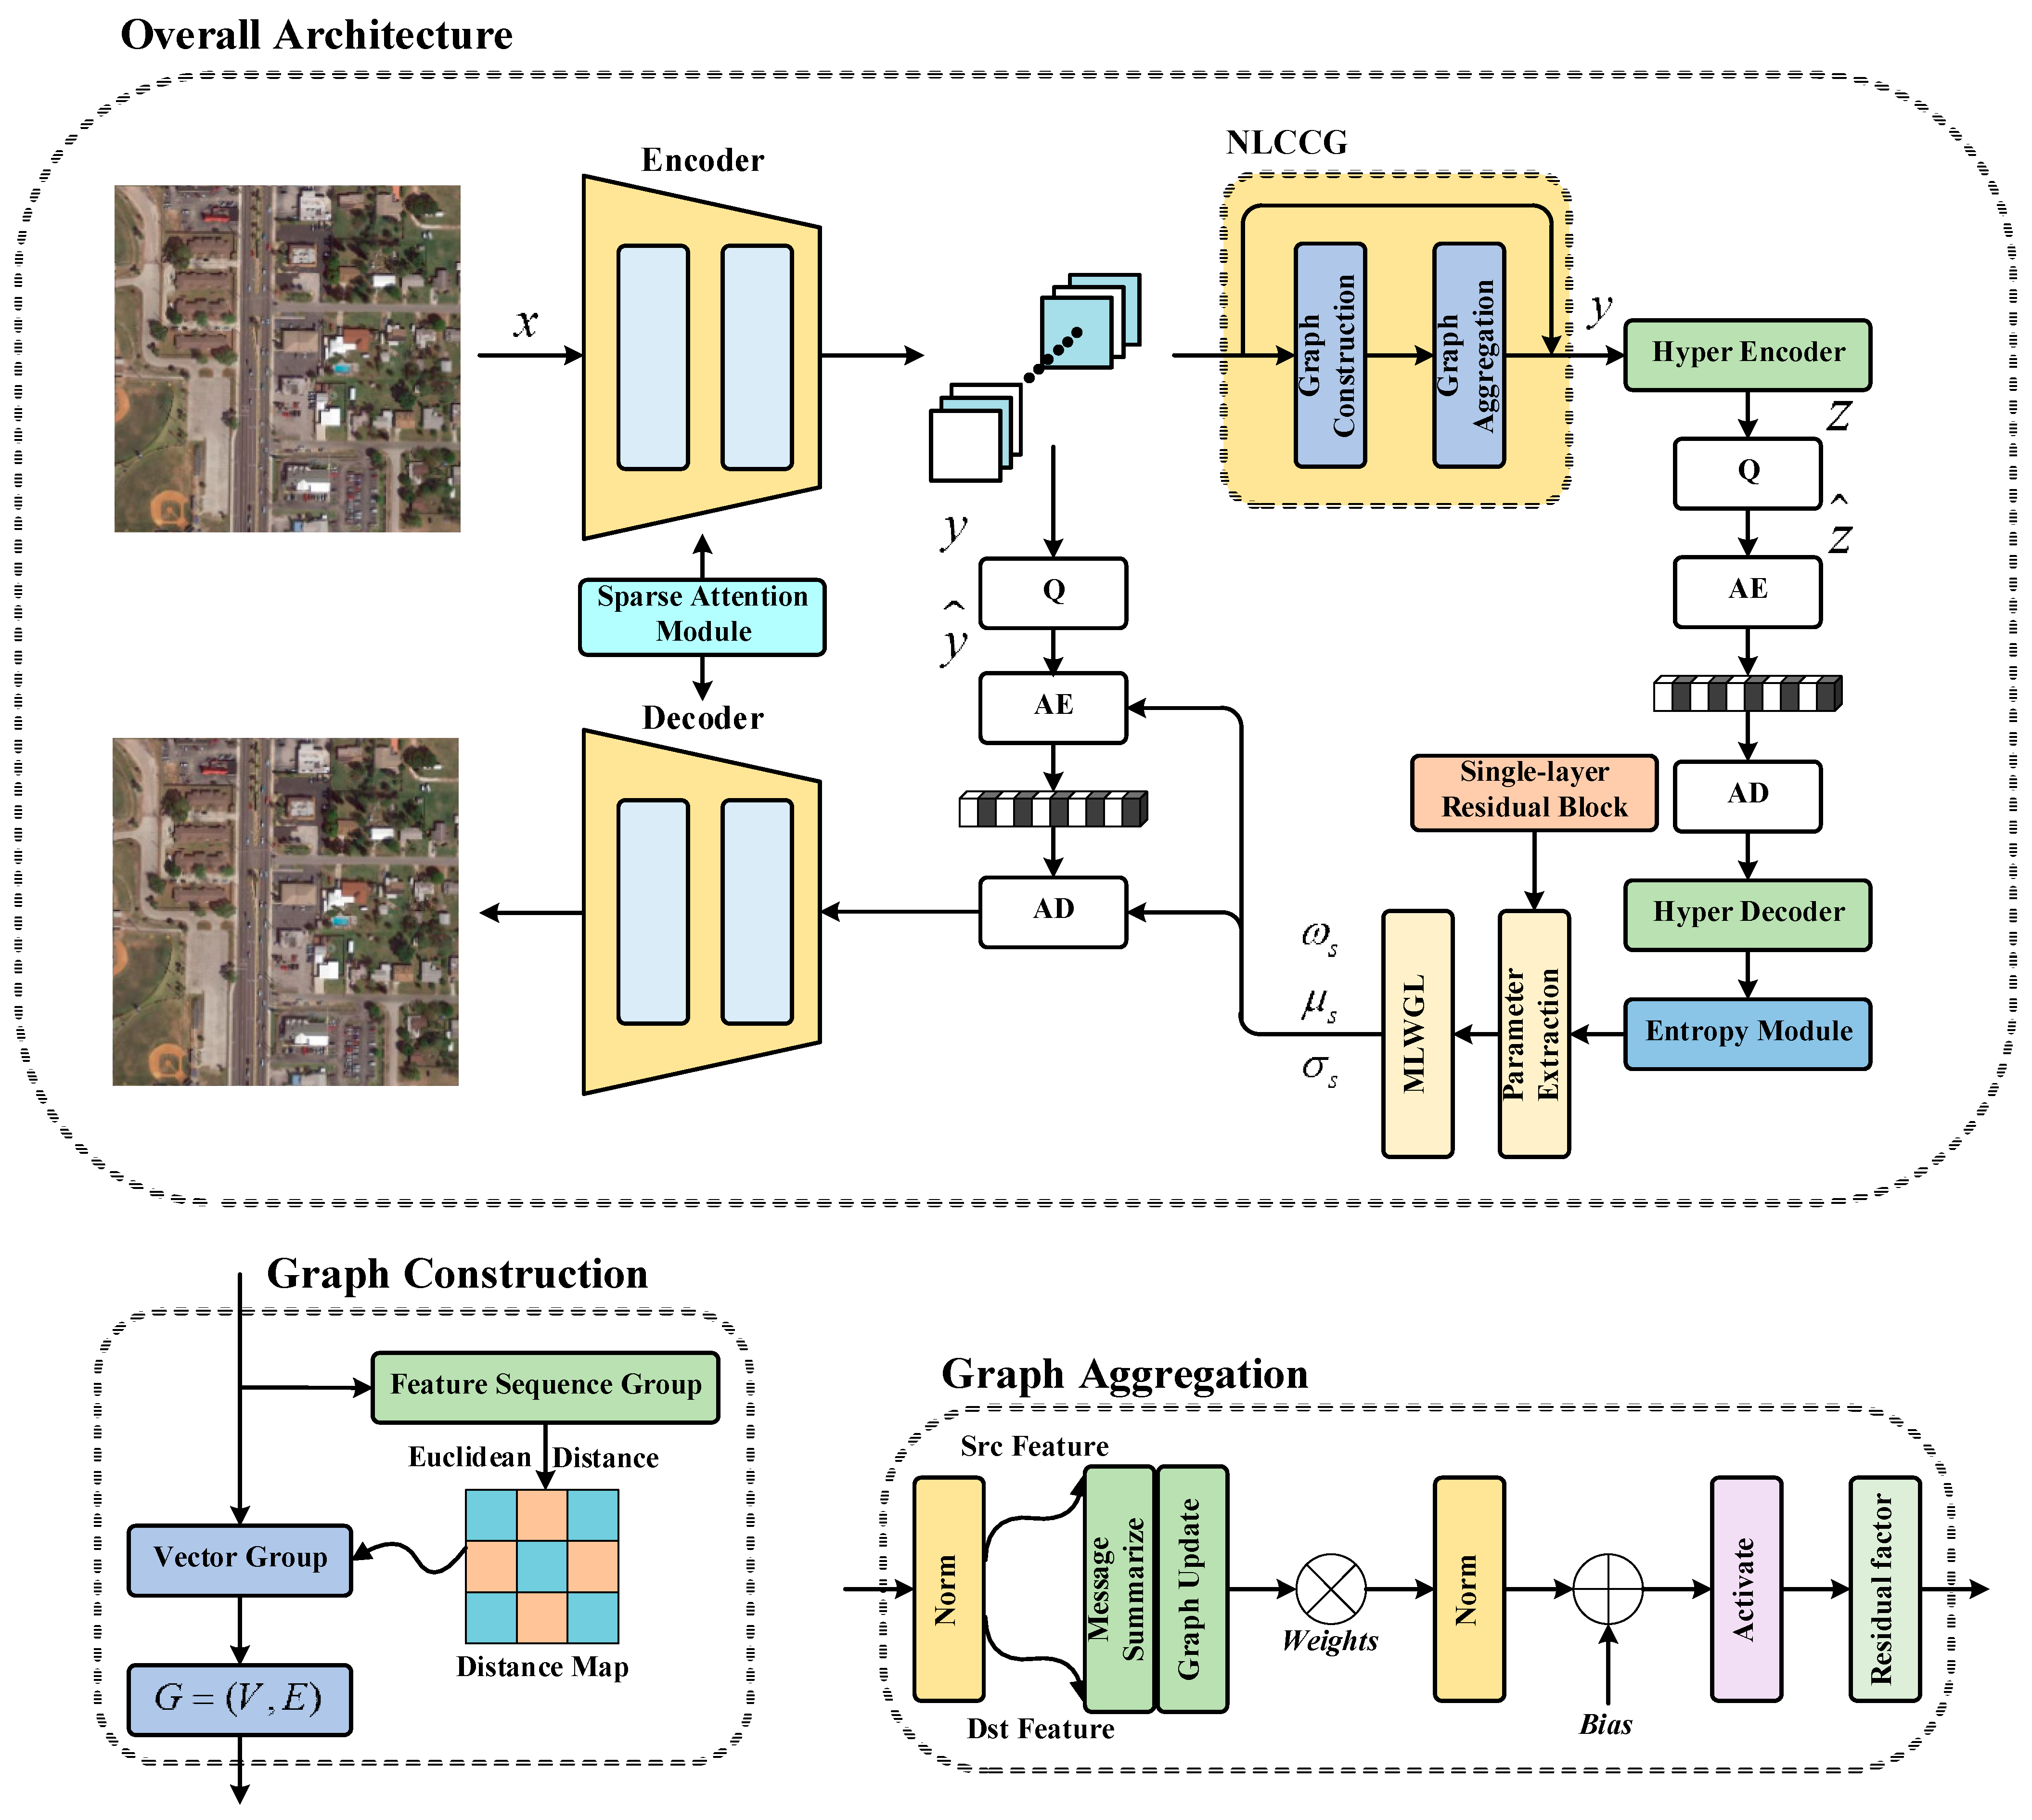
As demonstrated in Figure 3, we adopted a similar auto-encoder structure to that in [47], employing the residual and long-dependent convolution structure at both the encoding and decoding sides to improve the rate-distortion performance [48]. We replaced the simplified attention module used in [47] with the employed sparse attention module; further, we adopted the nonlocal cross-channel efficient graph to analyze potential relationships between similar features in the latent representation to better guide the work of the entropy module. In the hyper-prior part, we employed the most prevalent CNN-based hyper-encoder and hyper-decoder. Furthermore, multi-layer weighted Gaussian likelihood (MLWGL) was adopted to calculate the entropy of the latent representation, and this encoding approach has been proven to be superior to the traditional single-layer Gaussian likelihood estimation [8]. Before extracting the Gaussian likelihood parameters, we employed a parameter extraction module, which is composed of a single-layer residual block. The employed encoding approach can be formulated as follows:
where K is the number of layers, denotes the Gaussian likelihood, and , , and represent the weight value, the mean value and the variance value of the k-th layer, respectively. In this work, we adopted three layers.
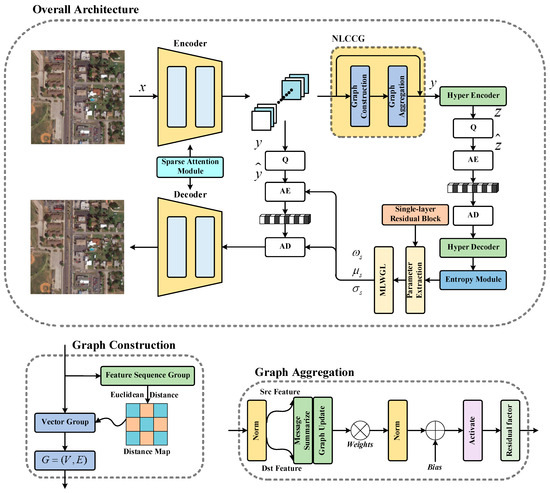
Figure 3.
Overall architecture. (Top) overview. (Bottom Left) graph construction model. (Bottom Right) graph aggregation model.
Then, the entropy module was formulated as:
where is the i-th feature in ,and N denotes the number of features (channels). Each feature is modeled as a multi-layer weighted Gaussian likelihood with a unit uniform distribution to better match the latent representation before quantization and after quantization.
3.4. Nonlocal Cross-Channel Efficient Graph
In the forward propagation of generating latent representation , there are many features with extremely high similarity in the final results, and these features extract the prior information separately in the hyper-encoder, which undoubtedly increases the bit cost of the network. If the network can capture more efficient and tighter connections between individual features in , then the network parameters of the auto-encoder and hyper-encoder can be better updated to optimize the rate-distortion metric. We inserted a NCEG after the encoder to compensate y. We grouped the features at a resolution of 16 and input them separately into the network for calculation. This allows for sparser and more efficient training and inference. In the graph construction phase, we referred to a non-local algorithm [23] to search for features with high similarity, which was formulated as:
where and denote the input and output of the i-th position, computes the correlation, and calculates the feature of the input tensor. represents the normalization operation.
Specifically, we arranged the features in the form of vectors to obtain a one-dimensional tensor group and then performed a feature domain transformation on each tensor to obtain a feature vector group , , where is the feature vector of in other feature space, the distance between each feature can be obtained by the Euclidean distance, and the dot-product similarity [22] is also applicable. The process can be formulated as follows:
Here, computes the similarity scalar between and . and , where the learnable parameters and transform the input tensor to other feature space. denotes the dot product of the input vectors.
For visualization, we generate a distance map between features as follows:
is a real symmetric matrix; the values in the matrix represent the distances between features, and the similarity increases as the values decrease. Visually, a black pixel represents close distance, and a white pixel represents far distance (as shown in Figure 4). We further applied a sparse implementation to , the core principle of which is to take the most relevant part of the features and aggregate them; the process can be formulated as follows:
where denotes the sparse representation of , and the function can be illustrated as:
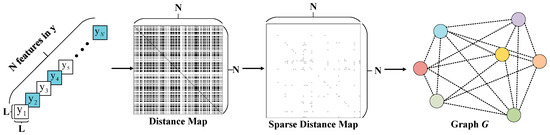
Figure 4.
An example of graph construction process. A feature aggregation graph is generated based on the distance map.
actually represents a connection matrix, and the values 1 and 0 only represent the connection between two features.
In graph modeling , represents the features in the latent representation , which we model as points in sequential order, while represents the connections (edge) between similar features.
After NCEG, similar features are correlated, and these features can learn more information from other similar features to optimize the entropy model as follows:
Inspired by the traditional graph aggregation strategy [49], we aggregated similar features in graph following the edge weights, and the graph aggregation strategy can be expressed as follows:
where represents the iteration, . and are the weight and bias factor during aggregation, respectively. is the list of in-degree neighbors of node . represents the arithmetic square root of in-degrees (i.e., ). is the activation function and represents the value of , which is normalized based on the number of out-degrees. denotes the weight scalar of the edge from node to . In our network architecture, the edge weights are formulated as in order to simplify the computation of the model. and are learnable parameters, which dynamically optimize the weights more suitable to the compression task, rather than just setting weight values based on distance. Finally, a multiplicative residual factor is compensated to the aggregated features as the output of the graph aggregation module. For simplicity, we reorganize Equation (24) as:
4. Experiments and Analysis
4.1. Experimental Setup
Images from the CVPR workshop CLIC training dataset [12] and the DOTA dataset [50] were selected to train the entire model. Two datasets were mixed to train the network to achieve more knowledge learning in the image domain. The images were randomly cropped into patches of size 256 × 256 and fed into the network on RGB channels. The entire models were trained for 1M steps using the Adam optimizer, where the batch size was set to 8. The initial learning rate was set to 1 × 10⁻⁴ and dropped to 8 × 10⁻⁵ and 4 × 10⁻⁵ in the 800 k iterations and 900 k iterations, respectively. The proposed network was carried out on the PyTorch framework, using a server with an NVIDIA Tesla V100 GPU for optimization.
Different compression ratios were achieved by switching . When optimizing the whole network, belonged to the array {256, 512, 1024, 2048, 3072}. For the latent representation , the number of channels was set to 192 when was {256, 512} and to 256 with other settings, which were also the values of the convolution channel for both the encoder and the hyper-encoder.
We first used the baseline model with a small number of parameters (loaded with a simple attention module) for pre-training on natural images for 30 epochs, followed by fine-tuning on a mixed dataset by adding a large number of parameter modules (NCEG and parameter extraction module) and changing the attention mechanism.
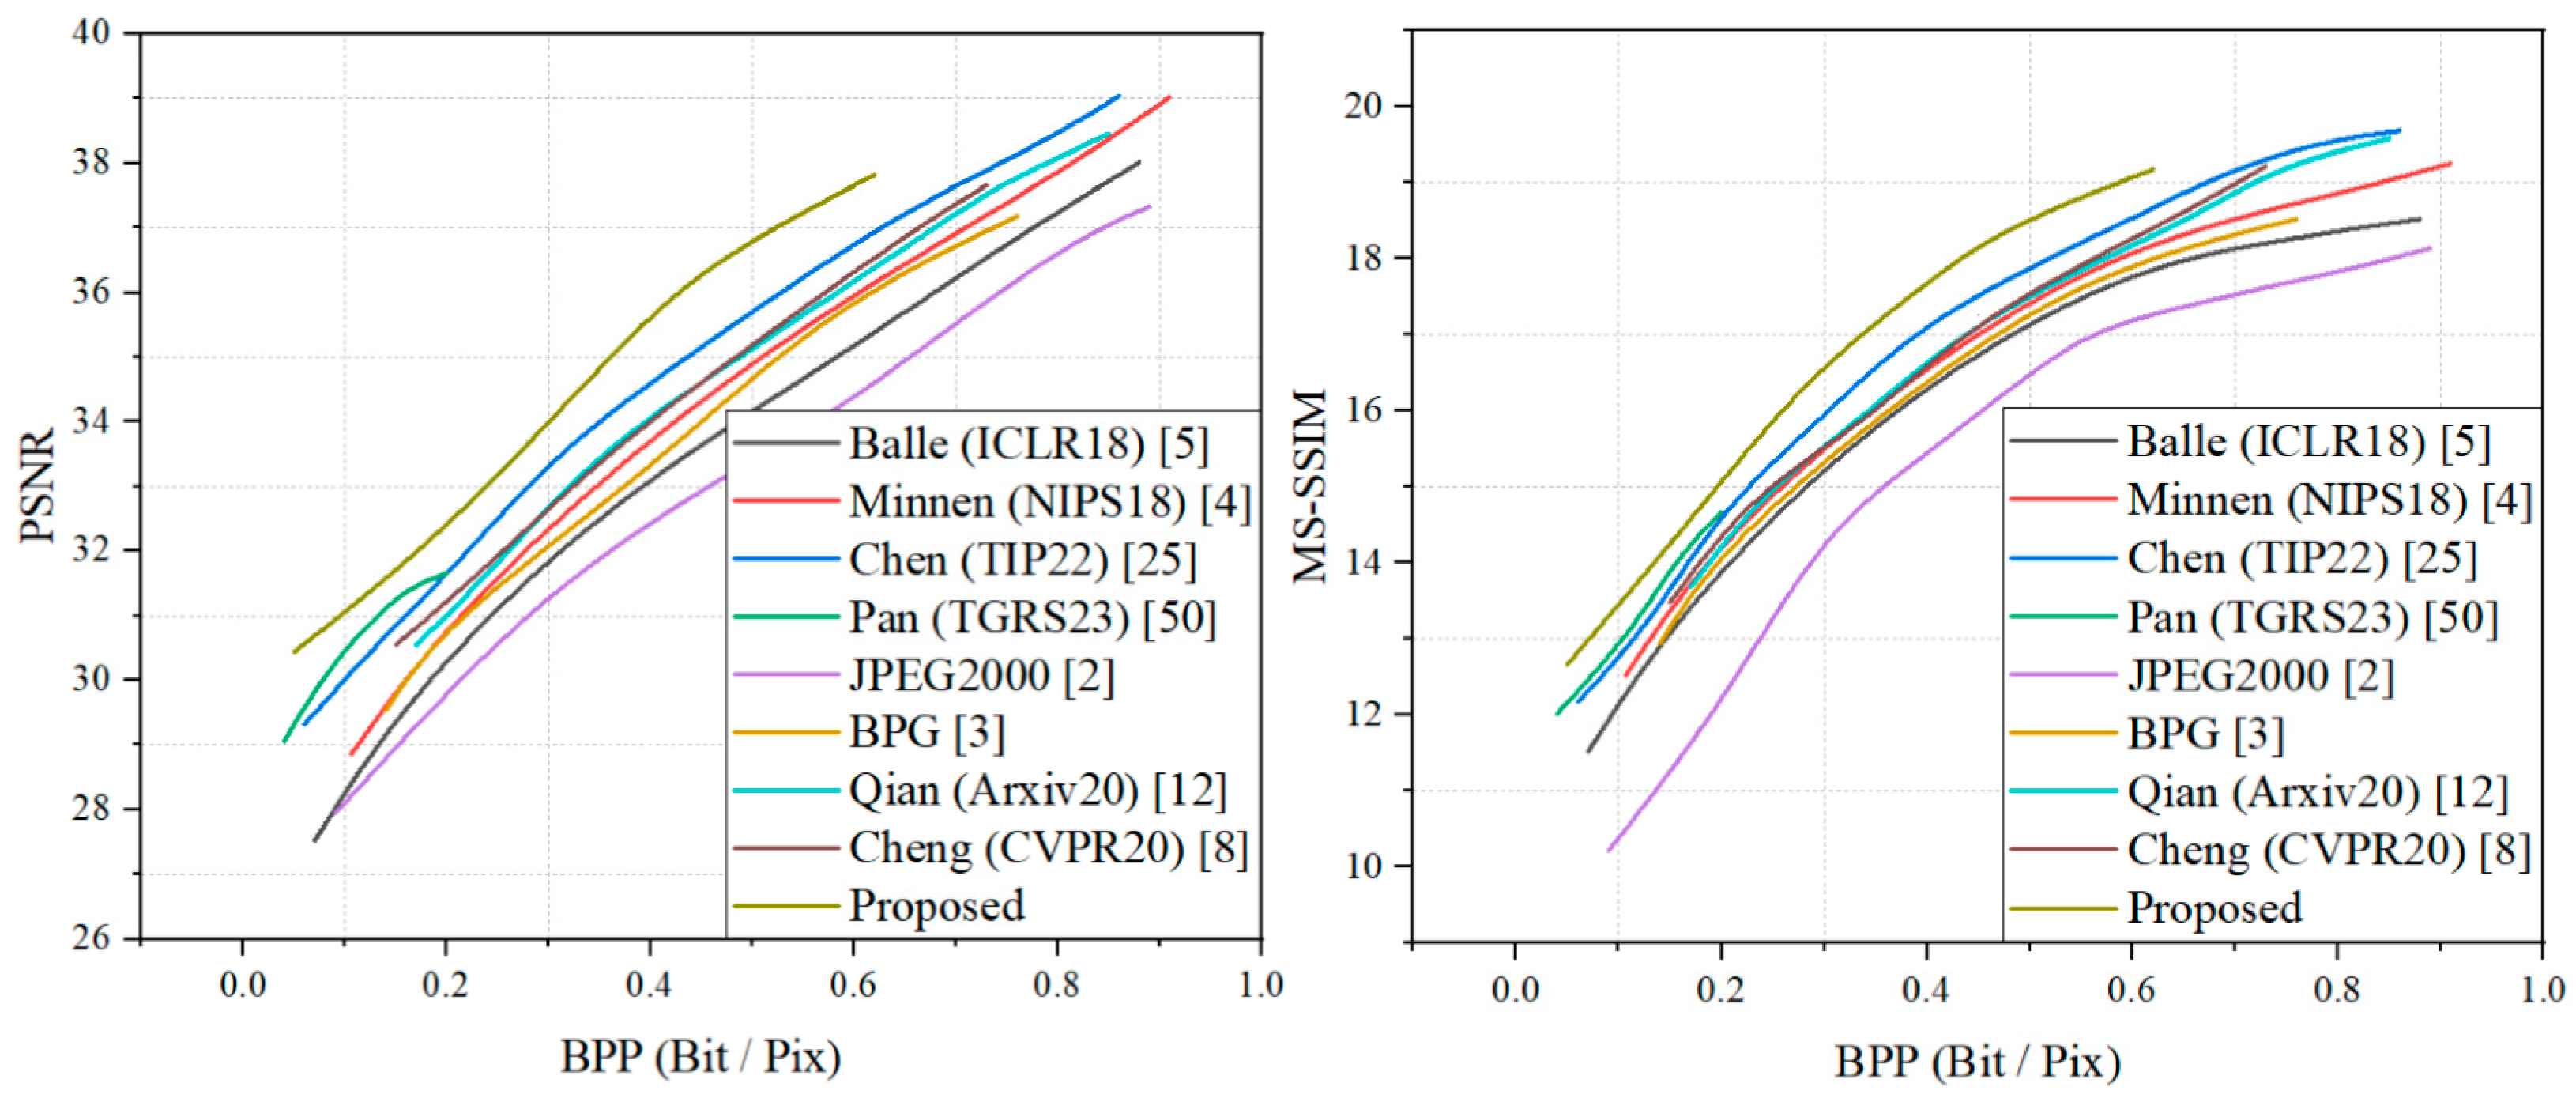
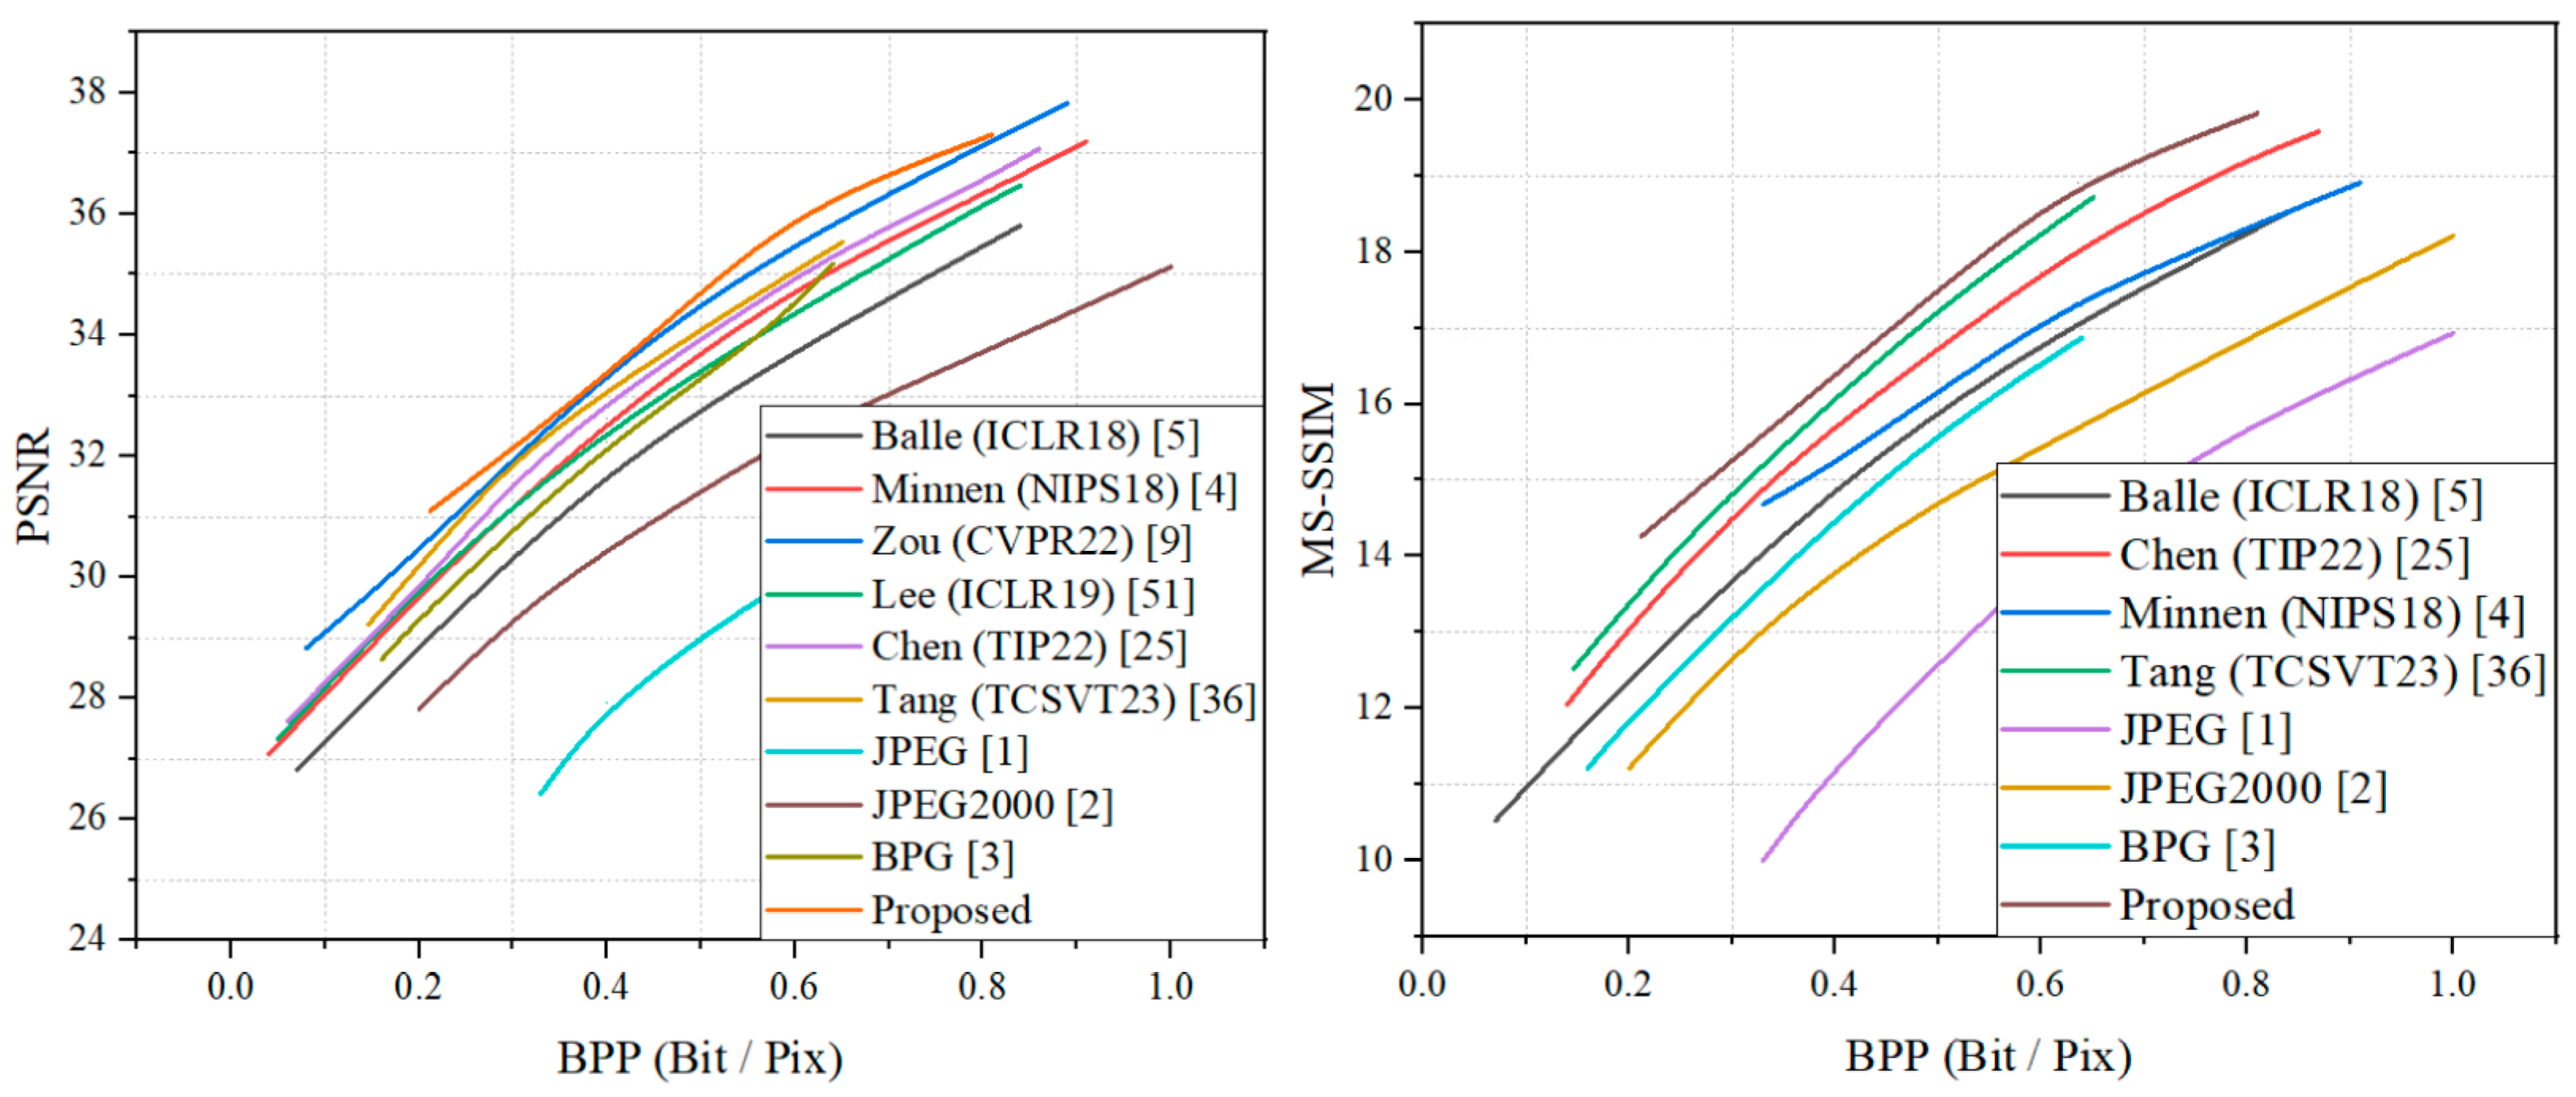
Our entire model was evaluated by calculating the average RD performance on the DOTA dataset [50] and the Kodak dataset. For evaluating the DOTA dataset, the traditional compression standards JPEG-2000 [2], BPG [3], and the learned compression methods of Chen et al. [25], Minnen et al. [4], Balle et al. [5], and Pan et al. [50] were employed to compare the final results. For natural images, Balle et al. [5], Minnen et al. [4], Zou et al. [9], Lee et al. [51], Chen et al. [25], and Tang et al. [36] were selected to compare the compression performance. PSNR and MS-SSIM were utilized as evaluation metrics.
4.2. Quantitative Results
The rate-distortion results of our model on the DOTA dataset and Kodak dataset are shown in Figure 5 and Figure 6. Both the PSNR and MS-SSIM were converted to dB to provide a more intuitive comparison of the effect on the model. It can be seen that the proposed method achieved optimal results both on the DOTA dataset for remote sensing and on the Kodak dataset for natural images. On the test set of remotely sensed images, the proposed method outperformed the method of Chen et al. [25] by about 0.9 dB in the PSNR metric and by about 0.5 dB in the MS-SSIM metric. Since the method of Pan et al. [50] focused on remote sensing image compression at extremely low bitrates, and due to the effect of the GAN training strategy, the growth rate of the PSNR showed a significant decreasing trend when the bpp rose. On the Kodak dataset, the proposed method still achieved optimal results, slightly above those for the method by Zou et al., and it outperformed the other compared learning-based methods and traditional compression criteria, displaying a significant advantage. The superior performance of the proposed method was demonstrated, i.e., it achieves satisfactory results in remote sensing images and has more obvious advantages in natural image compression. We additionally included natural images for comparison for three reasons: First, the proposed training strategy incorporates pre-training using the natural image dataset, which also contributes about 10 percent of the data volume in the mixed dataset. Second, natural images and remote sensing images are both RGB domain images, and although they have obvious image content differences, a sophisticated compression framework needs to have the ability to compress any images. Third, compression as a coding and decoding task uses a compression framework that focuses more on learning the likelihood of the latent representations and performing rate-distortion calculations through the likelihood, and richer data can have a positive effect on learning a more universal entropy model, so it is natural to think of testing the rate-distortion performance of natural images.
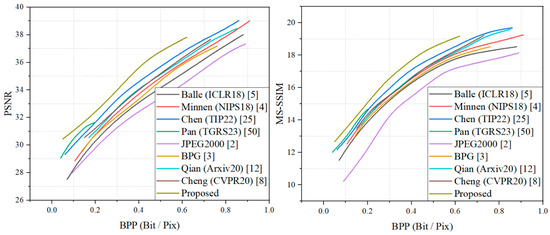
Figure 5.
RD performance on the DOTA dataset.
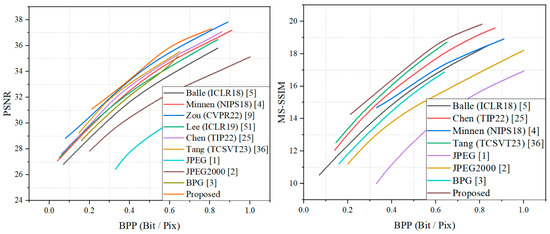
Figure 6.
RD performance on the Kodak dataset.
4.3. Qualitative Results
In this section, we compare the proposed method with Balle et al. [5], Chen et al. [25], JPEG [1], and BPG [3] methods on sample images from the testing DOTA dataset, kodim07 and kodim19 to demonstrate that our method produces visually pleasing results.
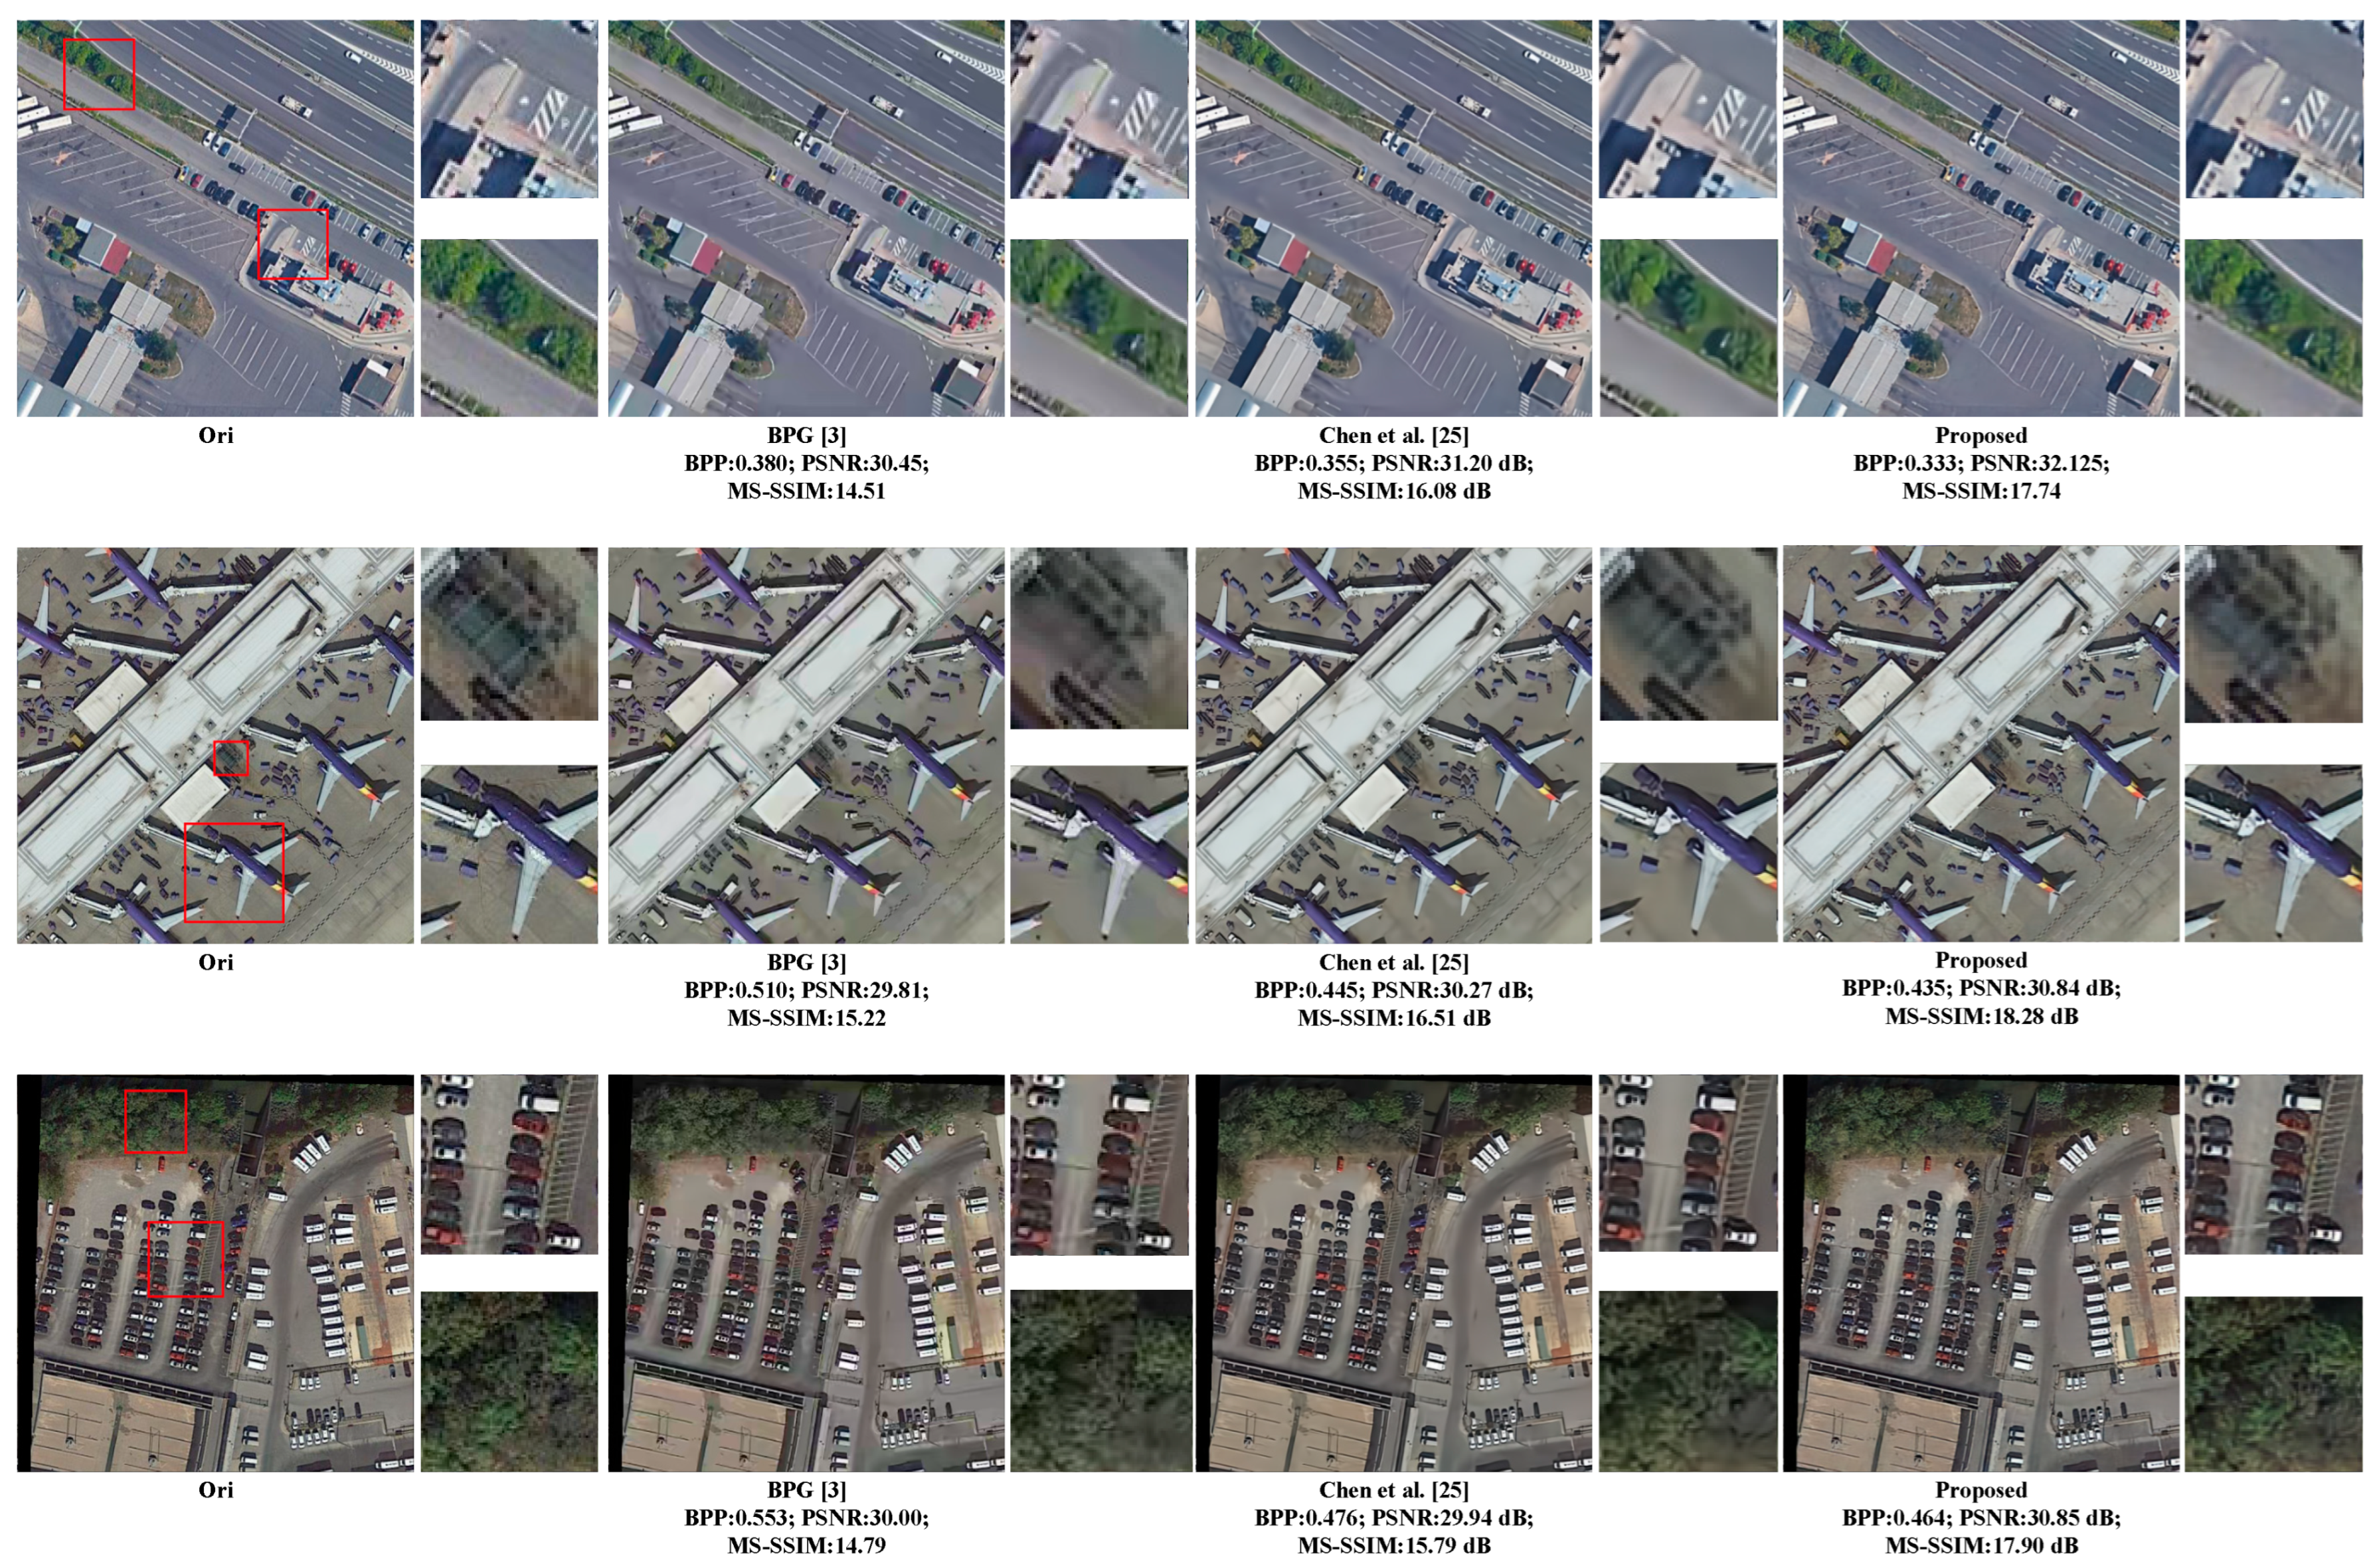
For the remote sensing images, the experiment compared the methods of BPG and Chen et al. The results are illustrated in Figure 7. Three remote sensing scenes were compared, namely a road, an airport, and a parking lot. Some parts of the three scenes (grass, buildings, airplanes, and cars) are shown in detail. It can be seen that the reconstructed images of the proposed method are clearer in details, and the texture information is closer to the original image, although both methods are optimized by using MSE, as the method of Chen et al. can better suppress the over-smoothing phenomenon.
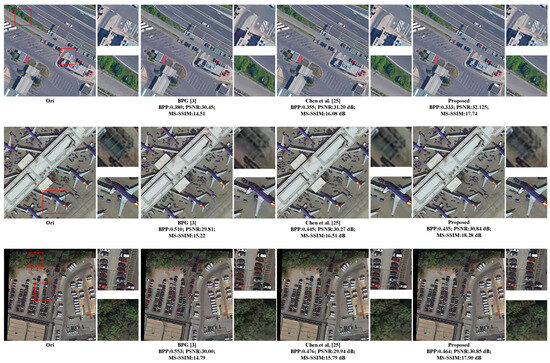
Figure 7.
Visualization of testing images on DOTA dataset after reconstruction.
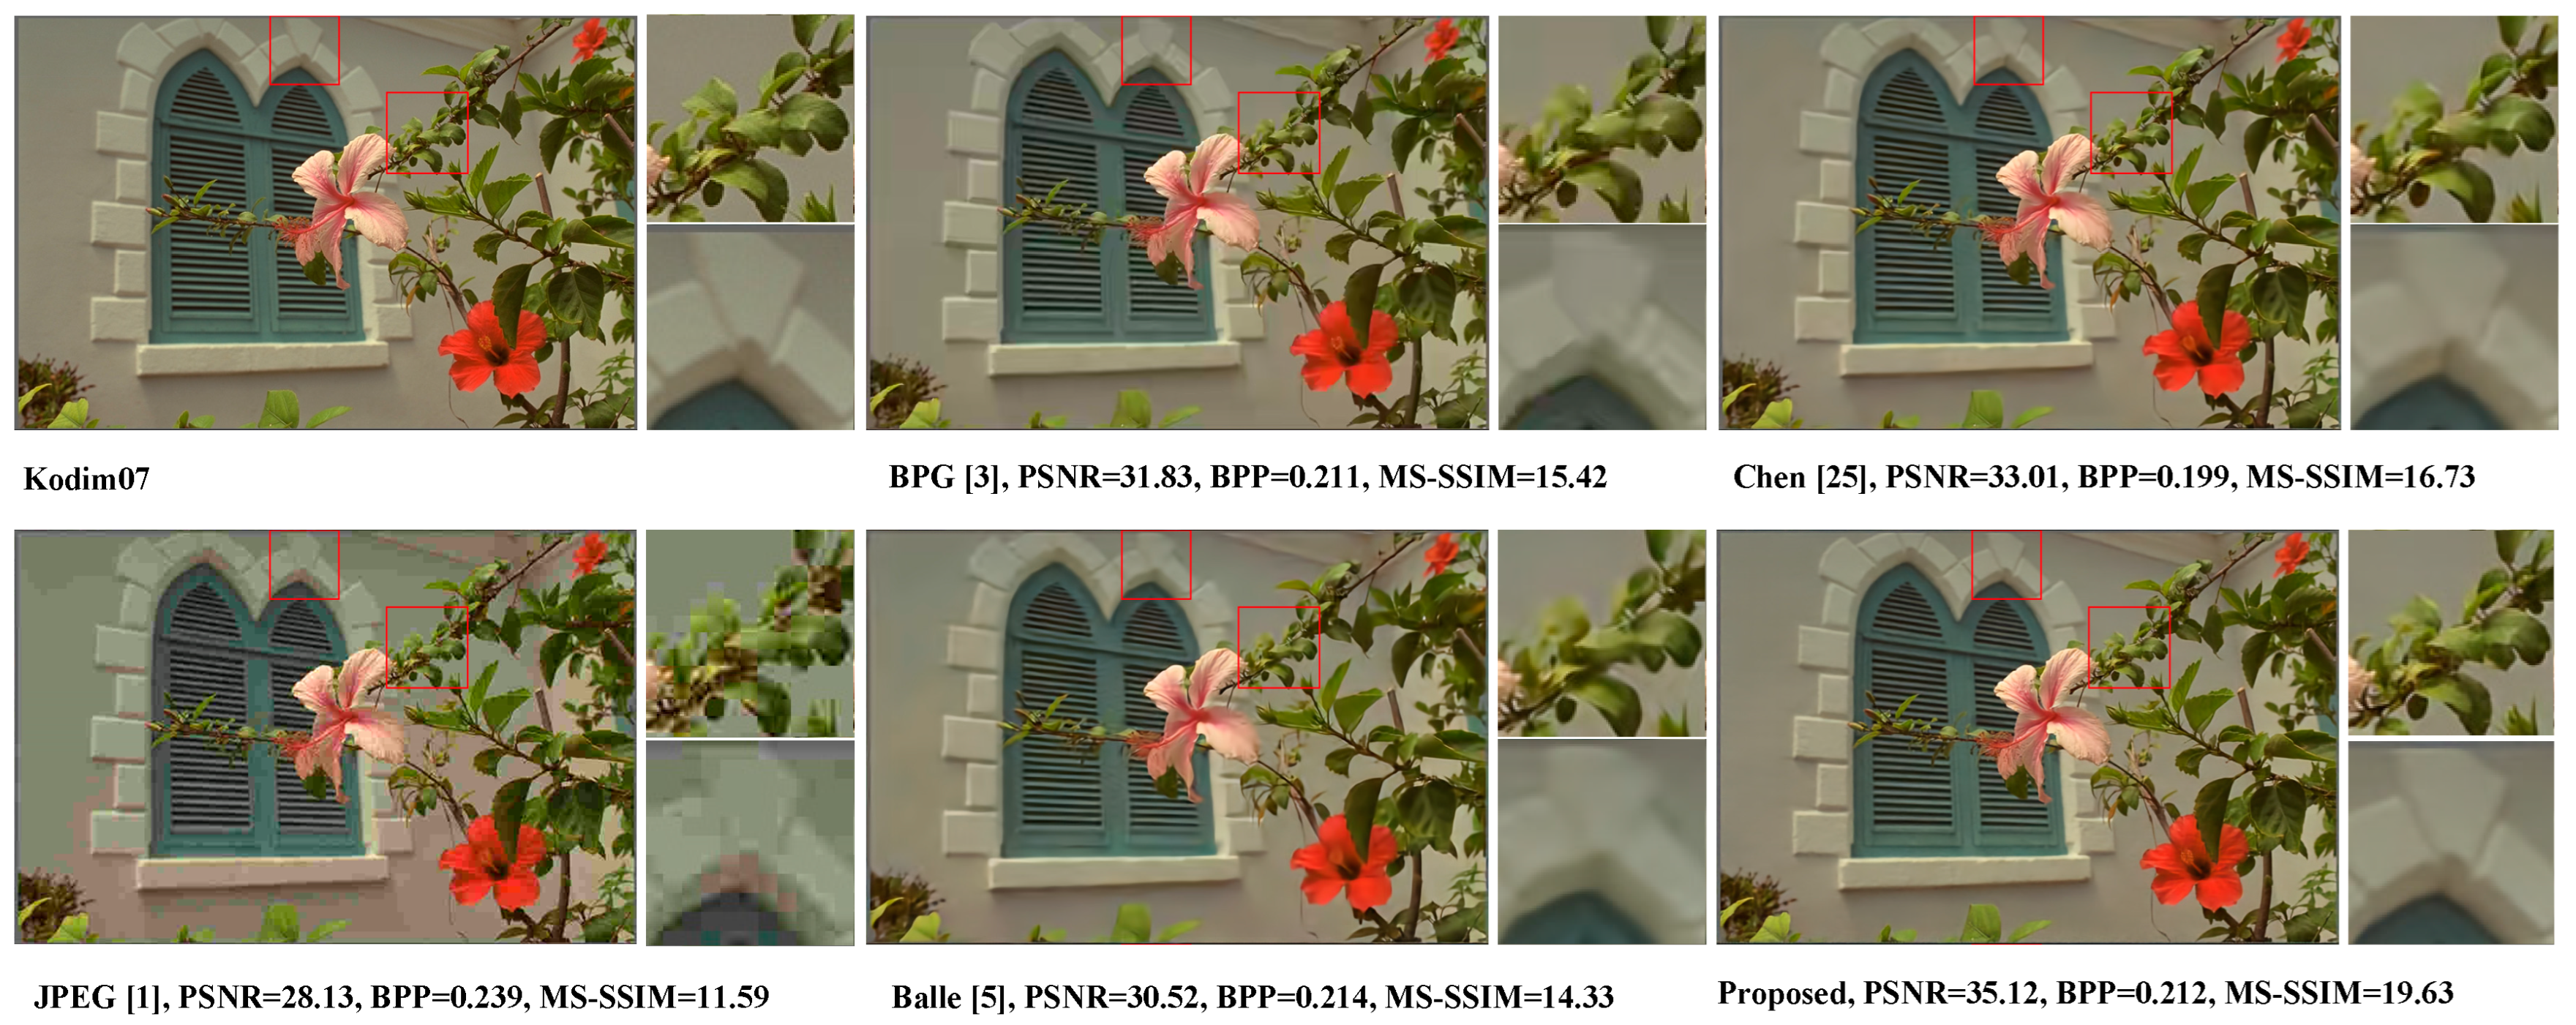
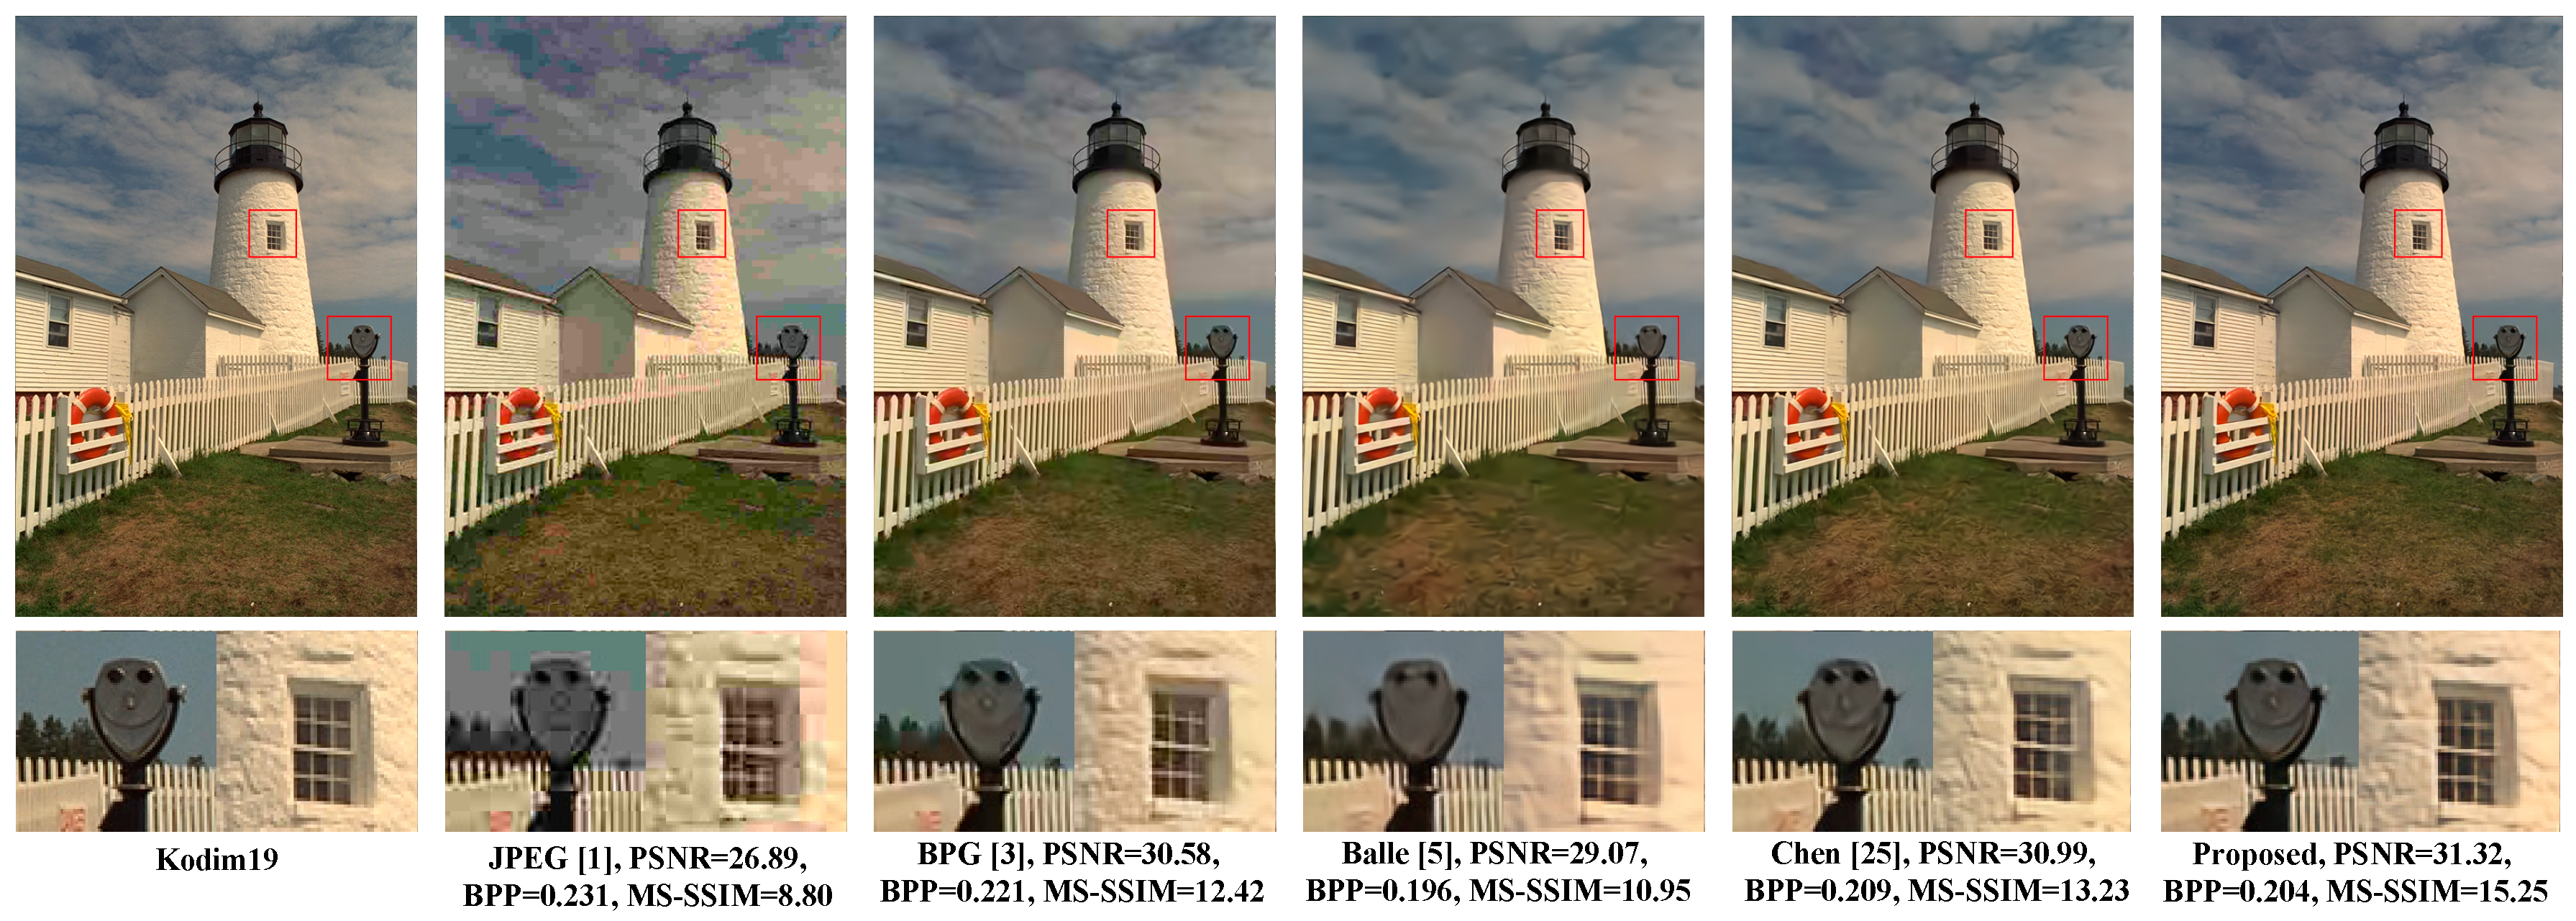
The Kodim07 image and kodim19 image were reconstructed at a compression ratio of around 0.2 bpp, as shown in Figure 8 and Figure 9. The proposed method reconstructed the highest quality image, far superior to the comparison images in terms of PSNR and MS-SSIM. The generated images of the proposed method produced more pleasing results in terms of the preservation of detailed textures and the elimination of blurred blocks, such as the white tiles (in Figure 8) and smiley face (in Figure 9), compared to the other methods. Both the proposed method and the work of Chen et al. adopt the nonlocal algorithm, which visually outperformed the other methods. This result further demonstrated the advantage of the nonlocal algorithm.
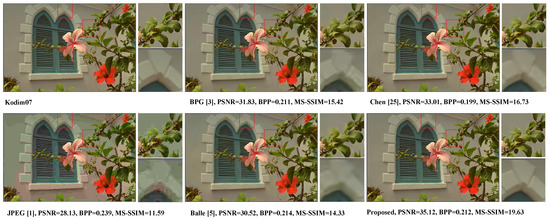
Figure 8.
Visualization of Kodim07 after reconstruction.
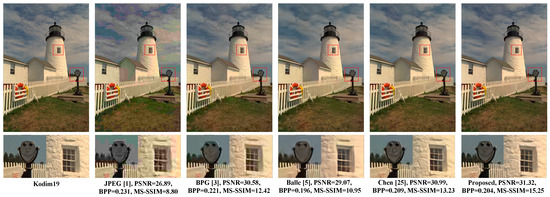
Figure 9.
Visualization of Kodim19 after reconstruction.
4.4. Ablation Study
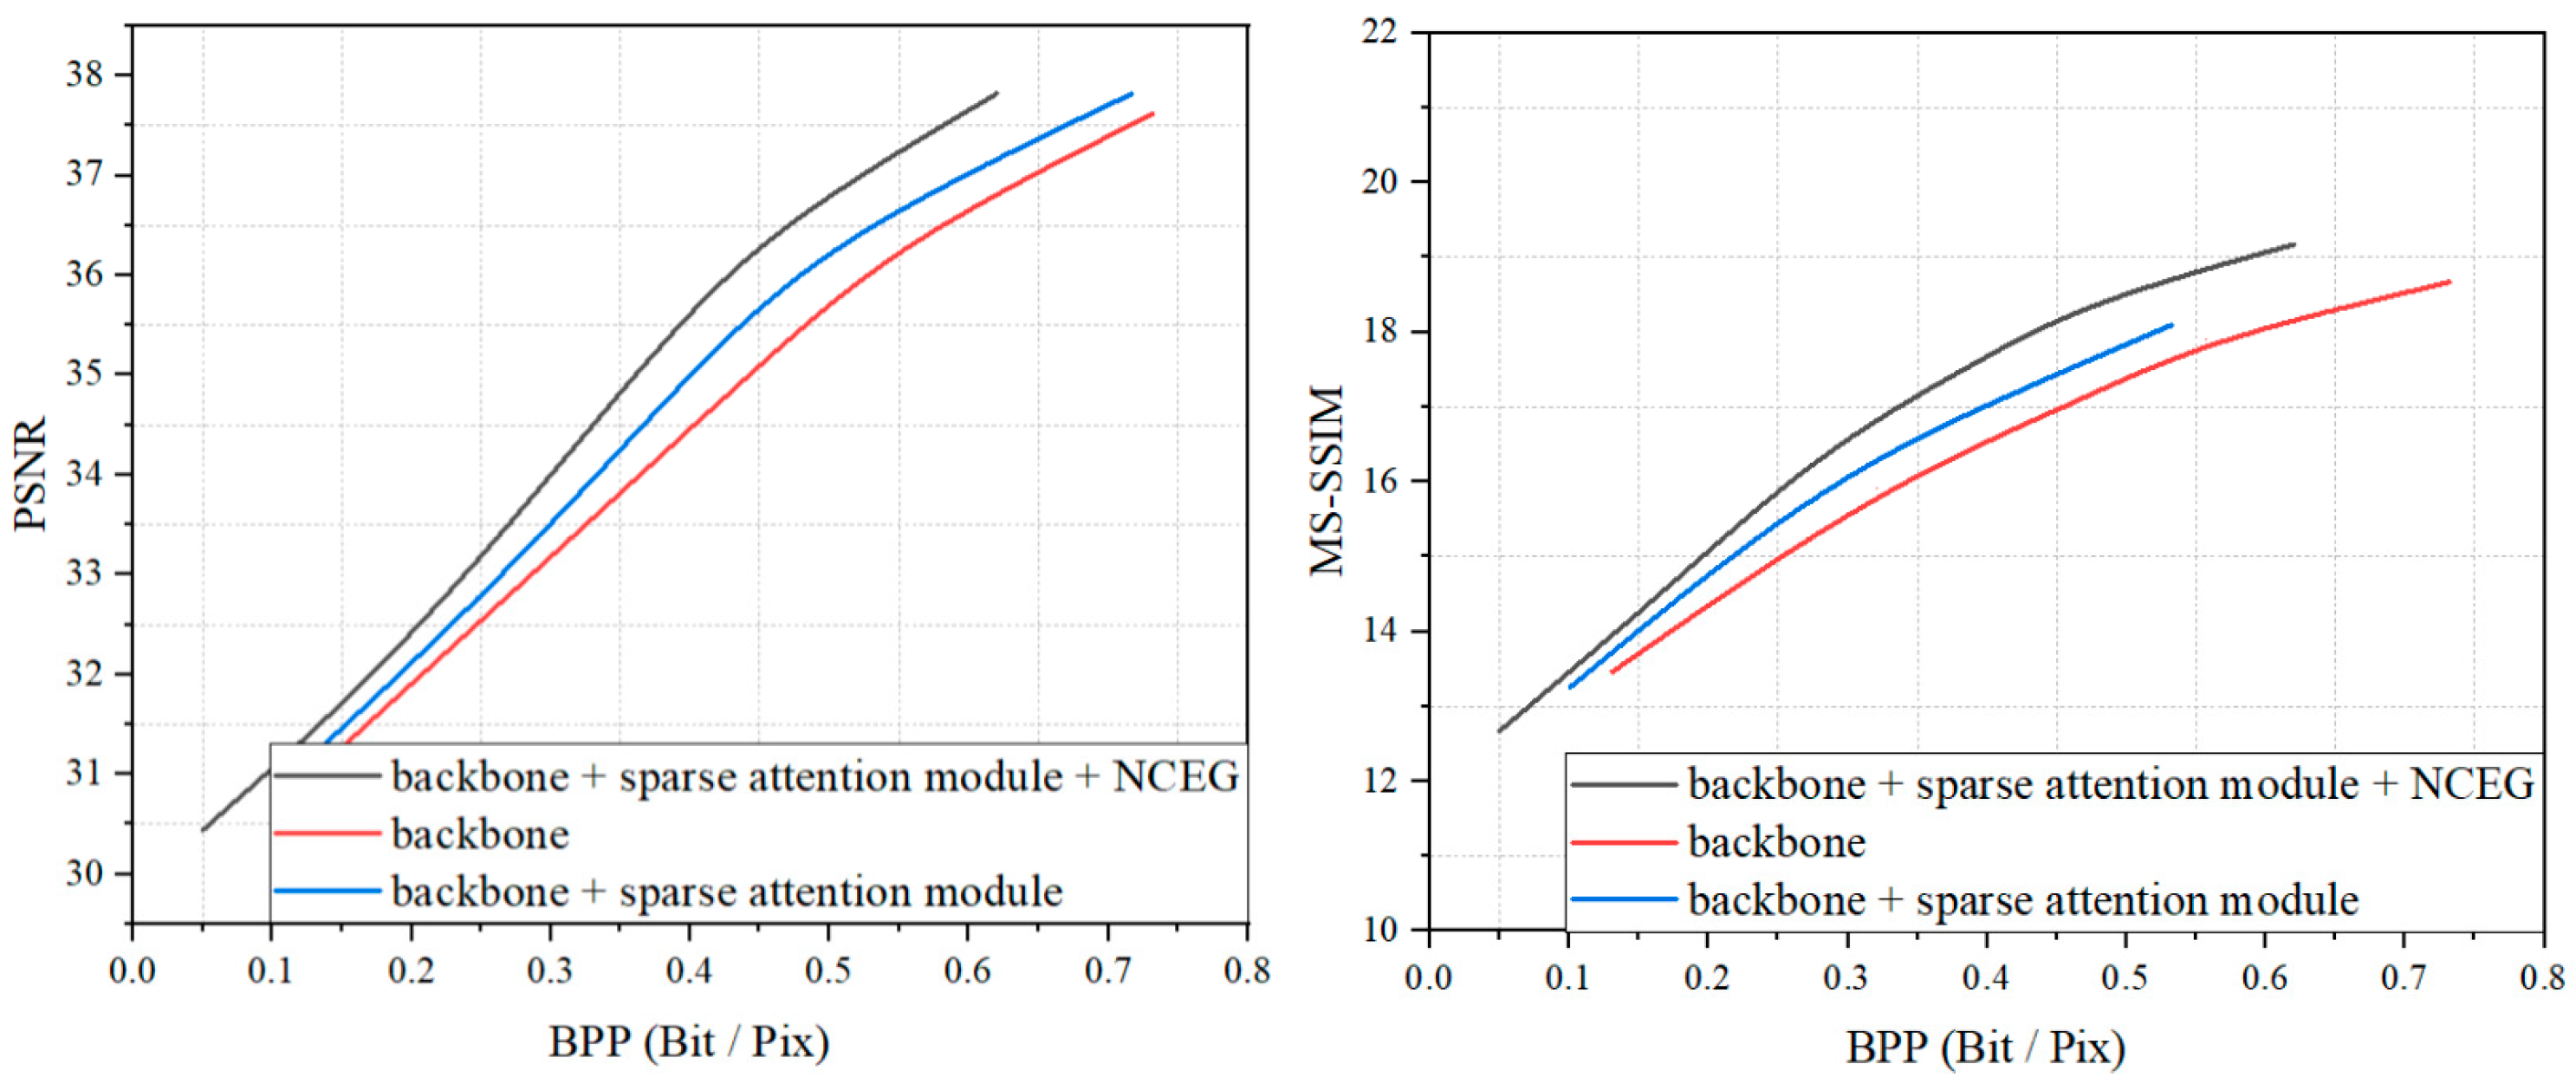
We performed ablation experiments on the basis of the backbone to demonstrate the superiority of our method. The testing dataset from the DOTA dataset was selected for experiments, and the results are shown in Figure 10. The backbone in Figure 10 indicates the structure of the network with the simplified attention module, which is explained in Section 3.3. It can be seen that the model was greatly improved with the addition of the sparse attention module. This further demonstrates the importance of the sparse attention mechanism in the field of image compression. With the addition of the NCEG, the performance of the model was further improved, with the PSNR metric improving by about 0.7 dB and the MS-SSIM improving by about 0.5 dB at the same bitrates. Furthermore, we present the raw data of the experiment in Table 1 as a reference. For images in the DOTA dataset, the proposed method demonstrated superior performance at three different bitrates, with a steady improvement in the PSNR and MS-SSIM metrics while saving a significant number of bits.
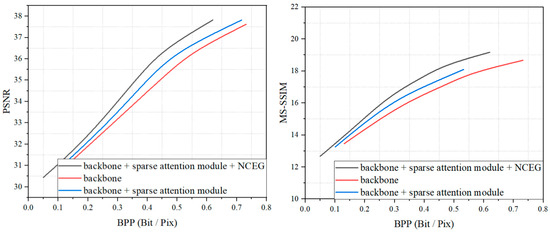
Figure 10.
RD performance on the ablation study.

Table 1.
Performance changes of the proposed method after the insertion of NCEG on the DOTA dataset.
The visualization of the NCEG can be seen in Figure 11. Due to the sparse feature extraction strategy, although the generated latent representation suffers from obvious chunking, it did not influence the final reconstruction quality.
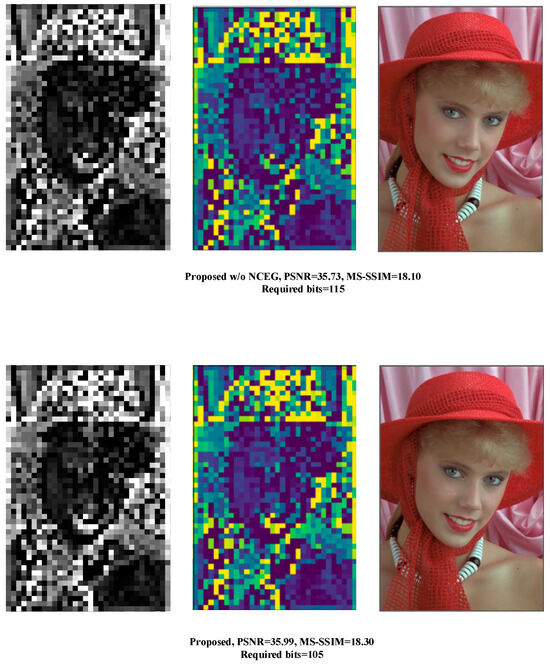
Figure 11.
Visualization of the generated features on the 216-th. channel.
The reason we used natural images for feature map visualization is that the textured areas of remote sensing images generally occupy a minimal number of pixels, while the feature maps themselves are downsampled and have even lower resolution, so it is difficult to see the difference between the feature maps. Therefore, the feature maps of the proposed method were analyzed using the Kodak dataset, as described in the following sections.
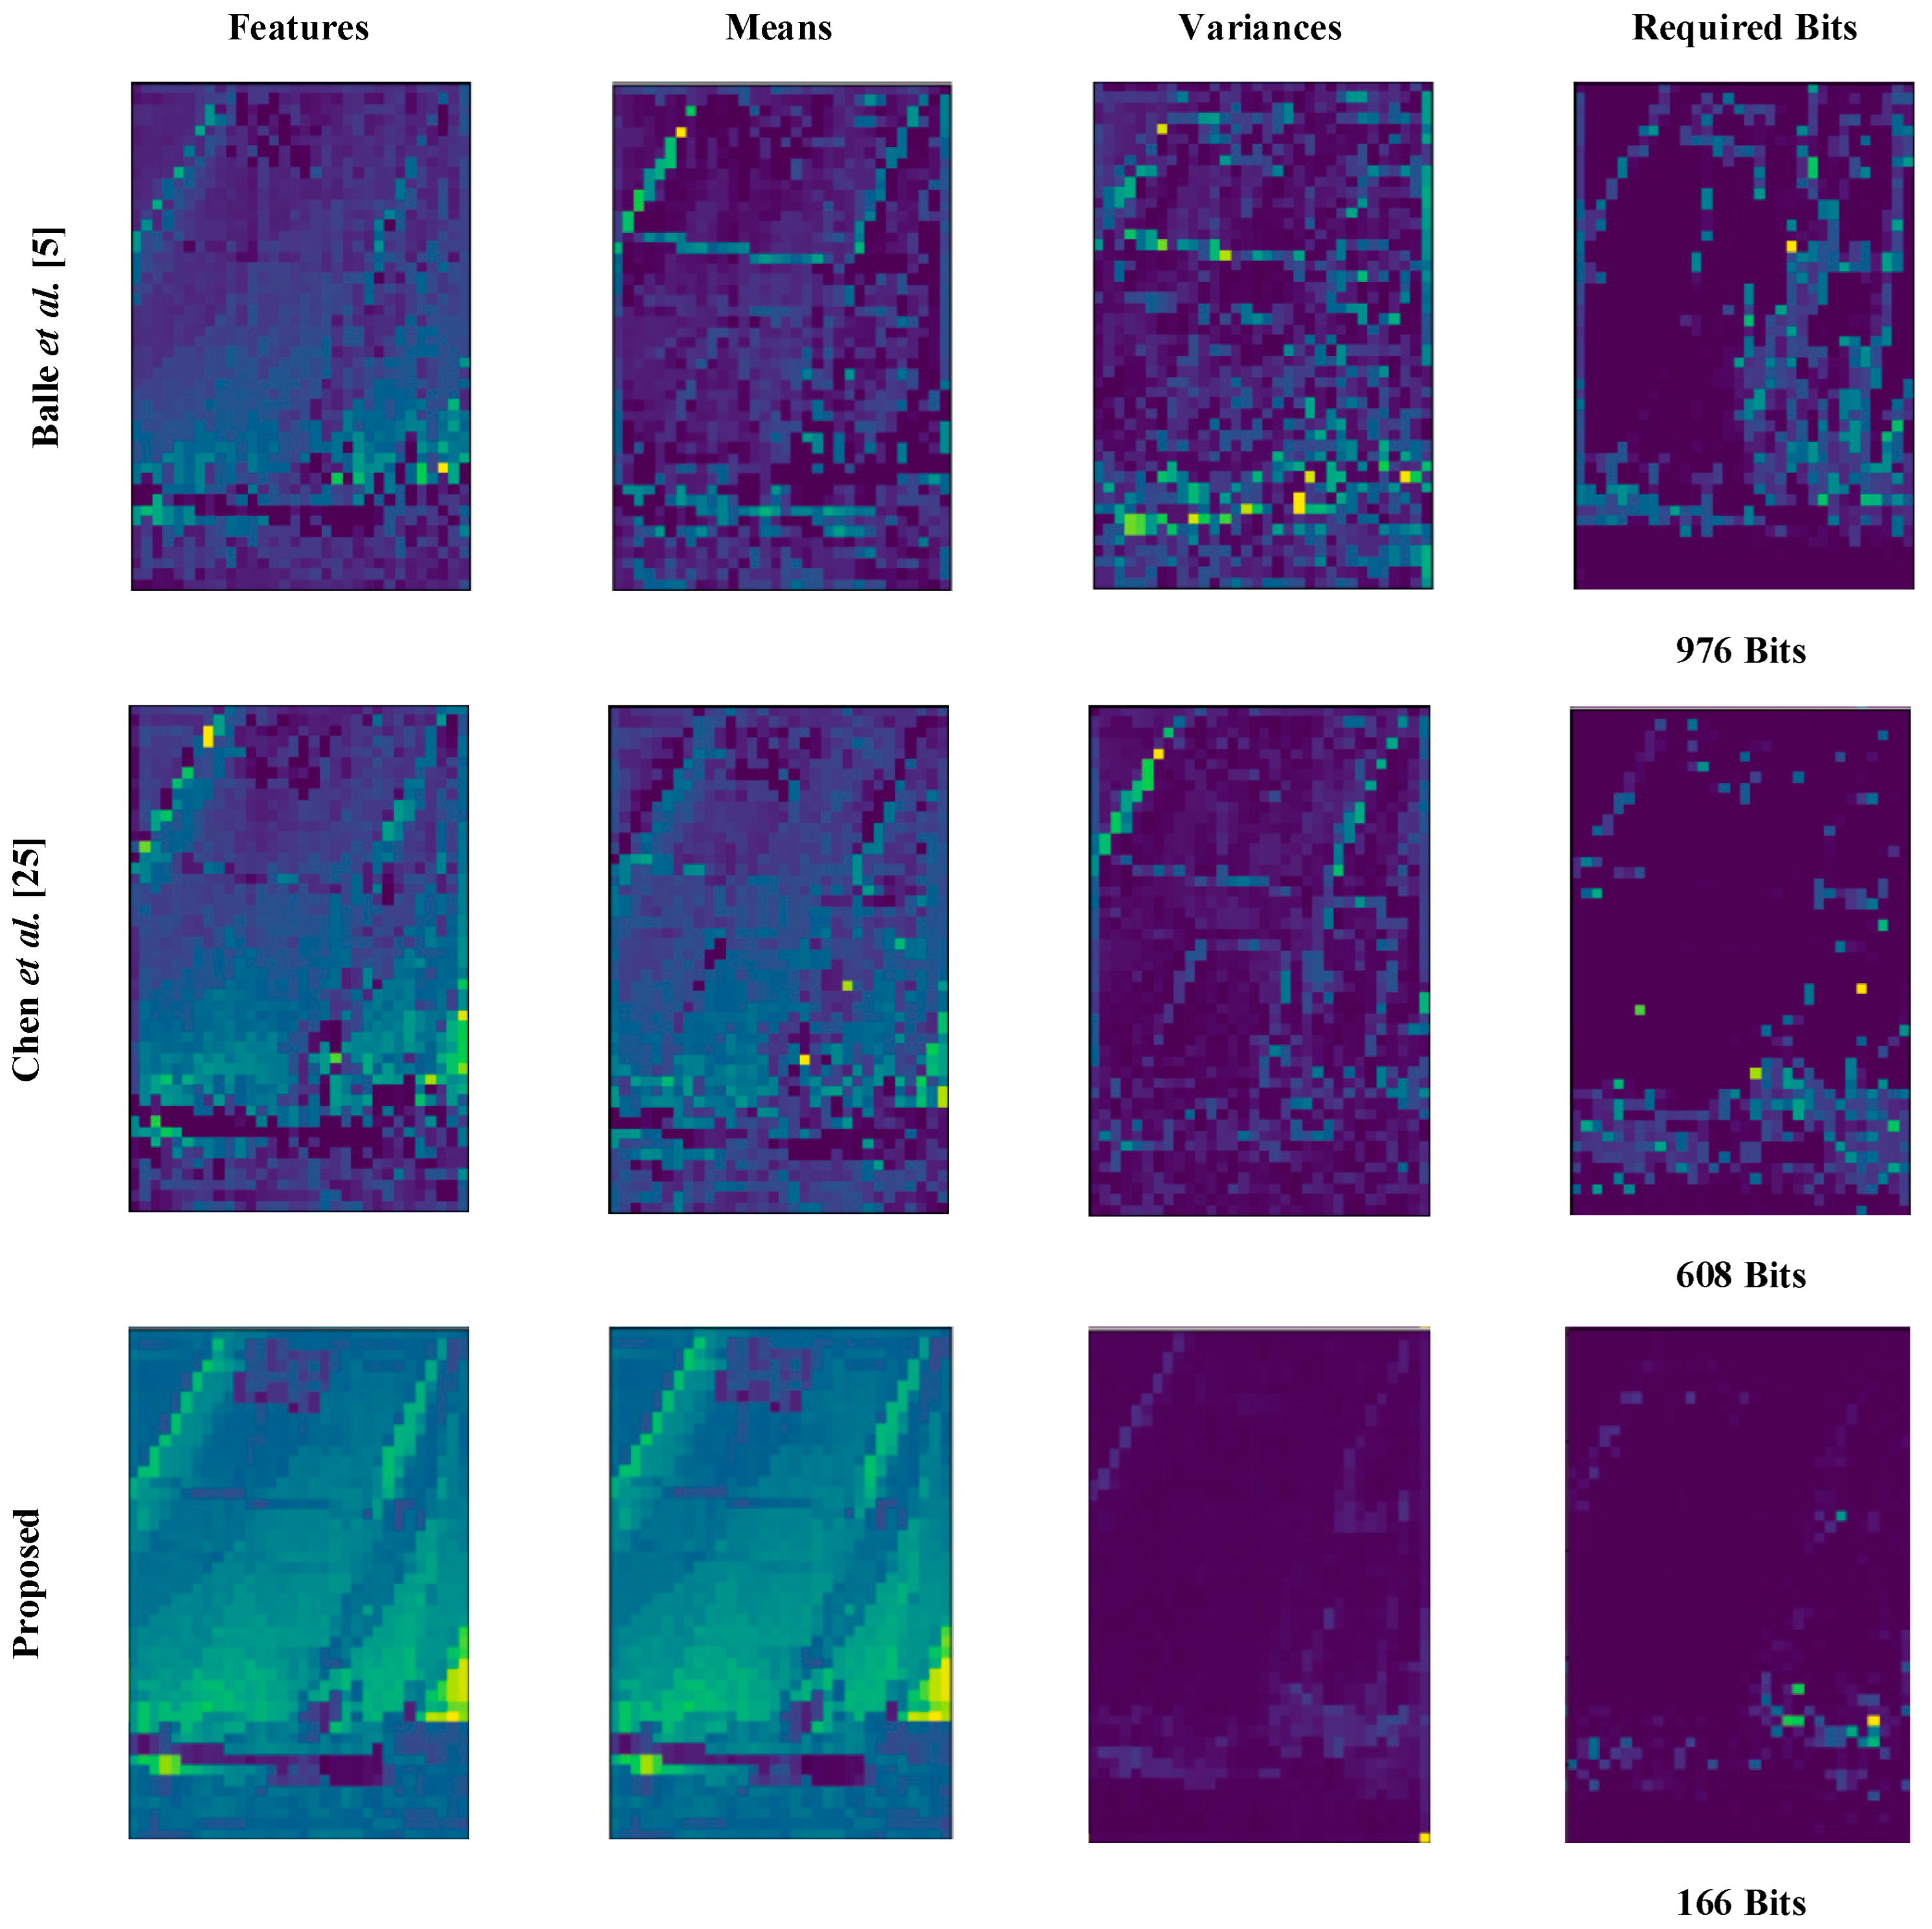
4.5. Entropy Module Visualization
Figure 12 displays the visualization of our model and the network of Chen et al. and Balle et al. on Kodim10 for features with maximum entropy. The number of required bits was calculated as . Our model can estimate the mean and variance information of the input image more accurately and thus achieve a better compression ratio.
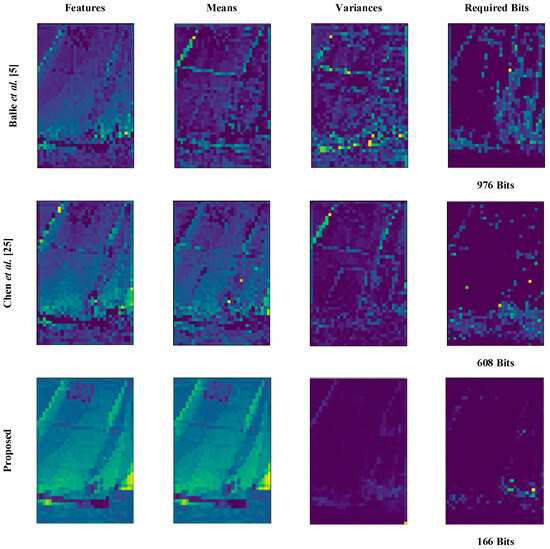
Figure 12.
Visual representation of the features with maximum entropy in the latent representation of the three methods and the mean, variance, and required bits for their estimation.
4.6. Further Discussion
From all the above experiments, our model achieved excellent results regarding the PSNR, MS-SSIM, and visual effects. We attribute this to the combined effect of the deep long-dependent residual network, strengthened hyperencoder, and sparse mechanism (sparse attention and sparse graph). We carried out relevant experiments in the ablation test section, showing that the deep long-dependent residual model alone does not achieve a higher improvement while incorporating sparse attention to extract features produced a qualitative change in the performance of the compression model. This is actually easy to understand; in extracting the latent representation of the input image, the ordinary attention mechanism is weighted against all the generated feature information, and the irrelevant features can actually be regarded as noise, which has a negative effect on the extraction of features.
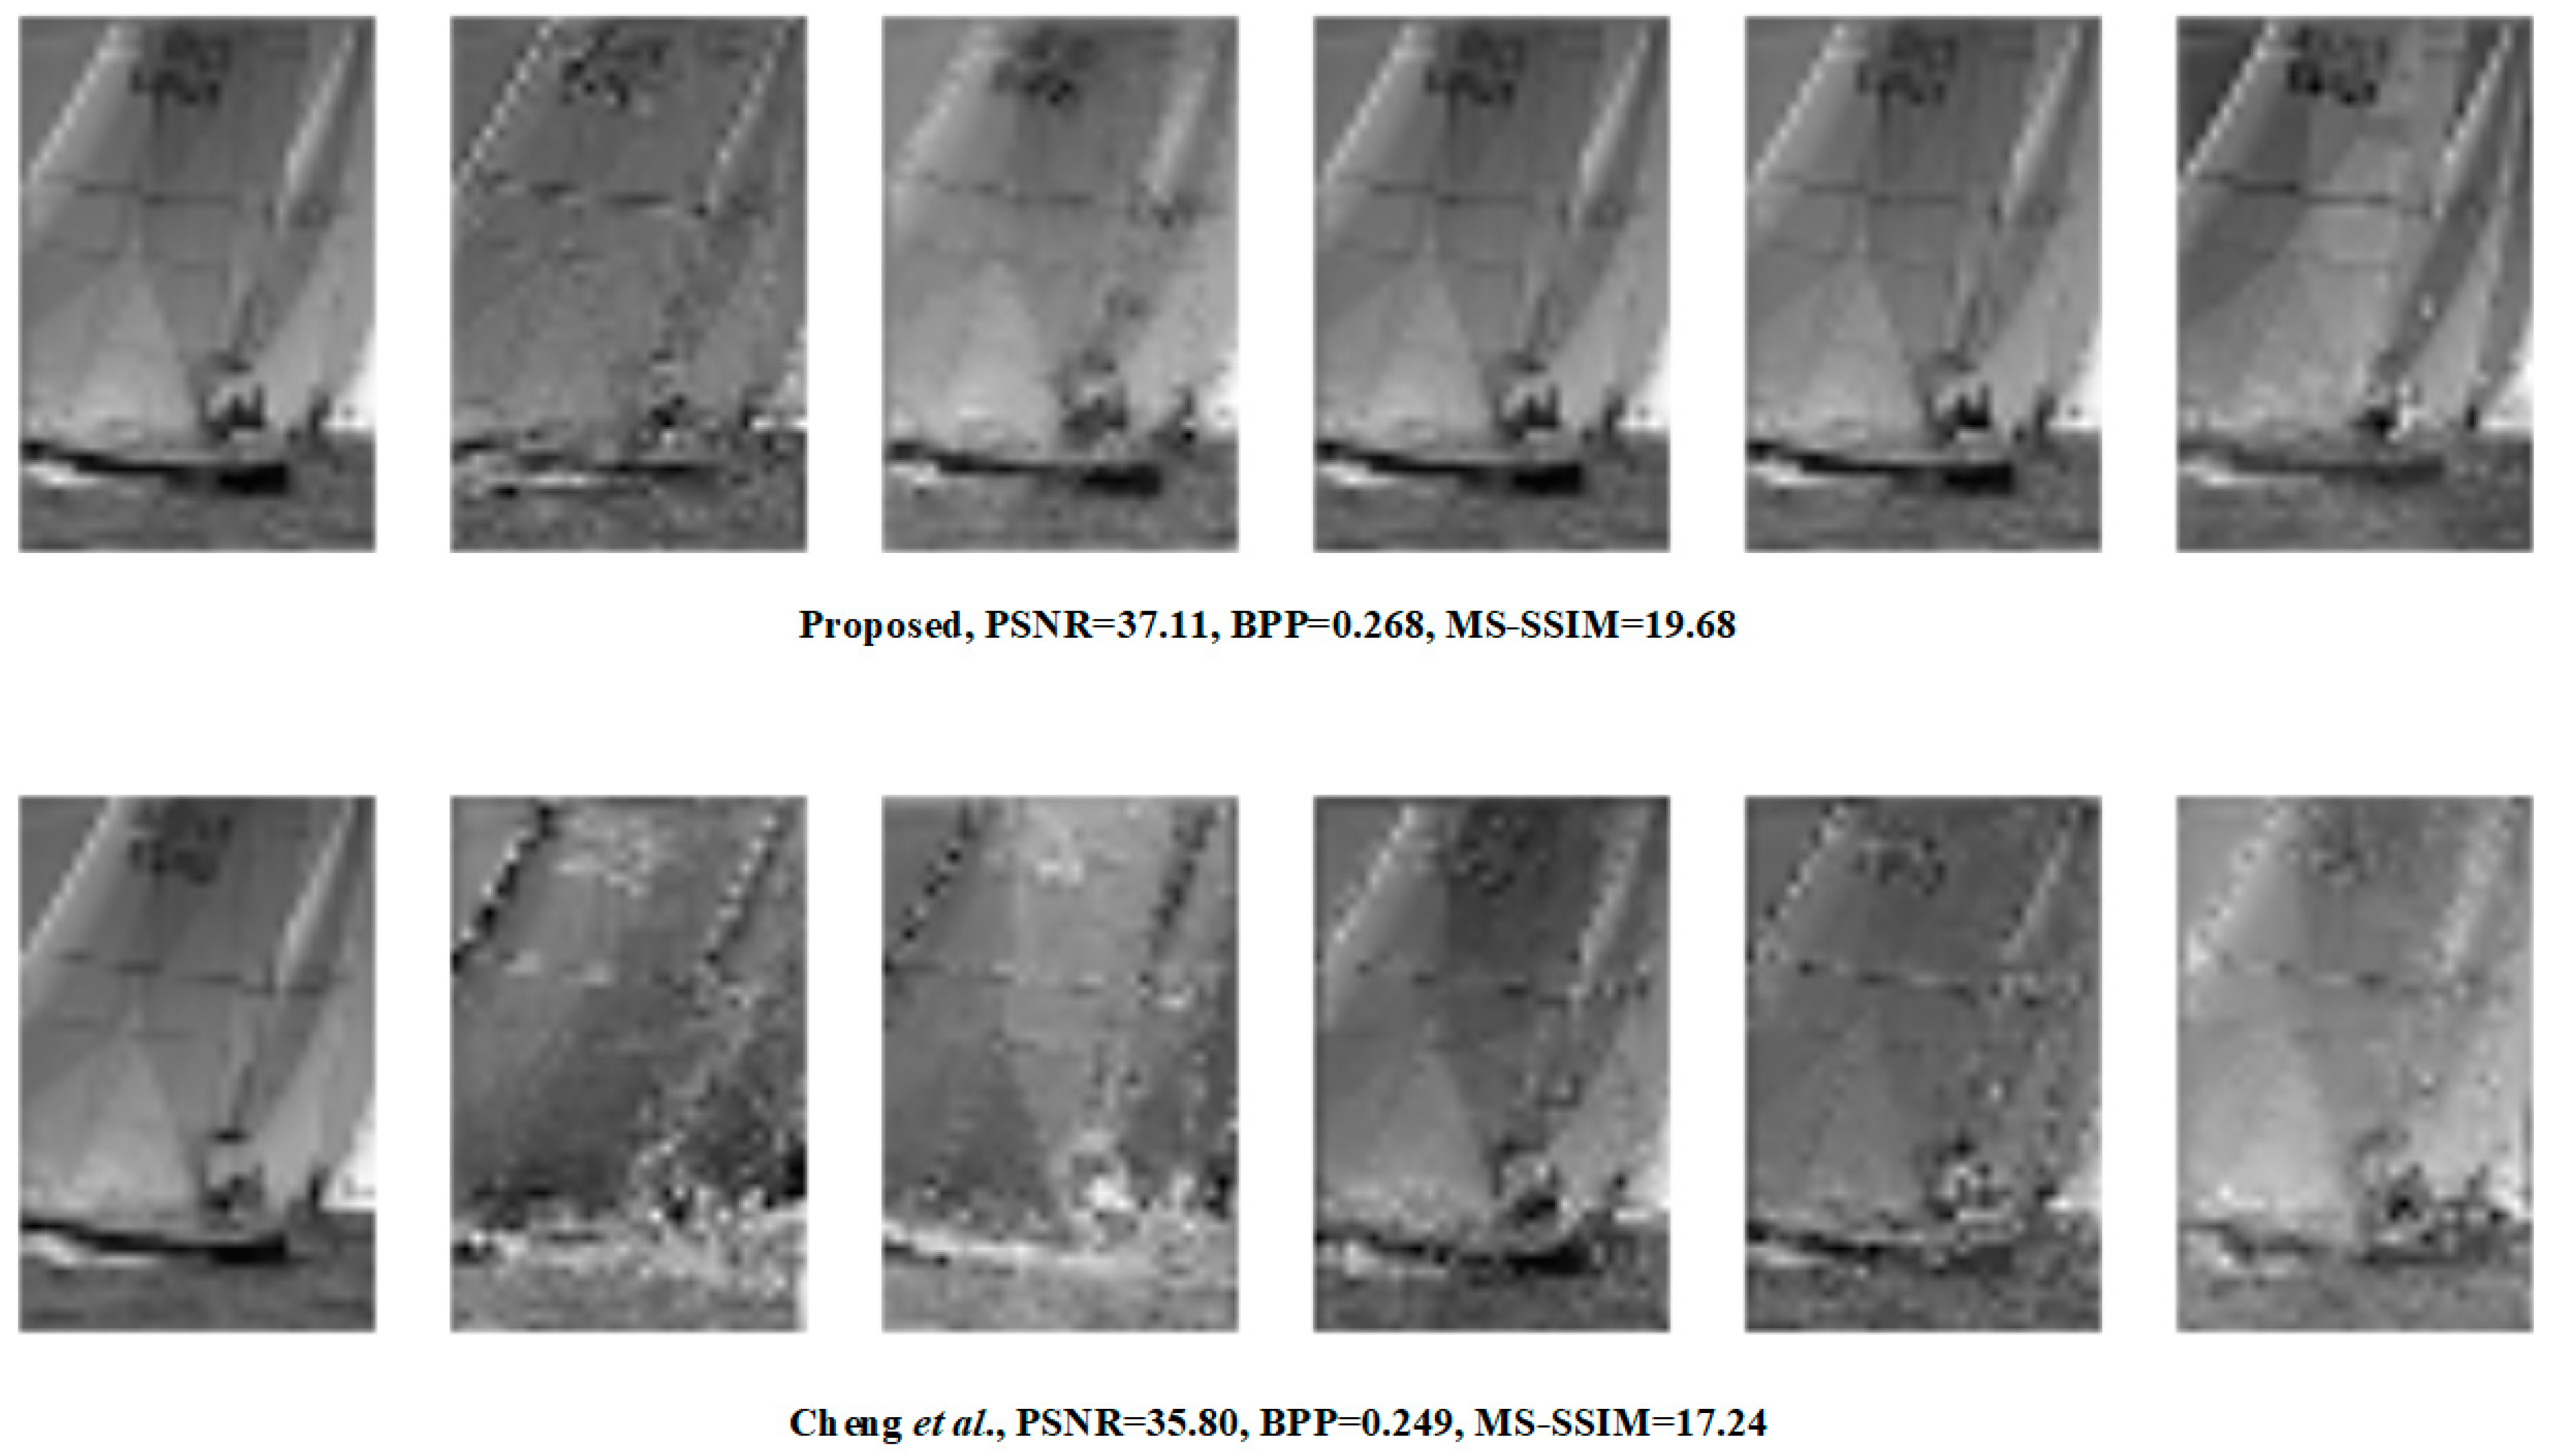
When the helpful information of the extracted latent representation is large enough and the model can extract its probability distribution information well, the rate-distortion performance of the compression network will naturally be greatly improved. Under the same bitrates, we extracted the features of six channels with the most information among the generated features using the proposed method and the method of Cheng et al. [8] (as shown in Figure 13). It can be seen that our method can yield features with richer texture information and more complete structure information. In addition, using more complete features, the decoder can certainly reconstruct images with higher quality. We further tested the computational complexity of the network, and the results are shown in Table 2. The number of floating-point operations (FLOPs) and the number of parameters were chosen for the experiments. For a fair comparison, the shapes of all input images were (3 × 256 × 256).
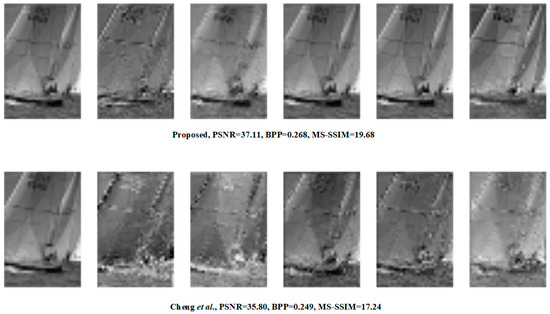
Figure 13.
Visual representation of the features with the most information using the proposed method and the method of Cheng et al. [8].
Table 2.
The flops and the number of parameters testing on different settings.
It can be seen that the method of Chen et al. [8] led to a larger number of parameters compared to our model; however, the compression performance of the model was not as optimal as ours, which further supports our conclusion that the fusion of deep long-dependent residual networks and sparse mechanisms leads to a qualitative change in the compression performance.
One thing that needs to be established is that there is a certain illusory effect of the proposed large-parameter quantitative model, consistent with other large-prophecy models, i.e., the super-priori end of the model, which, when tested, incorrectly made the estimated bitstream smaller. For example, in Figure 13, the model outputs a bpp of 0.210, whereas the actual compressed value was 0.268. The same phenomenon occurred during the testing of the Kodak dataset, where the model outputs a bpp that was about 0.07 lower compared to the true value. In order to explore the problem, we similarly tested the method of Qian et al. [12] and found a similar phenomenon in their method, which predicted results that were about 0.02 lower than the real obtained bits. We believe that the reason for this phenomenon is data bias. The training data contain a very rich variety of samples, the data in the test set must have very similar data during the training process, and the large model has a larger number of parameters, making it easier to keep the memory of all the data. This results in the over-idealized belief that the data compression rate can reach a higher value during training.
5. Conclusions
In this paper, we propose an enhanced large network for image compression. By exploring extant deep learning compression networks, we identified the problems of imbalance in the feature extraction capabilities of the hyperencoder and encoder, as well as the tendency of the encoder to generate similar latent representations in the channel dimension. We designed a combination of sparse attention modules with high-performance compression networks and a nonlocal cross-channel efficient graph architecture for similar latent representations.
The experimental results illustrate that the proposed network outperforms existing methods in regard to both the PSNR and MS-SSIM metrics, and we conducted further experiments to verify the possibility of combining larger encoding/decoding models with sparse attention mechanisms. In the future, we will explore the greater application scope of a large model in image compression, such as likelihood estimation and decoder optimization.
Author Contributions
Conceptualization, T.P.; methodology, T.P.; software, T.P.; validation, T.P. and H.L.; formal analysis, T.P. and H.L.; investigation, H.L.; resources, T.P. and H.L.; data curation, T.P.; writing—original draft preparation, T.P.; writing—review and editing, T.P., H.L. and L.Z.; visualization, L.Z. All authors have read and agreed to the published version of the manuscript.
Funding
This work was supported by the Scientific Research Project of the Department of Education of Liaoning Province under Grant LJKZ0174.
Data Availability Statement
The original contributions presented in the study are included in the article/supplementary material, further inquiries can be directed to the corresponding author/s.
Acknowledgments
We gratefully appreciate the publishers of the DOTA dataset, CLIC dataset and Kodak dataset, and the editors and reviewers for their efforts and contributions.
Conflicts of Interest
The authors declare no conflicts of interest.
References
- Wallace, G. The jpeg still picture compression standard. IEEE Trans. Consum. Electron. 1992, 38, 18–34. [Google Scholar] [CrossRef]
- Christopoulos, C.; Skodras, A.; Ebrahimi, T. The jpeg2000 still image coding system: An overview. IEEE Trans. Consum. Electron. 2000, 46, 1103–1127. [Google Scholar] [CrossRef]
- Sullivan, G.J.; Ohm, J.R.; Han, W.J.; Wiegand, T. Overview of the high efficiency video coding (hevc) standard. IEEE Trans. Circuits Syst. Video Technol. 2012, 22, 1649–1668. [Google Scholar] [CrossRef]
- Minnen, D.; Ballé, J.; Toderici, G.D. Joint autoregressive and hierarchical priors for learned image compression. In Proceedings of the Annual Conference on Neural Information Processing Systems, Montréal, QC, Canada, 3–8 December 2018. [Google Scholar]
- Ballé, J.; Minnen, D.; Singh, S.; Hwang, S.J.; Johnston, N. Variational image compression with a scale hyperprior. arXiv 2018, arXiv:1802.01436. [Google Scholar]
- Zhang, X.; Wu, X. Attention-guided image compression by deep reconstruction of compressive sensed saliency skeleton. In Proceedings of the IEEE/CVF Conference on Computer Vision and Pattern Recognition, Nashville, TN, USA, 20–25 June 2021; pp. 13354–13364. [Google Scholar]
- Song, M.; Choi, J.; Han, B. Variable-rate deep image compression through spatially-adaptive feature transform. In Proceedings of the IEEE/CVF International Conference on Computer Vision, Montreal, QC, Canada, 10–17 October 2021; pp. 2380–2389. [Google Scholar]
- Cheng, Z.; Sun, H.; Takeuchi, M.; Katto, J. Learned image compression with discretized gaussian mixture likelihoods and attention modules. In Proceedings of the IEEE/CVF Conference on Computer Vision and Pattern Recognition, Seattle, WA, USA, 13–19 June 2020; pp. 7939–7948. [Google Scholar]
- Zou, R.; Song, C.; Zhang, Z. The devil is in the details: Window-based attention for image compression. In Proceedings of the IEEE/CVF Conference on Computer Vision and Pattern Recognition, New Orleans, LA, USA, 18–24 June 2022; pp. 17492–17501. [Google Scholar]
- He, D.; Zheng, Y.; Sun, B.; Wang, Y.; Qin, H. Checkerboard context model for efficient learned image compression. In Proceedings of the IEEE/CVF Conference on Computer Vision and Pattern Recognition, Virtual, 19–25 June 2021; pp. 14771–14780. [Google Scholar]
- Islam, K.; Dang, L.M.; Lee, S.; Moon, H. Image compression with recurrent neural network and generalized divisive normalization. In Proceedings of the IEEE/CVF Conference on Computer Vision and Pattern Recognition, Virtual, 19–25 June 2021; pp. 1875–1879. [Google Scholar]
- Qian, Y.; Tan, Z.; Sun, X.; Lin, M.; Li, D.; Sun, Z.; Li, H.; Jin, R. Learning accurate entropy model with global reference for image compression. arXiv 2020, arXiv:2010.08321. [Google Scholar]
- Iwai, S.; Miyazaki, T.; Sugaya, Y.; Omachi, S. Fidelitycontrollable extreme image compression with generative adversarial networks. In Proceedings of the 2020 25th International Conference on Pattern Recognition (ICPR), Milan, Italy, 10–15 January 2021; pp. 8235–8242. [Google Scholar]
- Agustsson, E.; Tschannen, M.; Mentzer, F.; Timofte, R.; Gool, L.V. Generative adversarial networks for extreme learned image compression. In Proceedings of the IEEE/CVF International Conference on Computer Vision, Seoul, Republic of Korea, 27 October–2 November 2019; pp. 221–231. [Google Scholar]
- Li, M.; Lin, J.; Ding, Y.; Liu, Z.; Zhu, J.Y.; Han, S. Gan compression: Efficient architectures for interactive conditional gans. In Proceedings of the IEEE/CVF Conference on Computer Vision and Pattern Recognition, Seattle, WA, USA, 13–19 June 2020; pp. 5284–5294. [Google Scholar]
- Su, R.; Cheng, Z.; Sun, H.; Katto, J. Scalable learned image compression with a recurrent neural networks-based hyperprior. In Proceedings of the 2020 IEEE International Conference on Image Processing (ICIP), Abu Dhabi, United Arab Emirates, 25–28 October 2020; pp. 3369–3373. [Google Scholar]
- Liu, Y.; Ng, M.K. Deep neural network compression by tucker decomposition with nonlinear response. Knowl.-Based Syst. 2022, 241, 108171. [Google Scholar] [CrossRef]
- Li, L.J.; Zhou, S.L.; Chao, F.; Chang, X.; Yang, L.; Yu, X.; Shang, C.; Shen, Q. Model compression optimized neural network controller for nonlinear systems. Knowl.-Based Syst. 2023, 265, 110311. [Google Scholar] [CrossRef]
- Yang, F.; Herranz, L.; Cheng, Y.; Mozerov, M.G. Slimmable compressive autoencoders for practical neural image compression. In Proceedings of the IEEE/CVF Conference on Computer Vision and Pattern Recognition, Virtual, 19–25 June 2021; pp. 4998–5007. [Google Scholar]
- Yu, C.; Hong, L.; Pan, T.; Li, Y.; Li, T. ESTUGAN: Enhanced Swin Transformer with U-Net Discriminator for Remote Sensing Image Super-Resolution. Electronics 2023, 12, 4235. [Google Scholar] [CrossRef]
- Pan, T.; Zhang, L.; Song, Y.; Liu, Y. Hybrid attention compression network with light graph attention module for remote sensing images. IEEE Geosci. Remote Sens. Lett. 2023, 20, 6005605. [Google Scholar]
- Liu, D.; Wen, B.; Fan, Y.; Loy, C.C.; Huang, T.S. Nonlocal recurrent network for image restoration. In Proceedings of the Annual Conference on Neural Information Processing System, Montréal, QC, Canada, 3–8 December 2018. [Google Scholar]
- Zhang, Y.; Li, K.; Li, K.; Zhong, B.; Fu, Y. Residual non-local attention networks for image restoration. arXiv 2019, arXiv:1903.10082. [Google Scholar]
- Wang, X.; Girshick, R.; Gupta, A.; He, K. Non-local neural networks. In Proceedings of the IEEE Conference on Computer Vision and Pattern Recognition, Salt Lake City, UT, USA, 18–22 June 2018; pp. 7794–7803. [Google Scholar]
- Chen, T.; Liu, H.; Ma, Z.; Shen, Q.; Cao, X.; Wang, Y. End-to-end learnt image compression via non-local attention optimization and improved context modeling. IEEE Trans. Image Process. 2021, 30, 3179–3191. [Google Scholar] [CrossRef] [PubMed]
- Xuyang, G.; Junyang, Y.; Shuwei, X. Text classification study based on graph convolutional neural networks. In Proceedings of the 2021 International Conference on Internet, Education and Information Technology (IEIT), Suzhou, China, 16–18 April 2021; pp. 102–105. [Google Scholar]
- Beck, D.; Haffari, G.; Cohn, T. Graph-to-sequence learning using gated graph neural networks. arXiv 2018, arXiv:1806.09835. [Google Scholar]
- Wu, Z.; Pan, S.; Chen, F.; Long, G.; Zhang, C.; Philip, S.Y. A comprehensive survey on graph neural networks. IEEE Trans. Neural Netw. Learn. Syst. 2020, 32, 4–24. [Google Scholar] [CrossRef] [PubMed]
- Zhang, Z.; Cui, P.; Zhu, W. Deep learning on graphs: A survey. IEEE Trans. Knowl. Data Eng. 2020, 34, 249–270. [Google Scholar] [CrossRef]
- Lu, Y.; Zhu, Y.; Lu, G. 3d sceneflownet: Self-supervised 3d scene flow estimation based on graph cnn. In Proceedings of the IEEE International Conference on Image Processing (ICIP), Anchorage, AK, USA, 19–22 September 2021; pp. 3647–3651. [Google Scholar]
- Dinesh, C.; Cheung, G.; Bajić, I.V. 3d point cloud superresolution via graph total variation on surface normal. In Proceedings of the IEEE International Conference on Image Processing (ICIP), Taipei, Taiwan, 22–25 September 2019; pp. 4390–4394. [Google Scholar]
- Ying, R.; He, R.; Chen, K.; Eksombatchai, P.; Hamilton, W.L.; Leskovec, J. Graph convolutional neural networks for webscale recommender systems. In Proceedings of the 24th ACM SIGKDD International Conference on Knowledge Discovery & Data Mining, London, UK, 19–23 August 2018; pp. 974–983. [Google Scholar]
- Chen, Y.H.; Huang, L.; Wang, C.D.; Lai, J.H. Hybrid-order gated graph neural network for session-based recommendation. IEEE Trans. Ind. Inform. 2021, 18, 1458–1467. [Google Scholar] [CrossRef]
- Valsesia, D.; Fracastoro, G.; Magli, E. Deep graphconvolutional image denoising. IEEE Trans. Image Process. 2020, 29, 8226–8237. [Google Scholar] [CrossRef] [PubMed]
- Zhou, S.; Zhang, J.; Zuo, W.; Loy, C.C. Cross-scale internal graph neural network for image super-resolution. In Proceedings of the Annual Conference on Neural Information Processing Systems, Virtual, 6–12 December 2020; pp. 3499–3509. [Google Scholar]
- Tang, Z.; Wang, H.; Yi, X.; Zhang, Y.; Kwong, S.; Kuo, C.C.J. Joint graph attention and asymmetric convolutional neural network for deep image compression. IEEE Trans. Circuits Syst. Video Technol. 2022, 33, 421–433. [Google Scholar] [CrossRef]
- Yan, Q.; Zhang, L.; Liu, Y.; Zhu, Y.; Sun, J.; Shi, Q.; Zhang, Y. Deep HDR imaging via a non-local network. IEEE Transactions on Image Processing. 2020, 29, 4308–4322. [Google Scholar] [CrossRef] [PubMed]
- Buades, A.; Coll, B.; Morel, J.M. A non-local algorithm for image denoising. In Proceedings of the IEEE Computer Society Conference on Computer vision and Pattern Recognition (CVPR), San Diego, CA, USA, 20–25 June 2005; pp. 60–65. [Google Scholar]
- Xu, X.; Liu, S.; Chuang, T.D.; Huang, Y.W.; Lei, S.M.; Rapaka, K.; Pang, C.; Seregin, V.; Wang, Y.K.; Karczewicz, M. Intra block copy in hevc screen content coding extensions. IEEE J. Emerg. Sel. Top. Circuits Syst. 2016, 6, 409–419. [Google Scholar] [CrossRef]
- Child, R.; Gray, S.; Radford, A.; Sutskever, I. Generating long sequences with sparse transformers. arXiv 2019, arXiv:1904.10509. [Google Scholar]
- Liu, Z.; Lin, Y.; Cao, Y.; Hu, H.; Wei, Y.; Zhang, Z.; Lin, S.; Guo, B. Swin transformer: Hierarchical vision transformer using shifted windows. In Proceedings of the IEEE/CVF International Conference on Computer Vision, Montreal, QC, Canada, 10–17 October 2021; pp. 10012–10022. [Google Scholar]
- Tu, Z.; Talebi, H.; Zhang, H.; Yang, F.; Milanfar, P.; Bovik, A.; Li, Y. Maxvit: Multi-axis vision transformer. In Proceedings of the European Conference on Computer Vision, Tel Aviv, Israel, 23–27 October 2022; Springer: Cham, Switzerland, 2022; pp. 459–479. [Google Scholar]
- Wang, W.; Yao, L.; Chen, L.; Lin, B.; Cai, D.; He, X.; Liu, W. Crossformer: A versatile vision transformer hinging on cross-scale attention. arXiv 2021, arXiv:2108.00154. [Google Scholar] [CrossRef] [PubMed]
- Choi, J.; Han, B. Task-Aware Quantization Network for JPEG Image Compression. In Computer Vision, Proceedings of the 16th European Conference, Glasgow, UK, 23–28 August 2020; Springer: Cham, Switzerland, 2020; pp. 309–324. [Google Scholar]
- Zhong, G.; Wang, J.; Hu, J.; Liang, F. A GAN-Based Video Intra Coding. Electronics 2021, 10, 132. [Google Scholar] [CrossRef]
- Mei, Y.; Fan, Y.; Zhou, Y. Image super-resolution with nonlocal sparse attention. In Proceedings of the IEEE/CVF Conference on Computer Vision and Pattern Recognition, Nashville, TN, USA, 20–25 June 2021; pp. 3517–3526. [Google Scholar]
- Bai, Y.; Liu, X.; Zuo, W.; Wang, Y.; Ji, X. Learning scalable ly-constrained near-lossless image compression via joint lossy image and residual compression. In Proceedings of the IEEE/CVF Conference on Computer Vision and Pattern Recognition, Nashville, TN, USA, 20–25 June 2021; pp. 11946–11955. [Google Scholar]
- Cheng, Z.; Sun, H.; Takeuchi, M.; Katto, J. Deep residual learning for image compression. In Proceedings of the IEEE Conference on Computer Vision and Pattern Recognition Workshops, CVPR Workshops 2019, Long Beach, CA, USA, 16–20 June 2019. [Google Scholar]
- Bresson, X.; Laurent, T. Residual gated graph convnets. arXiv 2017, arXiv:1711.07553. [Google Scholar]
- Pan, T.; Zhang, L.; Qu, L.; Liu, Y. A Coupled Compression Generation Network for Remote-Sensing Images at Extremely Low Bitrates. IEEE Trans. Geosci. Remote Sens. 2023, 61, 5608514. [Google Scholar] [CrossRef]
- Lee, J.; Cho, S.; Beack, S.K. Context-adaptive entropy model for end-to-end optimized image compression. arXiv 2018, arXiv:1809.10452. [Google Scholar]


Disclaimer/Publisher’s Note: The statements, opinions and data contained in all publications are solely those of the individual author(s) and contributor(s) and not of MDPI and/or the editor(s). MDPI and/or the editor(s) disclaim responsibility for any injury to people or property resulting from any ideas, methods, instructions or products referred to in the content. |
© 2024 by the authors. Licensee MDPI, Basel, Switzerland. This article is an open access article distributed under the terms and conditions of the Creative Commons Attribution (CC BY) license (https://creativecommons.org/licenses/by/4.0/).