Article

Integrated Neural Network Approach for Enhanced Vital Signal Analysis Using CW Radar

Department of Electronic Engineering, Yeungnam University, Gyeongsan 38541, Republic of Korea
*
Author to whom correspondence should be addressed.
Electronics 2024, 13(13), 2666; https://doi.org/10.3390/electronics13132666
Submission received: 29 May 2024 / Revised: 29 June 2024 / Accepted: 4 July 2024 / Published: 7 July 2024
(This article belongs to the Special Issue Intelligence Control and Applications of Intelligence Robotics)

Abstract

:
This study introduces a novel approach for analyzing vital signals using continuous-wave (CW) radar, employing an integrated neural network model to overcome the limitations associated with traditional step-by-step signal processing methods. Conventional methods for vital signal monitoring, such as electrocardiograms (ECGs) and sphygmomanometers, require direct contact and impose constraints on specific scenarios. Conversely, our study primarily focused on non-contact measurement techniques, particularly those using CW radar, which is known for its simplicity but faces challenges such as noise interference and complex signal processing. To address these issues, we propose a temporal convolutional network (TCN)-based framework that seamlessly integrates noise removal, demodulation, and fast Fourier transform (FFT) processes into a single neural network. This integration minimizes cumulative errors and processing time, which are common drawbacks of conventional methods. The TCN was trained using a dataset comprising preprocessed in-phase and quadrature (I/Q) signals from the CW radar and corresponding heart rates measured via ECG. The performance of the proposed method was evaluated based on the L1 loss and accuracy against the moving average of the estimated heart rates. The results indicate that the proposed approach has the potential for efficient and accurate non-contact vital signal analysis, opening new avenues in health monitoring and medical research. Additionally, the integration of CW radar and neural networks in our framework offers a robust and scalable solution, enhancing the practicality of non-contact health monitoring systems in diverse environments. This technology can be leveraged in healthcare robots to provide continuous and unobtrusive monitoring of patients’ vital signs, enabling timely interventions and improving overall patient care.

1. Introduction

Cardiac disease was the leading cause of death in 2019, and continues to affect an increasing number of patients annually [1]. Because the symptoms of cardiac disease are brief and irregular, continuous monitoring is paramount for effective prevention [2,3]. Currently, the most widespread heart activity monitoring devices are primarily contact-based, utilizing equipment such as electrocardiography (ECG), echocardiography, and photoplethysmography (PPG) [4,5,6,7,8]. Although these contact-type devices offer accurate readings owing to their proximity to the subject, the requirements for close equipment proximity and fixed subject posture impose certain limitations that become evident in situations where participants cannot control their posture, such as during polysomnography. In addition, these devices are limited in their ability to monitor a target for a long time, as the sensor must be attached directly to the body. To overcome these issues, considerable research is being conducted on non-contact vital signal measurements, including continuous-wave (CW) radars [9,10,11,12,13,14,15,16,17,18,19,20,21,22]. In particular, CW Radar has the advantage of being used in low-light environments, in contrast to methods using optical equipment. In recent years, the integration of robotic systems in healthcare has also shown significant potential in addressing some of these limitations. Robots equipped with advanced sensors and AI capabilities can provide continuous, non-contact monitoring of cardiac and other vital signals [23,24,25,26,27,28]. These robotic systems can maneuver around patients, ensuring optimal sensor positioning without requiring patients to maintain specific postures. This is particularly beneficial in scenarios like polysomnography or home healthcare, where constant monitoring is essential, yet patient mobility and comfort must be preserved. Moreover, robots can assist healthcare providers by collecting and analyzing data in real-time, facilitating early detection of anomalies and timely interventions. The use of robotics in healthcare not only enhances the precision and reliability of patient monitoring but also contributes to a more patient-friendly and adaptable healthcare environment. In this paper, we propose a method for processing signals measured by CW radar using artificial intelligence, with the aim of applying this technique to robots for vital sign monitoring.
CW radar operates by emitting continuous waves to measure the displacement, velocity, and direction of the target’s movement. Signals acquired by the CW radar are composed of in-phase and quadrature (I/Q) components exhibiting a 90-degree phase difference. Demodulating these components and subjecting them to a fast Fourier transform (FFT) enables the extraction of information pertaining to target displacement and velocity [28,29]. This radar technology has extensive applications in non-contact vital signal measurement research owing to its relatively straightforward hardware configuration. Chest movements, particularly heartbeats and respiration, cause Doppler shifts, and the resulting magnitude and frequency provide information on heart and respiratory rates. However, the measured signals include unwanted components, such as DC bias and white noise, owing to the electronic characteristics of the system, heat generation, trembling, and movement of the subject. To extract accurate information from the measurement target, it is imperative to remove these extraneous components from the signal. This process is a crucial step in refining the data obtained from CW radars and enhancing the precision of vital signal measurements in non-contact scenarios.
To extract vital information from CW radars, the conventional step-by-step sequence encompasses noise removal, demodulation, and FFT [30,31]. However, achieving perfection in each of these processes is nearly impossible, and errors incurred in each step can accumulate to degrade overall accuracy. Additionally, the inherent limitations of the FFT result in an inability to precisely detect exact frequencies. Moreover, it is difficult to mathematically generalize a nonlinear CW radar signal, and the processing time can be excessively long. These problems all hinder the accuracy of vital-signal measurement using CW radars. As an alternative to step-by-step signal processing, we propose a method that employs an integrated neural network.
The proposed signal processing procedure integrates the removal of noise components, demodulation, and FFT-based dominant frequency detection into a single neural network. This approach aims to mitigate the effects of errors that accumulate over multiple steps. We leverage artificial-intelligence (AI) technology with a temporal convolutional neural network (TCN) structure to process vital signals obtained from a CW radar [32]. The TCN was trained using CW radar signals while recording the reference heart rate through the ECG, which was determined by calculating the RR interval and gap between the R peaks. Appropriate preprocessing was applied to the inputs and outputs to enhance the performance of the neural network. The dataset consisted of pairs of preprocessed I/Q signals along with the simultaneously measured reference heart rate. Data were categorized according to whether the training and validation sets shared signals from the same target. The experiments were designed to investigate the effects of the same measurement targets in the training and validation sets on the network. Performance was compared with the moving average of the network’s estimated set of heart-rate frequencies over time using L1 loss and accuracy.

2. Proposed Method for CW Radar Signal Processing

2.1. Characteristics of CW Radar Signal

The CW radar functions as a sensor capable of continuously transmitting signals, analyzing the signals received after reflection from the measurement target through the Doppler effect, and determining the target’s movement, speed, and location. By compiling a transmitter and receiver, the radar sensor captures vital signals represented by I/Q signals with a 90° phase difference. Both signals are expressed as trigonometric functions containing the displacement information of the measured object in frequency. In the context of an individual lying down, displacement can be represented as the sum of two trigonometric functions that carry frequency information pertaining to a moving object. The following formulas provide a mathematical approximation of the CW radar signal and its components, specifically customized for measuring the vital signals of an individual lying down:
x ( t ) = 10 3 cos 2 π f R t + 10 4 cos 2 π f H t ,
I t = A I cos 4 π x t + 4 π d 0 λ ,
Q t = A Q sin 4 π x t + 4 π d 0 λ + ϕ ,
where x(t) is the displacement of the measured object, fR is the frequency related to the respiration rate, and fH is the frequency associated with the heart rate. The amplitudes of the signals are denoted as AI and AQ. In addition, d0 represents distance from the radar module and ϕ denotes the phase offset. Because chest movements induce the Doppler effect, radar technology can be deployed to easily extract vital signal information, including both heart and respiration rates [33].
Although CW radar signals effectively extract vital signal information, this information is accompanied by undesired components—such as DC bias and white noise—that are attributed to the electrical characteristics, vibrations, and heat generation within the module. The presence of these undesired components poses a challenge to obtaining precise vital information. Additionally, as shown in Equations (1)–(3), CW radar signals exhibit a complex nonlinear structure. Furthermore, even if noise is completely removed, a demodulation process is still necessary to extract the heart rate and respiration information, which can introduce additional errors. In Equation (1), the amplitude difference between the frequencies of heartbeat and respiration is ten-fold, indicating that chest movement caused by respiration significantly exceeds that caused by the heartbeat. Consequently, components related to heartbeat are more vulnerable to noise than those related to respiration. Accordingly, we developed a novel method that focuses on accurately extracting the heart rate from CW radar signals using only a neural network. Specifically, a TCN is employed to extract the heart rate from CW radar signals.

2.2. Signal Preprocessing for CW Radar

The CW radar sensor using actual measurement operates at the 5.8 GHz industrial, scientific and medical (ISM) band. As shown in Figure 1a, the radar front-end circuit is implemented on a 0.6 mm thick FR4 PCB, and a power divider is used to distribute the transmitted and LO signals. The transmission path features an amplifier increasing the output power, while the receiving path includes a low-noise amplifier, mixer, and low-pass filters. The overall noise figure and gain of the receiver are 1.37 dB and 27.5 dB, respectively. The module measures 35 mm by 55 mm, excluding the Tx/Rx patch antennas. The CW radar signals used in the experiment were measured using a synchronous multichannel data acquisition (DAQ) board (NI USB-6366, National Instruments, Austin, TX, USA). I/Q signals were recorded over 5 min at a sampling rate of 1000 Hz, with reference ECG signals simultaneously recorded at a sampling rate of 200 Hz. Figure 1b shows the experimental environment for overall data acquisition. All signals were obtained as the subjects were in a resting state in the supine position. The participants involved in the study were undergraduate and graduate students with no history of heart-related ailments, ensuring a healthy and representative sample for the experiment. However, using all recorded signals for neural network training may extend learning times and increase computational demands. Moreover, estimating the average heart rate over 5 min may be inefficient. Given the repetitive nature of vital signals, using every data point may obscure local characteristics. Therefore, the CW radar signals used as network inputs were down-sampled to 100 Hz, effectively reducing their original length by 90%. Subsequently, the signals were segmented into suitable time units as input to the network. Additionally, the segmented signals underwent minimum–max normalization, a process that adjusts each segment based on its minimum and maximum values. This normalization is crucial when preparing data for neural network analysis and ensuring that the input is standardized and conducive to effective learning. The strategy of down-sampling and normalization was designed to optimize the learning process and enhance the network’s efficiency by concentrating on essential features within the vital signal data. Figure 2 is a schematic diagram of the actual measured signal and the preprocessed signal. Such preprocessing is pivotal in ensuring that the neural network effectively learns patterns in the signals, leading to more accurate and reliable results in the analysis of vital signs.

2.3. Signal Preprocessing for ECG

Similar to CW radar signals, preprocessing is necessary to utilize the ECG measured by the reference signal as the output of the network. An ECG consists of a P wave, QRS complex and T wave as shown in Figure 3. The R-peak, which represents the beginning of a heartbeat, is characterized by the highest value in this complex. In the RR interval, the distance between R peaks corresponds to the cycle of the periodic ECG signal, and can be calculated to determine heart rate frequency. The R peak is detected by applying the QRS detection algorithm proposed by Christov [34]. Using this method, RR intervals can be computed from the temporal differences between detected R peaks. Because the heart rate of a general adult in a resting state ranges from 60 to 100 beats per minute [35], there are typically 3–5 R peaks detected within a 3 s interval of resting ECG. Heart rate frequency can be obtained from the average RR interval over a certain period.
When approximating heart-rate frequency, the waveform takes precedence over the absolute value of the signal. Because all vital signals measured by the CW radar are obtained during the resting period, they typically fell within a frequency range of 1–1.67 Hz. However, during processing, actual measurement signals were observed to span a wider range. Therefore, we extended the range of the heart rate frequency fH to 0.8–1.7 Hz. Based on these characteristics, the output of the network was normalized to a range of (0, 1), limiting the range of frequencies that could be estimated using the network. To guarantee stable network performance and enhance convergence speed, faulty signals arising from the motion of test subjects or instability in the radar module were systematically excluded from the dataset during the measurement process.

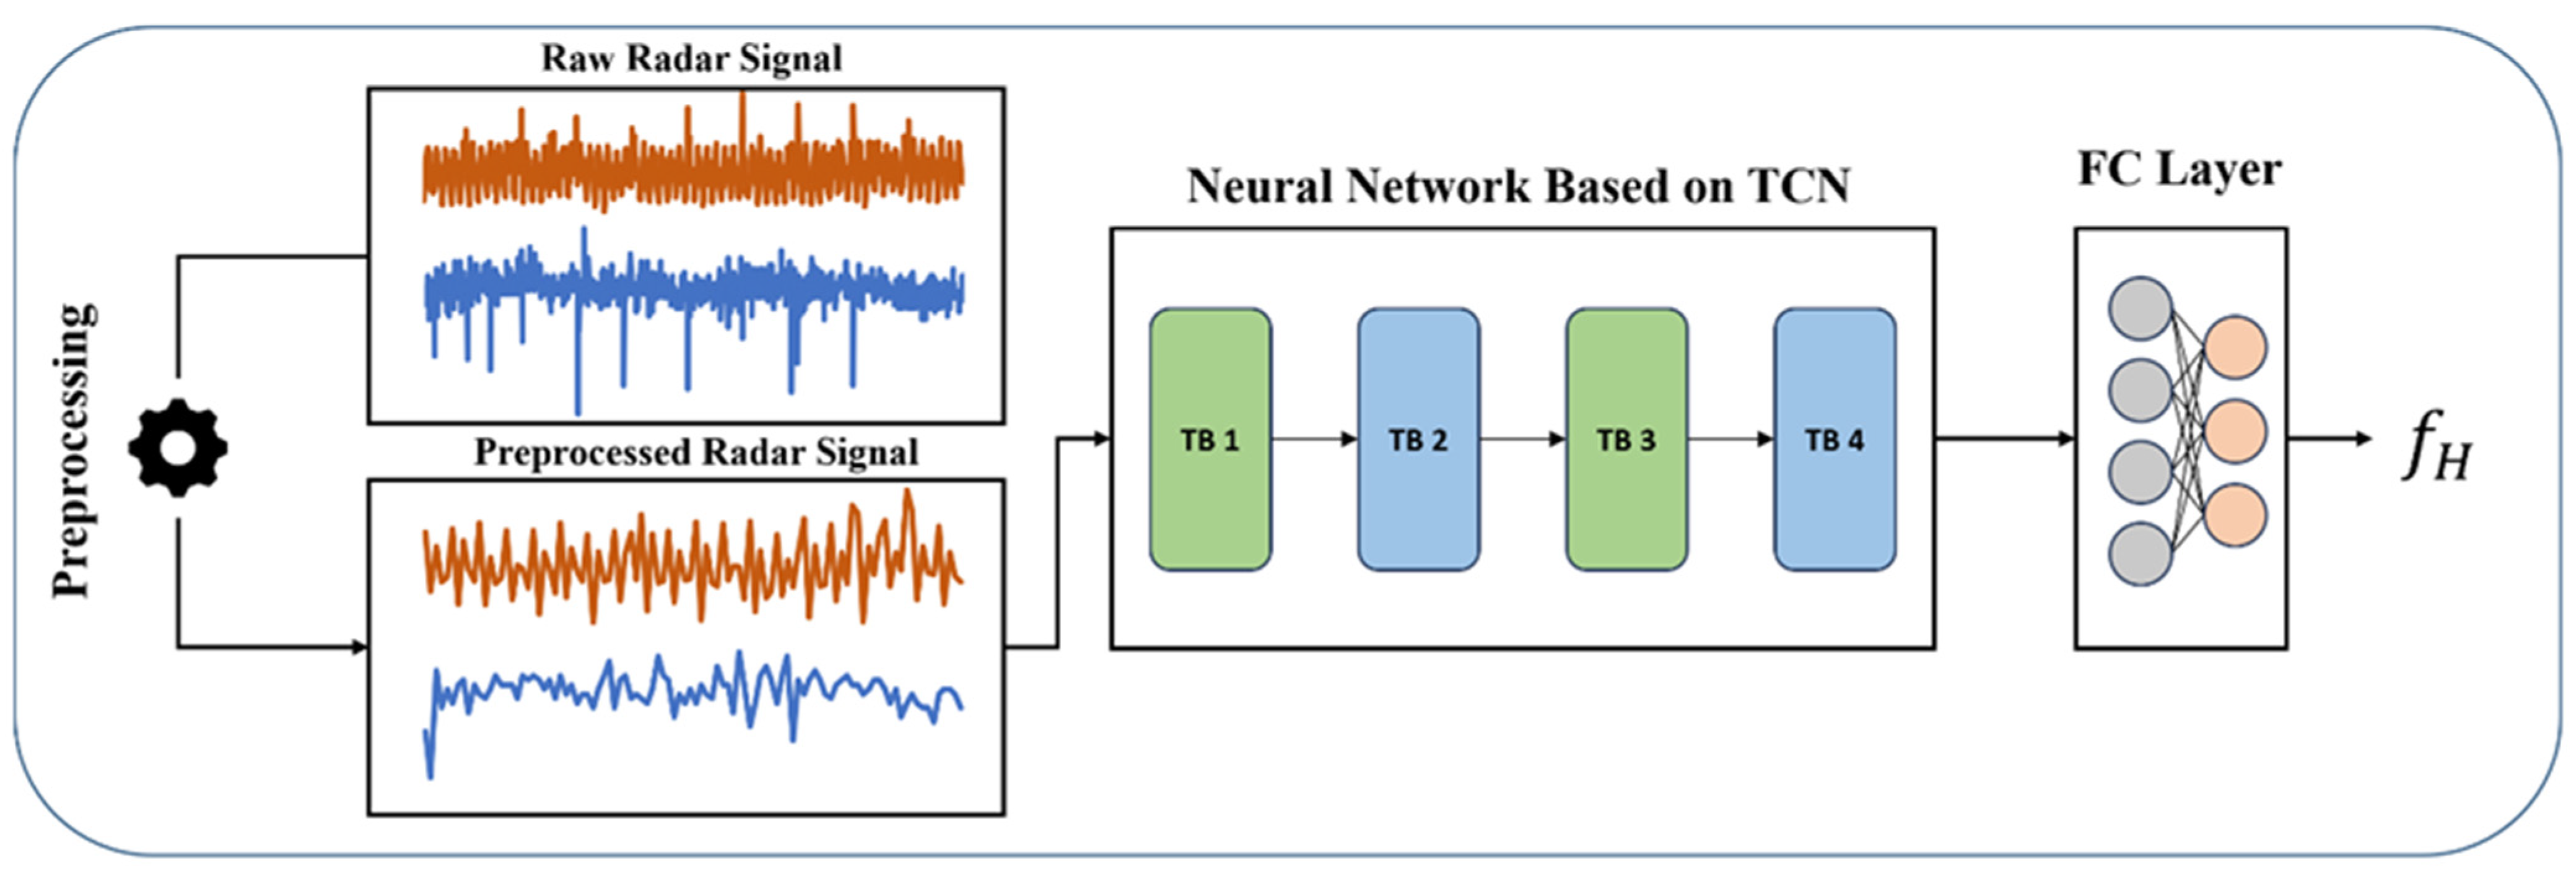
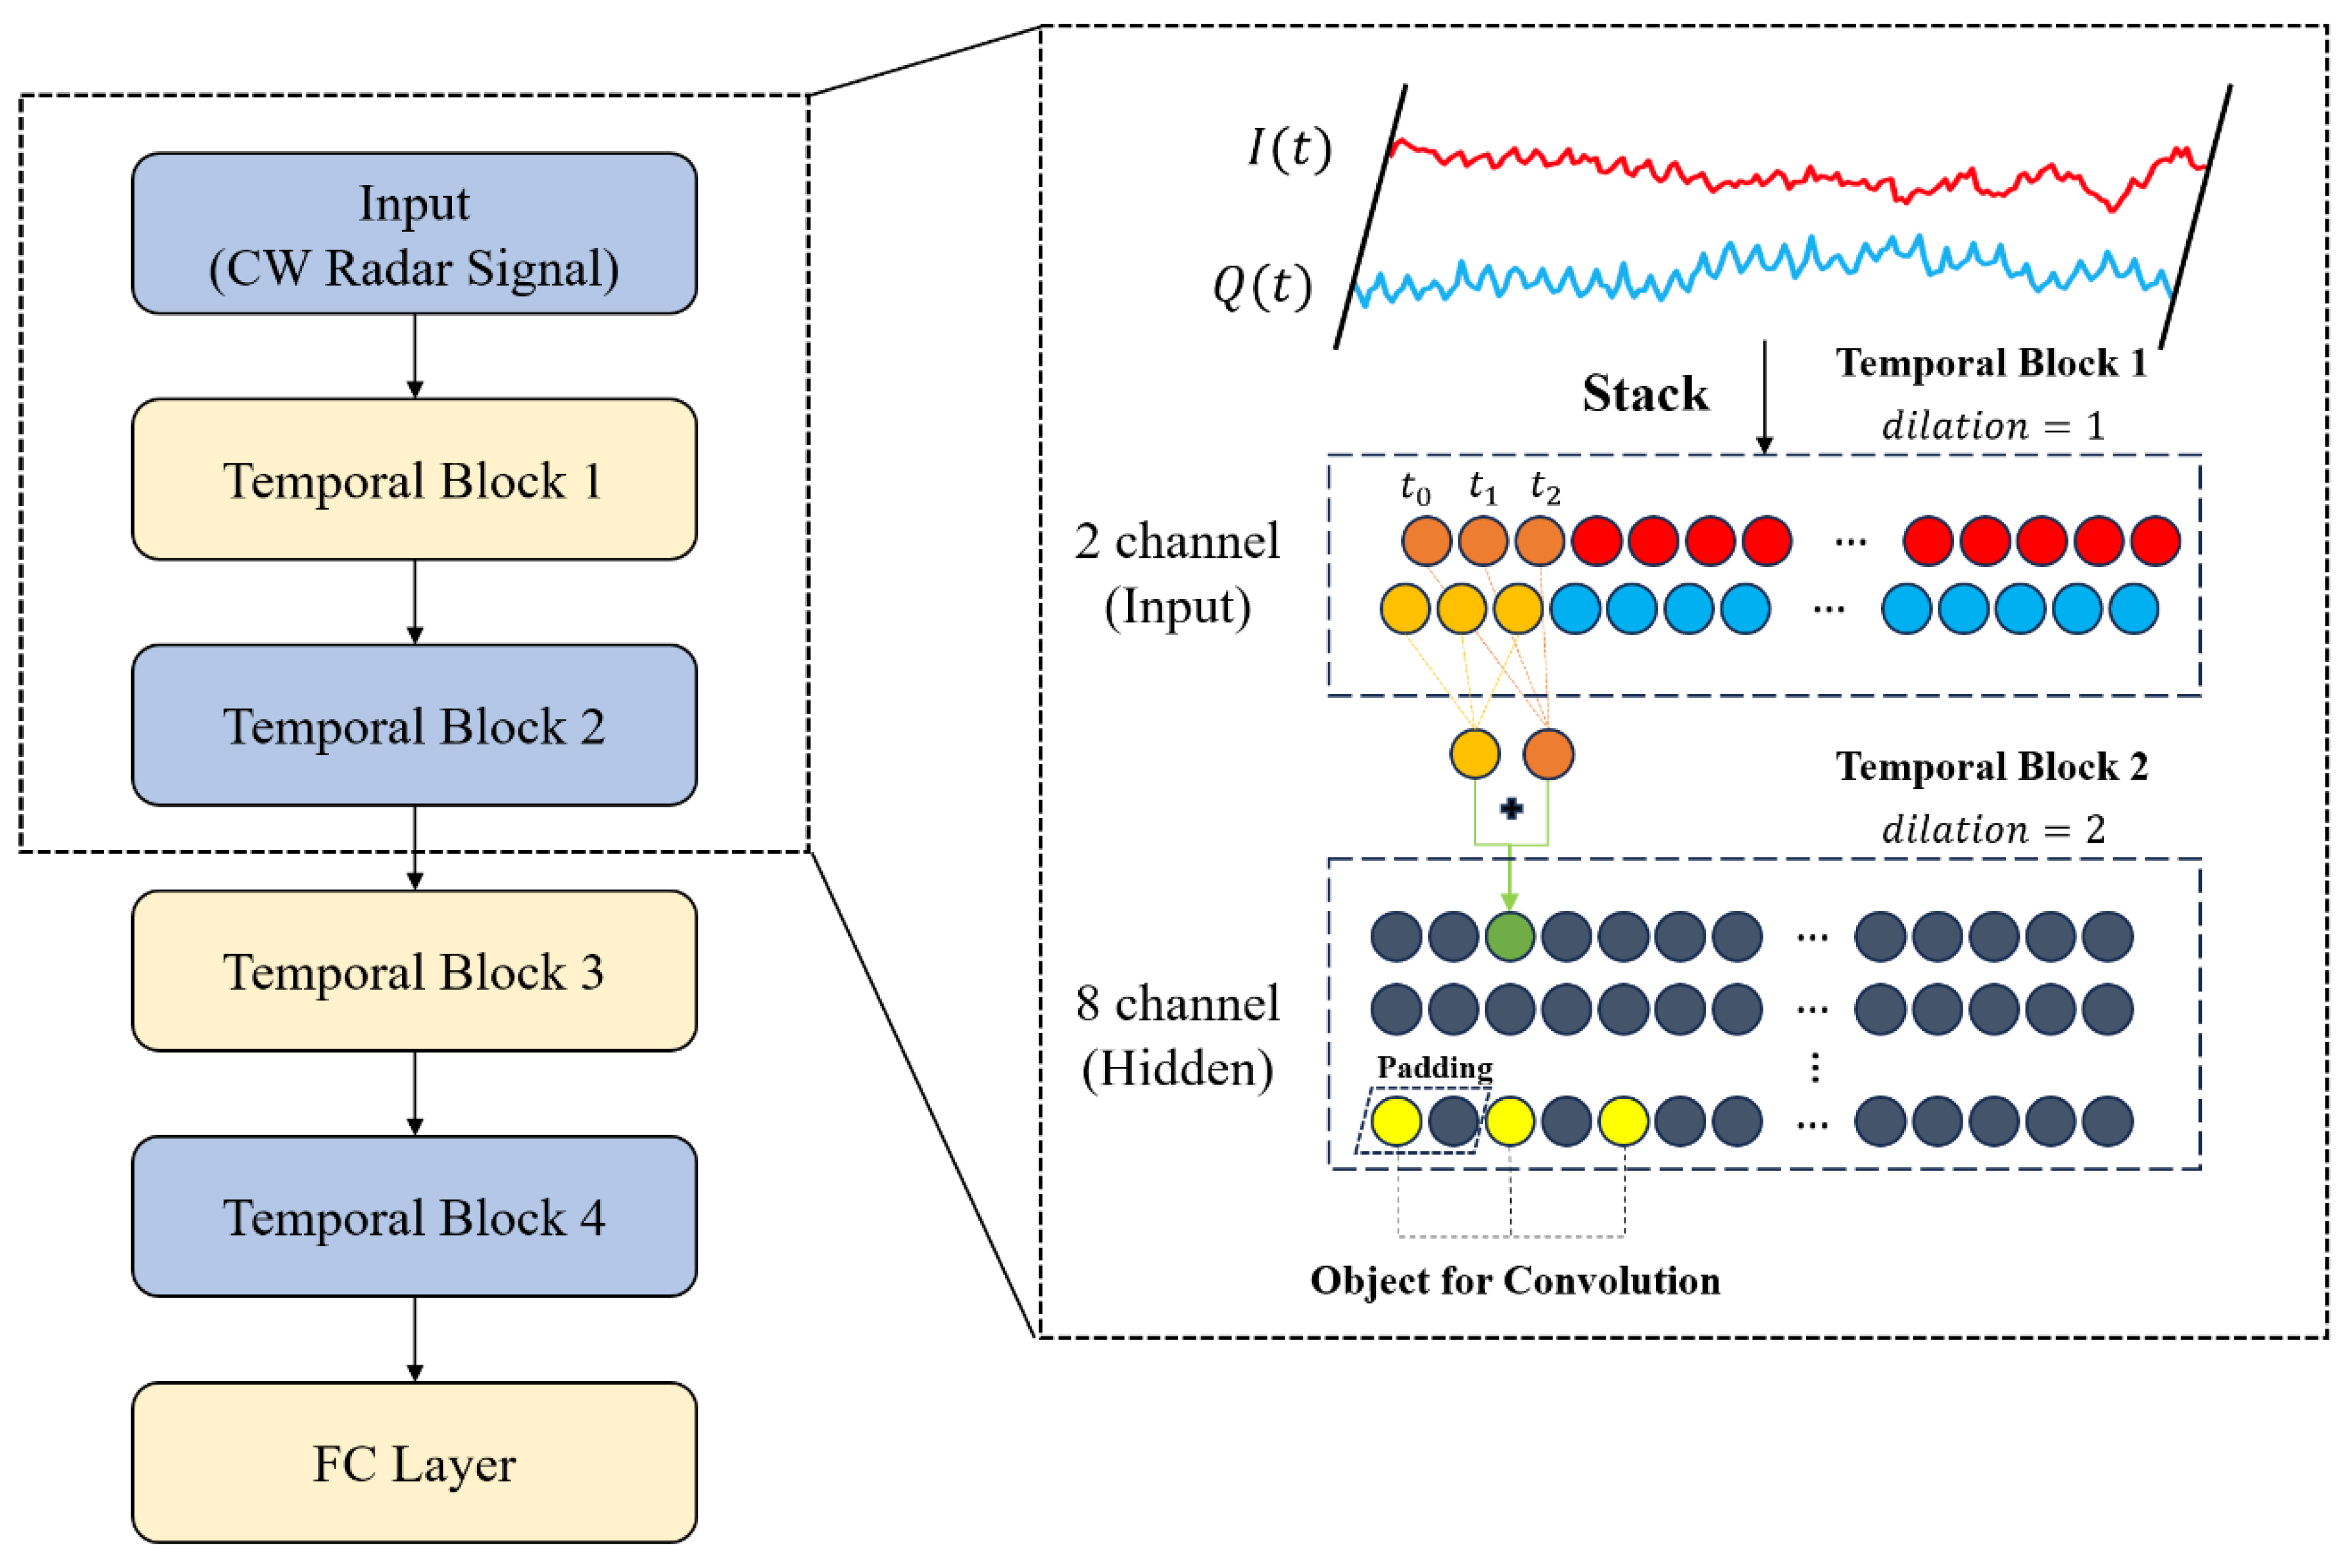
2.4. The Proposed CW Signal Processing Procedure
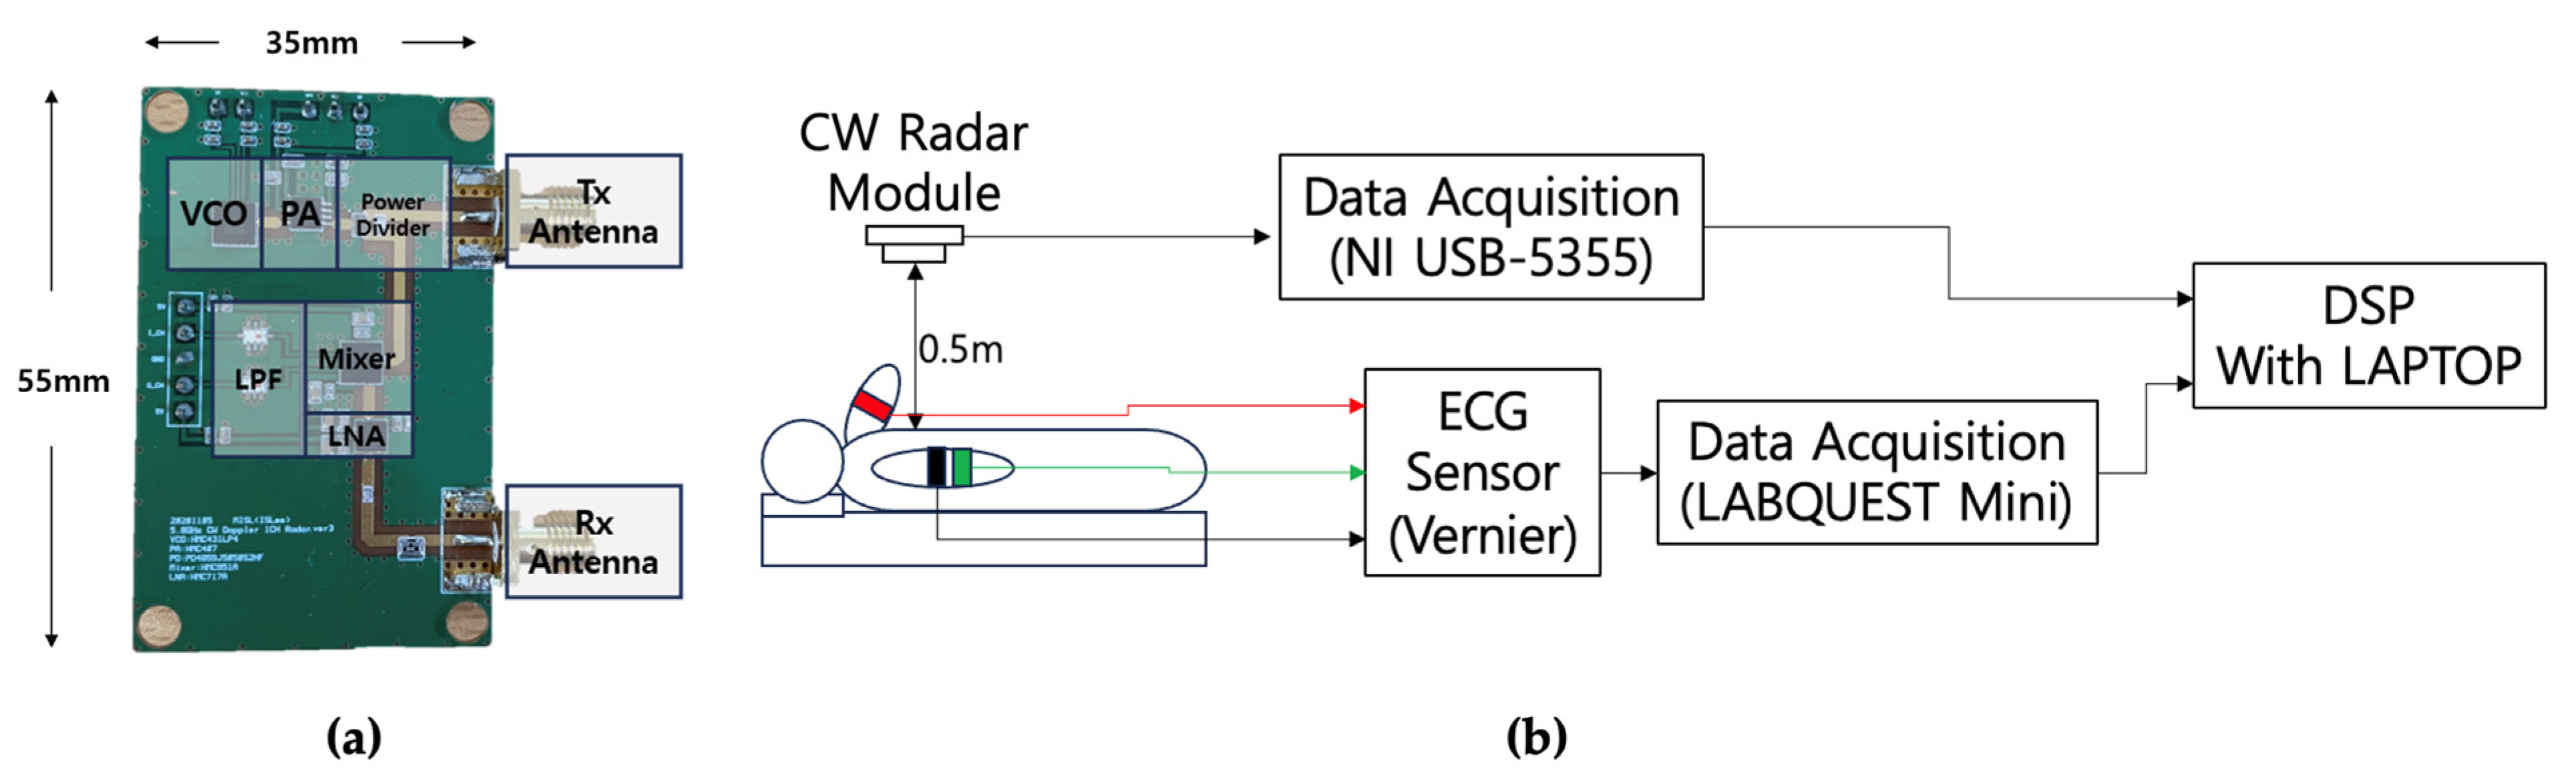
The conventional method for processing CW radar signals is a sequential approach that initially eliminates DC bias and white noise, both of which may arise during the measurement process. The denoised signals are then demodulated to acquire the displacement information x(t) of the measurement target. Subsequently, FFT is applied to obtain the heart rate frequency. However, the sequential application of multiple processing algorithms can lead to the following drawbacks: (1) The complete elimination of noise components is challenging, and any residual components may cause additional errors during the subsequent demodulation process (2) The FFT inherently exhibits a frequency resolution issue, wherein resolution decreases along with measurement time. This limitation can pose challenges for accurate frequency analyses based on the FFT. Figure 4 illustrates an exaggerated representation of this scenario, depicting the FFT resolution when the ECG signal was recorded for 2 s at 20 Hz.
To overcome these problems, we propose an alternate method that replaces the conventional step-by-step approach with a single neural network, as shown in Figure 5. The neural network adopts an end-to-end format that effectively substitutes processes such as denoising, demodulation, and FFT-based fundamental frequency detection. Owing to this structure, the network fits all processing stages between the input and output, eliminating the need for manual processes, such as frequency extraction via FFT, or structural designs, such as demodulation. Furthermore, the simplified processing procedure enables a more straightforward adaptation to new data as it negates the necessity for complex adjustments. In this study, we employed a TCN structure to process CW radar signals, focusing on estimating heart rate.
A TCN is a deep learning architecture specifically designed for processing sequential data. It employs a convolutional structure that adheres to causal relationships, ensuring that predictions are based on past and current data without being influenced by future data. One distinguishing feature of a TCN is its use of dilated convolutions, which expand the receptive field to cover a broader range of input sequences. In addition, it incorporates residual connections and enhances learning stability, particularly in deep architectures. This design preserves the temporal resolution of input data, allowing the network to make predictions at each sequential time step. Consequently, TCNs are highly efficient and effective in applications such as time series analysis, speech recognition, and natural language processing [36,37,38,39]. TCNs offer faster learning speeds and improved performance compared to traditional recurrent neural networks (RNNs) and long short-term memory (LSTM) networks [40].
The TCN architecture employed in this study utilizes input signals acquired from the CW radar, combining I/Q signals into a unified representation for processing. Each channel consists of I/Q signals processed through four temporal blocks. Figure 6 presents a segmented view of this signal processing approach. Furthermore, the signals passing through the two channels change in the number of channels on the order of eight, four, two, and one within the TCN. The output features of the temporal blocks are then analyzed in the fully connected layer and output as the heart rate frequency. The activation function for all layers except the output layer was ReLU and, because the ECG data were min-max normalized, the output layer used a sigmoid function. Additionally, the Adam optimizer was used with a learning rate of 0.01. Lastly, the L1 loss function was chosen to be robust to the many outliers present in the actual measured data.

3. Experiment

3.1. Dataset Configurations

Each network input consisted of a three-second CW radar signal, and the corresponding output was the heart rate calculated from the ECG. During processing, each signal from the same measurement target was segmented into multiple parts. Consequently, a correlation may exist between input and output pairs. This is noteworthy because the characteristics of vital signals involve the repetition of certain patterns and correlations with other components. Therefore, even when signals obtained from the same subject and situation are divided, they may demonstrate a mutual correlation.
To interpret the impact of this correlation on network performance, the experimental dataset was divided into two subsets with respect to whether the training and validation sets shared signals from the same measurement target. As shown in Table 1, the training and validation sets were equivalent in size.

3.2. Experimental Procedure

The input dimensions of the neural network were set to 300 × 1. As shown in Figure 7, the CW radar signals were segmented into suitable time units, allowing the network to estimate heart rate frequency. Experiments were conducted using training networks with the same structure on different datasets, and the validation results were compared. All networks were trained for 500 epochs with a batch size of 128. To ensure a consistent evaluation, we trained the same network architecture five times on an identical dataset and calculated the average performance. The experimental results are presented in terms of the L1 loss and accuracy. Because the moving average is effective for analyzing time-series data, it was used to evaluate network performance as follows:
f ~ H , k = 1 n i = k n + k 1 f H , i f ¯ ( H ,   i ) ,
where n represents the order of the moving average. Figure 7 depicts the method for processing signals that exceed the network capacity. To handle such signals, they were segmented into 3 s units prior to the frequency estimation. The decision to use 3 s intervals was based on the observation that the heart typically beats 3 to 5 times within this period, suggesting that this might be an effective unit for the network to learn these characteristics. The moving average was calculated as a time-varying measure based on the difference between the original and estimated frequencies. Figure 8 illustrates this process for a window size of 3, showing the calculation of a moving average for a frequency exceeding 9 s. When the calculated moving average falls within the original FFT resolution range, the estimated value is considered correct. The accuracy of heart rate estimation using neural networks is based on a frequency resolution of 0.333 Hz, which is derived from a signal measured over 3 s with a sampling rate of 200 Hz. Thus, the estimated frequency is considered accurate if the difference between the estimated and true frequencies is less than half of the frequency resolution, i.e., 0.165 Hz.

3.3. Experimental Result

Table 2 presents the L1 loss and accuracy for the estimated heart rate frequency over 3-s intervals, which is the estimation unit of the network, as well as the resulting difference in BPM. Notably, when there is a correlation, the difference in beats per minute (BPM) is approximately 6, whereas without correlation the difference is about 8. Table 3 and Table 4 present the performance of the network evaluated using a moving average trained on datasets with and without correlation. From Table 3, we can observe that, when the network was trained on the uncorrelated dataset, the L1 loss and accuracy remained relatively stable despite the increase in the window size. In contrast, Table 4 shows that, when the network was trained on a dataset that includes correlations, there was a relative decrease in loss and an increase in accuracy as the window size increased. This suggests that, when the network is trained on a dataset with correlation, frequency changes are tracked more effectively over time. The network proposed in this study cannot perfectly replace existing methods, as its generalizability on uncorrelated datasets is low. However, it demonstrated superior performance on correlated datasets, illustrating its potential for development into an individualized approach.
This study faced a challenge in terms of immediate generalization owing to the narrow scope of measurements, which focused on specific age groups and a limited number of participants. Nevertheless, our findings reveal a significant enhancement in network performance when the training and validation datasets exhibit a correlation. This demonstrates that, given broader and more diverse data, correlations may arise even with previously unused data, indicating the potential of the proposed method to surpass conventional approaches.
Additionally, our analysis revealed a significant impact of varying the window size on network performance. Although this study was confined to window sizes of 10 and 20, exploring a wider range of sizes may further enhance the methodology. The effectiveness of a neural network can be significantly enhanced by tailoring the window size to the data characteristics or specific application requirements.

4. Conclusions

In this study, a novel method utilizing an artificial intelligence network was designed to solve problems arising from existing processing methods used for non-contact biometry. The method addresses the inherent limitations of conventional step-by-step signal processing, which encompasses noise removal, demodulation, and FFT by integrating these processes into a single neural network. The integrated approach aims to minimize cumulative errors while maximizing the accuracy of vital signal detection. Although this approach reduces processing time compared to that of existing methods, it exhibits a similar accuracy for correlated datasets. However, we confirmed that, if a sufficient dataset for generalization can be secured, the proposed approach has the potential to outperform existing methods.
Experiments were conducted to verify the performance of two networks with the same structure trained using different datasets, with L1 loss and accuracy based on frequency resolution used as evaluation metrics. The network can approximate longer durations, and its performance was evaluated using moving averages. Consequently, we confirmed that the performance of the network trained using the correlated dataset was significantly higher, suggesting that better performance can be achieved when a correlation exists between the training and validation sets. Although the number and age range of the measurement targets were limited, the proposed method may outperform conventional approaches given a sufficient volume of data.
The proposed method differs from traditional vital signal measurement in that it causes minimal discomfort to the subject, thus enabling continuous monitoring. Additionally, the heart rate data obtained through this method can be used to monitor health status, facilitating early detection of diseases, and can be applied in various fields, such as exercise and sleep management.
In future research, we intend to study the structure of networks that can deliver high performance with less data, as well as examine AI-based signal processing methods that are effective even when data are collected during motion or in different postures. Additionally, we are currently focusing only on heart rate, but we plan to experiment to obtain other useful vital information in the future. Finally, we aim to integrate the proposed method with robotics to enhance the practical applications of our approach.

Author Contributions

Conceptualization, W.Y.Y. and N.K.K.; methodology, W.Y.Y.; software, W.Y.Y.; validation, W.Y.Y. and N.K.K.; writing—original draft preparation, W.Y.Y.; writing—review and editing, W.Y.Y. and N.K.K.; visualization, W.Y.Y.; supervision, N.K.K.; project administration, N.K.K. All authors have read and agreed to the published version of the manuscript.

Funding

This research was supported by the National Research Foundation of Korea (NRF) grant funded by the Korea government (MSIT) (NO. RS-2023-00219725).

Data Availability Statement

Data are contained within the article.

Acknowledgments

The author presents their sincere appreciation to all those who contributed to this study.

Conflicts of Interest

The authors declare no conflicts of interest.

References

  1. Xu, J.; Murphy, S.L.; Kochanek, K.D.; Arias, E. Deaths: Final data for 2019. Natl. Vital Stat. Rep. 2021, 70, 8. [Google Scholar]
  2. Bernstein, R.A.; Kamel, H.; Granger, C.B.; Piccini, J.P.; Sethi, P.P.; Katz, J.M.; Vives, C.A.; Ziegler, P.D.; Franco, N.C.; Schwamm, L.H.; et al. Effect of Long-term Continuous Cardiac Monitoring vs Usual Care on Detection of Atrial Fibrillation in Patients With Stroke Attributed to Large- or Small-Vessel Disease: The STROKE-AF Randomized Clinical Trial. JAMA 2021, 325, 2169–2177. [Google Scholar] [CrossRef] [PubMed]
  3. Tsao, C.W.; Aday, A.W.; Almarzooq, Z.I.; Alonso, A.; Beaton, A.Z.; Bittencourt, M.S.; Boehme, A.K.; Buxton, A.E.; Carson, A.P.; Commodore-Mensah, Y. Heart disease and stroke statistics—2022 update: A report from the American Heart Association. Circulation 2022, 145, e153–e639. [Google Scholar] [PubMed]
  4. Serhani, M.A.; T. El Kassabi, H.; Ismail, H.; Nujum Navaz, A. ECG monitoring systems: Review, architecture, processes, and key challenges. Sensors 2020, 20, 1796. [Google Scholar] [CrossRef] [PubMed]
  5. Heo, S.; Kwon, S.; Lee, J. Stress detection with single PPG sensor by orchestrating multiple denoising and peak-detecting methods. IEEE Access 2021, 9, 47777–47785. [Google Scholar] [CrossRef]
  6. Slapničar, G.; Luštrek, M.; Marinko, M. Continuous blood pressure estimation from PPG signal. Informatica 2018, 42, 33–42. [Google Scholar]
  7. Li, P.; Laleg-Kirati, T.-M. Central blood pressure estimation from distal PPG measurement using semiclassical signal analysis features. IEEE Access 2021, 9, 44963–44973. [Google Scholar] [CrossRef]
  8. Zhang, Y.; Feng, Z. A SVM method for continuous blood pressure estimation from a PPG signal. In Proceedings of the 9th International Conference on Machine Learning and Computing, Singapore, 24–26 February 2017; pp. 128–132. [Google Scholar]
  9. Cowie, M.R.; Lam, C.S. Remote monitoring and digital health tools in CVD management. Nat. Rev. Cardiol. 2021, 18, 457–458. [Google Scholar] [CrossRef]
  10. Alizadeh, M.; Shaker, G.; De Almeida, J.C.M.; Morita, P.P.; Safavi-Naeini, S. Remote monitoring of human vital signs using mm-wave FMCW radar. IEEE Access 2019, 7, 54958–54968. [Google Scholar] [CrossRef]
  11. Wang, Y.; Shui, Y.; Yang, X.; Li, Z.; Wang, W. Multi-target vital signs detection using frequency-modulated continuous wave radar. EURASIP J. Adv. Signal Process. 2021, 2021, 103. [Google Scholar] [CrossRef]
  12. Botina-Monsalve, D.; Benezeth, Y.; Miteran, J. RTrPPG: An ultra light 3DCNN for real-time remote photoplethysmography. In Proceedings of the Proceedings of the IEEE/CVF Conference on Computer Vision and Pattern Recognition, New Orleans, LA, USA, 19–24 June 2022; pp. 2146–2154. [Google Scholar]
  13. Karthick, R.; Dawood, M.S.; Meenalochini, P. Analysis of vital signs using remote photoplethysmography (RPPG). J. Ambient. Intell. Humaniz. Comput. 2023, 14, 16729–16736. [Google Scholar] [CrossRef]
  14. Lokendra, B.; Puneet, G. AND-rPPG: A novel denoising-rPPG network for improving remote heart rate estimation. Comput. Biol. Med. 2022, 141, 105146. [Google Scholar] [CrossRef]
  15. Kim, D.-Y.; Lee, K.; Sohn, C.-B. Assessment of roi selection for facial video-based rppg. Sensors 2021, 21, 7923. [Google Scholar] [CrossRef] [PubMed]
  16. Casado, C.A.; López, M.B. Face2PPG: An unsupervised pipeline for blood volume pulse extraction from faces. IEEE J. Biomed. Health Inform. 2023, 27, 5530–5541. [Google Scholar] [CrossRef] [PubMed]
  17. Paterniani, G.; Sgreccia, D.; Davoli, A.; Guerzoni, G.; Di Viesti, P.; Valenti, A.C.; Vitolo, M.; Vitetta, G.M.; Boriani, G. Radar-based monitoring of vital signs: A tutorial overview. Proc. IEEE 2023, 111, 277–317. [Google Scholar] [CrossRef]
  18. Hoang, T.Y. CW Radar-based Non-contact Vital Sign Monitoring. Ph.D. Thesis, The University of Electro-Communications, Tokyo, Japan, 2023. [Google Scholar]
  19. Ebrahim, M.P.; Tom, N.; Redoute, J.-M.; Yuce, M.R. A low-frequency portable continuous wave radar system for vital signs monitoring. IEEE Sens. J. 2023, 23, 8876–8886. [Google Scholar] [CrossRef]
  20. Fan, S.; Deng, Z. Chest Wall Motion Model of Cardiac Activity for Radar-Based Vital-Sign-Detection System. Sensors 2024, 24, 2058. [Google Scholar] [CrossRef] [PubMed]
  21. Liang, Z.; Xiong, M.; Jin, Y.; Chen, J.; Zhao, D.; Yang, D.; Liang, B.; Mo, J. Non-contact human vital signs extraction algorithms using IR-UWB radar: A review. Electronics 2023, 12, 1301. [Google Scholar] [CrossRef]
  22. Kyrarini, M.; Lygerakis, F.; Rajavenkatanarayanan, A.; Sevastopoulos, C.; Nambiappan, H.R.; Chaitanya, K.K.; Babu, A.R.; Mathew, J.; Makedon, F. A survey of robots in healthcare. Technologies 2021, 9, 8. [Google Scholar] [CrossRef]
  23. Soares, B.; Gouveia, C.; Albuquerque, D.; Pinho, P. Impact and Classification of Body Stature and Physiological Variability in the Acquisition of Vital Signs Using Continuous Wave Radar. Appl. Sci. 2024, 14, 921. [Google Scholar] [CrossRef]
  24. Holland, J.; Kingston, L.; McCarthy, C.; Armstrong, E.; O’Dwyer, P.; Merz, F.; McConnell, M. Service robots in the healthcare sector. Robotics 2021, 10, 47. [Google Scholar] [CrossRef]
  25. Ahn, H.S.; Lee, M.H.; MacDonald, B.A. Healthcare robot systems for a hospital environment: CareBot and ReceptionBot. In Proceedings of the 2015 24th IEEE International Symposium on Robot and Human Interactive Communication (RO-MAN), Kobe, Japan, 31 August–4 September 2015; pp. 571–576. [Google Scholar]
  26. Broadbent, E.; Kuo, I.H.; Lee, Y.I.; Rabindran, J.; Kerse, N.; Stafford, R.; MacDonald, B.A. Attitudes and reactions to a healthcare robot. Telemed. E-Health 2010, 16, 608–613. [Google Scholar] [CrossRef]
  27. Ragno, L.; Borboni, A.; Vannetti, F.; Amici, C.; Cusano, N. Application of social robots in healthcare: Review on characteristics, requirements, technical solutions. Sensors 2023, 23, 6820. [Google Scholar] [CrossRef]
  28. Barrick, D.E. FM/CW Radar Signals and Digital Processing; National Oceanic and Atmospheric Administration Boulder Co Wave Propagation Lab: Tokyo, Japan, 1973. [Google Scholar]
  29. Kumawat, H.C.; Raj, A.B. Approaching/receding target detection using cw radar. In Proceedings of the 2020 5th International Conference on Communication and Electronics Systems (ICCES), Coimbatore, India, 10–12 June 2020; pp. 136–141. [Google Scholar]
  30. Lee, I.-S.; Park, J.-H.; Yang, J.-R. Detrending technique for denoising in CW radar. Sensors 2021, 21, 6376. [Google Scholar] [CrossRef]
  31. Salmi, J.; Luukkonen, O.; Koivunen, V. Continuous wave radar based vital sign estimation: Modeling and experiments. In Proceedings of the 2012 IEEE Radar Conference, Atlanta, GA, USA, 7–11 May 2012; pp. 0564–0569. [Google Scholar]
  32. Bai, S.; Kolter, J.Z.; Koltun, V. An empirical evaluation of generic convolutional and recurrent networks for sequence modeling. arXiv 2018, arXiv:1803.01271. [Google Scholar]
  33. Boric-Lubecke, O.; Lubecke, V.M.; Droitcour, A.D.; Park, B.-K.; Singh, A. Doppler Radar Physiological Sensing; John Wiley & Sons: New York, NJ, USA, 2015. [Google Scholar]
  34. Christov, I.I. Real time electrocardiogram QRS detection using combined adaptive threshold. Biomed. Eng. Online 2004, 3, 28. [Google Scholar] [CrossRef] [PubMed]
  35. Ostchega, Y.; Porter, K.S.; Hughes, J.; Dillon, C.F.; Nwankwo, T. Resting pulse rate reference data for children, adolescents, and adults; United States, 1999–2008. Natl. Health Stat. Rep. 2011, 24, 1–6. [Google Scholar]
  36. Hewage, P.; Behera, A.; Trovati, M.; Pereira, E.; Ghahremani, M.; Palmieri, F.; Liu, Y. Temporal convolutional neural (TCN) network for an effective weather forecasting using time-series data from the local weather station. Soft Comput. 2020, 24, 16453–16482. [Google Scholar] [CrossRef]
  37. Wang, Y.; Chen, J.; Chen, X.; Zeng, X.; Kong, Y.; Sun, S.; Guo, Y.; Liu, Y. Short-term load forecasting for industrial customers based on TCN-LightGBM. IEEE Trans. Power Syst. 2020, 36, 1984–1997. [Google Scholar] [CrossRef]
  38. Zhang, R.; Sun, F.; Song, Z.; Wang, X.; Du, Y.; Dong, S. Short-term traffic flow forecasting model based on GA-TCN. J. Adv. Transp. 2021, 2021, 1338607. [Google Scholar] [CrossRef]
  39. Hao, H.; Wang, Y.; Xue, S.; Xia, Y.; Zhao, J.; Shen, F. Temporal convolutional attention-based network for sequence modeling. arXiv 2020, arXiv:2002.12530. [Google Scholar]
  40. Gopali, S.; Abri, F.; Siami-Namini, S.; Namin, A.S. A comparison of tcn and lstm models in detecting anomalies in time series data. In Proceedings of the 2021 IEEE International Conference on Big Data (Big Data), Orlando, FL, USA, 15–18 December 2021; pp. 2415–2420. [Google Scholar]
Figure 1. (a) A photograph of the PCB used for signal capture and a description of its structure; (b) Diagram of the signal measurement environment.
Electronics 13 02666 g001
Figure 2. Actual measured signal and preprocessed CW radar signal.
Electronics 13 02666 g002
Figure 3. ECG trace illustrating heart rhythm: P wave, QRS complex and T wave.
Electronics 13 02666 g003
Figure 4. Frequency resolution problem when measuring at a low sampling rate for a short period of time.
Electronics 13 02666 g004
Figure 5. Visualization of Overall Signal Processing Process Using TCN.
Electronics 13 02666 g005
Figure 6. TCN for processing signals measured by CW Radar.
Electronics 13 02666 g006
Figure 7. Data Pipeline of Signal Processing Using TCN.
Electronics 13 02666 g007
Figure 8. Visualized Moving Average Calculation.
Electronics 13 02666 g008
Table 1. Detailed statistics and whether there is a correlation between the datasets.
Dataset Used to Train the NetworkCorrelated
Number of Train Set20002000
Number of Validation Set838838
Correlation with Validation and TrainCorrelatedUnrelated
Table 2. Summary of the Performance Comparison of the Neural Network’s Estimation Results Considering the Inclusion of Correlation.
Dataset Used to Train the NetworkCorrelatedUnrelated
L1 Loss0.0950.129
Accuracy (%)83.6571.46
Difference between
the converted BPMs
5.77.74
Table 3. Performance of Network Fitted with Unrelated Dataset Based on Moving Average.
Window Size10 (30 s)20 (60 s)
Average Loss0.1280.130
Accuracy (%)75.3775.71
Difference between
the converted BPM
7.687.80
Table 4. Performance of Network Fitted with Correlated Dataset Based on Moving Average.
Window Size10 (30 s)20 (60 s)
Average Loss0.0930.091
Accuracy (%)95.2396.36
Difference between
the converted BPM
5.585.46
Disclaimer/Publisher’s Note: The statements, opinions and data contained in all publications are solely those of the individual author(s) and contributor(s) and not of MDPI and/or the editor(s). MDPI and/or the editor(s) disclaim responsibility for any injury to people or property resulting from any ideas, methods, instructions or products referred to in the content.

