Article

Design of Ultrasonic Guided Wave Pipeline Non-Destructive Testing System Based on Adaptive Wavelet Threshold Denoising

1
College of Mechanical and Electronic Engineering, Nanjing Forestry University, Nanjing 210037, China
2
China-Pakistan Belt and Road Joint Laboratory on Smart Disaster Prevention of Major Infrastructures, Southeast University, Nanjing 210096, China
*
Author to whom correspondence should be addressed.
Electronics 2024, 13(13), 2536; https://doi.org/10.3390/electronics13132536
Submission received: 25 May 2024 / Revised: 19 June 2024 / Accepted: 25 June 2024 / Published: 28 June 2024

Abstract

Guided wave ultrasonic testing (GWUT) within the realm of pipeline inspection is an efficacious approach; however, current GWUT systems are characterized by high costs and power consumption, and their detection results are significantly susceptible to noise interference. Addressing these issues, this study introduces a GWUT system predicated on adaptive wavelet threshold denoising, centered around a low-power main controller, achieving cost-effective and low-power-consumption pipeline non-destructive testing (NDT) with clear results. The system employs an STM32 as the main controller and utilizes direct digital frequency synthesis (DDS) technology to generate ultrasonic excitation signals. These signals, after power amplifier processing, ensure high-stability output for the driving signal. In conjunction with the signal acquisition module, digital filtering of the collected signals is executed via the host computer. Empirical validation has demonstrated that the system can achieve an output amplitude of up to 90 Vpp within an excitation frequency range of 20 kHz–400 kHz, directly driving piezoelectric transducers. The optimal threshold is identified using the butterfly optimization algorithm, enabling the wavelet threshold function to adaptively denoise the echo signals, thereby significantly enhancing the capability to identify pipeline damage.

1. Introduction

Pipelines play a pivotal role in sectors such as energy, chemical engineering, and urban construction, serving as critical infrastructure for national economic development. Corrosion and deformation represent significant safety hazards during pipeline operation. Regular safety inspections of pipelines are essential measures to ensure their secure functioning. Conventional detection techniques like penetrant and magnetic particle testing have been widely employed in pipeline damage detection, playing a vital role in ensuring pipeline safety, guiding maintenance, and repair. However, these conventional techniques have drawbacks, such as non-intuitive imaging and the potential for inducing corrosion if not properly handled. A comparison of the different detection methods is shown in Table 1.
Compared to conventional detection techniques, NDT has emerged as a popular and comprehensive application technology due to its advantages such as long detection range and non-invasive nature to pipelines. Ultrasonic guided wave pipeline NDT is one category of NDT, applicable to both metallic and non-metallic materials [1,2,3,4,5,6,7]. Although ultrasonic guided wave pipeline NDT technology has matured in applications [8] and offers significant advantages in detection precision and reliability, it still faces challenges in practical use. The high-cost threshold and substantial operational power consumption limit its broader application. In ultrasonic guided wave damage detection, noise interference can affect the detection signal for various reasons, posing challenges to the reliability of the results. These issues collectively constrain the potential for wider application of ultrasonic guided wave NDT technology [9,10]. Based on this technology, many scholars have conducted in-depth studies on ultrasonic guided wave NDT systems.
Du et al. explored the combination of ultrasonic guided wave and electromagnetic inspection techniques to encounter the limitations of traditional single inspection methods and proposed a multimodal pipeline NDT system that can quickly inspect boiler piping and make up for the lack of effectiveness of a single inspection [11]. Yuan et al. designed an FPGA-based ultrasonic guided wave NDT system, implemented through high-level synthesis (HLS). The design optimizes convolutional and fully connected layers, enhancing processing efficiency and achieving low-cost, real-time detection [12]. Lyu et al. proposed a multi-channel ultrasonic guided wave-based NDT system, which improves the accuracy and efficiency of testing by optimizing the sensor layout and signal processing algorithms and utilizes phased-array testing and full-focus imaging to provide a solution for NDT of defects in thin plates [13]. He et al. applied L(0,2) guided waves to detect pipeline defects, determining 70 kHz as optimal for excitation and validating the three-point positioning and imaging methods experimentally [14]. Song et al. conducted experiments on damage detection in large-diameter pipes using guided waves, revealing that liquid type affects wave propagation and defect signals, with a linear relationship between defect length and signal strength in empty pipes and a nonlinear relationship in liquid-filled pipes [15]. Zhang et al. proposed a method that employs Time-of-Flight compensation and probabilistic reconstruction for precise pipeline damage localization, proving to be highly accurate with a 7 mm average error and effective for detecting various damages [16]. Abbassi et al. applied machine learning algorithms to ultrasonic guided wave NDT in echo signal processing by comparing four dimensionality reduction methods, using two strategies, which achieves automated classification and identification of defects [17]. Tiwari et al. introduced a signal filtering technique based on ultrasonic guided wave scanning to estimate the size and location of defects within multi-layer composite material structures, thereby enhancing the estimation method for the position and dimensions of specific defects in glass fiber with diameters of 25 mm and 51 mm [18]. Xu et al. established propagation models for guided waves in both straight and feature-structured pipes, analyzing the impact on echo signals and proposing damage identification strategies. Additionally, a wavelet-based traditional soft-hard thresholding denoising method for guided waves was studied, effectively pinpointing damage locations and reducing echo signal noise [19]. Chang et al. introduced an Adaptive Sparse Deconvolution (ASD) method to address echo overlaps in guided wave pipeline inspections, employing a Gaussian echo model and SALSA algorithm for enhanced efficiency, with results showing superior performance over traditional methods [20].
In the field of pipeline inspection, ultrasonic guided wave NDT systems are subject to stringent requirements due to the extensive distribution and long distances covered by pipelines. These factors necessitate the development of solutions that address low power consumption and cost-effectiveness. Additionally, the presence of noise in the detection process can significantly impact the results. This interference may stem from various sources, including measurement errors, environmental disturbances, and inherent limitations of the equipment. To enhance the characteristics of the signal, thereby making the damage information contained within more pronounced, it is essential to perform filtering on the echo signals.
This study presents a design for an ultrasonic guided wave pipeline NDT system based on an adaptive wavelet threshold denoising algorithm. The system is capable of generating ultrasonic guided wave excitation signals, collecting echo signals, and denoising the echo signals using the adaptive wavelet threshold denoising algorithm. Experimental validation has confirmed that the system overcomes the high costs and power consumption associated with ultrasonic guided wave pipeline NDT systems, as well as the drawbacks of echo signals being susceptible to noise interference. Utilizing DDS technology, the system generates two delayed guided wave signals through DAC converters and power amplification circuits, which are then connected to two piezoelectric transducer arrays encircling the pipeline, thereby exciting the piezoelectric ceramic transducer array rings. The system’s host computer can adjust the frequency of the excitation signal, the number of cycles of the window function, and the amplitude of the output voltage, with a maximum of 90 Vpp, thus meeting the excitation needs of different pipelines. In conjunction with the existing signal acquisition module, the system can complete the task of pipeline damage detection. Moreover, the host computer of the system combines digital filtering algorithms to filter the detection echoes, specifically employing the butterfly optimization algorithm to solve for the optimal adjustment parameters of the wavelet threshold function. This enables the wavelet threshold function to perform adaptive filtering of the echo signals, thereby enhancing the accuracy and efficiency of damage detection.

2. Overall Program Design

Ultrasonic guided wave pipeline NDT methods primarily utilize low-frequency ultrasonic waves within the kHz range for transmission and receive scattered waves from defects to perform extensive pipeline damage screening [21]. The detection apparatus typically comprises three prevalent design approaches [22,23,24]. The first approach involves using an FPGA as the main controller to construct DDS for the generation of excitation signals and signal acquisition; the second approach utilizes DDS to directly drive a phase-locked loop (PLL) chip to output high-frequency excitation signals, with an ADC chip employed for direct signal collection; the third approach employs an STM32 microcontroller as the chief controller chip, which controls DDS to produce excitation signals and to collect signals. A comparative analysis of these three approaches is depicted in Table 2.
Among the three proposed schemes, the first exhibits superior expandability, while the second offers a higher output frequency. Although the third scheme falls short in computational speed, expandability, and output frequency compared to the first two, the first two schemes have an excessively high margin for pipeline inspection. In other words, the first two schemes incur higher power consumption, increased costs, and greater design complexity. Therefore, this study selects the third scheme, which involves a host computer controlling the main control chip STM32, paired with an AD9910 to design the excitation signal source. The signal collection end also utilizes STM32 as the main controller, in conjunction with a pre-amplification circuit and an ADC conversion circuit, culminating in the use of a host computer to complete the echo filtering process. The overall design scheme of the ultrasonic guided wave NDT system is illustrated in Figure 1.
The detection system designed in this study consists of three main components: (1) the host computer, (2) the signal excitation module, and (3) the signal acquisition module. The host computer communicates with the main controller chip to set the output frequency of the excitation signal and the period of the window function. It also employs filtering algorithms to process the collected pipeline echo signals, enhancing the accuracy and reliability of the detection process.
The signal excitation module interprets the excitation signal parameters sent by the host computer and outputs the excitation signal by querying a data table stored in ROM. It then amplifies the excitation signal using an amplification circuit. Additionally, a series matching circuit is implemented at the system’s backend to optimize circuit impedance matching.
The signal acquisition module is designed to work with a transducer array ring to collect pipeline echo signals. These collected signals are then transmitted to the host computer for further processing.

3. Hardware Design

3.1. Main Controller Module

To achieve the objectives of low cost and low power consumption, the main controller module is centered around the STM32F103ZET6 microcontroller from STMicroelectronics, headquartered in Geneva, which facilitates communication of host computer information and parameter setting for excitation signals. The STM32F103ZET6 is based on the Cortex-M3 core from ARM, a company located in Cambridge, UK, with a maximum operating frequency of 72 MHz. It is equipped with 112 GPIO ports and 8 timers, including 3 16-bit timers, and supports communication interfaces including USART and SPI protocols. Additionally, it possesses 64 KB of SRAM and 512 KB of FLASH memory [25], fully meeting the design requirements.
The STM32 main controller module communicates with the host computer via the RS485 protocol, receiving the frequency and period parameters of the excitation signal sent by the host computer. Based on these parameters, the STM32 controller configures the corresponding data and instructions, which are then sent to the signal generation circuit to control the output of the appropriate signal.

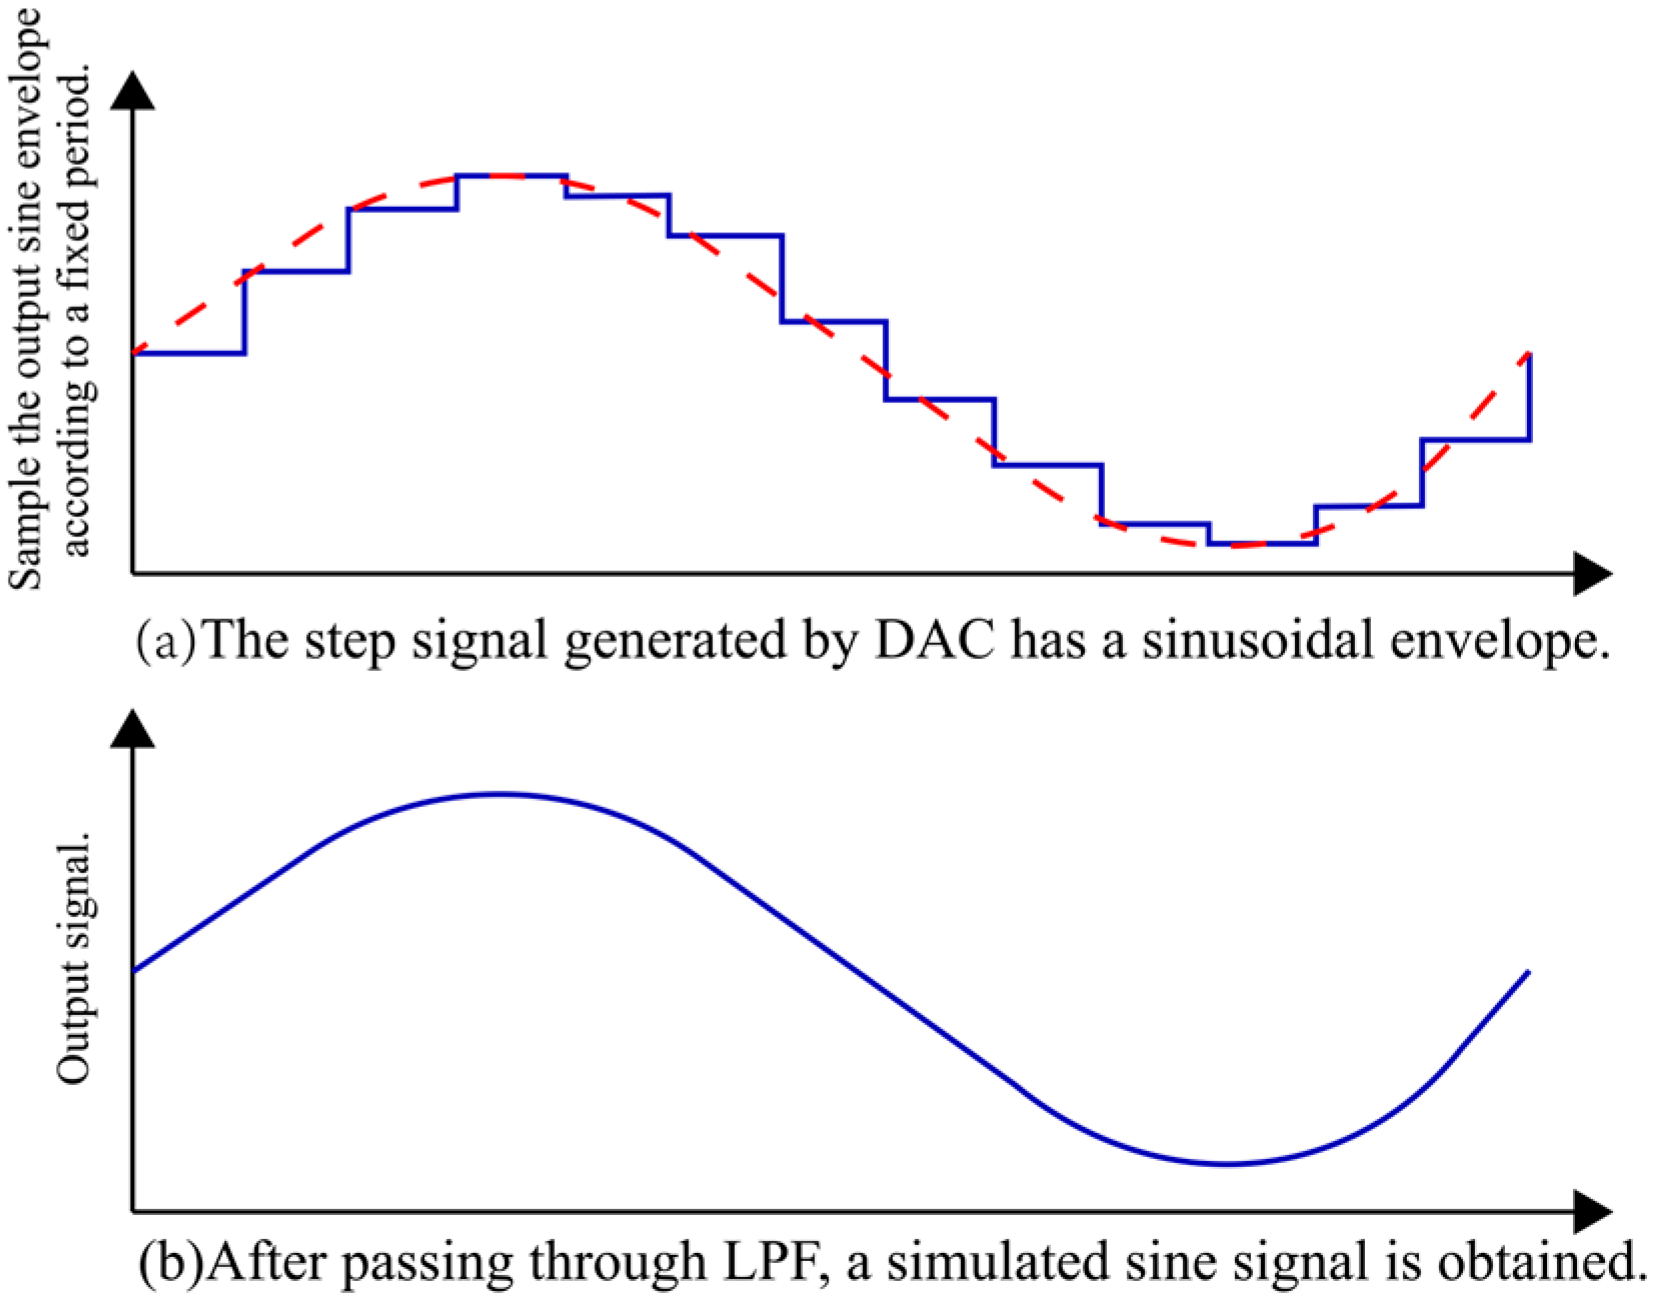
3.2. Signal Generation Circuit

The signal generation circuitry necessitates the precise production of signals with a defined frequency and phase; thus, the design is centered around the AD9910 from Analog Devices, Inc., a company headquartered in Norwood, MA, USA. The AD9910 is a direct digital frequency synthesizer with an integrated 14-bit DAC. Owing to the DDS core frequency of 1 GHz, the chip includes a phase-locked loop (PLL), allowing for the multiplication of the external clock signal [26]. The system employs a 40 MHz active crystal oscillator, activates the internal PLL, and multiplies the external clock by a factor of 25, thereby providing a 1 GHz clock signal to the DDS core. At a sampling rate of 1 GSPS, the device’s tuning resolution can reach 0.23 Hz. To ensure the stable operation of the analog power supply, the 40 MHz active crystal utilizes a digital 3.3 V power source to prevent excessive leakage of the crystal signal into the analog 3.3 V power supply.
The AD9910 receives waveform and control parameters from the main controller via the SPI interface. Based on these parameters, it configures its internal frequency control word, phase control word, and amplitude control word. Utilizing its built-in 1024-point lookup table, the AD9910 effectively controls the signal’s frequency, phase, and amplitude. Ultimately, it generates a high-precision excitation signal, which is output through its analog output port, IOUT.
The signal output by AD9910 carries a large number of high-frequency harmonics, which need to be filtered [27]. A 7th-order passive Butterworth low-pass filter is designed at the channel output of each channel. Considering that the maximum frequency of the excitation signal is 400 kHz, a certain margin needs to be reserved, so the −3 dB bandwidth of the filter is set to 2 MHz. The circuit design of the filter consists of two L-type filters and a pi-type filter as shown in Figure 2.
According to the L-filter cutoff frequency calculation formula:
f c L 1 = 1 2 π L 1 C 1 1 + C 1 2
f c L 2 = 1 2 π L 3 C 4 1 + C 4 2
And pi-type filter cutoff frequency calculation formula:
f c p i = 1 2 π L 2 C 2 1 + C 2 2 C 3 1 + C 3 2 C 2 1 + C 2 2 + C 3 1 + C 3 2
where L 1 , L 2 , and L 3 denote the inductance values of the inductors; C 1 1 , C 1 2 , C 2 1 , C 2 2 , C 3 1 , C 3 2 , C 4 1 , and C 4 2 denote the capacitance values of the capacitors. The amplitude-frequency characteristic curve of the filter circuit is obtained by calculation as shown in Figure 3, and the design meets the requirements.

3.3. Power Amplifier Circuit

The signal amplitude output by the DDS is relatively low, approximately 800 mV, which is insufficient to drive piezoelectric ceramic transducers that require a minimum driving voltage of over 60 V. Consequently, to meet the design objectives, signal amplification is necessary [28]. The present study selects the high-voltage integrated operational amplifier PA85 from APEX Microtechnology, USA, with its headquarters located in Tucson, Arizona. The PA85 features a wide power supply voltage range and a high degree of circuit integration. In accordance with the system’s requirements, the signal output amplitude is set at 90 V, and the slew rate (SR) is calculated using the following formula:
S R = 2 π f m a x V
where f m a x is the maximum frequency and V is the output amplitude. When the maximum unattenuated frequency is taken as 400 kHz, it is calculated that the pressure-swing rate needs to be 226 V/us. Referring to the PA85 frequency response curve and the pressure-swing rate curve graph [29], as shown in Figure 4, when the compensation capacitor Cc is taken as 3.3 pf, the voltage swing rate still has 700 V/us, which meets the system requirements.
The high-voltage amplifier circuit design is shown in Figure 5. D1, D2, D3, and D4 are input protection diodes, which can effectively clamp the input signal and protect the input to prevent the internal devices of the amplifier from being damaged by excessive input voltage; D5 and D6 are two fast recovery diodes, which protect the output of the op-amp, and the reverse withstand voltage value reaches two times the power supply voltage, to prevent the sudden change of the load current from generating a large return voltage peak at the output. RCL is a current-limiting resistor, and
R C L = 700 I L i m × 10 3 16
where I L i m is the limiting current. The current is limited to 165 mA using a 4.7 Ω current-limiting resistor RCL.
The output result of the amplifier circuit is shown in Figure 6. From Figure 6, it can be seen that the maximum 400 kHz output signal basically reaches 90 Vpp, which conforms to the frequency response curve and meets the design requirements.

3.4. Impedance Matching Circuit

The impedance matching circuit is depicted in Figure 7, where Figure 7a represents the T-type matching circuit. The dashed box within the figure illustrates the transducer’s equivalent circuit, which can be equivalently viewed as a static capacitance C 0 in series with a branch [30]. Typically, the impedance characteristic of this configuration exhibits capacitive behavior. According to the operating principle of the transducer, when it is in the working state, the dynamic inductance and dynamic capacitance within the series branch cancel each other out. Consequently, it can be equivalently regarded as a static capacitance C 0 in parallel with a dynamic resistance R m , as shown within the dashed box of the transducer’s equivalent circuit in Figure 7b. This implies that within the operating frequency band, the impedance characteristic of the transducer is predominantly resistive. The impedance characteristics of the transducer lead to an increase in the system’s reactive power. Input impedance matching can improve the flatness of the gain, thus necessitating impedance matching between the amplification circuit and the transducer.
In this study, a T-type circuit is used to counteract the effect of capacitive impedance, and two series inductors L 1 and L 0 are placed at the transducer end and a capacitor C 1 is connected in parallel to form a two-stage impedance matching network. When the transducer is in operation, the overall impedance of the series resonant branch is Z 1 :
Z 1 = R 1 + j X 1 = j ω L 0 + 1 1 R m + j ω C 0
In the formula:
R 1 = R m 1 + ω 2 C 0 2 R m 2
X 1 = ω L 0 ω C 0 R m 2 1 + ω 2 C 0 2 R m 2
For the transducer to be in resonance, the imaginary part of the impedance needs to become 0. Then we have:
ω L 0 ω C 0 R m 2 1 + ω 2 C 0 2 R m 2 = 0
At this point the angular frequency ω is:
ω = 1 L m C m
From this, the size of the required series inductance L 0 can be calculated as:
L 0 = C 0 R m 2 1 + ω 2 C 0 2 R m 2
The impedance Z2 of the second-stage match is:
Z 2 = R m 1 + ω 2 C 0 2 R m 2
By the same reasoning, one can obtain L1 as:
L 1 = C 1 Z 2 2 1 + ω 2 C 1 2 Z 2 2
The final equivalent impedance Z3 is:
Z 3 = Z 1 1 + Z 1 ω C 1 2
In accordance with the manufacturer’s recommendations, to protect the piezoelectric ceramics, the operating frequency of the piezoelectric ceramics should be as little as possible greater than 1/3 of the resonant frequency, taking C1 = 1 nF.

3.5. Signal Acquisition Module

The signal acquisition module employs an STM32 as the main controller chip. It uses a preamplifier circuit to amplify the weak echo signals collected, thereby improving signal quality. The amplified signals are then converted from analog to digital form using an ADC. The main controller chip transmits the converted digital signals to the host computer via a serial interface.

4. Software Design

4.1. Host Computer Design

The host computer control program presented in this study is designed based on the MATLAB GUI, incorporating a layout of controls that includes selection of serial ports, serial port configuration, signal parameter transmission, and a waveform display panel. By utilizing the callback functions of these controls, the MATLAB code is interfaced with the user interface elements. The host computer communicates with the system’s main controller via RS485, primarily facilitating human-machine interaction functions such as signal windowing, excitation signal cycle selection (including commonly used cycles of 5, 10, and 15), output signal frequency, output signal amplitude, and channel selection. Additionally, it is capable of filtering the received echo signals.
Upon detecting a serial port connection, the host computer program initializes and awaits the user’s completion of relevant parameter settings before executing transmission commands. When the host computer receives echo signals from pipeline inspection, it employs an adaptive wavelet threshold function for denoising, subsequently saving and displaying the data.

4.2. Adaptive Wavelet Thresholding Denoising

The traditional wavelet threshold denoising process is as follows: first, select the appropriate wavelet threshold function and the maximum number of wavelet decomposition layers for the collected echo signal, and calculate the wavelet coefficients of each layer according to the wavelet threshold function; second, quantize the traditional threshold function and calculate the estimated wavelet coefficients; finally, recombine the decomposed signals through the wavelet coefficients and the estimated wavelet coefficients of each layer to obtain the processed signals to realize the noise reduction processing [31]. The more common wavelet threshold functions are the hard threshold function and the soft threshold function. Among them, the expression of the hard threshold function is:
y j , k = ω j , k ,         ω j , k > λ 0 ,                 ω j , k λ
where y j , k is the processed wavelet coefficient, ω j , k is the original wavelet coefficient, and λ is the threshold. The hard threshold function can directly remove the noise components for wavelet coefficients less than the threshold, and the denoising effect is direct and obvious. However, the hard threshold function is not continuous at the threshold, which easily leads to discontinuities in the reconstructed signal, generating oscillations and affecting the signal quality. The expression of the soft threshold function is:
y j , k = s g n ω j , k × ω j , k λ ,         ω j , k > λ 0 ,                                                                                 ω j , k λ
where s g n is the sign function, which takes the sign value for the original wavelet coefficients ω j , k . The soft threshold function provides a smooth transition when dealing with wavelet coefficients and avoids the discontinuity problem of the hard threshold function, but the soft threshold function may not be able to meet the requirements for noise when the threshold value is taken irrationally. Donoho and Johnstone [32] proposed a fixed threshold value λ :
λ = δ × 2 ln N
where δ is the standardized variance value in the wavelet coefficients and N is the sampling length of the signal with noise. If the same threshold is used for denoising on different decomposition scales, many wavelet coefficients below the threshold will inevitably be removed, and the noise coefficients will become smaller and smaller as the number of decomposition layers increases, so the thresholds for different layers need to be able to adaptively follow the wavelet decomposition scales to increase and decrease. In this study, Bayesian thresholding is used for noise threshold acquisition, and the threshold expression is:
λ j = δ 2 δ x
where δ 2 is the noise variance, δ x is the standard deviation of the subband coefficients, and j represents one of the layers in the stratification. δ 2 is computed in this study using the estimate proposed by Donoho and Johnstone:
δ ¯ = m e d i a n y j , k 0.6745
where m e d i a n is the median function, and again:
δ ¯ = 1 n i = 1 n y 2 j , k
where n identifies the length of the decomposed wavelet coefficients at each layer. The wavelet coefficients are then calculated from:
δ ¯ x = max δ ¯ y 2 δ 2 , 0
It can be learned that Bayesian thresholds are able to self-adjust at different layers, overcoming the disadvantage of fixed thresholds.
Considering the soft and hard threshold functions as odd functions and combining the above two proposed threshold function ideas, this study adopts an adaptive wavelet threshold function with the expression:
y j , k = s g n ω j , k × ω j , k λ 1 α × α ω j , k 2 λ 2 ,                 ω j , k > λ s g n ω j , k × α 1 + α × e 10 × ω j , k λ × ω j , k ,                 ω j , k λ
where α is the adjustment factor. The whole function has two adjustment parameters λ and α . The simulation results of wavelet threshold denoising are shown in Figure 8, from which it can be seen that the wavelet threshold denoising algorithm is able to filter out the noise in the input signal very well, making the output signal as close as possible to the desired signal.

4.3. Butterfly Optimization Algorithm

In the above wavelet threshold function denoising, it is necessary to find the optimal values of the two regulation parameters λ and α in the function, which are used to improve the denoising effect of the threshold function. In this study, the Butterfly Optimization Algorithm (BOA) is used as a tool to find the optimal regulation parameters. Butterflies are insects that are widely distributed across the globe. They use the senses of smell, sight, taste, touch, and hearing to find food and for courtship; these senses also help in butterfly location migration. The most important of all the senses is the sense of smell that helps the butterflies to locate food and mates quickly. Butterfly optimization algorithms are the algorithms that simulate the butterfly’s foraging and courtship behavior to achieve a solution to the objective problem [33].
An individual butterfly acts as a search agent for the BOA, and it produces a scent that correlates with the strength of its adaptation, that is, when the butterfly’s position changes, its adaptation also changes. When the butterfly is able to sense the scent of other butterflies, it will move towards the butterfly with the largest scent, a phase known as global search. On the contrary, when the butterfly is unable to sense the scent of other butterflies, it will move randomly, and this phase is called local search. During the search process, the global search and local search are switched by switching the probability p . The output signal-to-noise ratio (SNR) of the echo signal after filtering is used as a fitness function, and SNR represents the logarithmic value of the power ratio between the power of the denoised output signal and the power ratio between the noisy signal and the difference of the output signal:
S N R = 10 l o g 10 i = 1 N x i 2 i = 1 N y i x i 2
where x i represents the denoised signal, y i represents the input signal with noise, and N represents the length of the input signal. The amount of aroma perception is an important reference quantity for BOA, which is calculated as:
f B O A = c t I α
where f B O A is the amount of scent perception, the concentration of scent that the butterfly can sense; c is the sensory modality, which takes the value of 0.01; t is the t -th iteration; I is the stimulus intensity; and α is the power exponent, which takes the value of 0.1. To improve the spatial coverage, a random number r was generated between [0, 1]. A global search was performed when r < p , and the butterflies were clustered towards the individual with the strongest fragrance, and the global search was calculated by the formula:
x i t + 1 = x i t + r 2 g x i t f B O A
When r p , a local search is performed and the butterfly moves randomly, which is given by:
x i t + 1 = x i t + r 2 x j t x k t f B O A
In Equations (25) and (26), the transition probability p is taken as 0.8, x i t , x j t , and x k t denote the positions corresponding to the i -th, j -th, and k -th butterfly individuals of the population in the t -th generation; and g is the best butterfly position in the population. The fitness of each butterfly location is calculated after the position update, and the optimal position is updated. It is judged whether the butterfly optimization algorithm reaches the maximum number of iterations N i t e r , if it meets the end conditions, then the algorithm ends, outputs the optimal solution, obtains the optimal tuning parameter values, and substitutes them into the improved threshold function combined with the Bayesian threshold for denoising, and then reconstructs the wavelet coefficients after the denoising to obtain the final output of the filtered echo signal.
The comparison between the improved wavelet threshold function and the conventional soft and hard threshold function curves is illustrated in Figure 9. As can be observed from Figure 9, the enhanced threshold function more effectively discriminates between signal and noise. It retains a greater portion of the useful signal content while removing a more substantial amount of noise. Moreover, it remains continuous at the threshold, overcoming the drawback of oscillations at the threshold point that is characteristic of the hard threshold function.

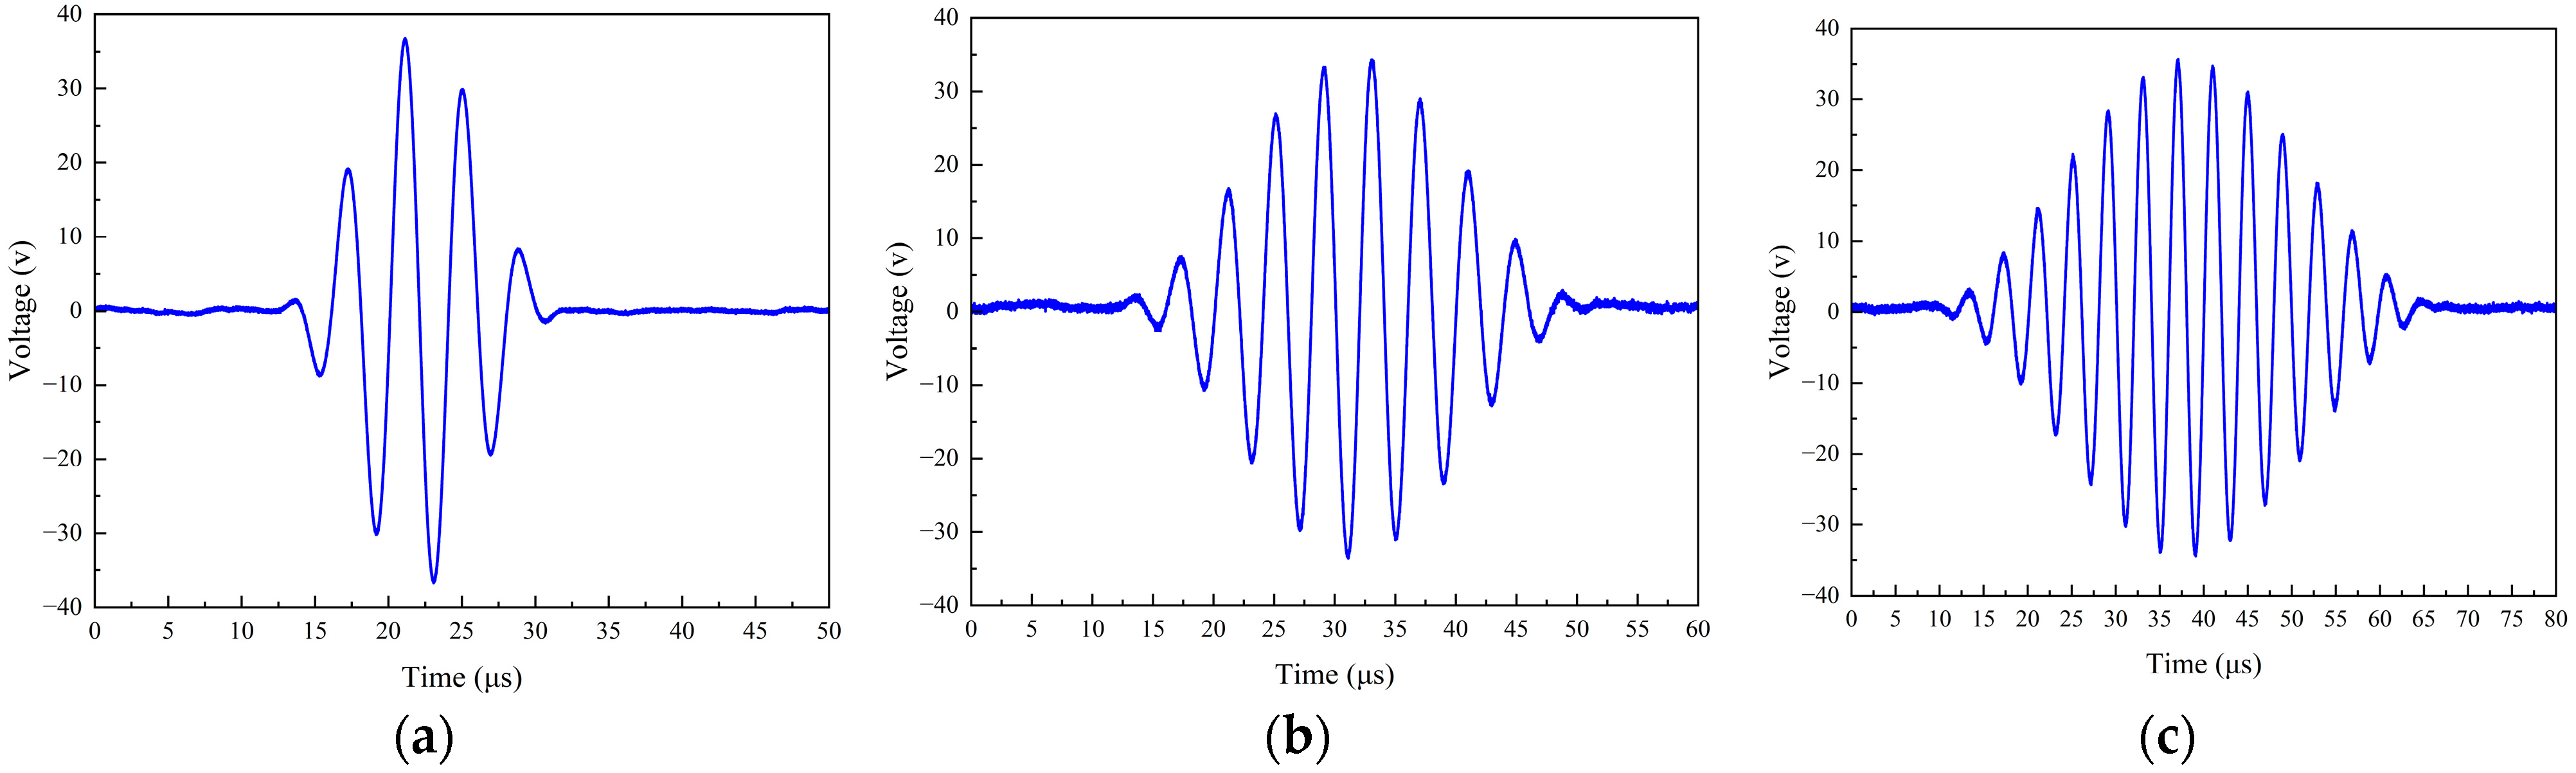
4.4. Waveform Synthesis Design

The synthesis of the excitation signal waveform is predicated on DDS technology. This technology operates on the inverse process of the time-domain sampling theorem [34], sampling and quantizing the analog signal, then storing the quantized waveform data in a RAM table. The waveform data are outputted by table lookup, followed by the generation of discrete voltage points through a high-speed DAC, thereby producing an analog signal. The working principle of DDS technology, as illustrated in Figure 10, hinges on the phase accumulator. Under the driving clock, the adder combines the frequency control word with the phase data output from the phase register, then feeds the sum back into the input of the phase accumulator. This process enables the adder to continue adding the frequency control word under the subsequent driving clock, achieving linear accumulation in the phase accumulator. Once the accumulator’s sum reaches full scale, it overflows, completing an action cycle. This cycle corresponds to a frequency cycle of the synthesized waveform signal, which is then converted from a series of digital signals into an analog signal output through a digital-to-analog converter [35].
The Nyquist Sampling Theorem stipulates that the sampling frequency must be at least twice the highest frequency component to allow for the discrete signal obtained post-sampling to reconstruct the original signal without distortion [36]. Therefore, in DDS signal synthesis, if the sampling rate of the DAC is denoted as Fs, the highest frequency of the analog signal that can be generated is Fs/2. The DAC produces a step-like analog signal, which, when passed through a low-pass filter for smoothing, yields an ideal analog signal. This process is schematically represented in Figure 11. DDS does not sample the analog signal; instead, it operates under the assumption that the sampling process has already occurred and the signal has been quantized. Subsequently, the quantized values are mapped and sent to the DAC and the subsequent low-pass filter (LPF) to reconstruct the original signal.
The excitation signal utilized in this study is a sinusoidal signal modulated by a Hanning window, with the expression given by:
H a n n i n g n = 1 2 + 1 2 cos 2 π n M 1 , 0 n M 1 0 , e l s e  
where n = 1 ,   2 ,   3 , ,   N 1 , N denotes the total length of the window function, and M denotes the effective length of the window function. The 1024-bit data points generated from the waveform data with different numbers of cycles are saved into the RAM of AD9910, which is used as the amplitude lookup table of the waveform output. A 32-bit phase accumulator is constructed, and the phase accumulator is used as the address of the waveform RAM to output the waveform amplitude corresponding to the amplitude lookup table in the RAM by addressing. The phase accumulator accumulates at each clock, and the amount of accumulation is determined by the frequency control word. The output frequency of the waveform is changed by changing the frequency control word. The output frequency of the DDS module is:
f o u t = M × f c l k 2 N
where f c l k is the system drive clock frequency, N is the number of phase accumulator bits, and M is the frequency control word.
The AD9910 is equipped with both serial and parallel interfaces, each responsible for distinct content and capable of executing different functions. This study necessitates the use of the AD9910 to generate an excitation signal with adjustable frequency, amplitude, and phase; hence, the serial interface is primarily employed. The serial interface provided by the AD9910 is a four-wire SPI interface. The four wires of the SPI interface comprise the CS chip select signal, SCLK clock line, SDI data input line, and SDO data output line. The SCLK clock line is controlled by the master device, with no control over the signal line by the slave device. Additionally, the serial interface control of the chip includes the I/O_UPDATE. After data are input into the chip, they are temporarily stored in a buffer awaiting the I/O update signal. When a high pulse is generated on this pin, the data in the buffer are written into the DDS core, resulting in corresponding changes in the output signal. The I/O update is effective on the rising edge, with the high-level duration being no less than one system clock cycle. At a 1 GHz main frequency, this duration is 1 ns. The timing of this communication method is illustrated in Figure 12.
The SPI interface, employing a four-wire configuration, operates with the rising edge of the clock signal as the effective trigger. For the AD9910 chip, the setup and hold time is required to be no less than 1.75 ns. Given that the maximum I/O speed of the main controller is 72 MHz, even when the main controller operates at full speed, its I/O rate sufficiently meets the requirements of the AD9910. The SPI communication protocol encompasses several components, including the initiation signal, address transmission, data transmission, and the termination signal. Additionally, for the AD9910, it also includes a data update signal. The initial step in the program involves setting the chip select signal to low, followed by transmitting an 8-bit register address. Upon completion of the address transmission, data of ‘length’ size are sent. Once the data transmission is concluded, the chip select signal is raised, thereby completing the writing process for a register.

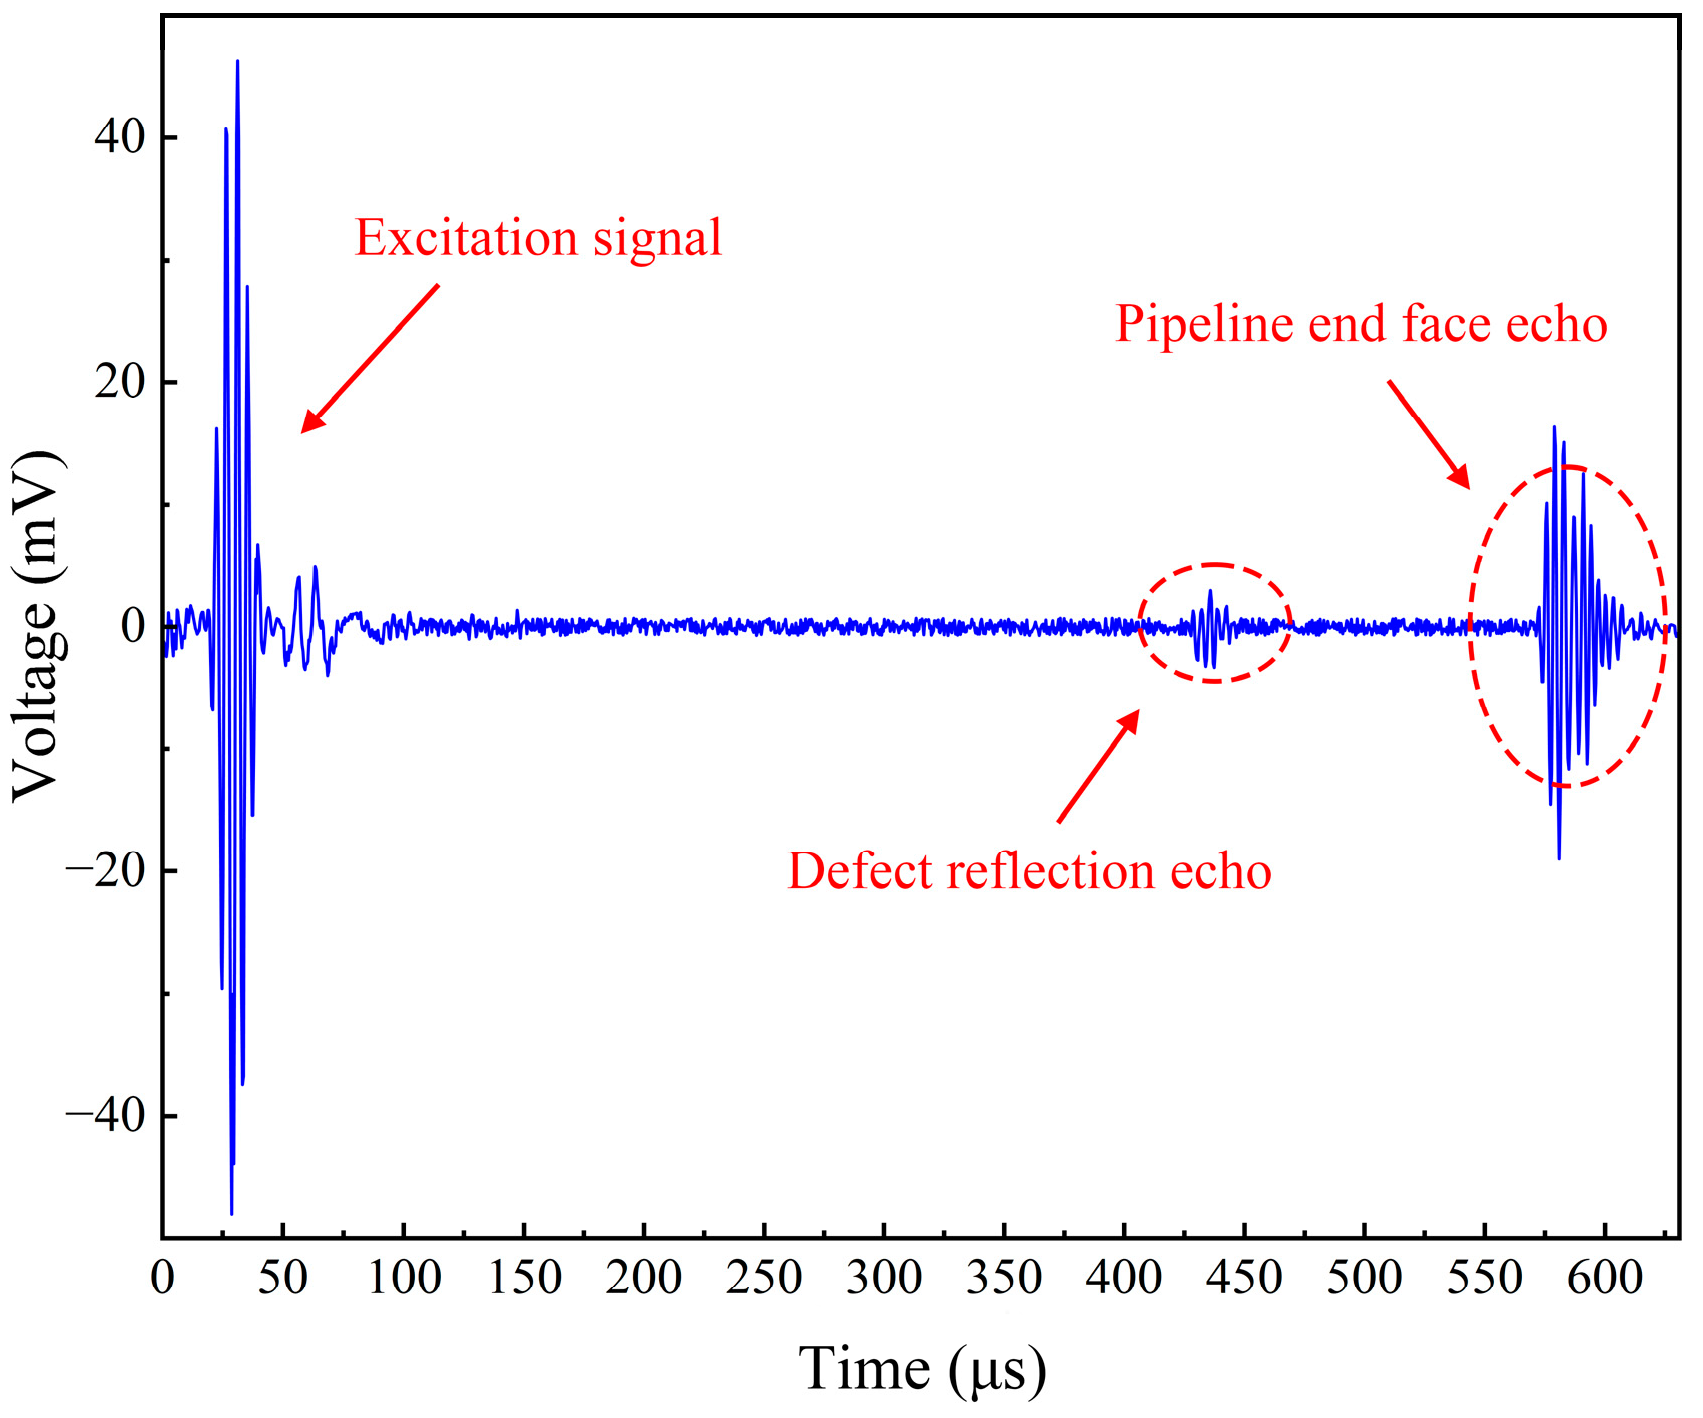
5. Experimental Validation

To validate the feasibility and practical efficacy of the design proposed in this study, experimental verification was conducted. The assembly of the system is depicted in Figure 13a. This experiment was carried out in collaboration with the research group led by Professor Zhao Dong Xu at the School of Civil Engineering, Southeast University. Due to the involvement of the piezoelectric ceramic transducer array ring in other related projects of the research group, the pipeline section of this experiment is represented using a schematic diagram. The schematic illustration of the experimental pipeline is shown in Figure 13b. A 6-inch steel pipeline, measuring 4 m in length with a wall thickness of 10 mm, was utilized. The piezoelectric ceramic transducer array ring was positioned at one end face of the pipeline, and the pipeline damage was set at a distance of 3 m from the array ring.
The signal excitation module was subjected to an isolated test to verify the functionality of its various settings. This was conducted without the use of the piezoelectric transducer array ring, directly capturing the output signals from the signal excitation module. The test results demonstrated that the system could output excitation signals at a consistent frequency of 250 kHz with varying numbers of cycles, as illustrated in Figure 14.
The test results indicate that the system is capable of accurately outputting excitation signals with varying cycle counts. The system’s ability to emit excitation signals of the same cycle count (5 cycles) at different frequencies is demonstrated in Figure 15. The results also confirm that the system can alter the frequency of the output signal, with a maximum frequency reaching up to 400 kHz, fulfilling the design specifications.
In summary, the experimental results demonstrate that the system can output the specified excitation signals in accordance with the requirements, with all parameters meeting the criteria and the waveforms being complete.
Further experiments were conducted on the pipeline to detect defects. The excitation signal employed was a 5-cycle signal with a frequency of 250 kHz. The system’s signal acquisition module was used to collect the detection echoes, which are displayed in Figure 16. The figure clearly shows the excitation signal, the defect echo, and the pipeline end-face echo.
The filtered results of the echo signals are presented in Figure 17. As can be observed from the figure, the damage signals within the echo signals have been well-preserved, while the unrelated noise has been significantly attenuated, achieving a satisfactory filtering effect. The adaptive wavelet threshold function utilized in this study decomposes the signal through wavelet transformation and then processes the coefficients using an adaptive threshold, thereby enhancing the signal characteristics and facilitating easier analysis and identification. The filtering effect achieved ultimately meets the design requirements and supports accurate analysis and damage identification.

6. Conclusions

The present study has designed an ultrasonic guided wave pipeline NDT system based on an adaptive wavelet threshold denoising algorithm. Characterized by its low cost and low power consumption, this system enables flexible adjustment of the excitation period and frequency through a host computer, allowing for the selection of different excitation parameters under various testing conditions. This not only ensures the reliability of the signal but also enhances the flexibility of the experiment. To achieve a sufficiently high excitation voltage, the study has implemented signal power amplification, utilized tuned capacitors for signal impedance matching, and directly driven piezoelectric ceramic transducers for the electro-acoustic conversion of signals. Additionally, a wavelet threshold function is employed within the host computer to process the echo signals from pipeline inspections. To address the shortcomings of the soft and hard threshold functions in wavelet denoising, a novel adaptive threshold function has been adopted. Furthermore, to determine the optimal values of the two adjustment parameters within the threshold function, the study integrates the Butterfly Optimization Algorithm to optimize parameter selection, thereby further enhancing the denoising performance. This effectively extracts useful signal characteristics from noise, thereby enhancing the identification capability of pipeline damage. The experimental test results of this study demonstrate that the ultrasonic guided wave NDT system exhibits low cost, low power consumption, and high reliability. Coupled with signal acquisition equipment and filtering algorithms, it is capable of detecting pipeline defects, fully meeting the design requirements.

Author Contributions

Conceptualization, Y.-Q.G. and S.-Y.H.; methodology, Y.-Q.G.; software, S.-Y.H. and X.-L.Z.; validation, Y.-Q.G., Z.-D.X. and S.-Y.H.; formal analysis, Y.-Q.G., X.-L.Z. and S.-Y.H.; investigation, S.-Y.H.; resources, Y.-Q.G. and Z.-D.X.; data curation, S.-Y.H. and X.-L.Z.; writing—original draft preparation, Y.-Q.G. and S.-Y.H.; writing—review and editing, Y.-Q.G. and S.-Y.H.; visualization, Y.-Q.G. and S.-Y.H.; supervision, Y.-Q.G.; project administration, Y.-Q.G.; funding acquisition, Z.-D.X. All authors have read and agreed to the published version of the manuscript.

Funding

This research was funded by Major Project of Fundamental Research on Frontier Leading Technology of Jiangsu Province (NO. BK20222006) and the Basic Science (Natural Science) Research General Projects in Higher Education Institutions of Jiangsu Province (grant number: 23KJB130007).

Institutional Review Board Statement

Not applicable.

Informed Consent Statement

Not applicable.

Data Availability Statement

Data are contained within the article.

Conflicts of Interest

The authors declare no conflicts of interest.

References

  1. Waqar, M.; Memon, A.M.; Sabih, M.; Alhems, L.M. Composite Pipelines: Analyzing Defects and Advancements in Non-Destructive Testing Techniques. Eng. Fail. Anal. 2024, 157, 107914. [Google Scholar] [CrossRef]
  2. Xia, X.; Wu, D.; Yang, F.; Hu, M.; Ma, L.; Li, M.; Dong, X.; Duan, Z. Early Underground Pipeline Collapse Detection and Optimization Based on Water Hammer Vibration Signal. Int. J. Press. Vessel. Pip. 2023, 206, 105045. [Google Scholar] [CrossRef]
  3. Liu, B.; Tian, R.; Yu, H.; He, L.; Yang, L.; Wang, F.; Geng, H.; Tian, Y. Research on the Characteristics of Weak Magnetic Internal Detection Signals for Critical Damage in Pipeline Stress Based on Density Functional Theory. Eng. Fail. Anal. 2024, 159, 108145. [Google Scholar] [CrossRef]
  4. Banjara, N.K.; Sasmal, S.; Kapuria, S. Fatigue and Leakage-Type Damage Detection in Metallic Plates and Pipelines Using Piezoelectric Patch Acoustic Sensors. Int. J. Press. Vessel. Pip. 2024, 209, 105162. [Google Scholar] [CrossRef]
  5. Gusev, B.V.; Fedotov, M.Y.; Leshchenko, V.V.; Lepikhin, A.M.; Makhutov, N.A.; Budadin, O.N. Nondestructive Testing of Offshore Subsea Pipelines and Calculation Substantiation of Their Safety According to Risk Criteria. Chem. Pet. Eng. 2023, 58, 776–787. [Google Scholar] [CrossRef]
  6. Tian, Y.; Yang, S.; Zhang, R.; Tian, J.; Li, X. State of Charge Estimation of Lithium-Ion Batteries Based on Ultrasonic Guided Waves by Chirped Signal Excitation. J. Energy Storage 2024, 84, 110897. [Google Scholar] [CrossRef]
  7. Yue, J.; Hong, X.; Zhang, B. A Damage Imaging Method Based on Particle Swarm Optimization for Composites Nondestructive Testing Using Ultrasonic Guided Waves. Appl. Acoust. 2024, 218, 109878. [Google Scholar] [CrossRef]
  8. Tang, B.; Wang, Y.; Chen, A.; Zhao, Y.; Xu, J. Split-Spectrum Processing with Raised Cosine Filters of Constant Frequency-to-Bandwidth Ratio for L(0,2) Ultrasonic Guided Wave Testing in a Pipeline. Appl. Sci. 2022, 12, 7611. [Google Scholar] [CrossRef]
  9. Hong, X.; Zhang, B.; Liu, Y.; Qi, H.; Li, W. Deep-Learning-Based Guided Wave Detection for Liquid-Level State in Porcelain Bushing Type Terminal. Struct. Control Health Monit. 2021, 28, e2651. [Google Scholar] [CrossRef]
  10. Zang, X.; Xu, Z.-D.; Lu, H.; Zhu, C.; Zhang, Z. Ultrasonic Guided Wave Techniques and Applications in Pipeline Defect Detection: A Review. Int. J. Press. Vessel. Pip. 2023, 206, 105033. [Google Scholar] [CrossRef]
  11. Du, C.; Li, X.; Liu, C.; Song, C.; Yuan, J.; Xin, Y. Combining Ultrasonic Guided Wave and Low-Frequency Electromagnetic Technology for Defect Detection in High-Temperature Cr–Ni Alloy Furnace Tubes. Sci. Rep. 2023, 13, 18592. [Google Scholar] [CrossRef] [PubMed]
  12. Yuan, Y.; Virupakshappa, K.; Oruklu, E. FPGA Implementation of an Ultrasonic Flaw Detection Algorithm Based on Convolutional Neural Networks. J. Signal Process. Syst. 2022, 94, 1447–1457. [Google Scholar] [CrossRef]
  13. Lyu, Y.; Hong, H.; Song, G.; He, C. A Simplified Integration of Multi-Channel Ultrasonic Guided Wave System for Phased Array Detection and Total Focusing Imaging. Int. J. Acoust. Vib. 2021, 26, 104–109. [Google Scholar] [CrossRef]
  14. He, J.; Zhou, C.; Yang, L.; Sun, X. Research on Pipeline Damage Imaging Technology Based on Ultrasonic Guided Waves. Shock Vib. 2019, 2019, 1470761. [Google Scholar] [CrossRef]
  15. Song, Z.; Qi, X.; Liu, Z.; Ma, H. Experimental Study of Guided Wave Propagation and Damage Detection in Large Diameter Pipe Filled by Different Fluids. NDT E Int. 2018, 93, 78–85. [Google Scholar] [CrossRef]
  16. Zhang, H.; Teng, F.; Wei, J.; Lv, S.; Zhang, L.; Zhang, F.; Jiang, M. Damage Location Method of Pipeline Structure by Ultrasonic Guided Wave Based on Probability Fusion. IEEE Trans. Instrum. Meas. 2024, 73, 9504914. [Google Scholar] [CrossRef]
  17. Abbassi, A.; Römgens, N.; Tritschel, F.F.; Penner, N.; Rolfes, R. Evaluation of Machine Learning Techniques for Structural Health Monitoring Using Ultrasonic Guided Waves under Varying Temperature Conditions. Struct. Health Monit. 2023, 22, 1308–1325. [Google Scholar] [CrossRef]
  18. Tiwari, K.A.; Raisutis, R.; Tumsys, O.; Ostreika, A.; Jankauskas, K.; Jakutavicius, J. Defect Estimation in Non-Destructive Testing of Composites by Ultrasonic Guided Waves and Image Processing. Electronics 2019, 8, 315. [Google Scholar] [CrossRef]
  19. Xu, Z.-D.; Zhu, C.; Shao, L.-W. Damage Identification of Pipeline Based on Ultrasonic Guided Wave and Wavelet Denoising. J. Pipeline Syst. Eng. Pract. 2021, 12, 04021051. [Google Scholar] [CrossRef]
  20. Chang, Y.; Zi, Y.; Zhao, J.; Yang, Z.; He, W.; Sun, H. An Adaptive Sparse Deconvolution Method for Distinguishing the Overlapping Echoes of Ultrasonic Guided Waves for Pipeline Crack Inspection. Meas. Sci. Technol. 2017, 28, 035002. [Google Scholar] [CrossRef]
  21. Ling, E.H.; Abdul Rahim, R.H. A Review on Ultrasonic Guided Wave Technology. Aust. J. Mech. Eng. 2020, 18, 32–44. [Google Scholar] [CrossRef]
  22. Da, Y.; Dong, G.; Shang, Y.; Wang, B.; Liu, D.; Qian, Z. Circumferential Defect Detection Using Ultrasonic Guided Waves: An Efficient Quantitative Technique for Pipeline Inspection. Eng. Comput. 2020, 37, 1923–1943. [Google Scholar] [CrossRef]
  23. Rathod, V.T. A Review of Electric Impedance Matching Techniques for Piezoelectric Sensors, Actuators and Transducers. Electronics 2019, 8, 169. [Google Scholar] [CrossRef]
  24. Wang, H.; Wu, B.; Gao, X.; Liu, Y.; Li, X.; Liu, X. Ultrasonic Guided Wave Defect Detection Method for Tank Bottom Plate Based on SH0 Mode Multichannel Magnetostrictive Sensor. Measurement 2023, 223, 113790. [Google Scholar] [CrossRef]
  25. Pikuleva, N.I.; Khafizova, A.S.; Gornaev, A.D. System for Updating the Program Code of STM32 Microcontrollers Based on a Composite USB Device. In Proceedings of the 2022 International Conference on Industrial Engineering, Applications and Manufacturing (ICIEAM), Sochi, Russia, 16 May 2022; pp. 813–818. [Google Scholar]
  26. Du, Y.H.; Ouyang, Q.R. Fast Frequency Hopping Signal Generator Based on DDS. Adv. Mater. Res. 2011, 142, 162–165. [Google Scholar] [CrossRef]
  27. Li, J.; Tan, Q.L.; Yu, H.Y.; Zhou, Z.; Li, J.M.; Cui, Y.J. Design of the Circuit for FSK Modulation Based on AD9910. Appl. Mech. Mater. 2011, 58–60, 2664–2669. [Google Scholar] [CrossRef]
  28. Minase, J.; Lu, T.-F.; Cazzolato, B.; Grainger, S. A Review, Supported by Experimental Results, of Voltage, Charge and Capacitor Insertion Method for Driving Piezoelectric Actuators. Precis. Eng. 2010, 34, 692–700. [Google Scholar] [CrossRef]
  29. Andany, S.H.; Nievergelt, A.P.; Kangül, M.; Ziegler, D.; Fantner, G.E. A High-Bandwidth Voltage Amplifier for Driving Piezoelectric Actuators in High-Speed Atomic Force Microscopy. Rev. Sci. Instrum. 2023, 94, 093703. [Google Scholar] [CrossRef]
  30. Rathod, V.T. A Review of Acoustic Impedance Matching Techniques for Piezoelectric Sensors and Transducers. Sensors 2020, 20, 4051. [Google Scholar] [CrossRef]
  31. Halidou, A.; Mohamadou, Y.; Ari, A.A.A.; Zacko, E.J.G. Review of Wavelet Denoising Algorithms. Multimed. Tools Appl. 2023, 82, 41539–41569. [Google Scholar] [CrossRef]
  32. Donoho, D.L. De-Noising by Soft-Thresholding. IEEE Trans. Inf. Theory 1995, 41, 613–627. [Google Scholar] [CrossRef]
  33. Arora, S.; Singh, S. Butterfly Optimization Algorithm: A Novel Approach for Global Optimization. Soft Comput. 2019, 23, 715–734. [Google Scholar] [CrossRef]
  34. Zhou, Z.; La Rue, G.S. A 12-Bit Nonlinear DAC for Direct Digital Frequency Synthesis. IEEE Trans. Circuits Syst. I Regul. Pap. 2008, 55, 2459–2468. [Google Scholar] [CrossRef]
  35. Langlois, J.M.P.; Al-Khalili, D. Novel Approach to the Design of Direct Digital Frequency Synthesizers Based on Linear Interpolation. IEEE Trans. Circuits Syst. II Analog. Digit. Signal Process. 2003, 50, 567–578. [Google Scholar] [CrossRef]
  36. Lévesque, L. Nyquist Sampling Theorem: Understanding the Illusion of a Spinning Wheel Captured with a Video Camera. Phys. Educ. 2014, 49, 697. [Google Scholar] [CrossRef]
Figure 1. Overall design plan.
Electronics 13 02536 g001
Figure 2. Filter circuit.
Electronics 13 02536 g002
Figure 3. Amplitude–frequency characteristic curve of filtering circuit.
Electronics 13 02536 g003
Figure 4. PA85 frequency response curve and slew rate curve. (a) PA85 power response; (b) PA85 slew rate.
Electronics 13 02536 g004
Figure 5. PA85 high-voltage amplification circuit.
Electronics 13 02536 g005
Figure 6. Amplification circuit output test results.
Electronics 13 02536 g006
Figure 7. Impedance matching circuit. (a) T-shaped matching circuit; (b) Equivalent model of transducer.
Electronics 13 02536 g007
Figure 8. Simulation results of wavelet threshold denoising.
Electronics 13 02536 g008
Figure 9. Comparison of different threshold function curves.
Electronics 13 02536 g009
Figure 10. Working principle of DDS.
Electronics 13 02536 g010
Figure 11. DDS signal synthesis.
Electronics 13 02536 g011
Figure 12. Four-wire SPI timing diagram.
Electronics 13 02536 g012
Figure 13. Systems for experimental validation. (a) System assembly diagram; (b) Diagram of pipeline defects.
Electronics 13 02536 g013
Figure 14. Excitation signals with different cycle numbers at the same frequency. (a) 5-cycle 250 kHz excitation signal; (b) 10-cycle 250 kHz excitation signal; (c) 15-cycle 250 kHz excitation signal.
Electronics 13 02536 g014
Figure 15. Different frequency excitation signals with the same number of cycles. (a) 5-cycle 100 kHz excitation signal; (b) 5-cycle 200 kHz excitation signal; (c) 5-cycle 300 kHz excitation signal; (d) 5-cycle 400 kHz excitation signal.
Electronics 13 02536 g015
Figure 16. Pipeline defect detection echo signal.
Electronics 13 02536 g016
Figure 17. Echo signal filtering results.
Electronics 13 02536 g017
Table 1. Comparison of different testing methods.
Testing MethodsAdvantagesShortcomings
magnetic particleEasy to operate, low costLimited ability to detect deep defects
infiltrationSuitable for all shapes and materialsEasily corrodes piping
raysVery effective against internal defectsHigh cost and radiation risk to operators
ultrasonic guided waveLong detection distance, no damage to pipesHigh cost and susceptibility to interference
Table 2. Comparison table of parameters for different design options.
Design SchemesComponentMaximum Output FrequencyPower ConsumptionCost
1EP4CE10F17C8N800 MHz5.93 W386¥
2AD9914 + HMC8303.30 GHz4.76 W278¥
3STM32F103 + AD9910420 MHz1.36 W102¥
Disclaimer/Publisher’s Note: The statements, opinions and data contained in all publications are solely those of the individual author(s) and contributor(s) and not of MDPI and/or the editor(s). MDPI and/or the editor(s) disclaim responsibility for any injury to people or property resulting from any ideas, methods, instructions or products referred to in the content.

