1. Introduction
The coronavirus disease 2019 (COVID-19) is a contagious disease caused by the severe acute respiratory syndrome coronavirus 2 (SARS-CoV-2). The disease quickly spread worldwide, resulting in the COVID-19 pandemic. Due to the highly contagious virus, controlling COVID-19’s infection and fatality rates is critically dependent on the successful implementation of public health measures, such as social distancing, isolation, quarantine, and the usage of masks. Isolating symptomatic cases, enforcing lockdowns, maintaining social distancing, and wearing masks have proven to be the most effective measures to curtail viral transmission. While this has become common knowledge, in practical terms, adherence to these measures, due to economic and public compliance factors, is often challenging. Loosening lockdown policies can exacerbate the outbreak, and conversely, strict measures can have economic repercussions.
Different countries have taken various measures in response to the COVID-19 pandemic. The UK had implemented relatively lenient measures in response to the pandemic. While the government enforced restrictions on gatherings and closed certain venues, some individuals disregarded stay-at-home directives. Consequently, the government moderately altered the implemented measures: certain regions were allowed to reopen, leading to suboptimal pandemic control. This resulted in multiple virus mutations, such as variant B.1.1.7. In contrast, China imposed comprehensive lockdown measures, advocating for home isolation and reducing non-essential travel in the first stage. In severely affected areas, the lockdown was enforced to contain further spread. While effectively controlling the outbreak, these measures severely impacted the economy. Despite the varied strategies adopted by different governments, unfavorable outcomes emerged in terms of both the economy and public health. It is a challenging job of balancing the pandemic containment with fostering economic development.
Traditionally, statistical and mathematical models, such as the susceptible–infectious–recovered (SIR) model, have been used to simulate and forecast epidemic trends. Unfortunately, these models often oversimplify the problem domain, failing to account for human behavior, contact patterns, population diversity, and host variation. Additionally, the policy implementation tends to exhibit some lag, and immediate results may not be guaranteed. With the rapid advancement of AI, using Agent-Based Models (ABMs) provides a solution to overcome the limitations of traditional models. ABM is a modeling simulation approach that simulates and analyzes complex systems by modeling individual entities within the system. We built the pandemic simulator based on ABM simulation technologies. The pandemic simulator factors in individual behaviors, interactions, and environmental elements, simulating the spread of epidemics and the effectiveness of control strategies based on these factors. While many have adopted ABMs for the analysis, simplistic simulations often fall short of providing significant assistance in real-world decision making. To enhance the model’s utility, a data-driven approach is adopted that incorporates real-world data to augment the simulations. We employed the deep Q-Network (DQN) method to formulate decisions based on the simulation model. DQN is a form of deep reinforcement learning that navigates decision making in complex environments and optimizes learning through a feedback mechanism. DQN can learn to choose optimal control measures, such as vaccine distribution and social distancing strategies, to minimize infection or mortality rates in epidemic prevention and control.
We have proposed a method that combines ABM and DQN to combine individual intelligence with deep learning and provide more accurate and dynamic decision support for epidemic prevention and control. Within this model, the pandemic simulator refines the environmental and individual state information to DQN, which trains intelligent decision networks to select optimal control strategies. This fusion allows a deeper understanding of the impact of individual behaviors and environmental factors on epidemic spread and control, facilitating the formulation of more effective prevention and control strategies. This decision-support model aids health departments, governments, and policymakers in formulating scientific and viable epidemic prevention and control measures, aiming to minimize the impact of pandemics to the fullest extent.
This article mainly contains the following contributions: (a) We construct an epidemic simulator to model the virus transmission process, simulate real human work activities, and illustrate the impact of government decisions on outcomes. (b) We integrate ABM with DQN, enabling decision making within complex simulation environments, learning, and optimizing through feedback mechanisms, thereby assisting governments in obtaining rational decision solutions. (c) We adopt a data-driven approach based on real-world data. To enhance the model’s effectiveness, we conducted simulations based on real data and enabled the simulation model to aid governmental decision-making processes.
The remaining sections of this paper are outlined as follows. In
Section 2, we present the current mainstream methods related to addressing pandemic issues.
Section 3 briefs the methods, and a detailed exposition of the epidemic simulator used in the experiments is presented in
Section 4.
Section 5 introduces the design ideas of the DQN model. The simulation results are discussed in
Section 6. Finally,
Section 7 concludes the paper by summarizing its key points.
2. Related Work
Since the massive outbreak of COVID-19, scientists have been dedicating themselves to studying the dynamic transmission process of the virus to find targeted methods to control the spread of the pandemic. The mainstream research methods adopt traditional mathematical models, such as SIR [
1,
2,
3] and susceptible-exposed-infectious-recovered (SEIR) models [
4,
5,
6,
7], to characterize the transmission process of the virus. Additionally, to consider more factors, researchers have added new states to improve the original models, such as quarantined (Q) [
8], asymptomatic (A), symptomatic (I), hospitalized (C) [
9].
Single mathematical models may not always be able to capture the complexity of dynamic processes. To address this, many researchers have employed hybrid modeling approaches by combining mathematical models with other types of models to enable more complex analyses: for instance, an integrated model for predicting the number of confirmed cases from the perspective of Bangladesh combines the SEIR epidemiological model and neural networks [
10]; based on the SEIR model, the improved SEIR models were established considering the incubation period, the isolated population, and the genetic algorithm (GA) parameter optimization method [
11]; a hybrid model constructed by the SEIR model based on the traditional infectious disease dynamics and the differential autoregressive integrated moving average (ARIMA) model is proposed to make predictions and analyze the novel coronavirus pneumonia epidemic in different periods and locations [
12]; using SEIR and system dynamics as the base models in developing the designed model, making use of the causal loop diagram (CLD) to understand the factors which play a major role in the spread and containment of COVID-19 [
13].
Similarly, a portion of researchers have employed the ABM approach to simulate the spread of the virus. ABM models can incorporate factors such as heterogeneous populations, mobility patterns, and social networks, to provide a more realistic and detailed representation of the disease transmission dynamics: for example, a framework to evaluate the effects of the pandemic by combining agent-based simulations—based on the SIR model—with a hybrid neural network [
14]. ABMs can also help to identify the best policy interventions by simulating different scenarios and predicting their outcomes. For example, ABMs can be used to evaluate the effects of school closures, lockdowns, mask mandates, and vaccination campaigns on the spread of the virus. They can also help to optimize resource allocation, such as identifying the most effective testing and contact tracing strategies. Some researchers use agent-based models for estimating demand for hospital beds during the COVID-19 pandemic [
15] and assessing the transmission dynamics and health systems burden for COVID-19 [
16].
During the COVID-19 pandemic, governments around the world have had to make thoughtful decisions to address challenges such as protecting public health, maintaining economic operations, and mitigating the spread of the virus. Researchers have primarily utilized reinforcement learning methods to address these decision-making challenges. Padmanabhan et al. utilized a reinforcement learning framework to mitigate the impact of widespread viral transmission [
17]. Khalilpourazari et al. applied Q-learning to predict the pandemic’s progression [
18]. Furthermore, several studies have adopted DQN and its variants to explore optimal strategies during the pandemic [
19,
20,
21].
3. Preliminaries
3.1. Agent-Based Model
ABM is a computational modeling technique that describes complex systems as collections of autonomous agents interacting with each other and with their environment. Each agent has its own set of rules, behaviors, and decision-making processes that govern their actions, and the interactions between agents and their environment produce emergent phenomena and patterns at a system level.
ABM has been used in various fields, including social sciences, economics, biology, ecology, and computer science. The development of ABM can be traced back to the 1940s with the work of von Neumann and Morgenstern on game theory and the development of cellular automata by Ulam and von Neumann. The first ABM was developed in the 1960s by Thomas Schelling, who used it to study racial segregation.
ABMs have been widely used in simulating the spread of COVID-19 and analyzing the effectiveness of government policies. ABMs can simulate the complex interactions between individuals, such as social contact patterns, adherence to preventive behaviors, and movement patterns. By incorporating real-world data and assumptions about individual behavior, ABMs can provide insights into the dynamics of the pandemic, including the spread of the virus, the impact of interventions, and the effectiveness of different policies. Some authors use it to evaluate the resource requirements during the peak of the pandemic [
22] or determine the required medical resources and vaccine supplies over time [
23].
Overall, ABMs have played a crucial role in understanding the spread of COVID-19 and analyzing the effectiveness of government policies. Their ability to capture the heterogeneity and complexity of individual behavior and interactions makes them a valuable tool for policymakers and researchers alike.
3.2. NetLogo
There are various methods for implementing ABM, allowing users to choose appropriate tools and techniques based on specific problems and preferences. In this context, we use the NetLogo simulation platform. NetLogo is a free and open-source platform designed for modeling and simulating complex systems, making it suitable for researching complex adaptive systems, collective behaviors, and distributed problems. NetLogo was developed by Dr. Uri Wilensky at Cornell University and first released in 1999. It offers an intuitive interface and a graphics-based programming language, enabling users to easily create and simulate a wide range of complex systems, including ecological, social, and economic systems. The simulation environment of NetLogo consists of both an interface and code. The interface provides a user-friendly graphical representation to display the model’s state and results, allowing users to interact with the model. The code is the critical component where users define the model’s behavior by specifying the rules, interactions, and simulation processes for the agents within the model. To date, numerous scientific studies have employed NetLogo to conduct simulation analyses of complex systems in natural, social, and engineering domains [
24,
25].
3.3. Q-Learning
Reinforcement Learning (RL) is a type of machine learning where an agent interacts with an environment to learn how to make decisions that maximize a cumulative reward signal. RL is based on the idea of trial and error, where the agent learns by exploring different actions in the environment and receiving feedback in the form of rewards or penalties. The goal of RL is to develop an optimal policy, which is a mapping from states to actions that maximize the expected cumulative reward.
To formalize this problem, we can use the mathematical framework of Markov decision processes (MDPs). A MDP is defined by a tuple (S, A, P, R, ), where S is a set of states, A is a set of actions, P is the transition probability function, R is the reward function, and is the discount factor. The transition probability function gives the probability of transitioning to state given that the agent takes action and in-state s. The reward function gives the reward received by the agent for transitioning from state s to state after taking action a. The discount factor determines the relative importance of immediate versus future rewards.
Q-learning is a popular RL algorithm for finding an optimal policy in a MDP. Q-learning learns a value function, which estimates the expected cumulative reward of taking an action in a given state and following the optimal policy thereafter. The value function is defined as follows:
where
s is the current state,
a is the action taken,
is the reward received at the next time step,
is a discount factor that determines the importance of future rewards,
is the next state, and
is the next action.
The Q-learning algorithm updates the value function using the following update rule:
where
is the learning rate that determines the weight given to new experiences compared to past experiences.
3.4. Deep Q-Network
DQN is an extension of Q-learning that uses a neural network to approximate the value function. DQN addresses the problem of high-dimensional state spaces by using a deep neural network to approximate the Q-function.
The DQN algorithm updates the parameters of the neural network using stochastic gradient descent to minimize the following loss function:
where
represents the parameters of the network,
represents the target network parameters that are updated less frequently, and
is the mean squared error between the target Q-value and the predicted Q-value.
DQN also uses experience replay, where the agent stores experience in a replay buffer and samples mini-batches of experiences to train the network. This improves the efficiency of learning by breaking the correlation between consecutive updates and reducing the variance of the updates.
4. Pandemic Simulator
We have developed a pandemic simulator (PS) to model the spread of the virus. The simulator employs an agent-based model to simulate disease transmission under various lockdown strategies. It delineates communities and diverse scenarios by customizing interpersonal interactions when different governmental strategies are employed, enabling the observation of viral spread outcomes. The simulator’s primary objective is to integrate with the DQN algorithm to devise rational policies that maximize both economic and health well-being. This PS can be defined by a triad <E, A, I>, where E represents the environment, A signifies the agents, and I denotes the infection mechanism.
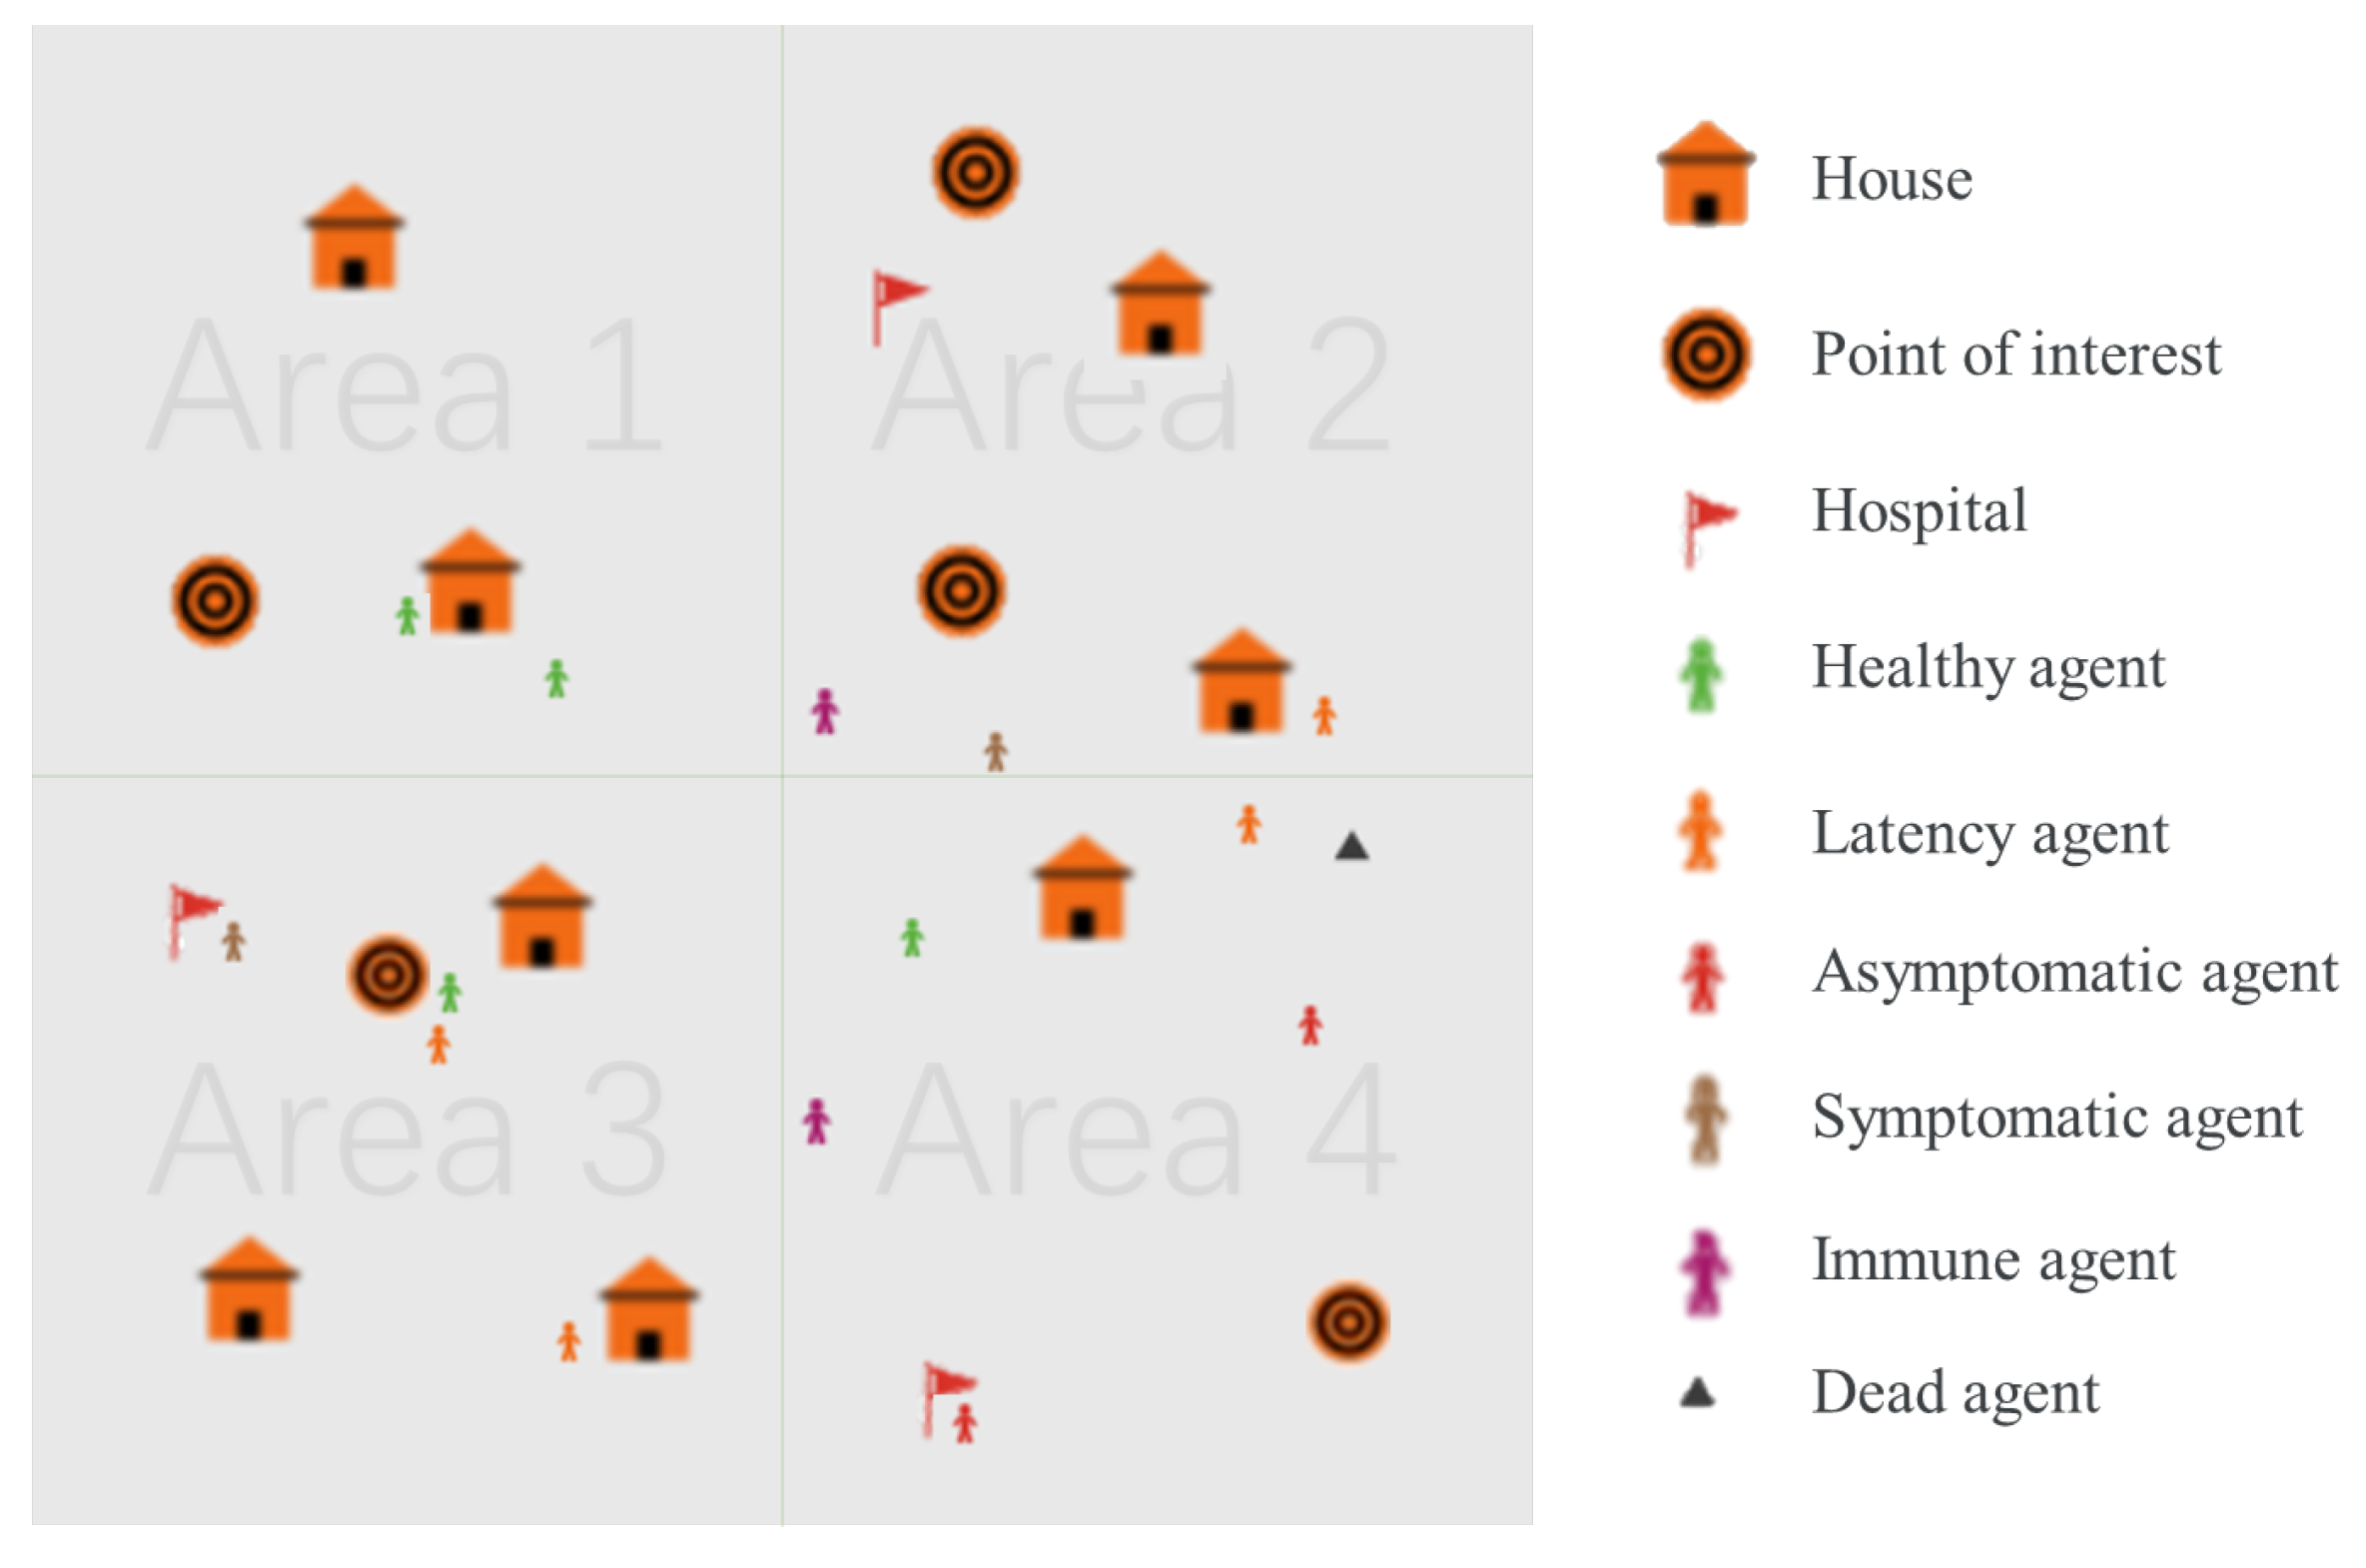
Figure 1 represents a schematic diagram of the pandemic simulator. Next, we will elaborate on the PS from these perspectives.
4.1. Environment
We use NetLogo to simulate the spread of viruses in the population. The environment used in the simulation is a standard NetLogo world, consisting of
patches. Each patch represents a discrete location in the simulated world, and agents move between patches to travel. To measure the passage of time in the simulation, each day is divided into 82 ticks. The parameter settings are shown in
Table 1:
Before the simulation begins, the world is in a default state. As shown in
Figure 1, the world is divided into four regions, each containing various elements such as houses, points of interest, and hospitals. Points of interest represent facilities such as workplaces, schools, and shopping centers. Each element is randomly assigned to a location within the world.
4.2. Agent
In the PS environment, the agent simulates the behavior of real humans. An agent can be defined by the two-tuple <Action, State>, where action defines the action mode of the agent and state represents the health status of the agent. The behavior of the agent includes travel (the agent can choose to stay home, go to points of interest such as workplaces, schools, and shopping centers, or go to hospitals), whether to wear a mask (wearing a mask can effectively reduce the risk of infection [
28]). The agents in the PS can exist in one of several states, including healthy, latent, asymptomatic, symptomatic, immune, and dead. The specific state transition process will be described in the infection mechanism section.
Once the simulation starts, a given number of agents is generated. Each agent mainly acts in a certain area and is randomly assigned to a house as their residence within the given area. Additionally, each agent is assigned a point of interest within the same region as their house as their primary destination when leaving home.
All agents follow the same travel process each day. From midnight until 8 a.m., the agents stay at home or at hospital. At 8 a.m., the agents decide whether to travel based on government policies or the personal health status with a given probability. If they choose to travel, they go to their point of interest or the hospital, depending on their health status. At 4 p.m., each agent decides whether to return home or stay at the hospital, depending on their health status, and remain there until 8 a.m. the next day.
Since the agents’ movements are limited when they are at home or work and more extensive when commuting, the probability of infection varies during different periods. To account for this, the simulation time is divided into unequal segments. Each day is divided into 82 ticks with each travel time lasting 30 ticks and each non-travel time lasting 1 tick per hour.
4.3. Infection Mechanism
As shown in
Figure 1, the agents in the simulation can exist in one of several states, including healthy, latent, asymptomatic, symptomatic, immune, and dead. The infection process can be seen from
Figure 2. In the figure, the meanings of different colored agents are shown in
Figure 1. At the start of the simulation, a given number of agents are infected, and the remaining agents are set to a healthy state. At each tick, the simulation checks whether each healthy agent has any infected agents within a certain radius. If there are any infected agents nearby, the healthy agent has a probability of becoming infected. If the healthy agent becomes infected, they enter a latent period during which they are not contagious. After the latent period ends, the agent can transition to either an asymptomatic or symptomatic state with symptomatic agents developing symptoms after the incubation period and becoming infectious at that point. Once the infectious period ends, the agent either dies or recovers and becomes immune with a given probability. However, being immune does not provide complete protection against future infections, and agents in this state still face a lower risk of infection.
To accurately simulate the transmission dynamics of the novel coronavirus, this research employs a data-driven methodology, leveraging empirical data derived from statistical investigations of COVID-19 for simulation purposes. The infection parameter settings are shown in
Table 2:
5. Decision-Making Based on DQN
5.1. Problem Statement
Mitigating the COVID-19 pandemic is a decision-making problem where governments determine policies based on the process of disease transmission. The simulation based on DQN is an agent-based epidemic simulator that can be used to analyze and improve mitigation policies for the economic and health impacts during pandemics. The purpose of developing this simulator is to train reinforcement learning algorithms by combining artificial intelligence with epidemiology to simulate disease transmission and improve pandemic mitigation policies.
In this model, our goal is to make rational decisions at each decision point within the given world and time to maximize the overall reward. The experiment is set for 50 days, taking into account the limited understanding of the virus in the early stages of the epidemic, making it difficult to make accurate judgments. By default, starting from the tenth day, a decision is made every five days. In real-life epidemic prevention and control, the spread of the virus is complex, and the effectiveness of the government’s containment policies is difficult to reflect in real time and accurately. Therefore, network learning is adopted to reflect the impact of policies. Through this approach, we can evaluate the effectiveness of different policies on the spread of the virus and make better decisions to control the pandemic.
5.2. Policy of Government Agent
The government agent will periodically select an appropriate strategy to mitigate the outbreak based on available data. The agents’ behavior is governed by the set of restrictions imposed by the various lockdown levels. The specific restrictions include the following:
Wearing masks (W). The primary route of transmission of COVID-19 is through the respiratory tract. There is substantial evidence that wearing a mask in laboratory and clinical settings reduces the transmission of infected respiratory particles, thereby reducing the transmission rate per exposure [
28]. Therefore, during outbreaks, governments actively urge the public to wear masks. The acceptance of masks varies depending on the culture and lifestyle habits of different countries. The value range of W is 0 to 1, where 0 means there is no policy for wearing a mask, people are also not required to wear masks, and 1 means all people wear masks when they go outside as required.
Staying at home (S). People are required to isolate themselves at home to avoid the spread of the outbreak. For example, in the UK, home guidelines were issued in March 2020 to reduce the spread of the outbreak [
37]. S is defined as a value between 0 and 1, where 0 can be considered as people are not restricted from going out, and 1 can be considered situations where any travel is forbidden and people have to be isolated at home.
Gathering limits (G). In public areas, it is forbidden to gather more than a certain number of people. For example, the UK has issued guidelines requiring people in medium local alert level areas not to socialize in groups of more than six [
38]. The value range of G is not limited. The value of infinity means no upper limit on the number of people, and 0 means crowd gathering is strictly prohibited.
Area lockdown (A). Area blockade refers to some of the points of interest that were asked to close and prohibited from admitting crowds to prevent the spread of the outbreak. A takes the values of 0 or 1: 0 means that no lockdown in the area, allowing people to move freely within points of interest, and 1 means that points of interest are blocked and people are asked to stay home.
Isolation if Infected (I). The value range of I is 0 or 1, where 0 can be considered as no travel restrictions for infected people, and 1 can be considered as requiring isolation after infection.
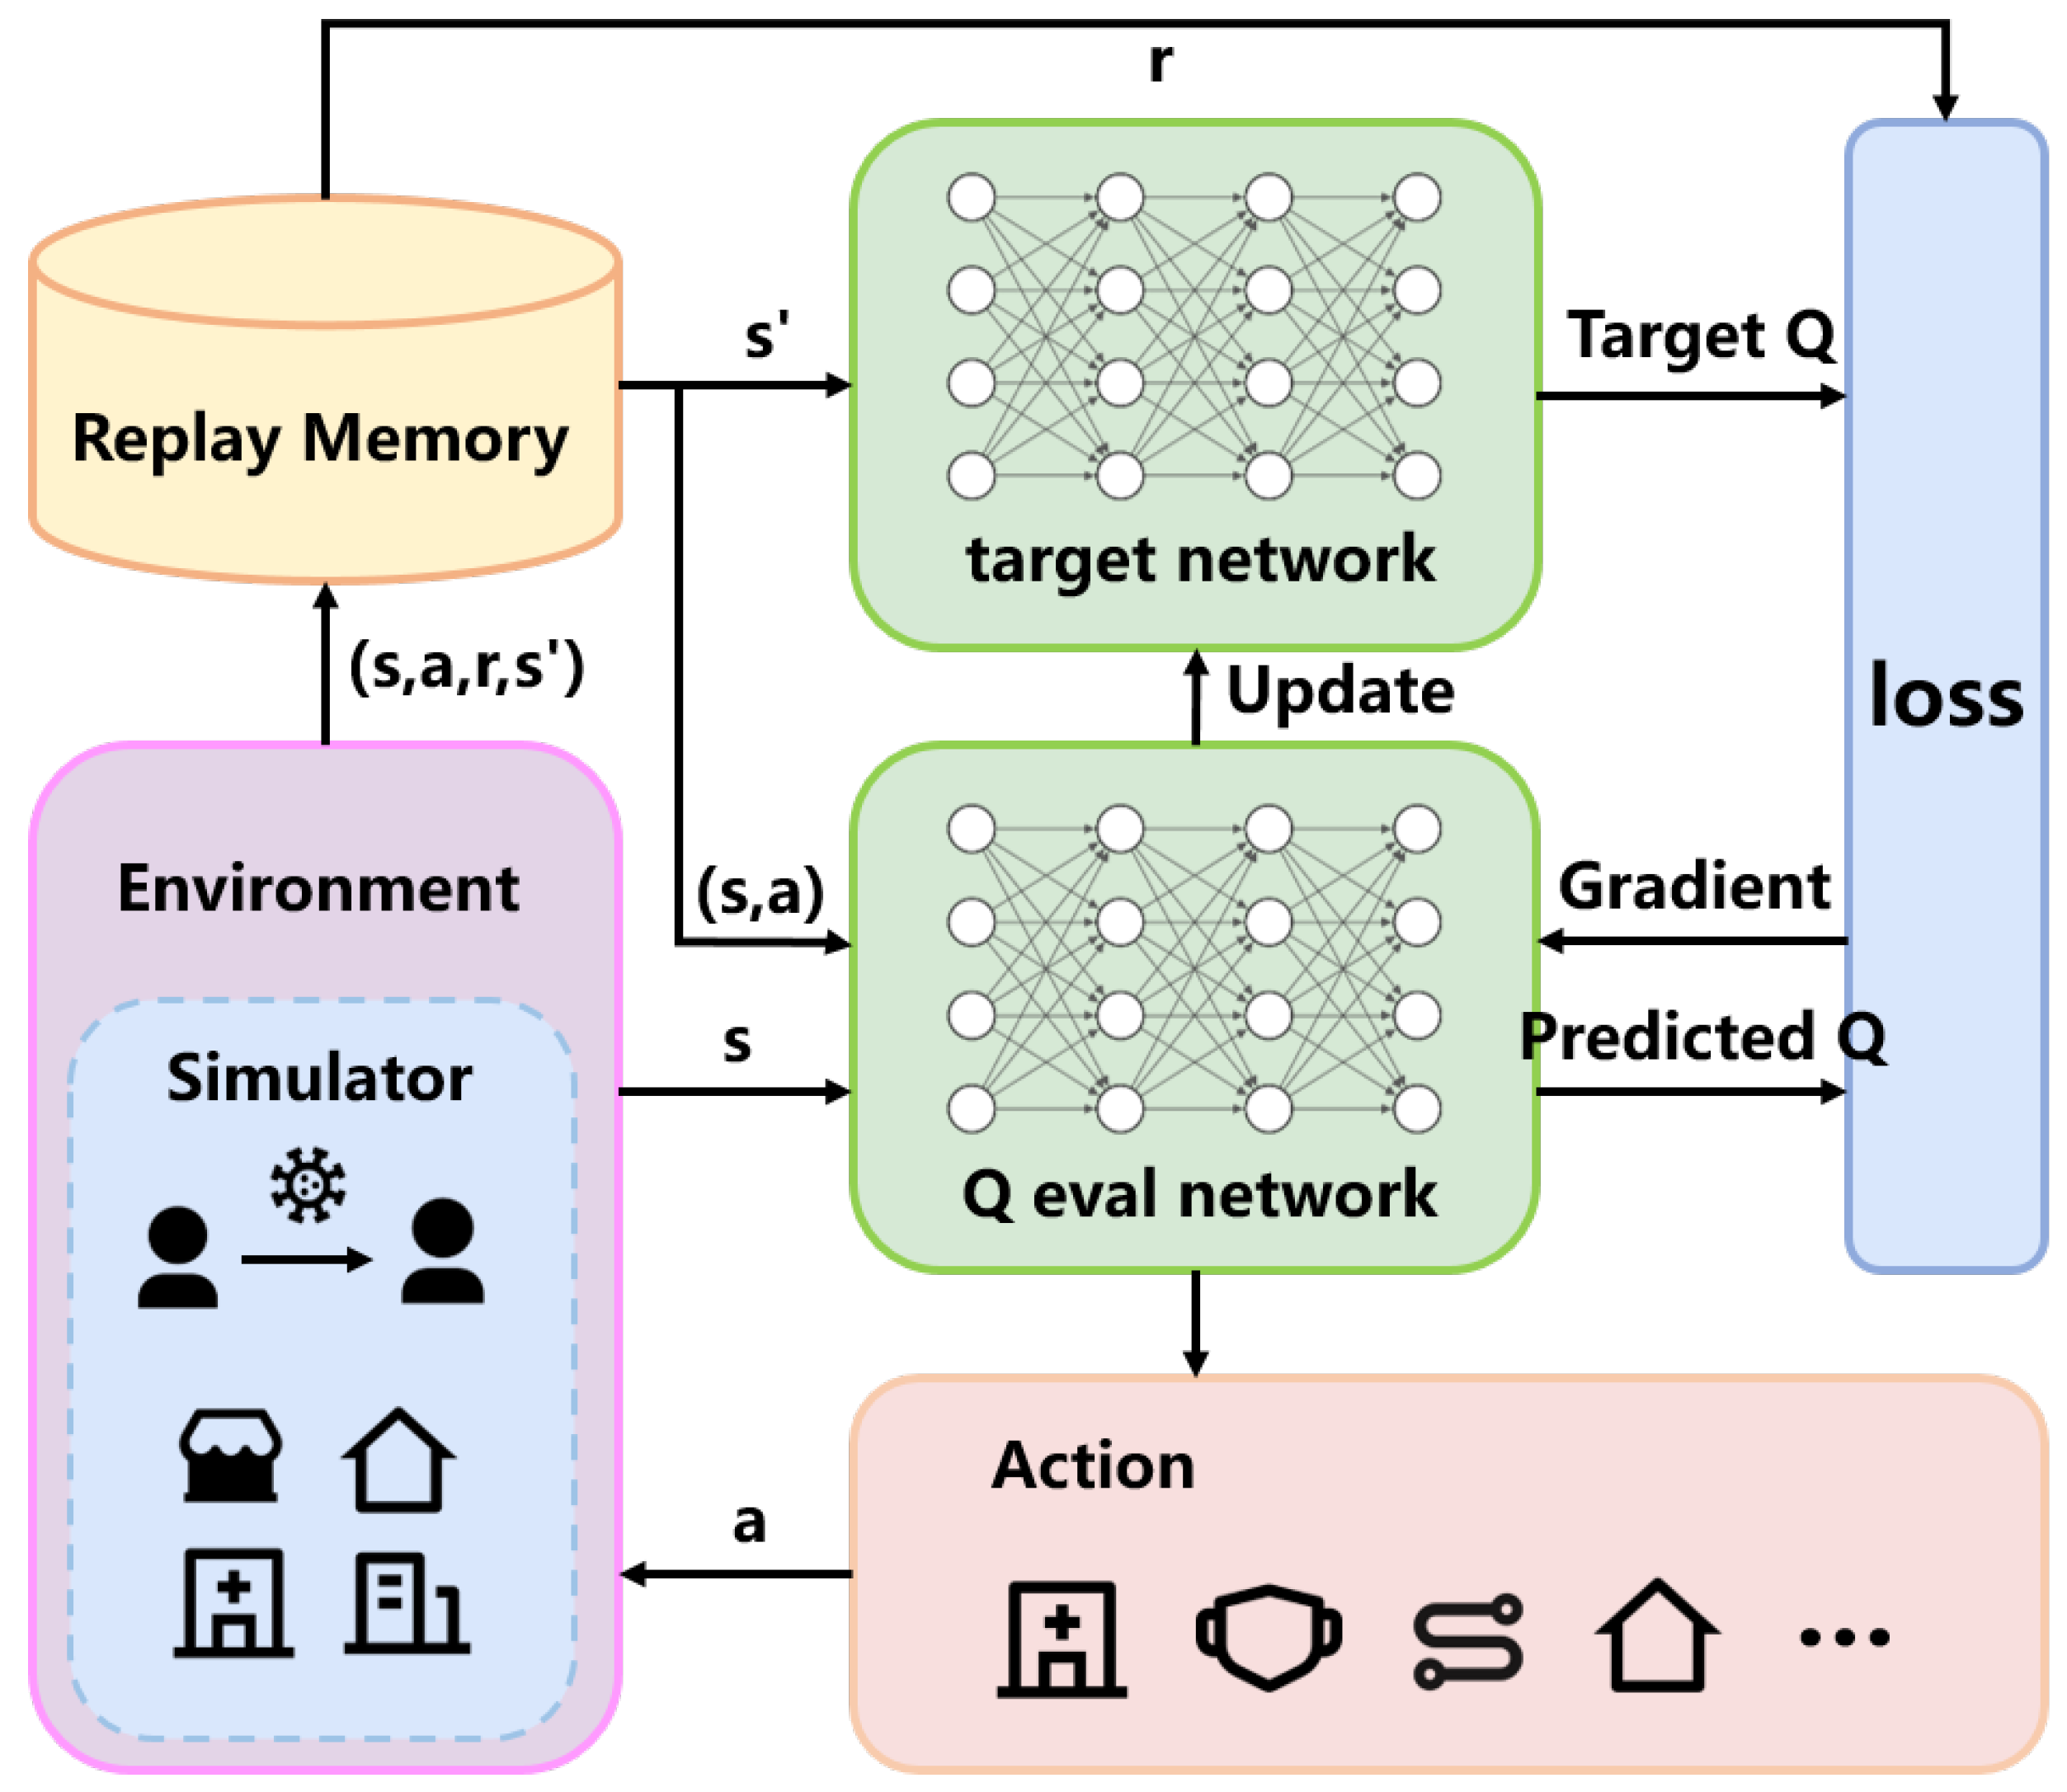
5.3. Model Process
The specific model process is shown in
Figure 3.
In DQN, the components include the training network, the target network, experience replay, and the environment, where the epidemic simulator represents the environment. The agent interacts with the environment through a series of actions, observations, and rewards. At each time step, the agent simulates the environment based on its current state and action, receiving the current step’s reward and the next state.
DQN maintains a replay buffer that stores the tuple of data (state, action, reward, next state) sampled from the environment at each step. During training, the Q-network is updated by randomly sampling batches of data from the replay buffer. The training network is updated by calculating the loss function between the training network and the target network, using gradient descent as indicated in Equation (3). The target network’s parameters are synchronized with the training network periodically to avoid instability caused by having identical parameters in both networks.
Finally, based on the state provided by the simulator and the trained network, the action with the highest estimated policy value is selected as the next action, proceeding to the next time step.
5.4. Environment Settings
5.4.1. State Space
We represent the model’s state using a five-tuple <healthy people rate, latent people rate, asymptomatic people rate, symptomatic people rate, death people rate>. This choice is informed by our focus on maximizing overall economic gains, which are closely tied to the distribution of different health statuses. Healthy individuals contribute stable and consistent income to the government, while those in the latent or infected stages are advised to work from home to avoid further spread, leading to reduced economic productivity. By incorporating this state representation, we can effectively capture the economic impacts of different health conditions in our decision-making process.
5.4.2. Action Space
In our research, we found that different regions have corresponding epidemic prevention policies, which can generally be classified into different levels based on the severity of the lockdown measures. By combining real-world epidemic prevention policies with the government policies provided in the model, we can define various levels of lockdown as bundles of all kinds of strategies in the model.
For example, in the early stages of the epidemic or when there is insufficient understanding of the virus, the government may choose to only appeal to the public to wear masks, and some people may choose to stay at home to reduce the risk of infection. Wearing masks can effectively reduce the probability of infection, which is reflected in the simulation program as a decrease in the probability of infection when people have close contact with each other. When the epidemic becomes more severe, the government may implement stricter measures, requiring people to wear masks and urging them to stay at home as much as possible instead of going out. This is reflected in the simulation program as an increase in the probability that people will not go out, and if they do go out, they will wear masks. In the most severe stage of the epidemic, the government may enforce strict epidemic prevention policies, requiring people only to go out if necessary, allowing only a small amount of daily outdoor activity, and implementing lockdown measures in severely affected areas, limiting gatherings, and closing non-essential venues to control the spread of the virus.
In the model, we divided these policies into six different levels, with level 0 representing the lowest level of lockdown and level 5 representing the highest level of lockdown, as shown in
Table 3. Among them, W, S, G, A, and I, respectively, represent wearing masks, staying at home, circulation limits, gathering limits, and area lockdown in the policies mentioned above.
5.4.3. Reward Design
The reward function is a crucial component of Q-learning, as it determines the agent’s behavior by assigning a value to each state–action pair. The reward function reflects the goal of the reinforcement learning problem, and therefore, its design should align with the desired behavior of the agent.
In the early stages of the COVID-19 outbreak, governments lacked knowledge of the virus’s characteristics. Consequently, most governments adopted conservative observation measures to protect their economies from significant losses caused by lockdowns. However, as the number of COVID-19 cases and deaths increased rapidly, governments had to implement lockdown measures to prevent greater disasters. Policymakers faced the challenge of balancing the impact of factors such as the economy and public health.
To comprehensively consider economic, health, and psychological factors, we designed a multi-objective reward function. This function can comprehensively consider the impact of various factors on policy selection and reflect the degree of importance that policymakers attach to different factors by adjusting the weights. Policymakers can achieve a balance between economic and health factors by adjusting different parameters, thus achieving the goal of maintaining sound economic development while protecting the physical and mental health of the public.
For economic factor, in our simulation experiments, only agent individuals are included, which do not reflect the actual economic processes in the community. Therefore, we quantify the impact of the economy on policy making by measuring the contribution of each individual to the economy. We assume that a healthy individual in normal working conditions has a contribution value of 1 to the economy per day. When the government adopts certain measures such as working from home, the individual’s contribution to the economy will be substantially affected. Similarly, when an individual is in an unhealthy state, their ability to contribute to the economy is limited and varies with their physical condition. Therefore, we comprehensively consider their working and health status to quantify their potential economic contribution. The expression for economic contribution is
where
i represents the
i-th agent,
denotes the location of agent
i,
denotes the life status of agent
i, and
n denotes the number of agents. The value of
and
is shown in
Table 4; here, “POI” represents points of interest, referring to places other than home and hospital where agents might appear.
Similar to the economic factor, for the health factor, we assume that an individual in a healthy state has a contribution value of 1 per day. As the health status of an individual worsens, their contribution value decreases accordingly. For individuals who receive timely medical treatment, their symptoms will be alleviated; meanwhile, the duration of infection and the mortality rate will decrease correspondingly. As a result, their contribution value will increase. The specific expression for health contribution is as follows:
here,
denotes the healthy parameter of agent
i, the value of
is shown in
Table 4, “other” refers to health states other than asymptomatic, symptomatic, and death, and it is assigned a value of 1 in these cases.
In regard to the psychological factor, it is important to consider that individuals tend to prefer freedom of movement and work. According to an Indian online survey, more than two-fifths of the people are experiencing common mental disorders due to lockdown and the prevailing COVID-19 pandemic. While lockdown can be a significant and effective strategy of social distancing to tackle the increasing spread of the highly infectious COVID-19 virus, at the same time, it can have some degree of psychological impact on the public [
39]. Additionally, the more severe the level of lockdown measures, the stronger the resistance and negative psychological effects on individuals. Therefore, to reflect the psychological state of the public, we convert the level of lockdown measures into the psychological factor, which is expressed as follows:
where
l represents the lockdown level, and
denotes the number of the lockdown levels.
Using the formulation of
,
, and
above, our objective is to maximize the following multi-objective function:
here, the superscript
t indicates the contribution value on day
t, and the parameters
are used to adjust the weight, where
, and
,
, and
are within the range [0, 1].
5.4.4. Training Parameters
In DQN, the parameter settings are crucial for the algorithm’s performance. Different parameter configurations can significantly impact the algorithm’s stability, convergence speed, and final performance. The settings for some of the training parameters in our experiments are as follows:
Learning Rate: The learning rate controls the step size for each parameter update. In our experiments, the learning rate is set to 0.001.
Discount Factor: The discount factor () measures the relative importance of current and future rewards. A higher discount factor means the agent places more emphasis on future rewards. In our experiments, the discount factor is set to 0.9, with ranging [0, 1].
Target Network Update Frequency: In DQN, two neural networks are used: the evaluation network and the target network. The frequency of updating the target network’s parameters is crucial for learning stability. In our experiments, the evaluation network’s parameters are copied to the target network every 100 steps.
-greedy Exploration Rate:The -greedy strategy balances exploration and exploitation during training. The experiment set the initial exploration rate to 1.0 and lowered the exploration rate every 50 generations.


